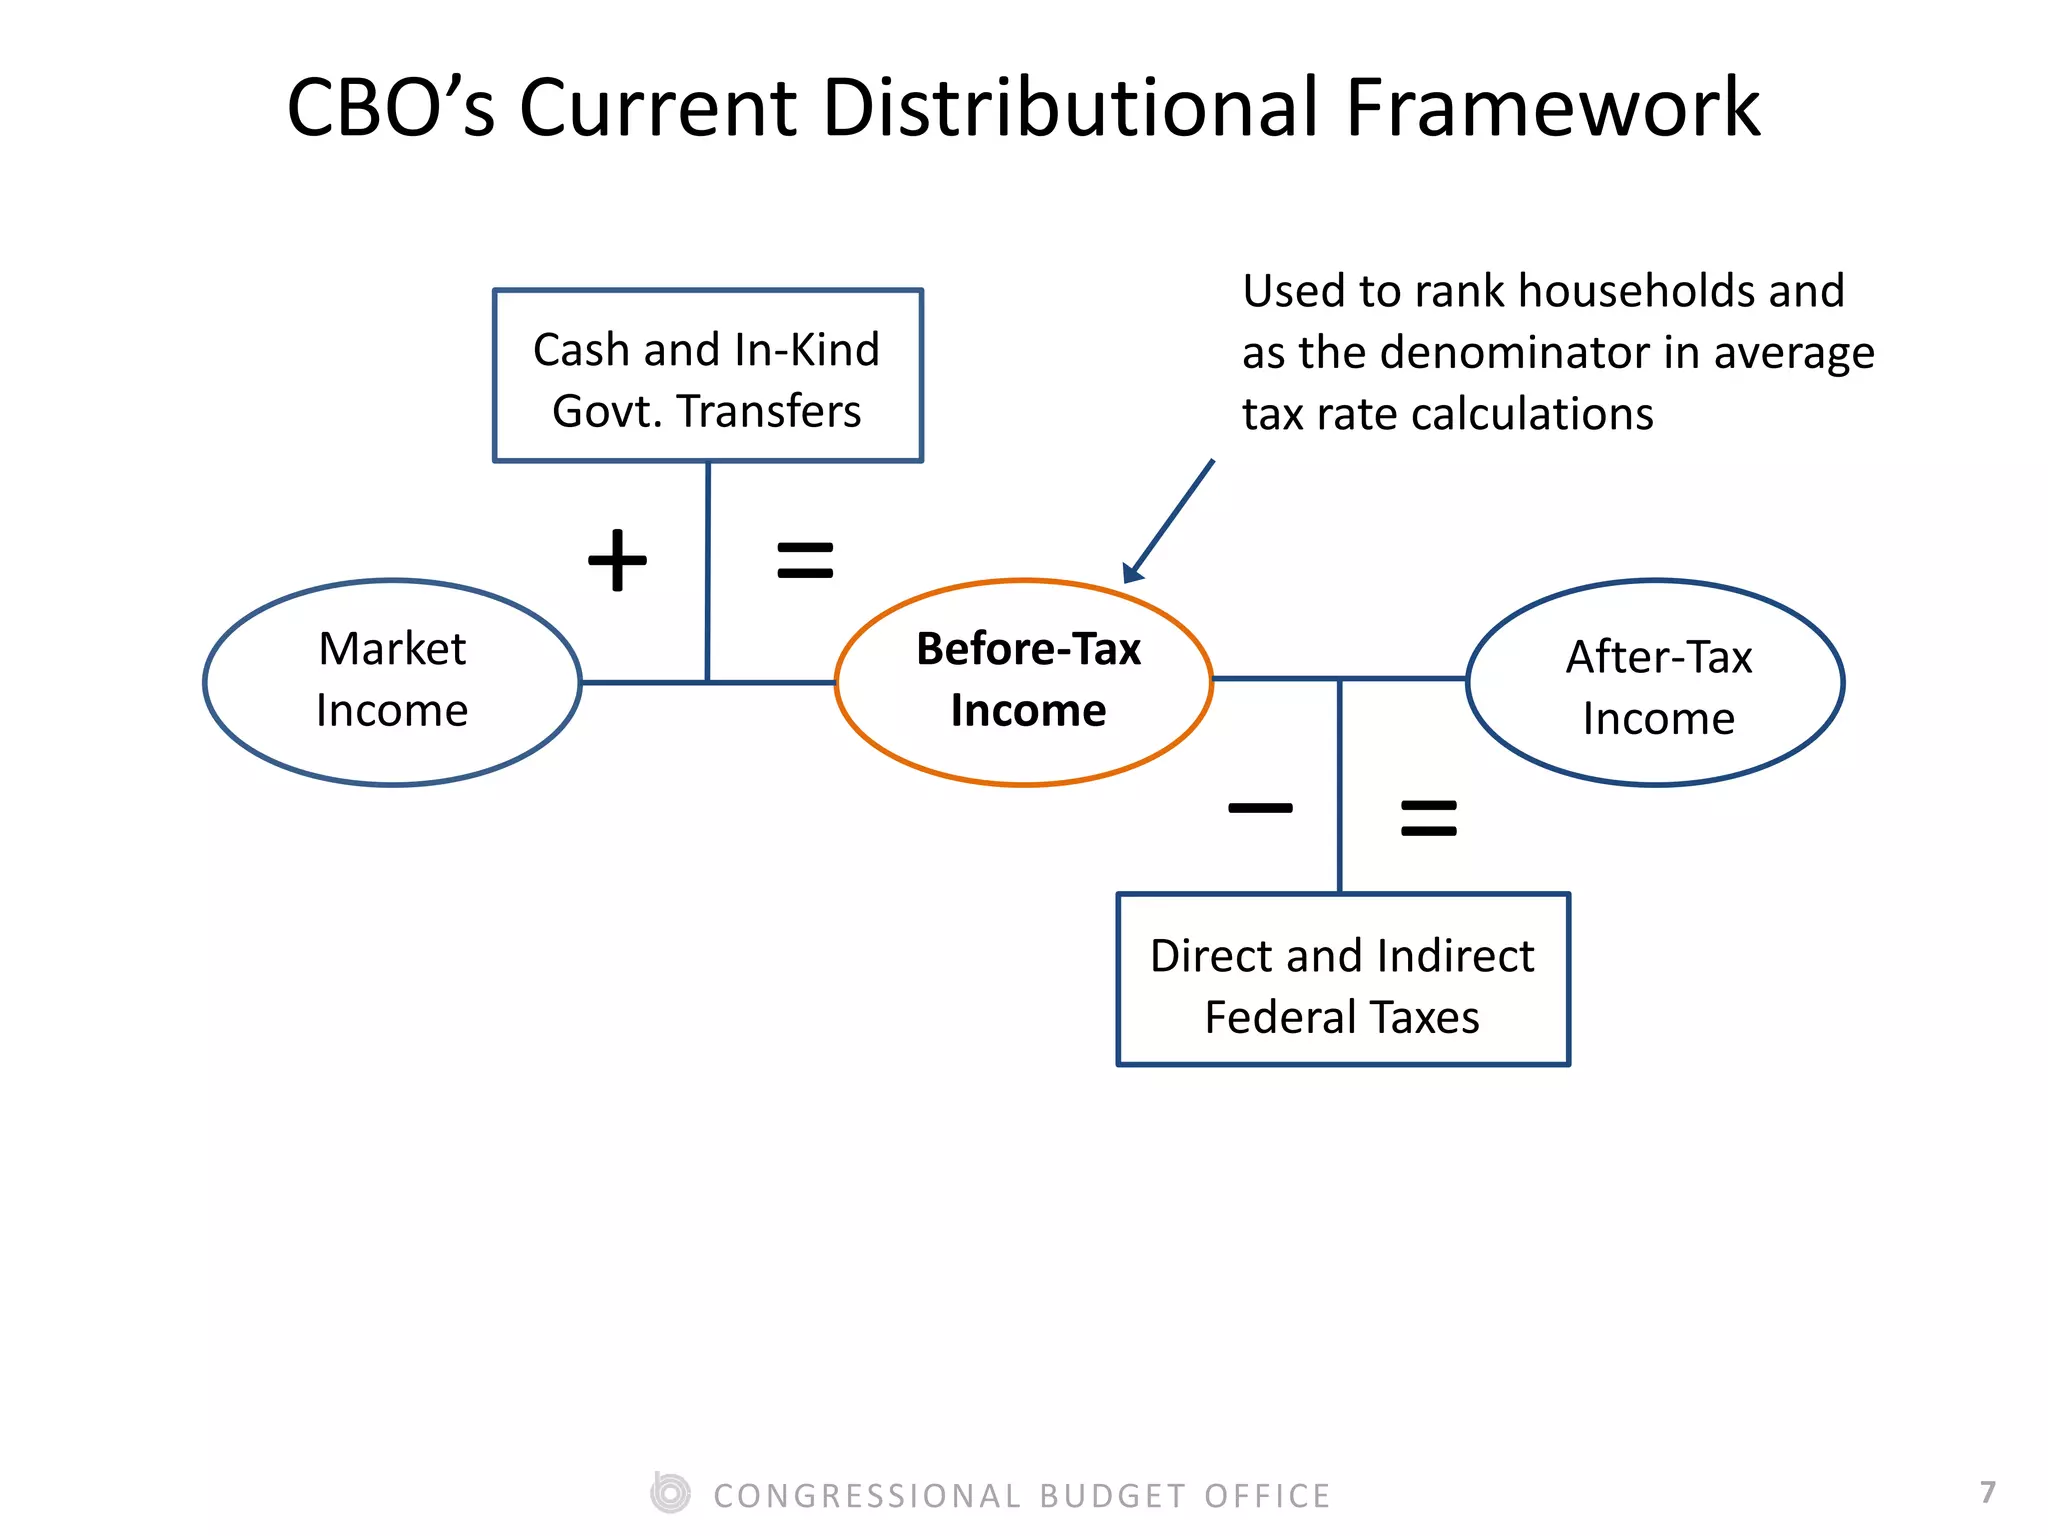
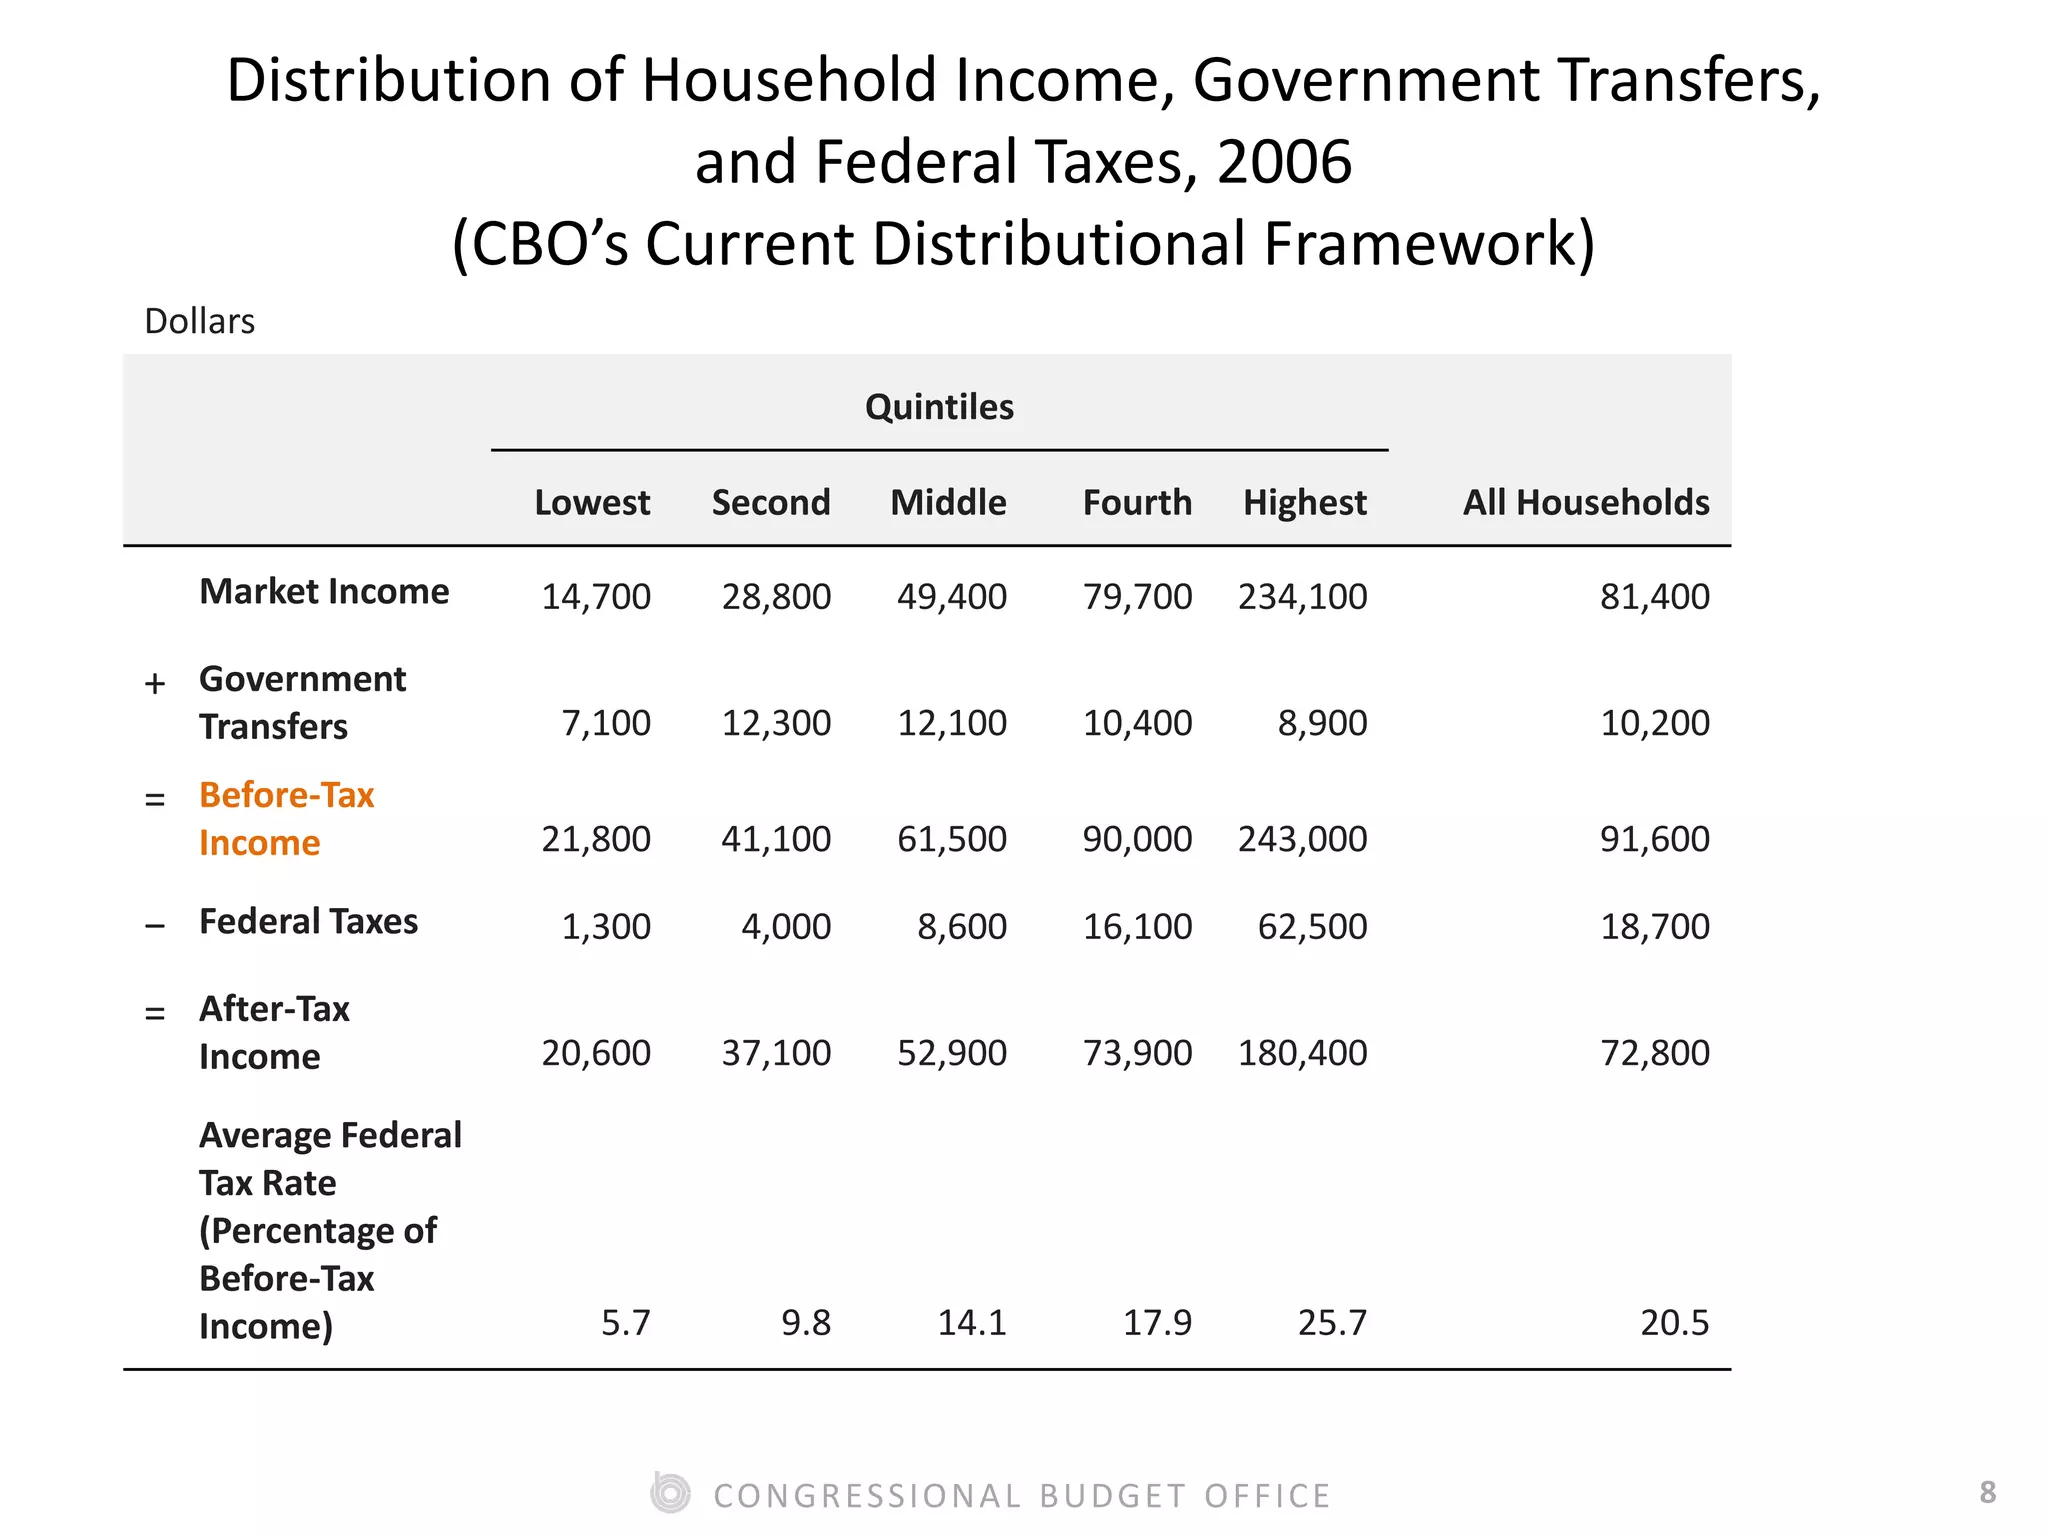
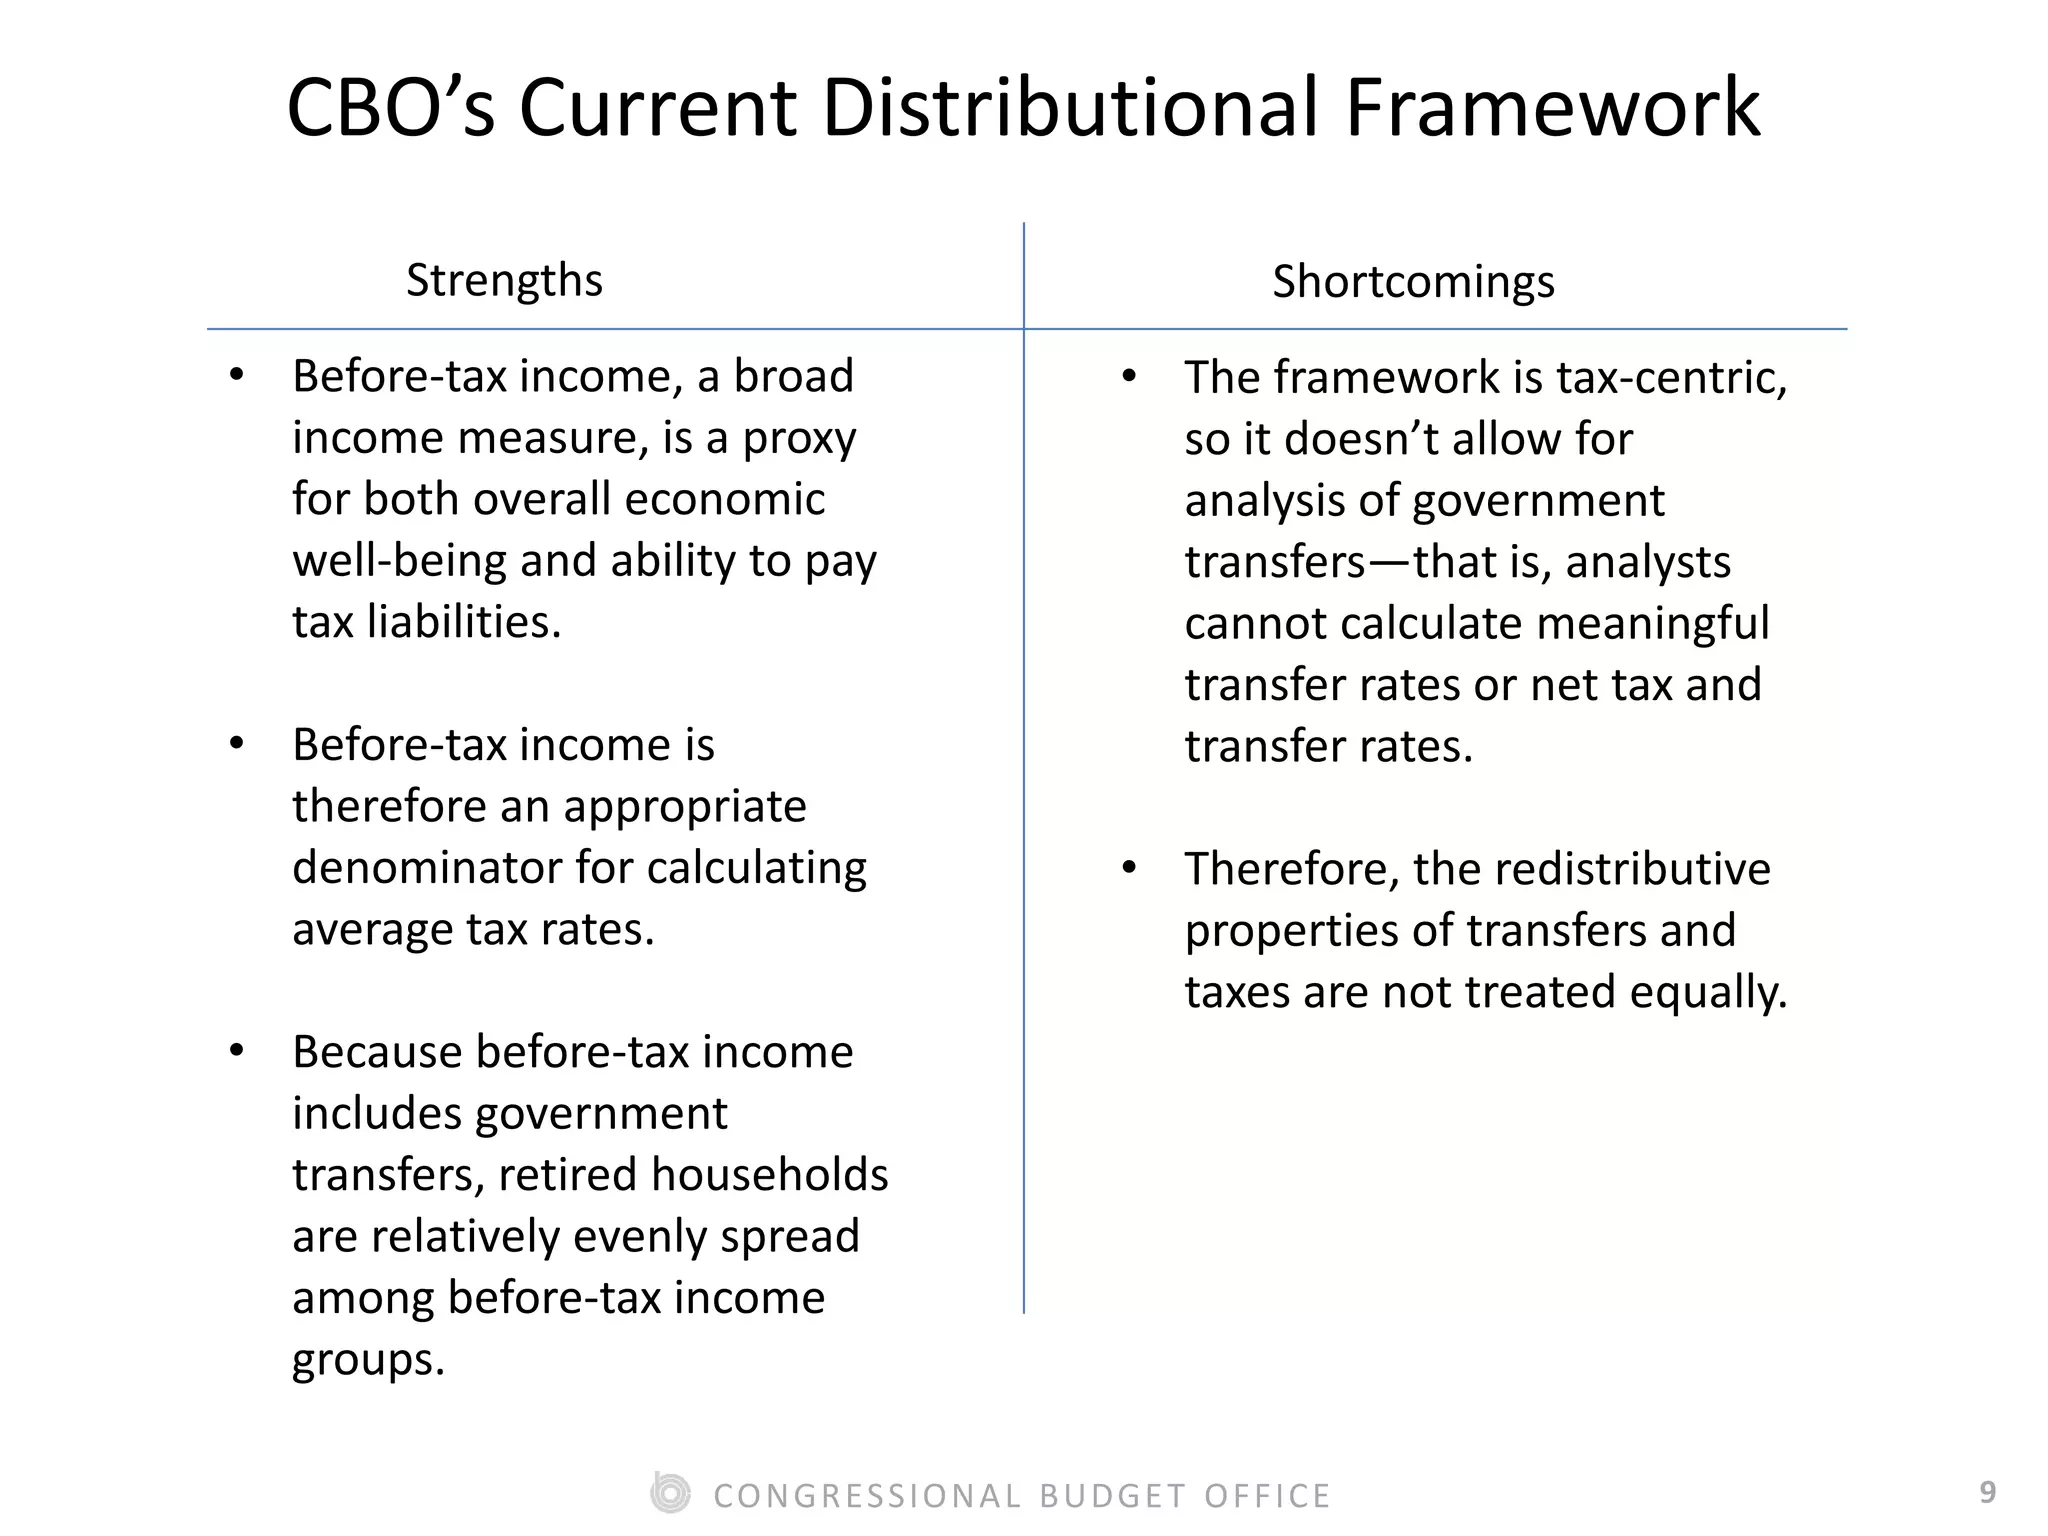
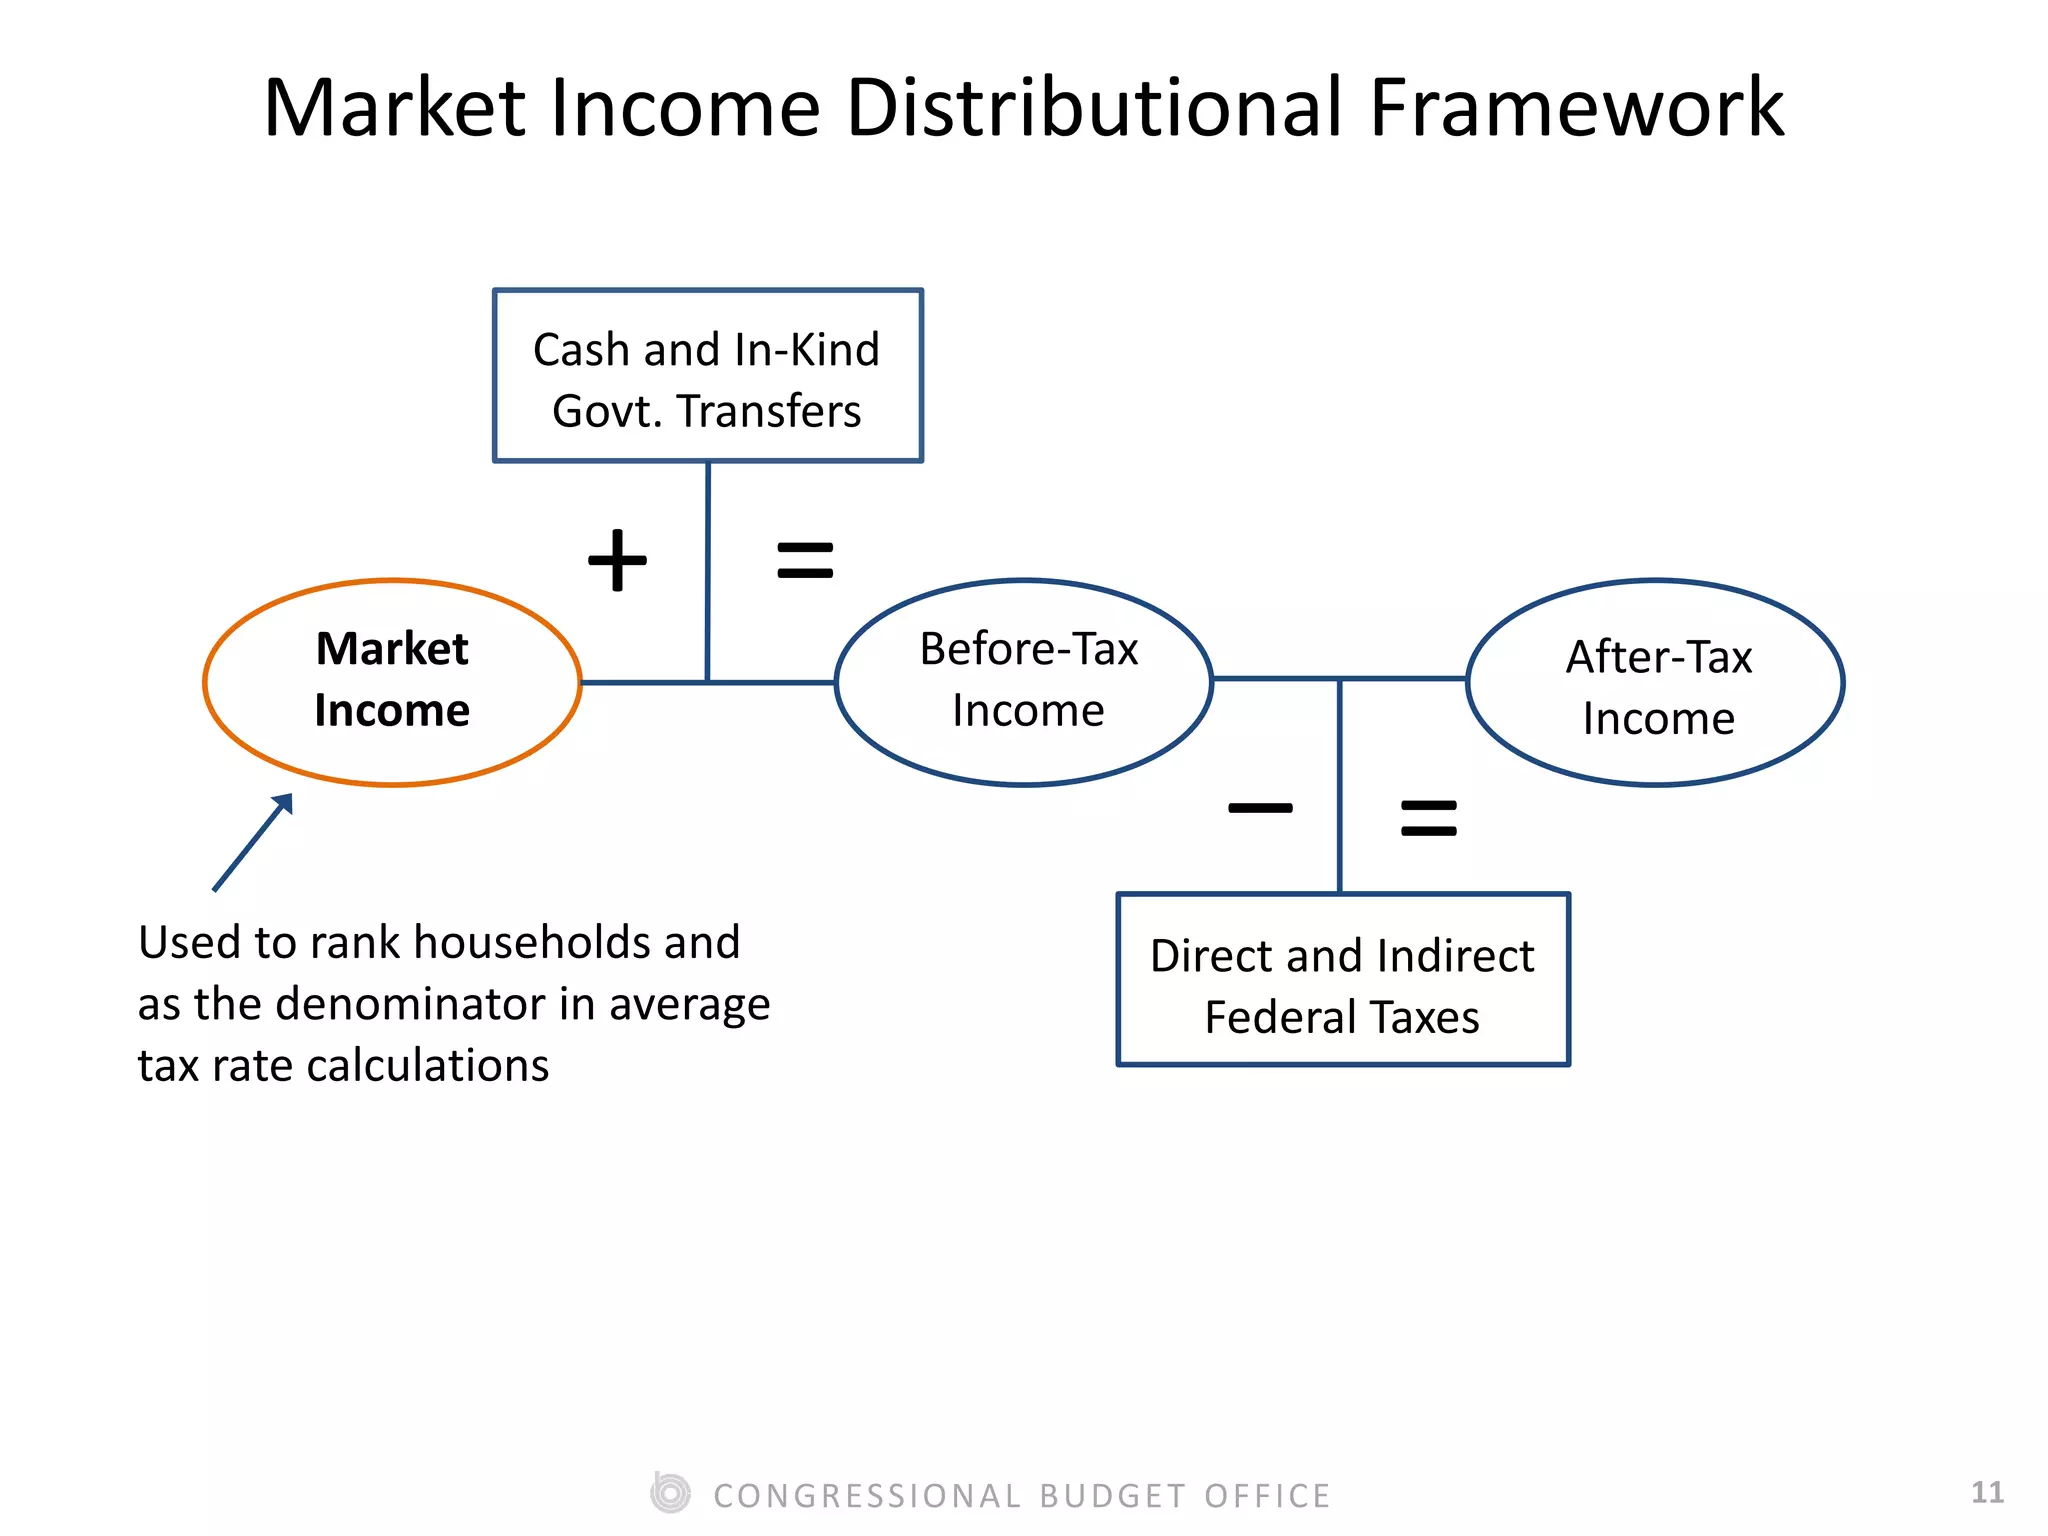
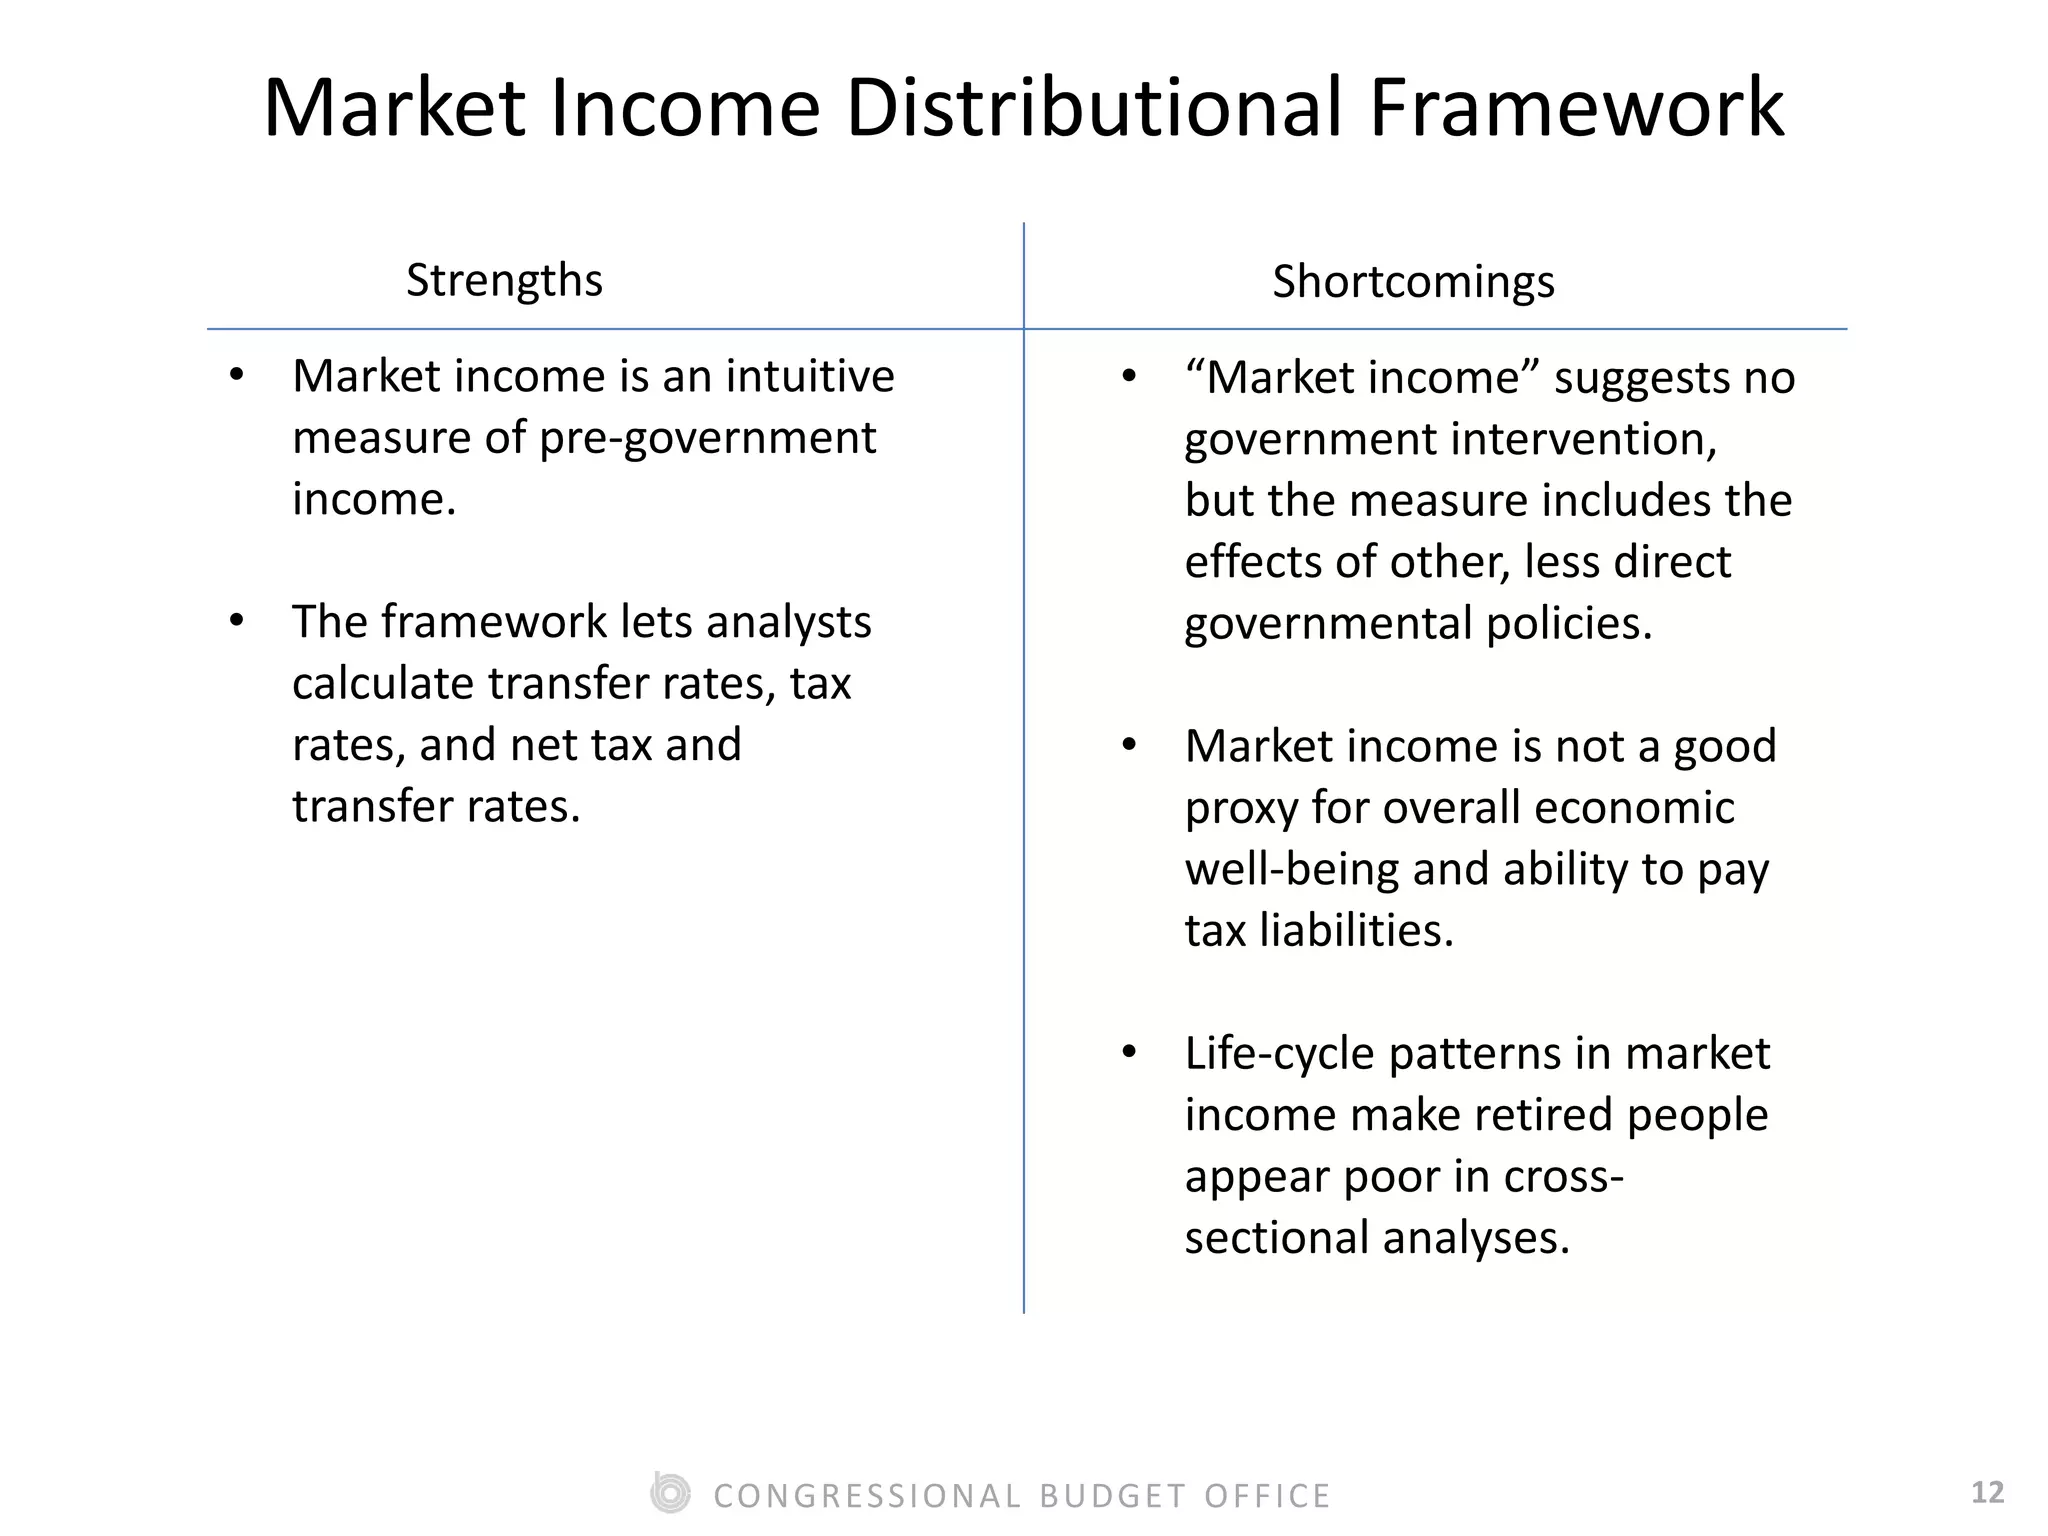
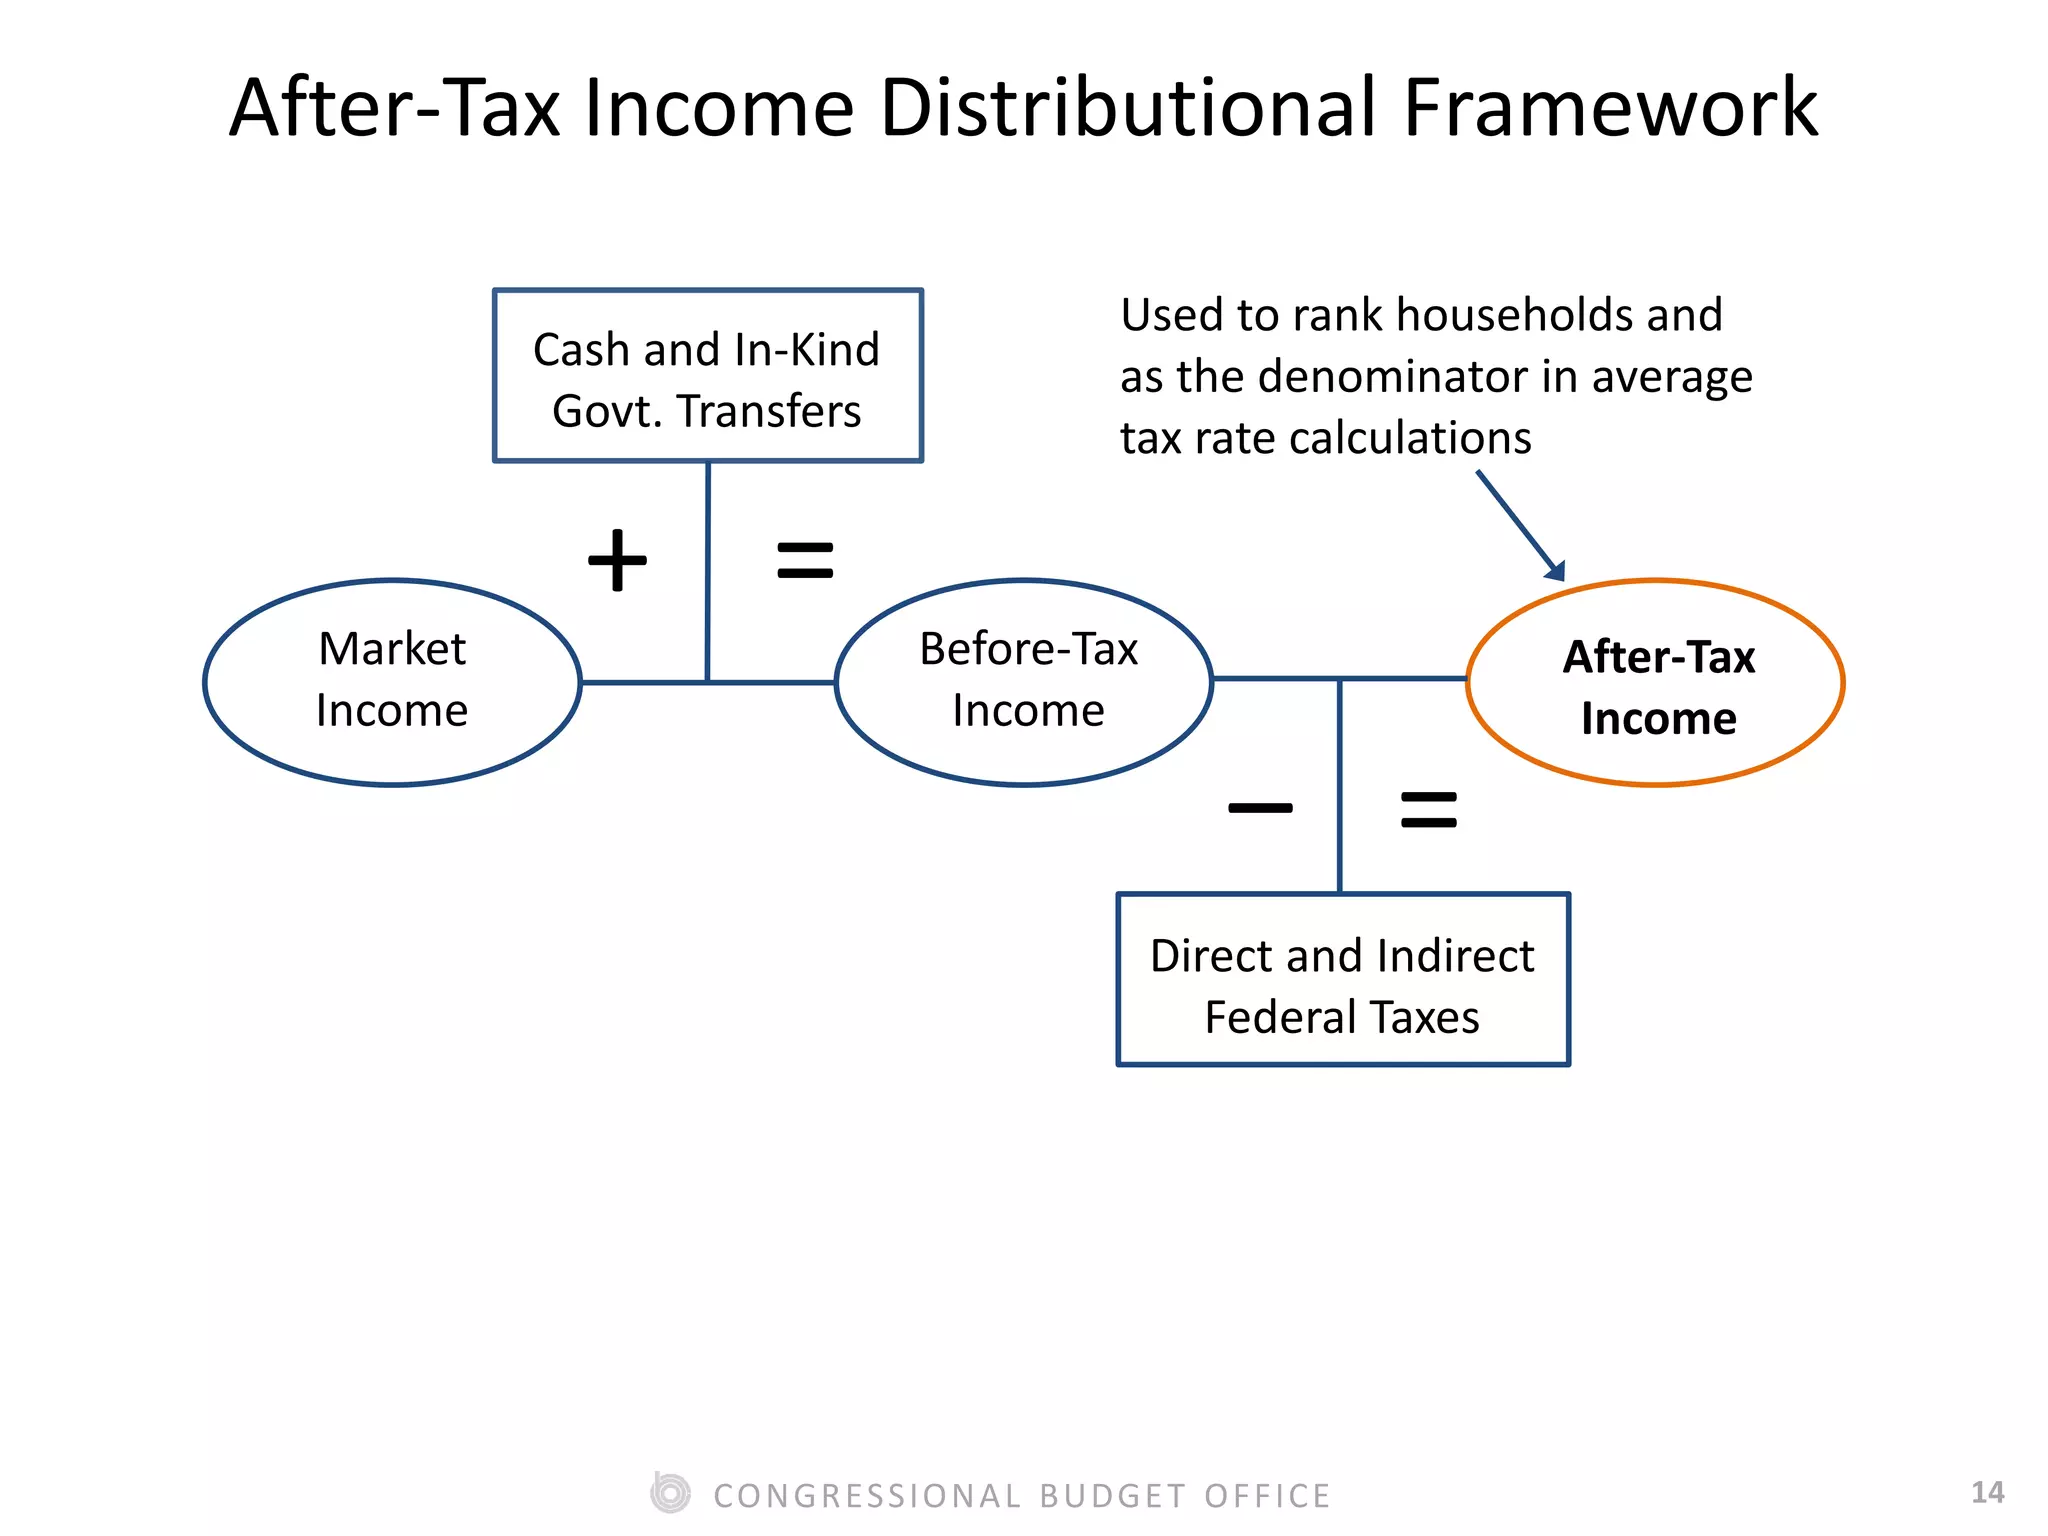
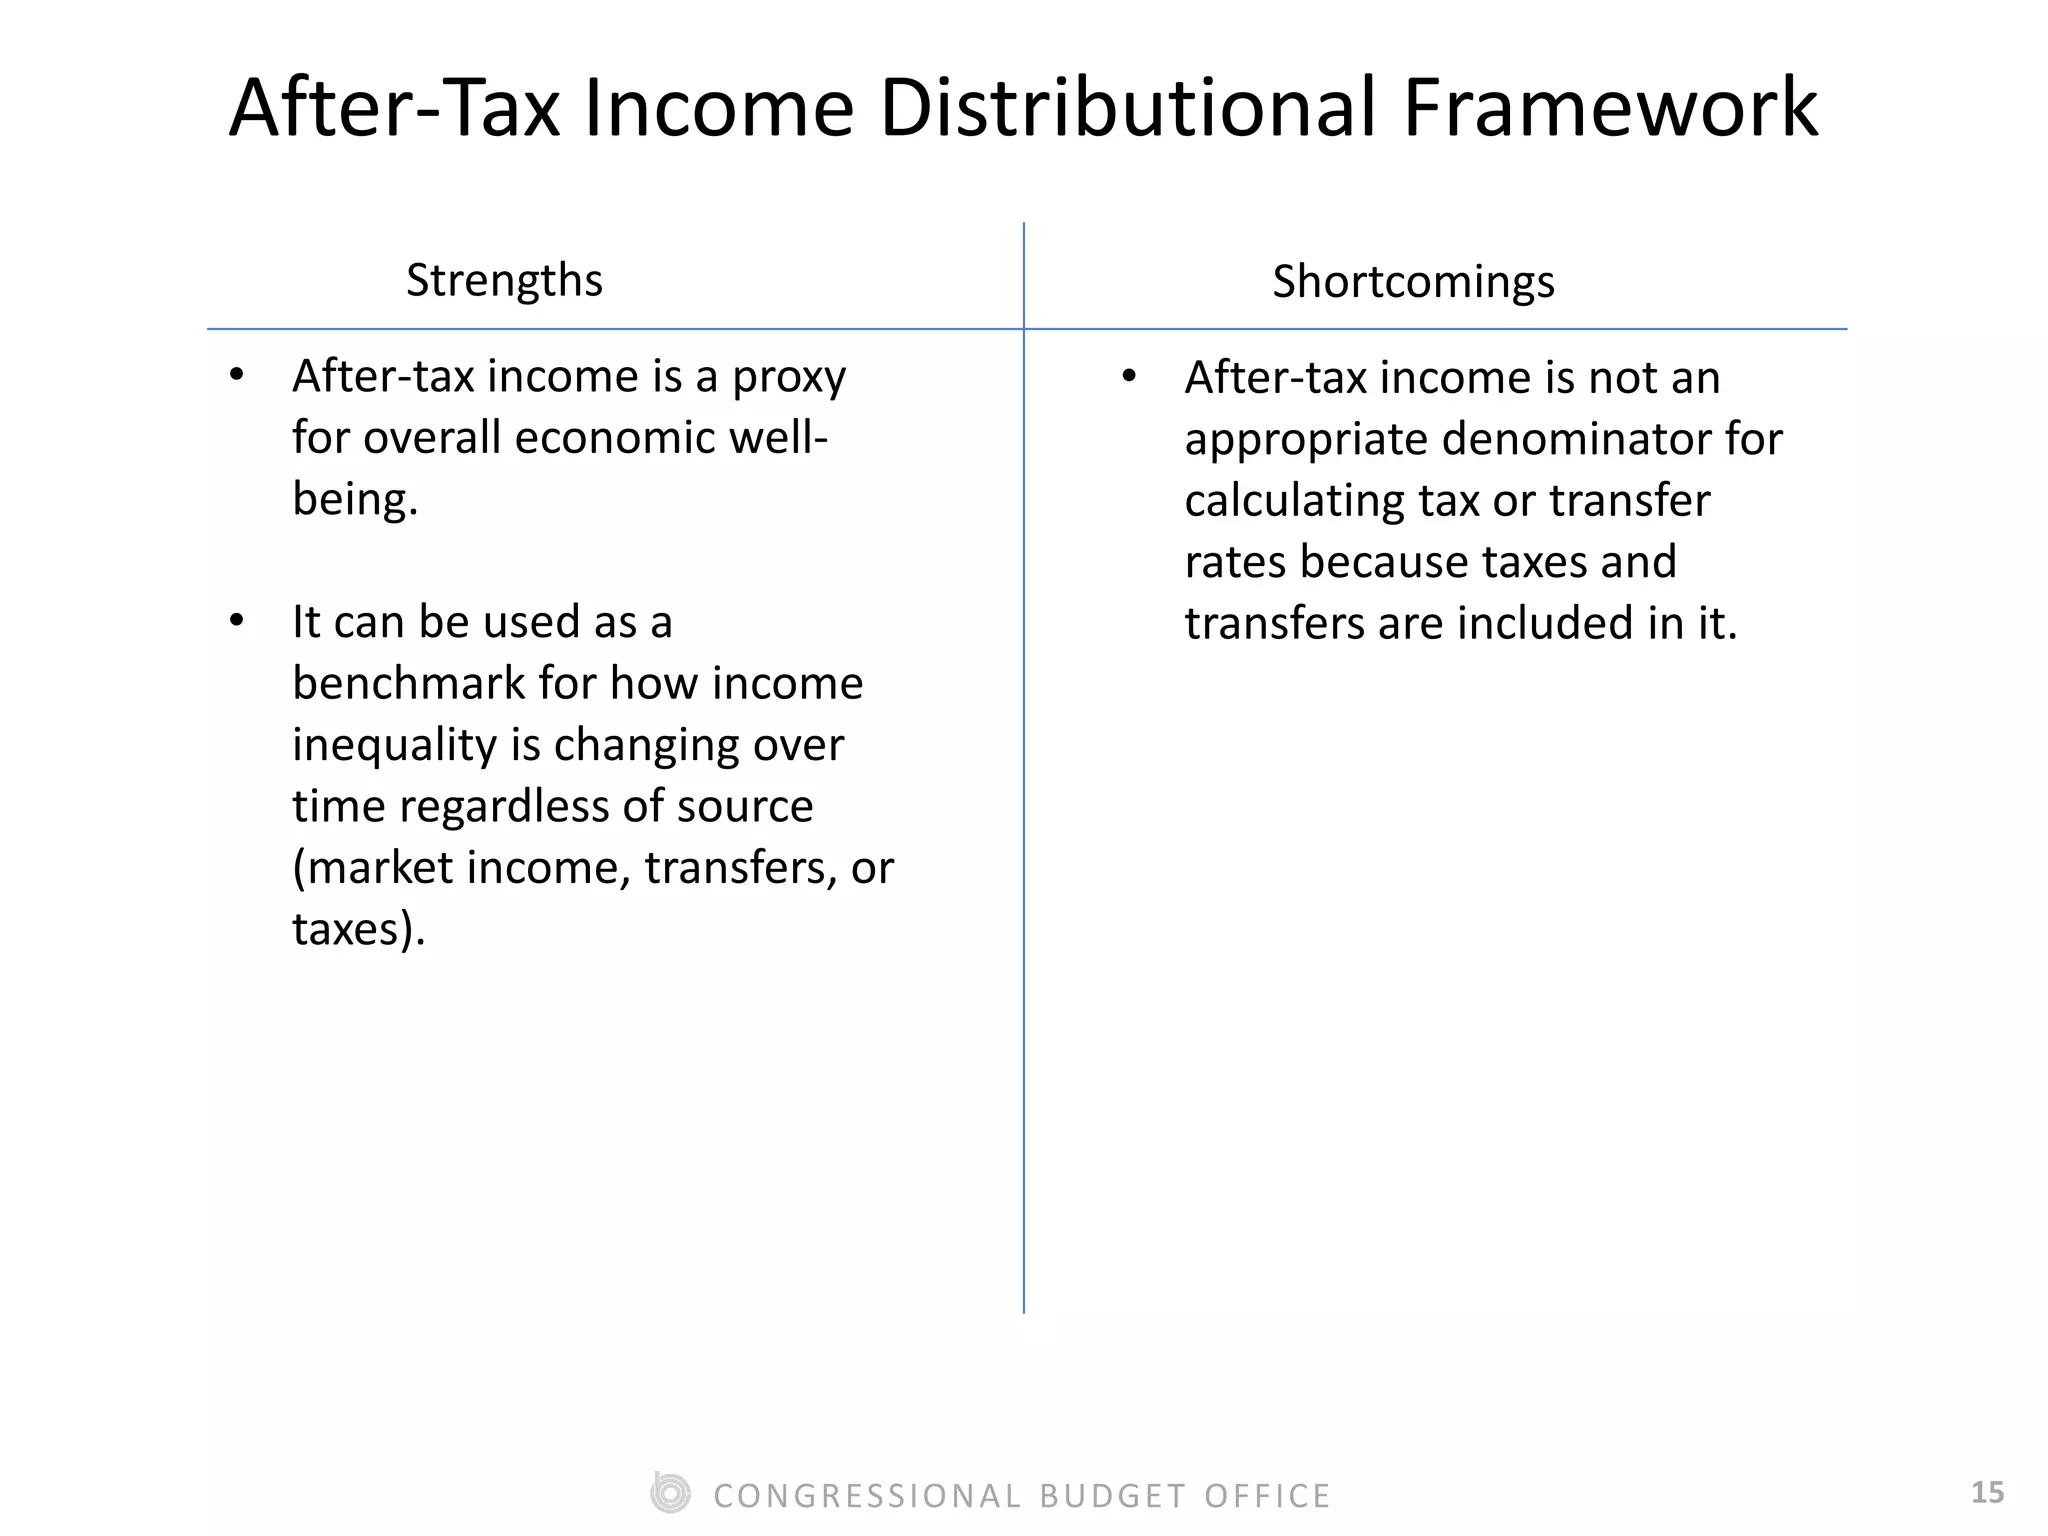
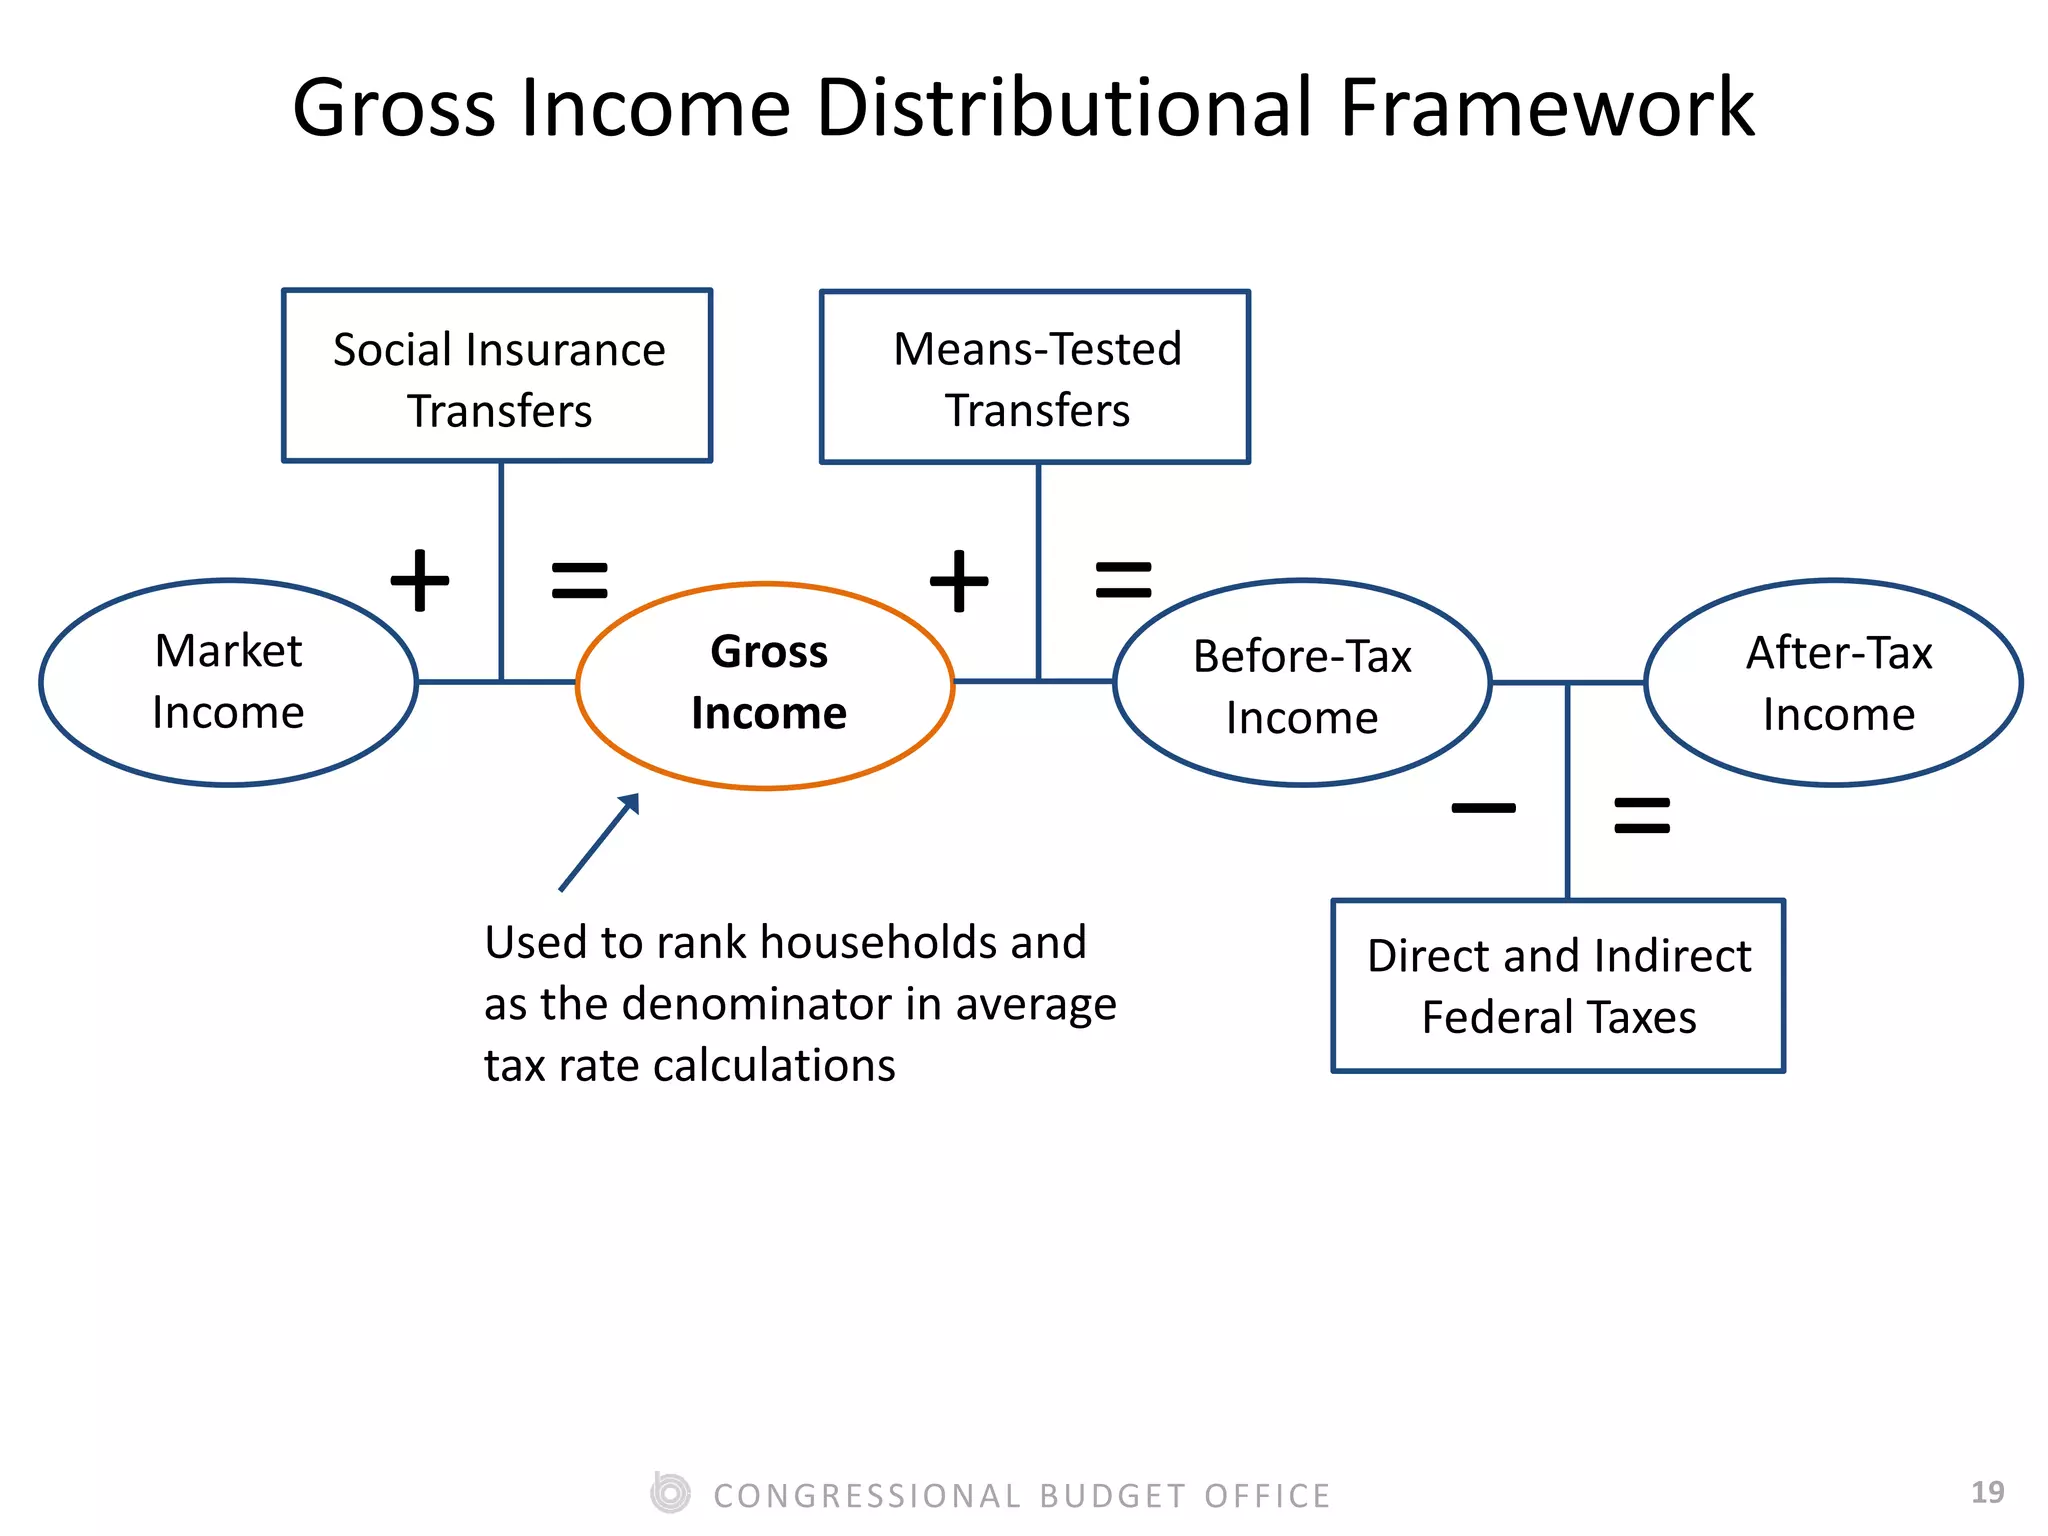
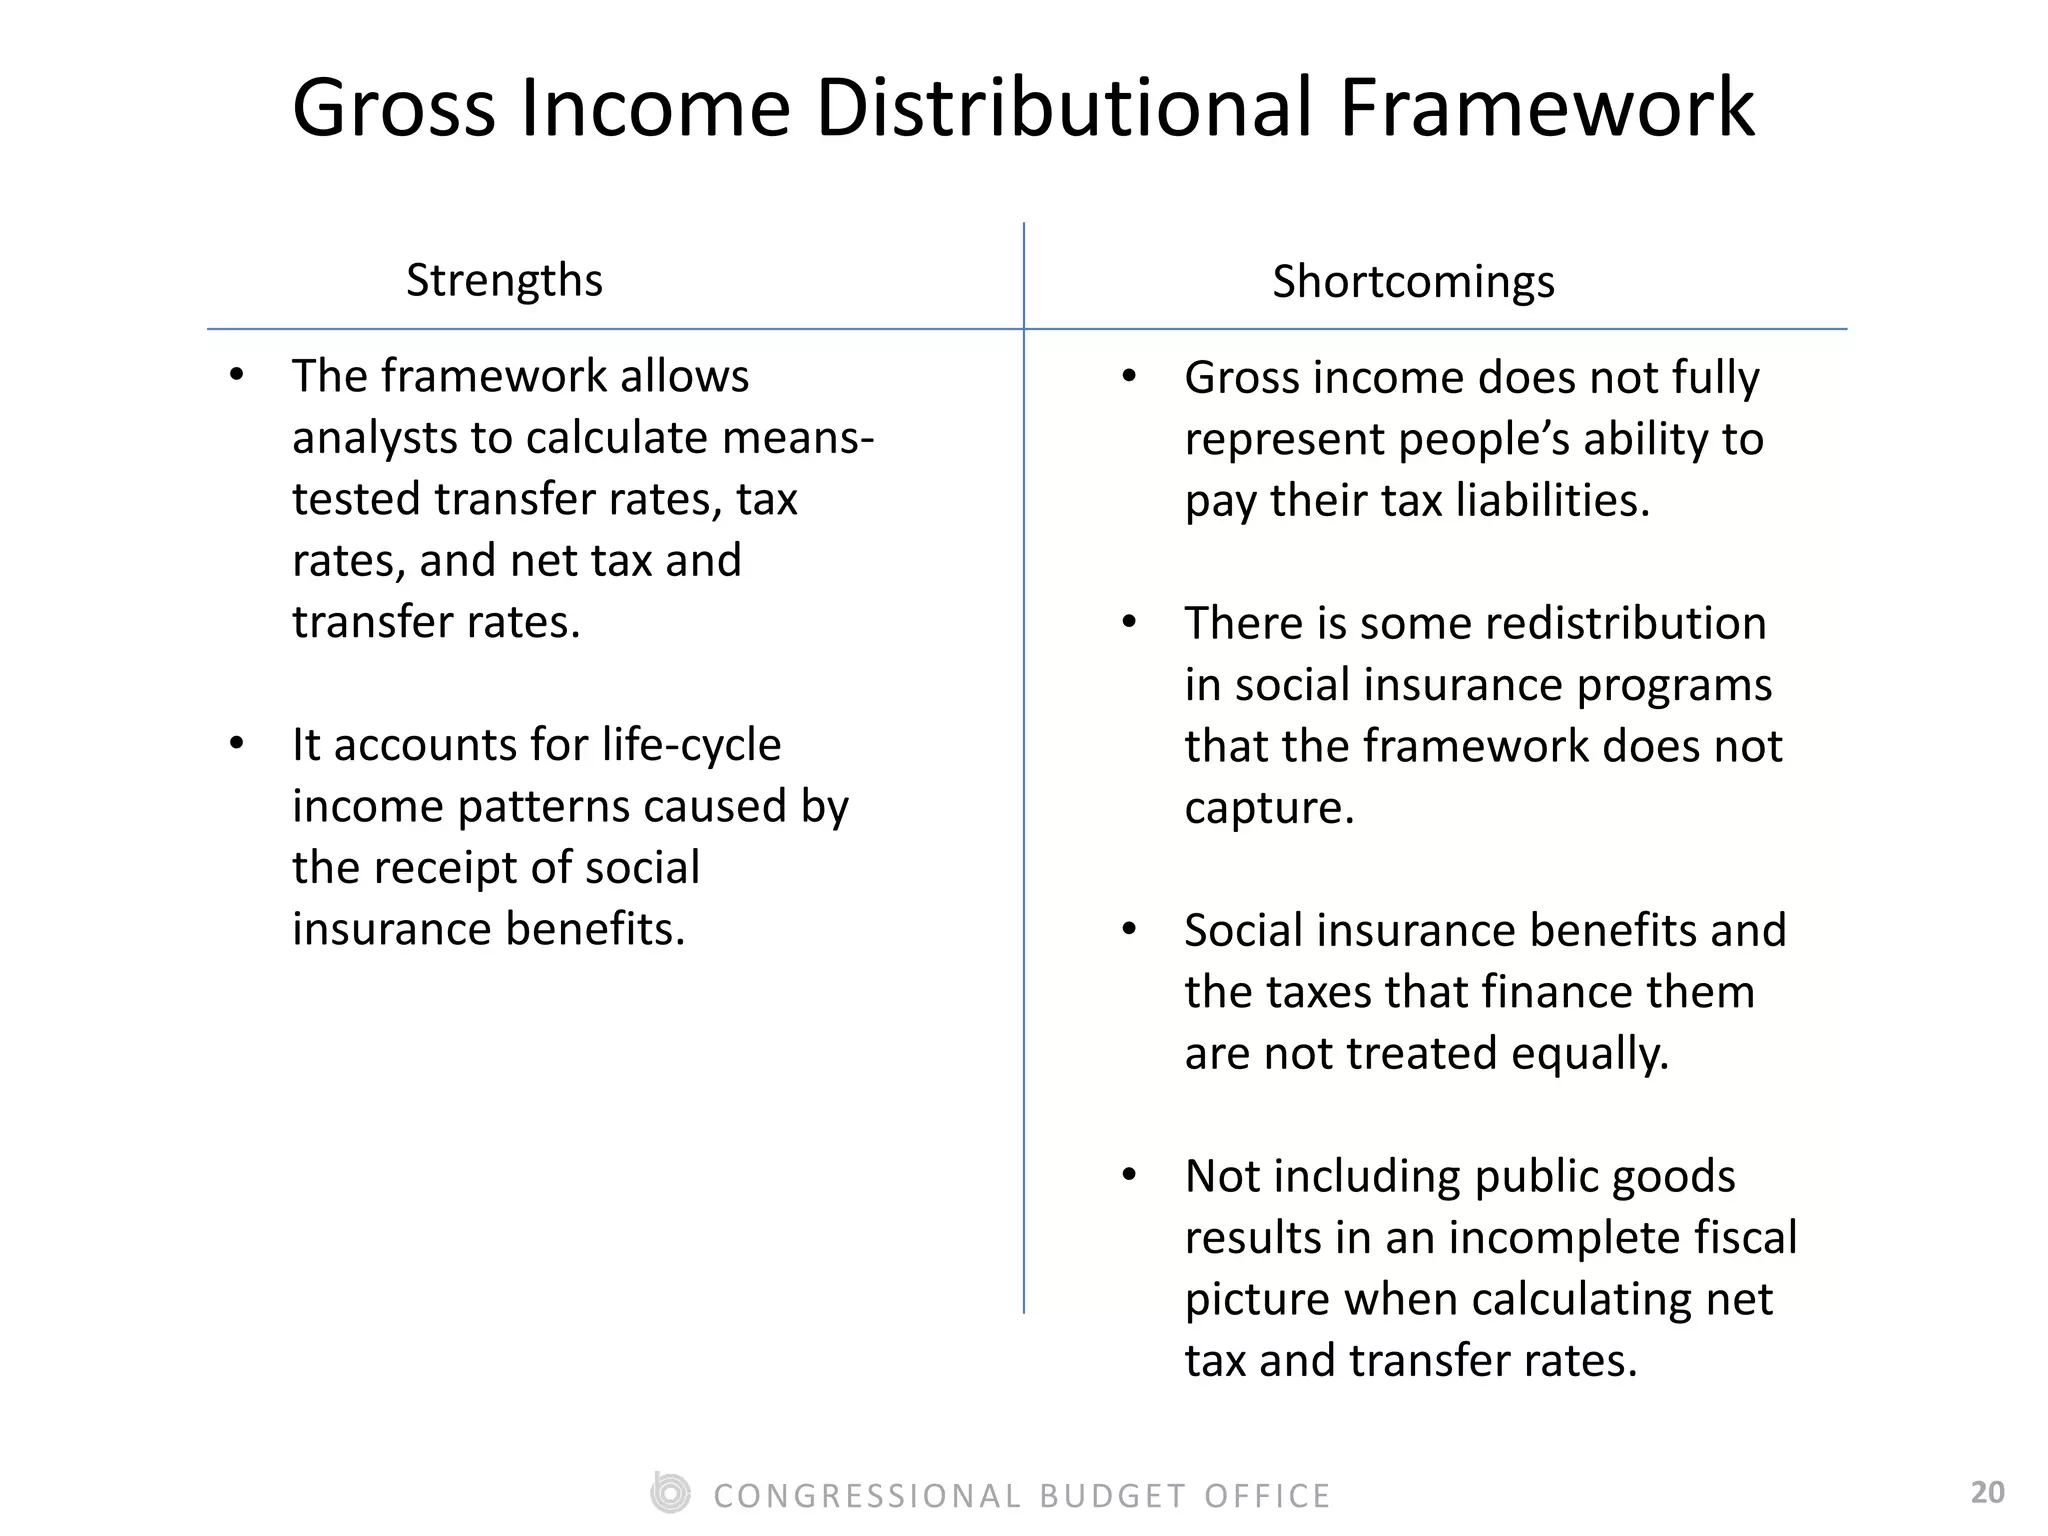
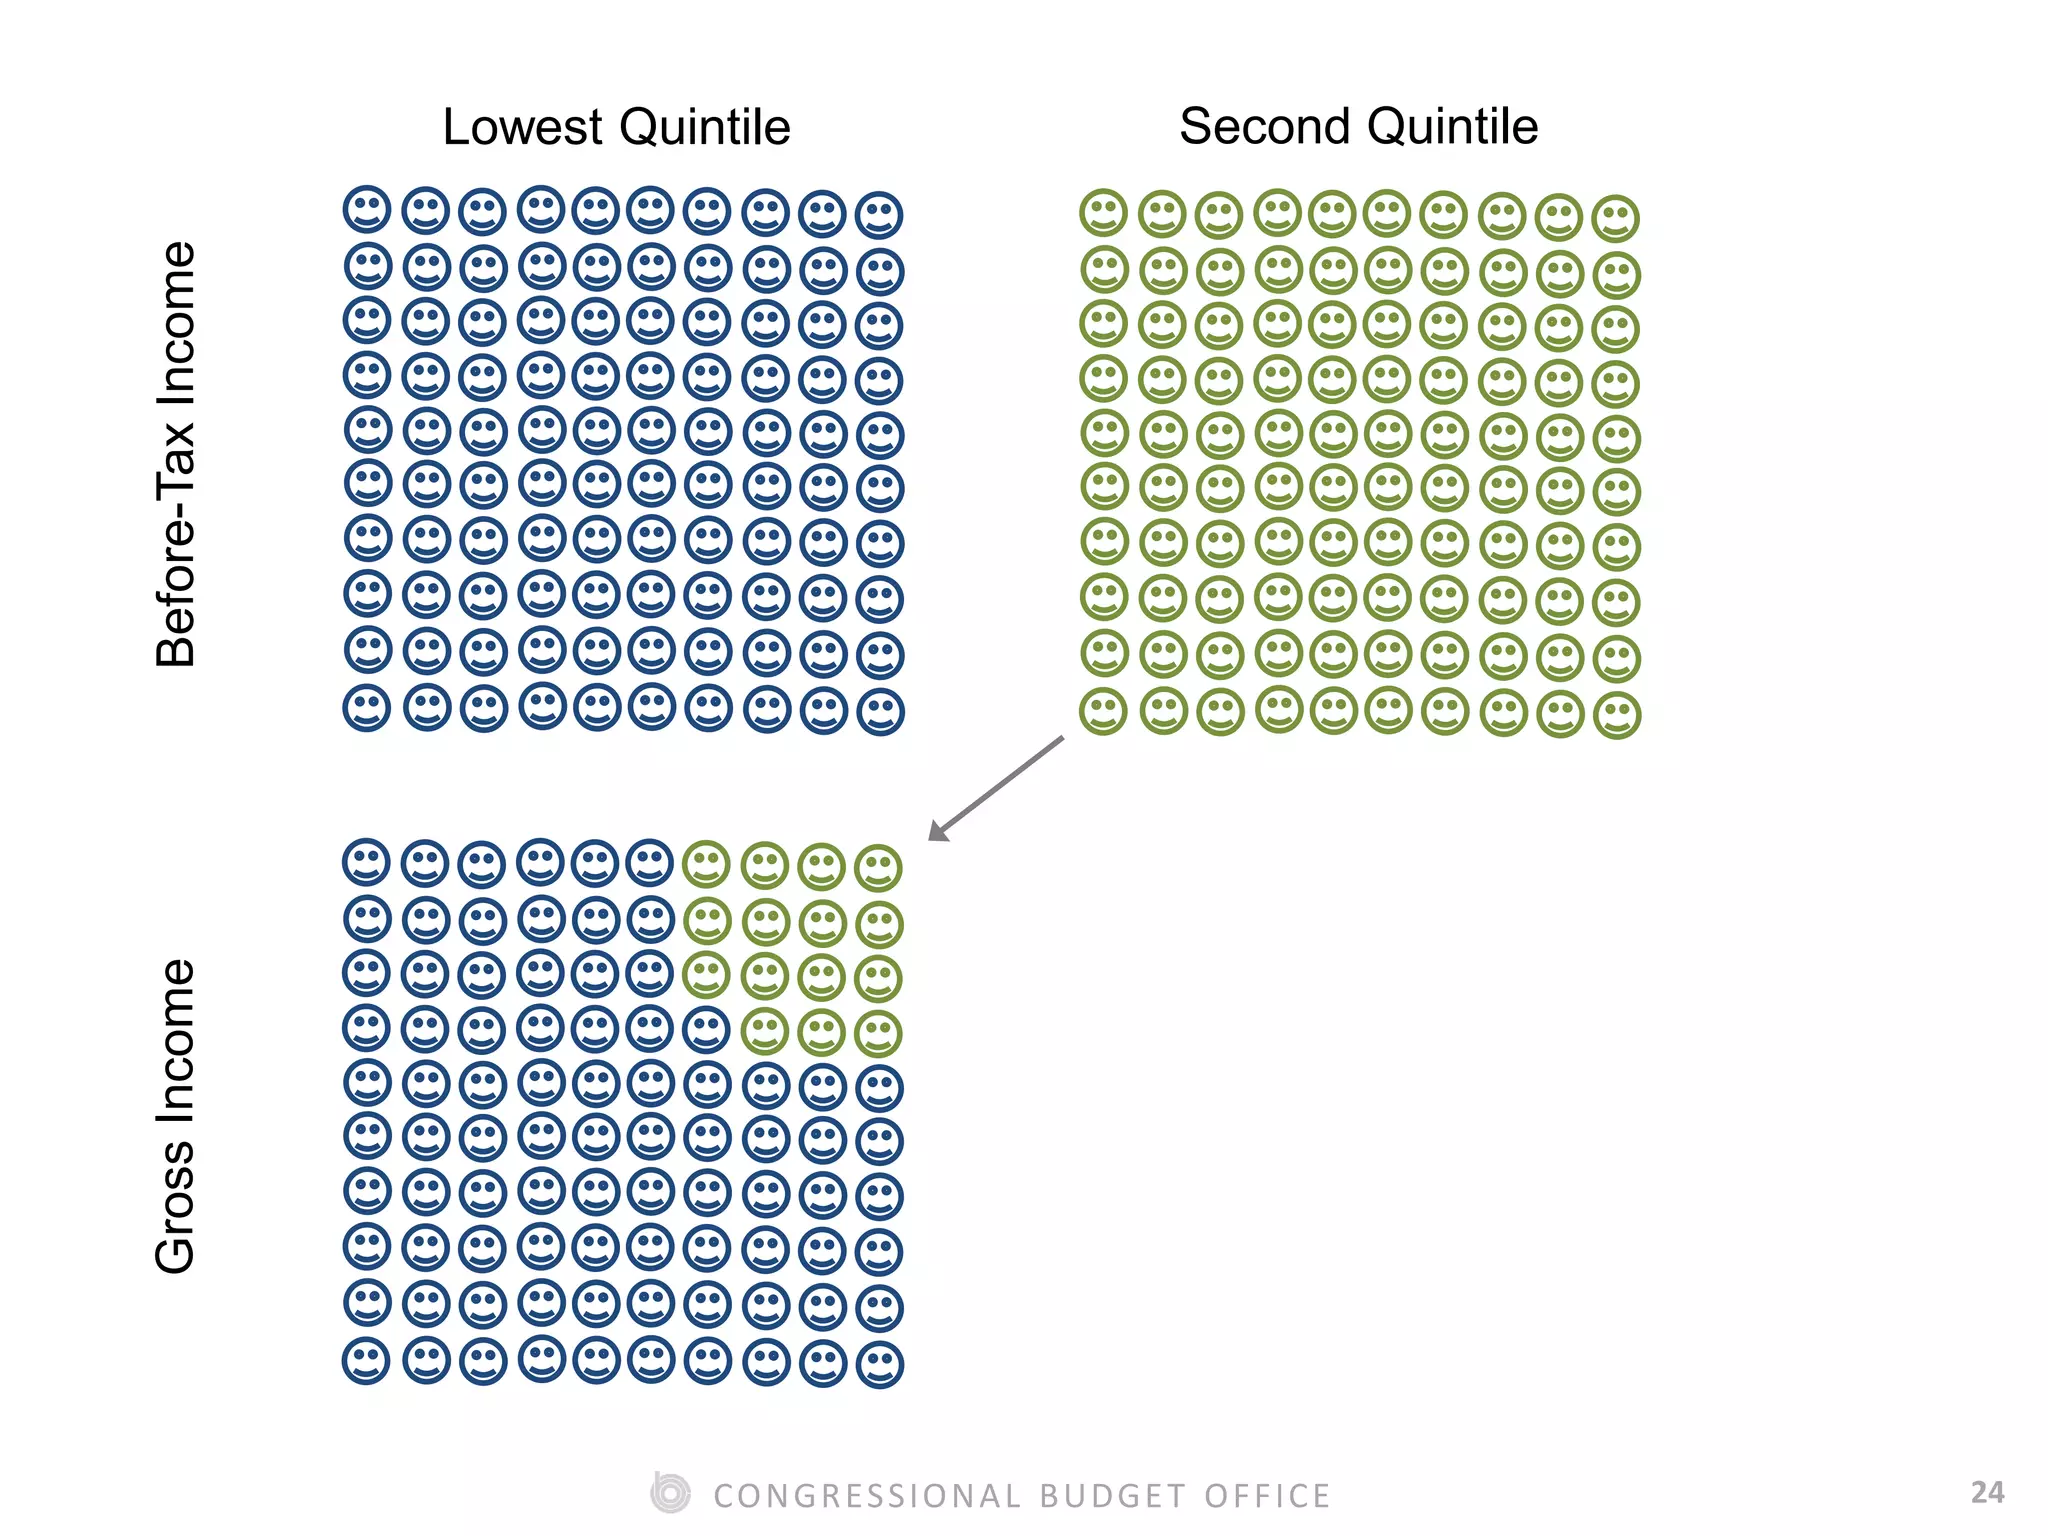
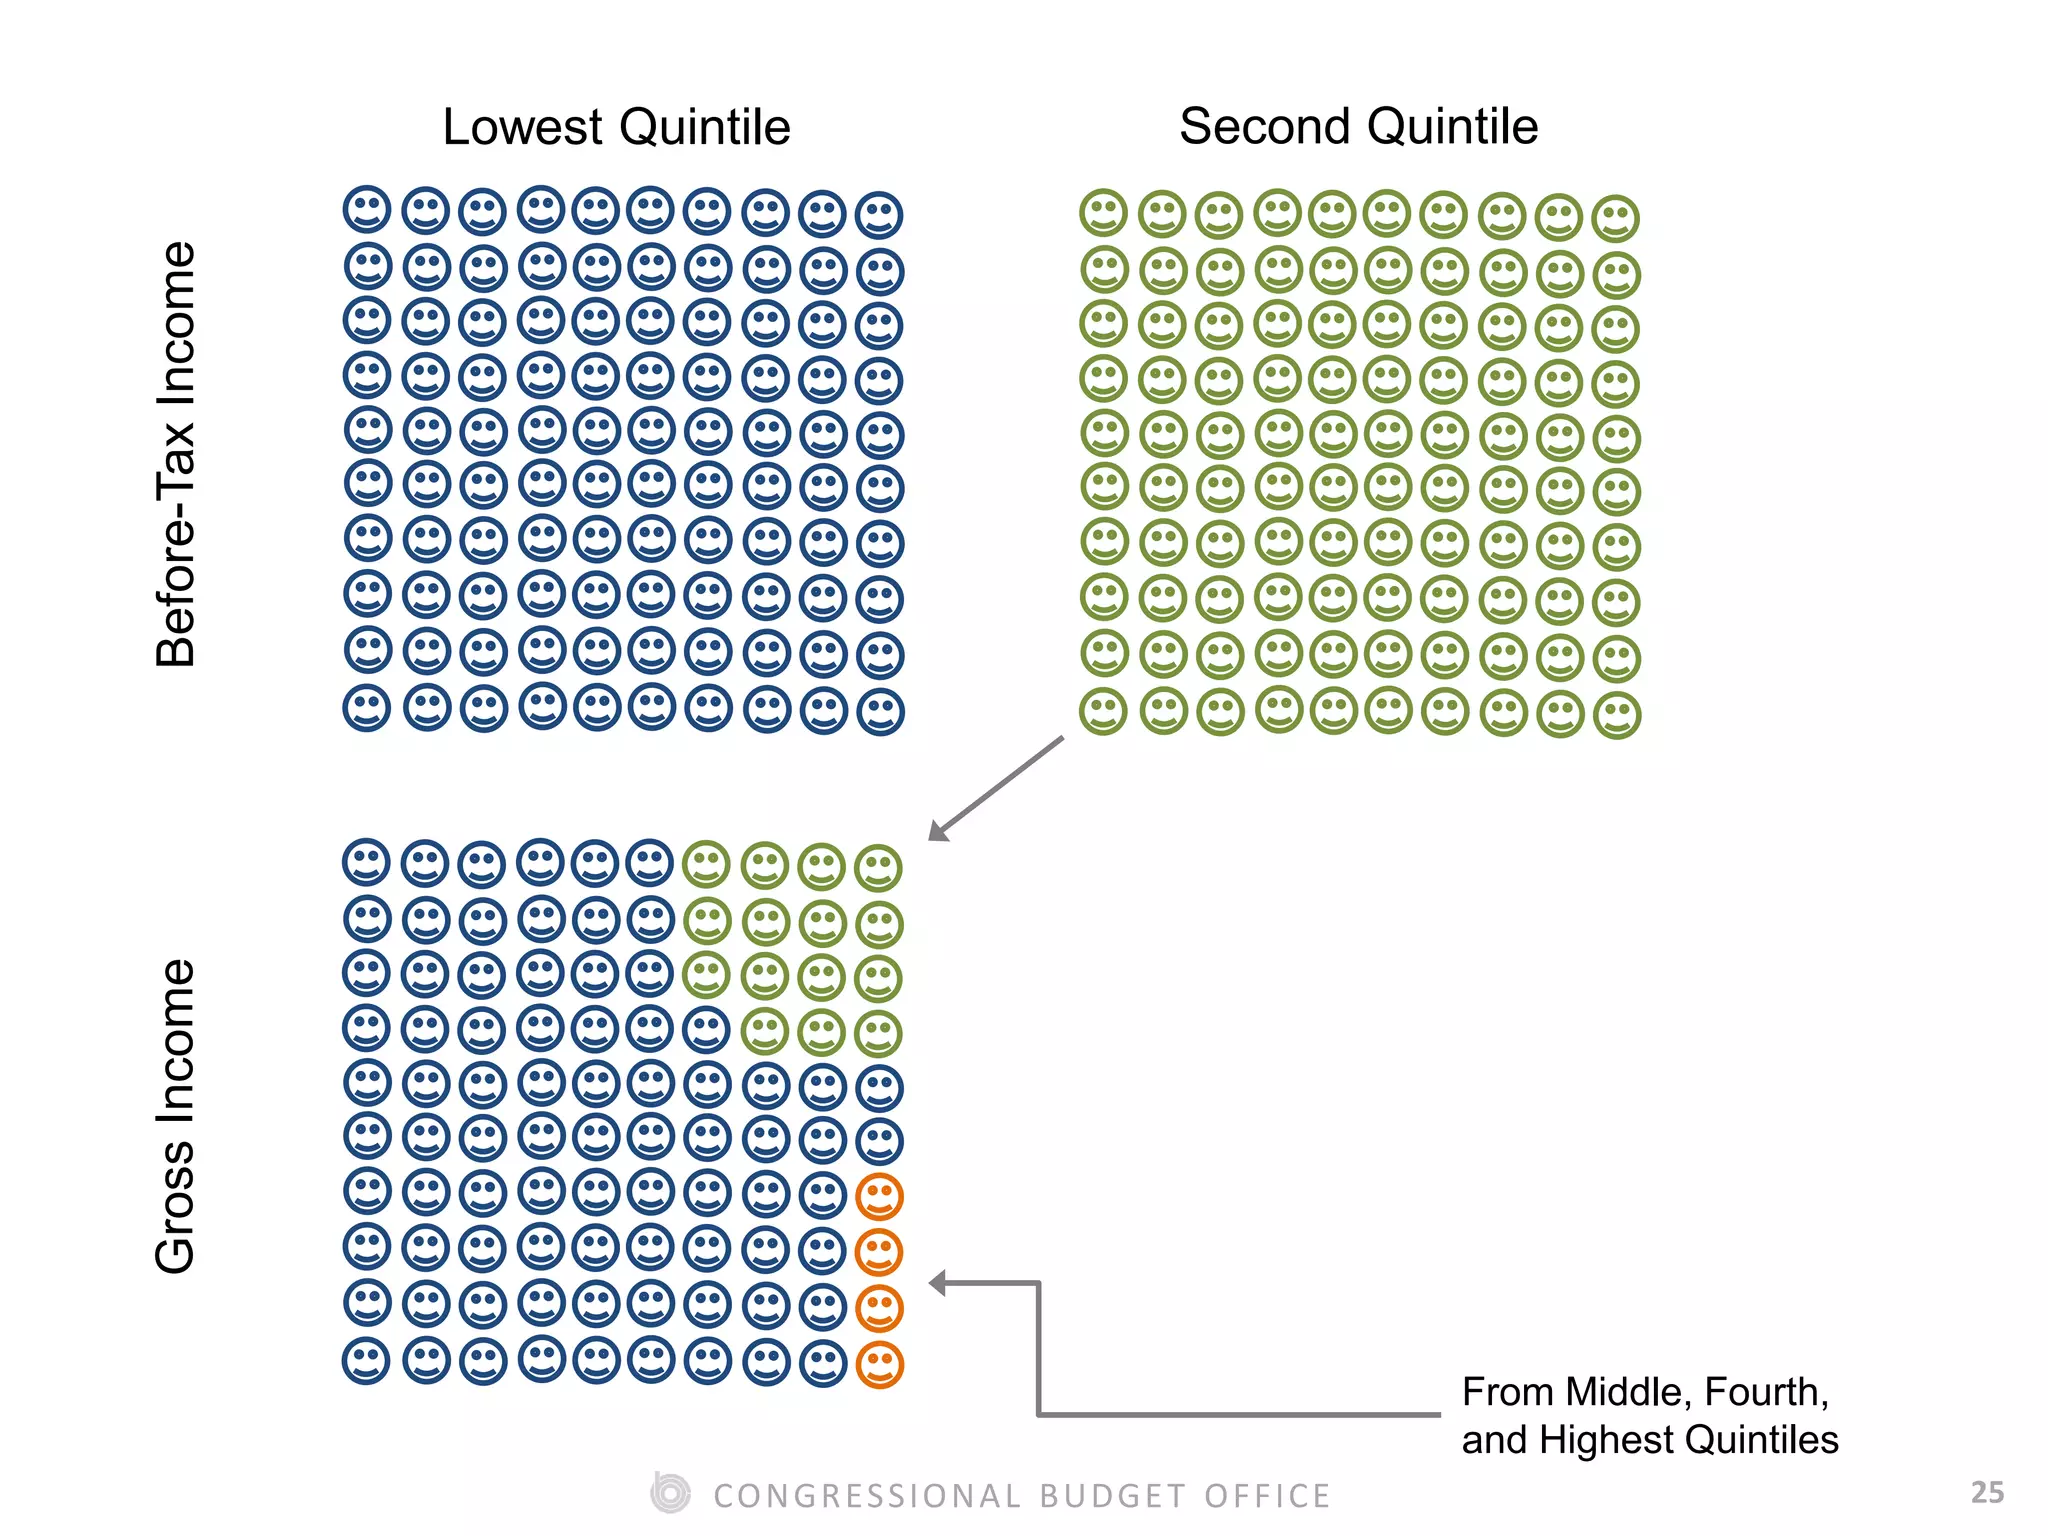
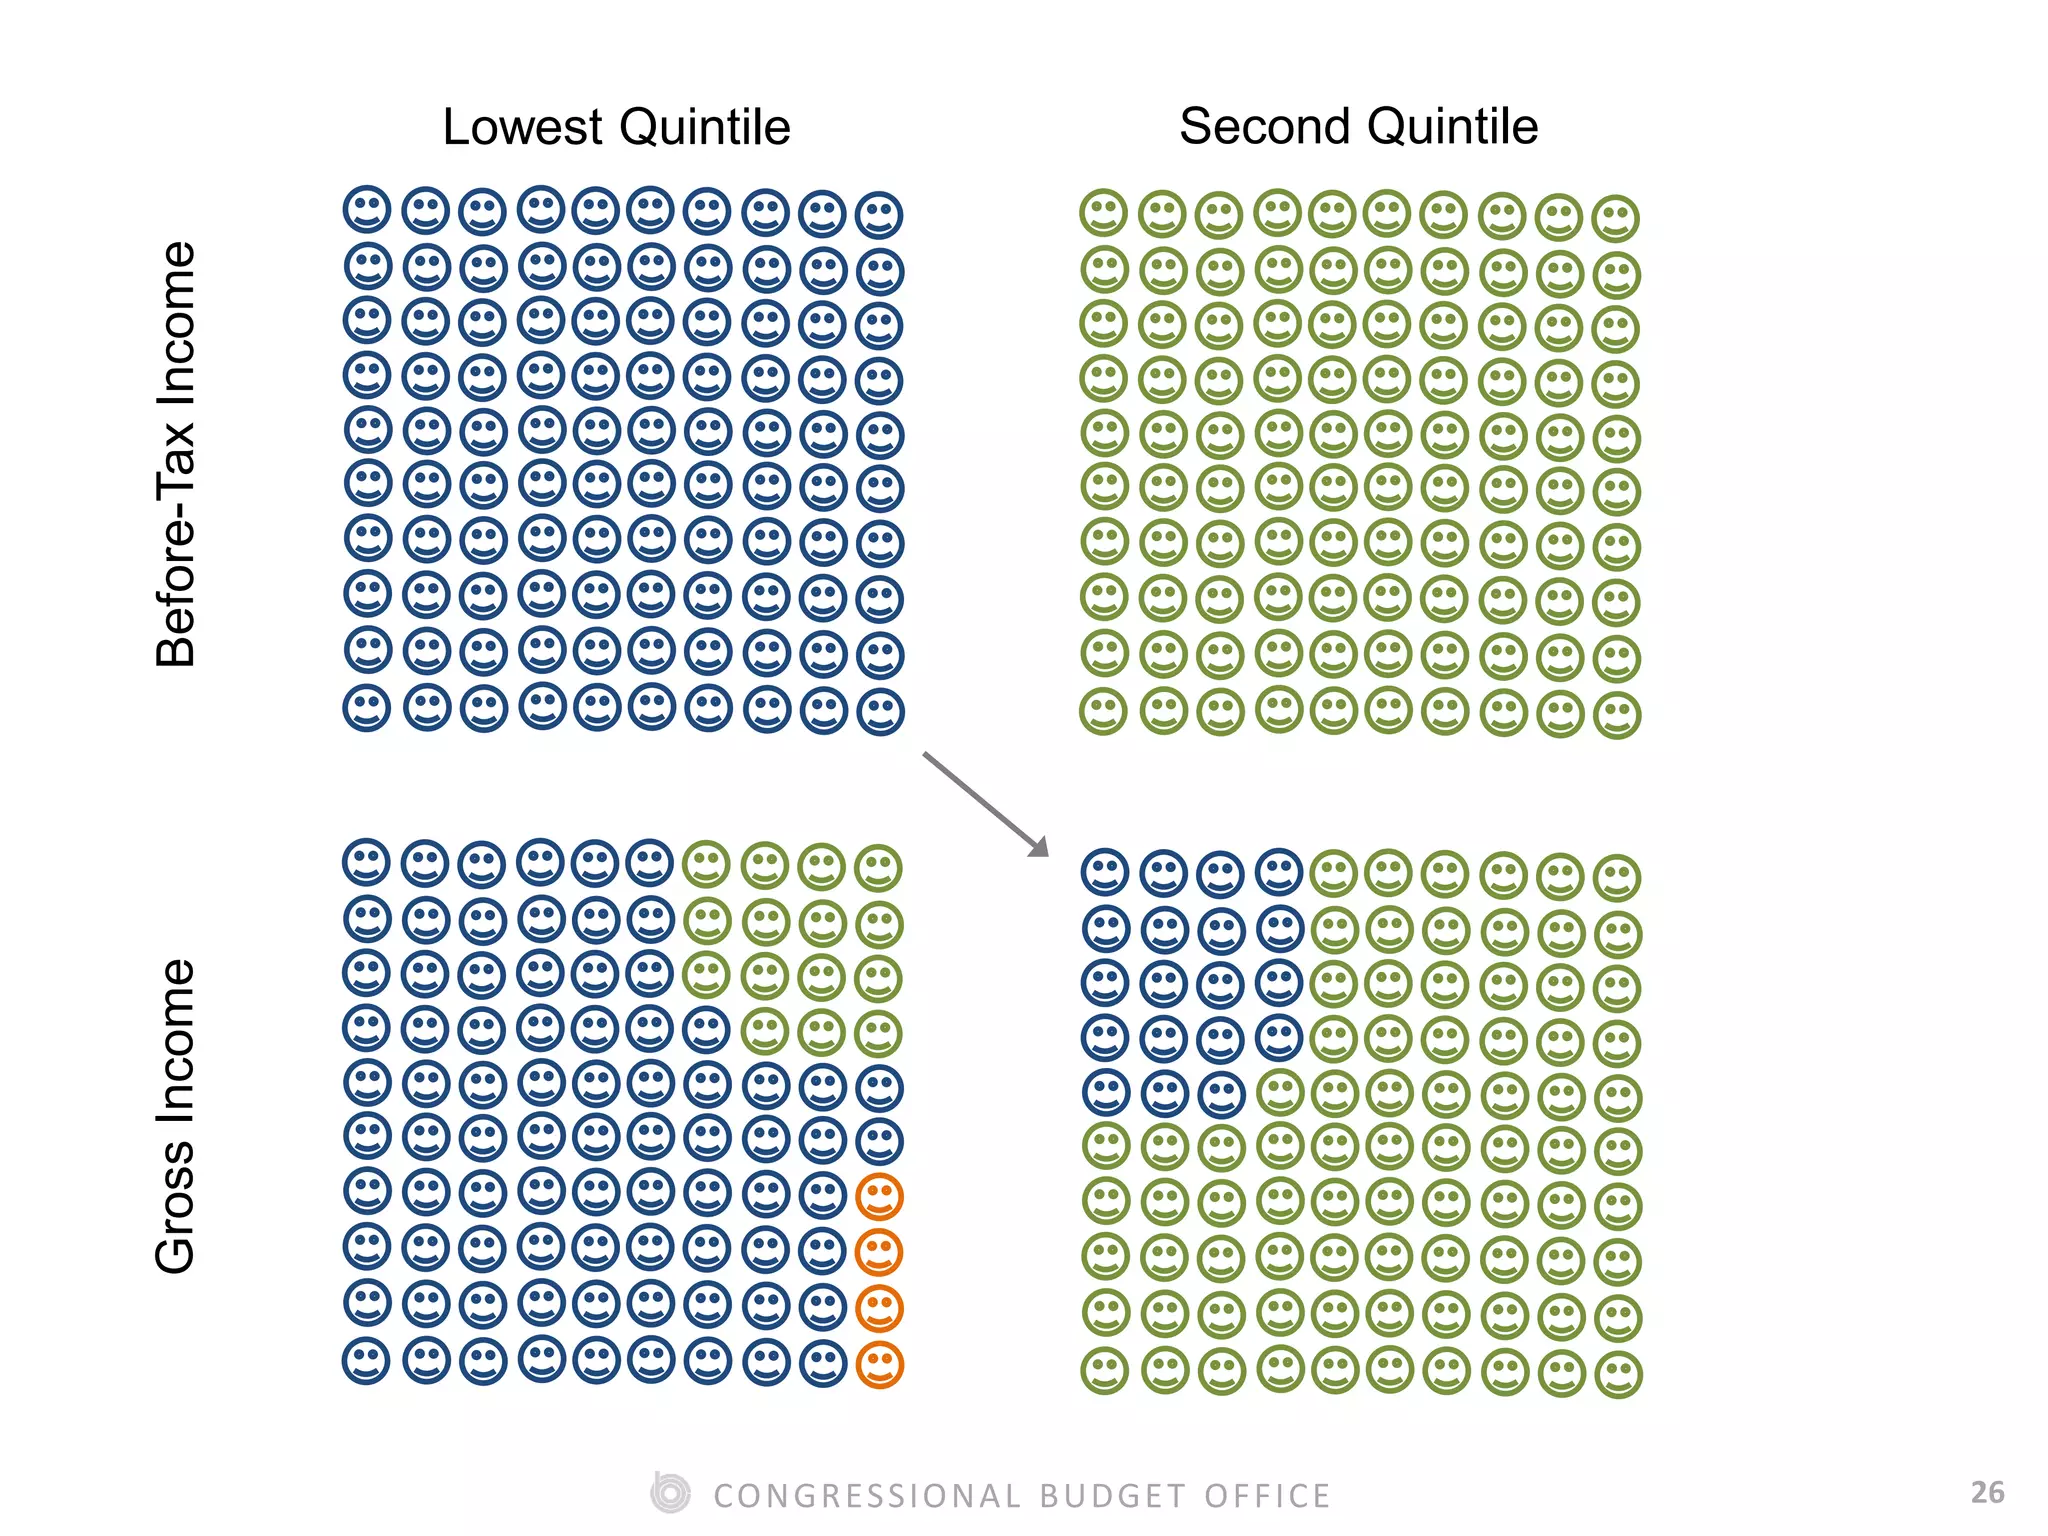
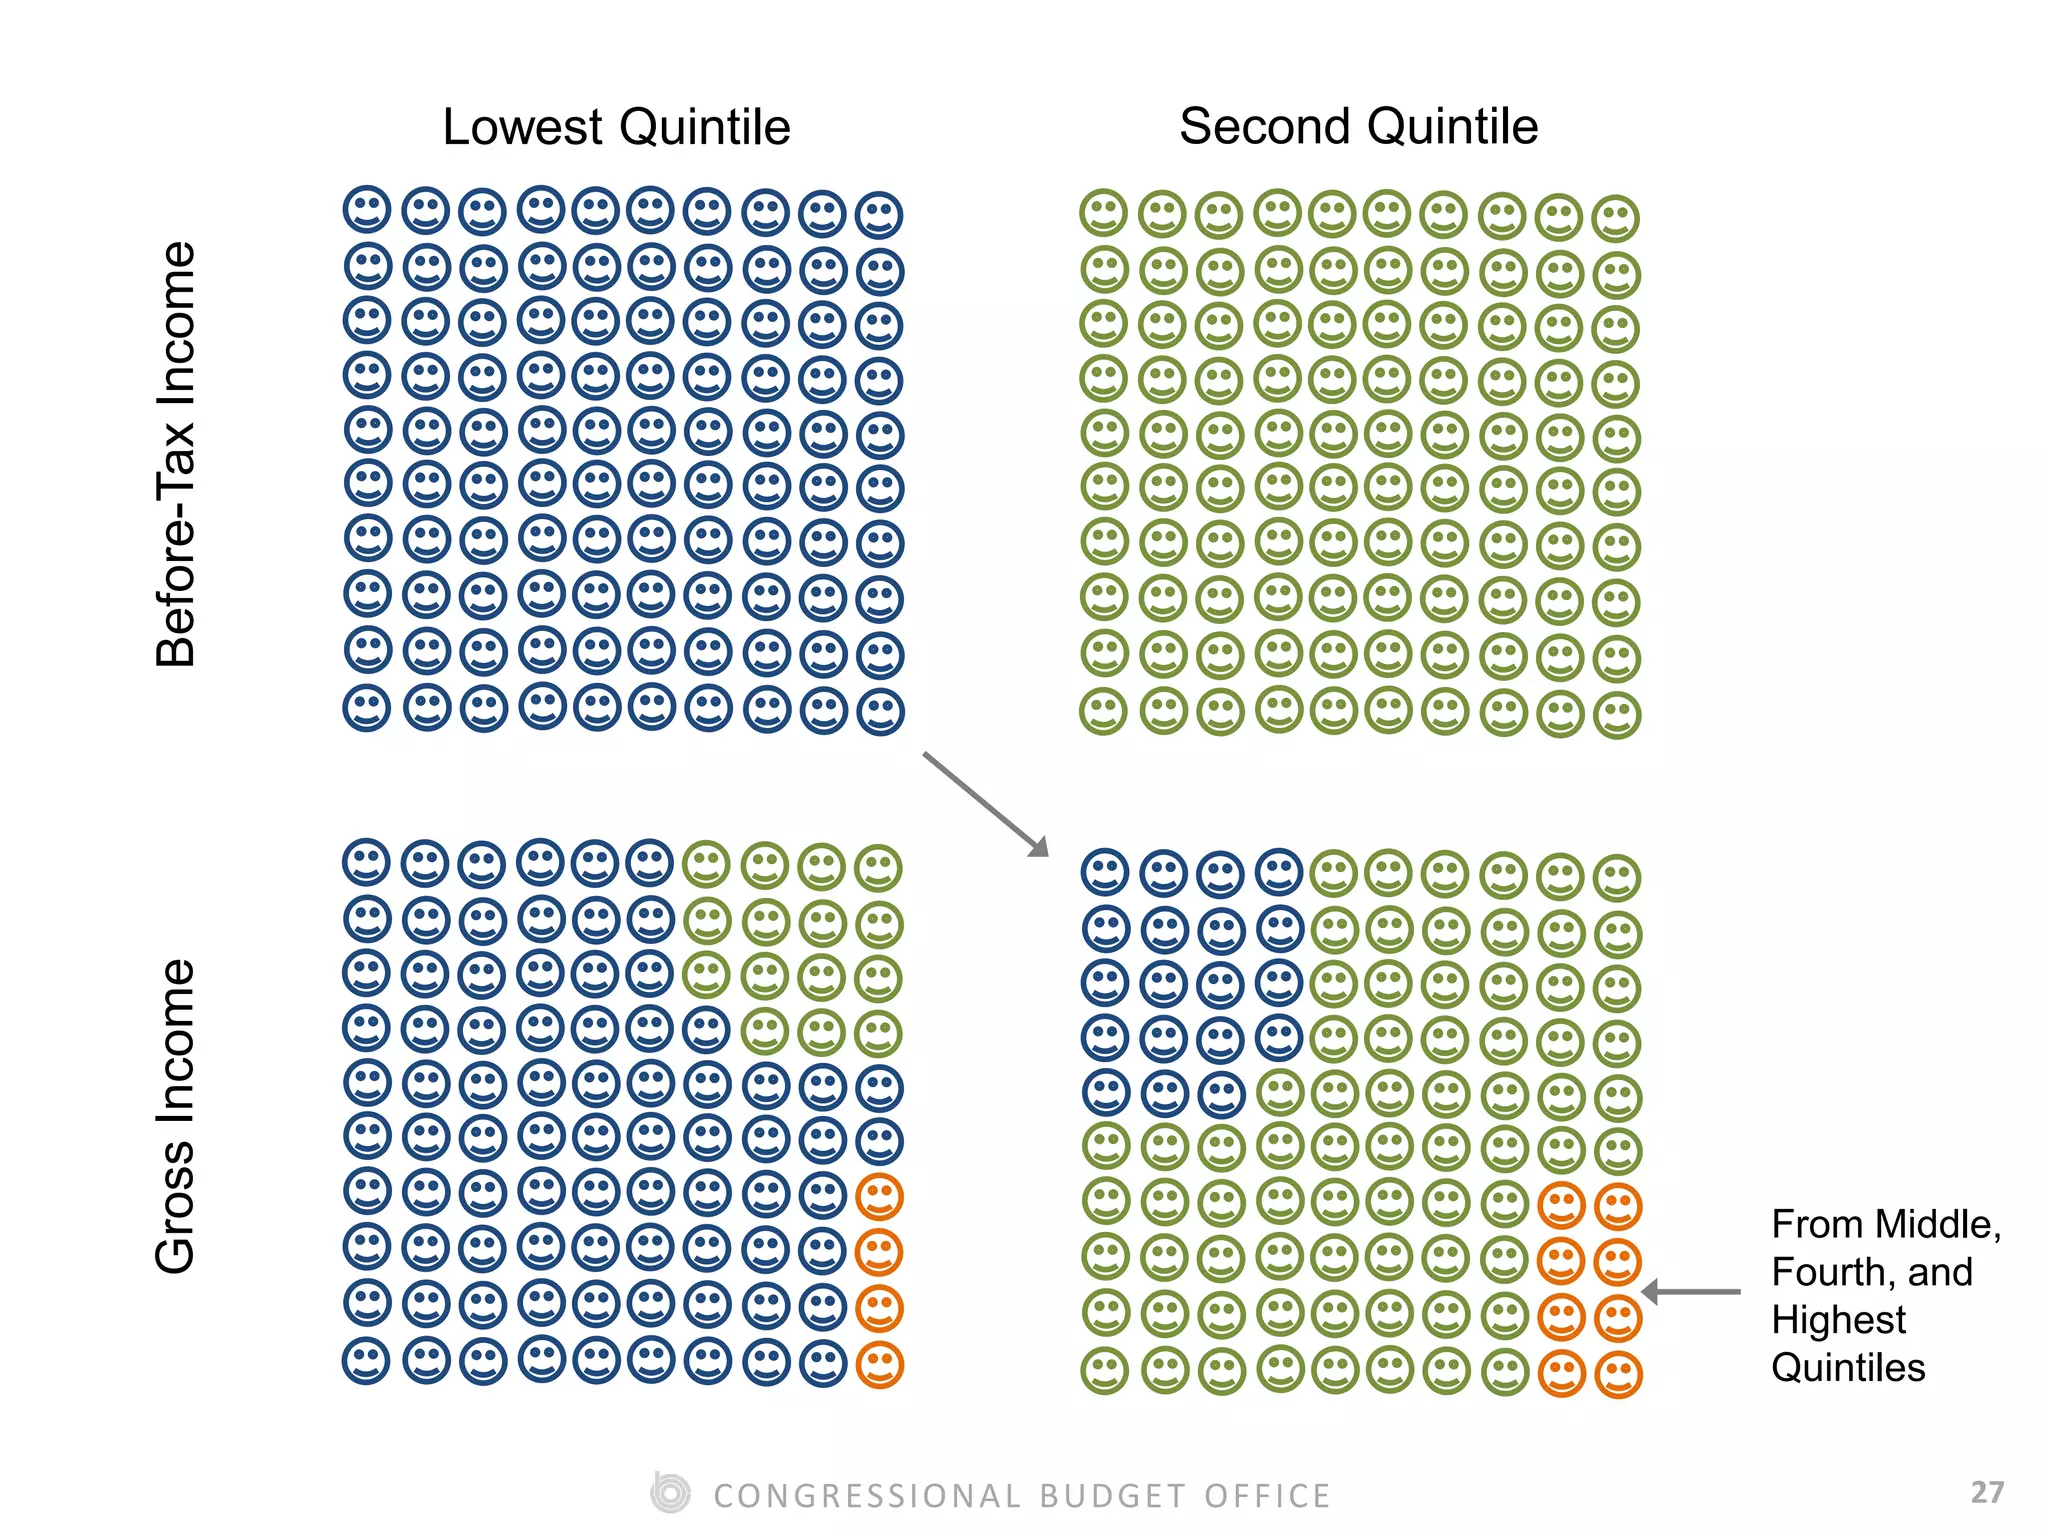
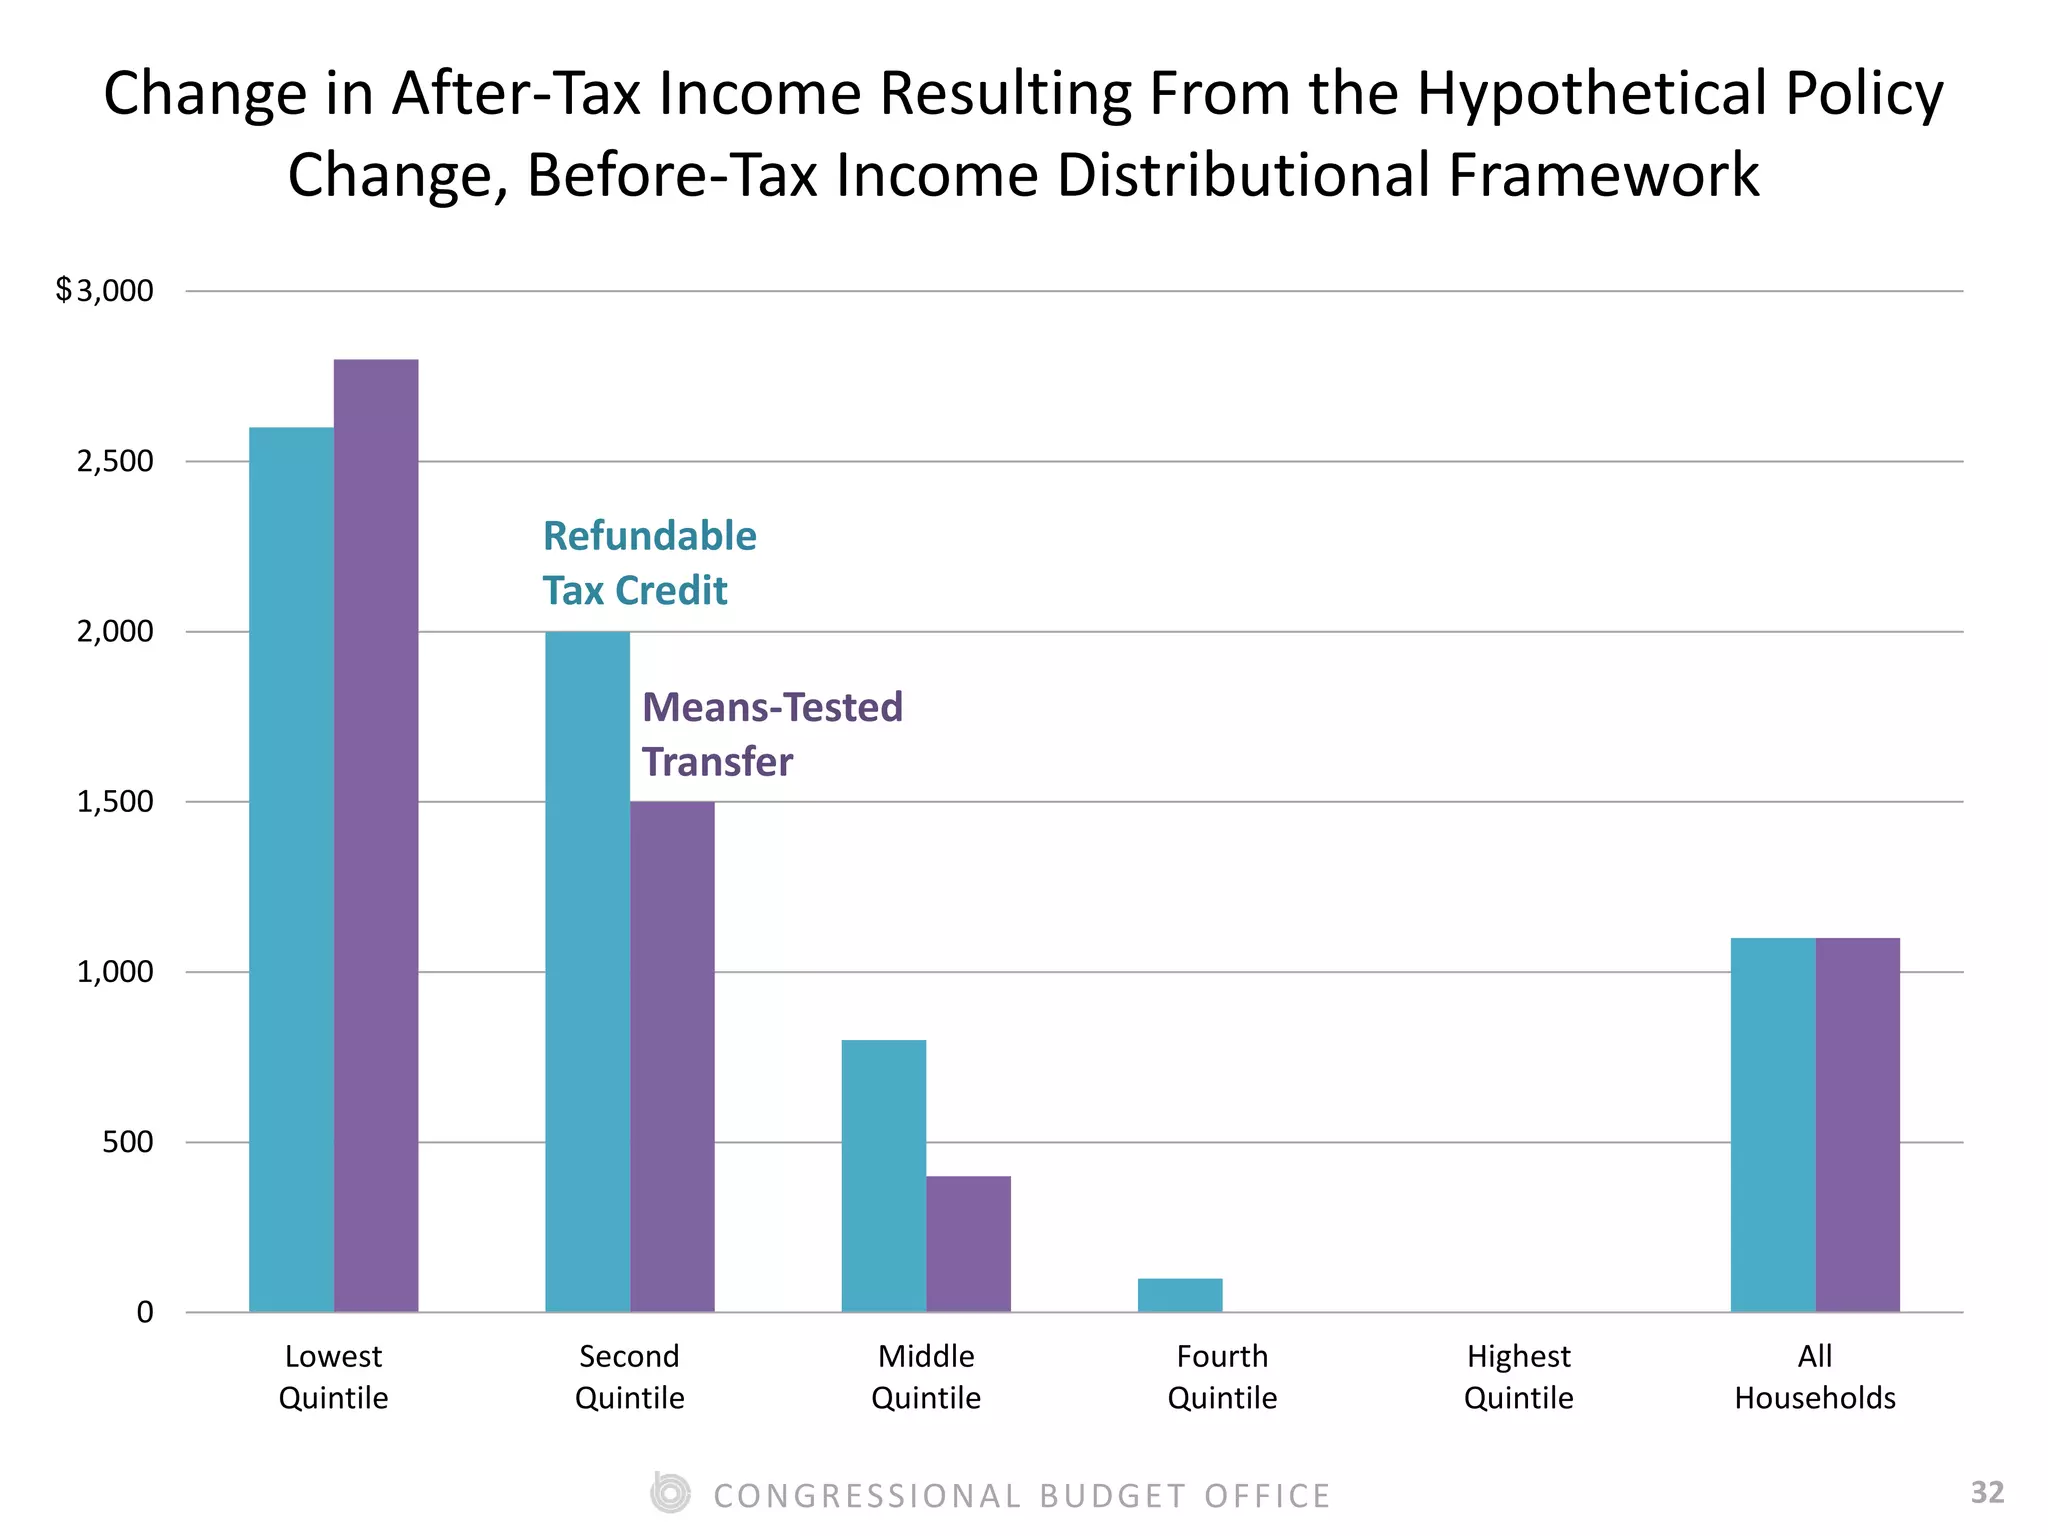
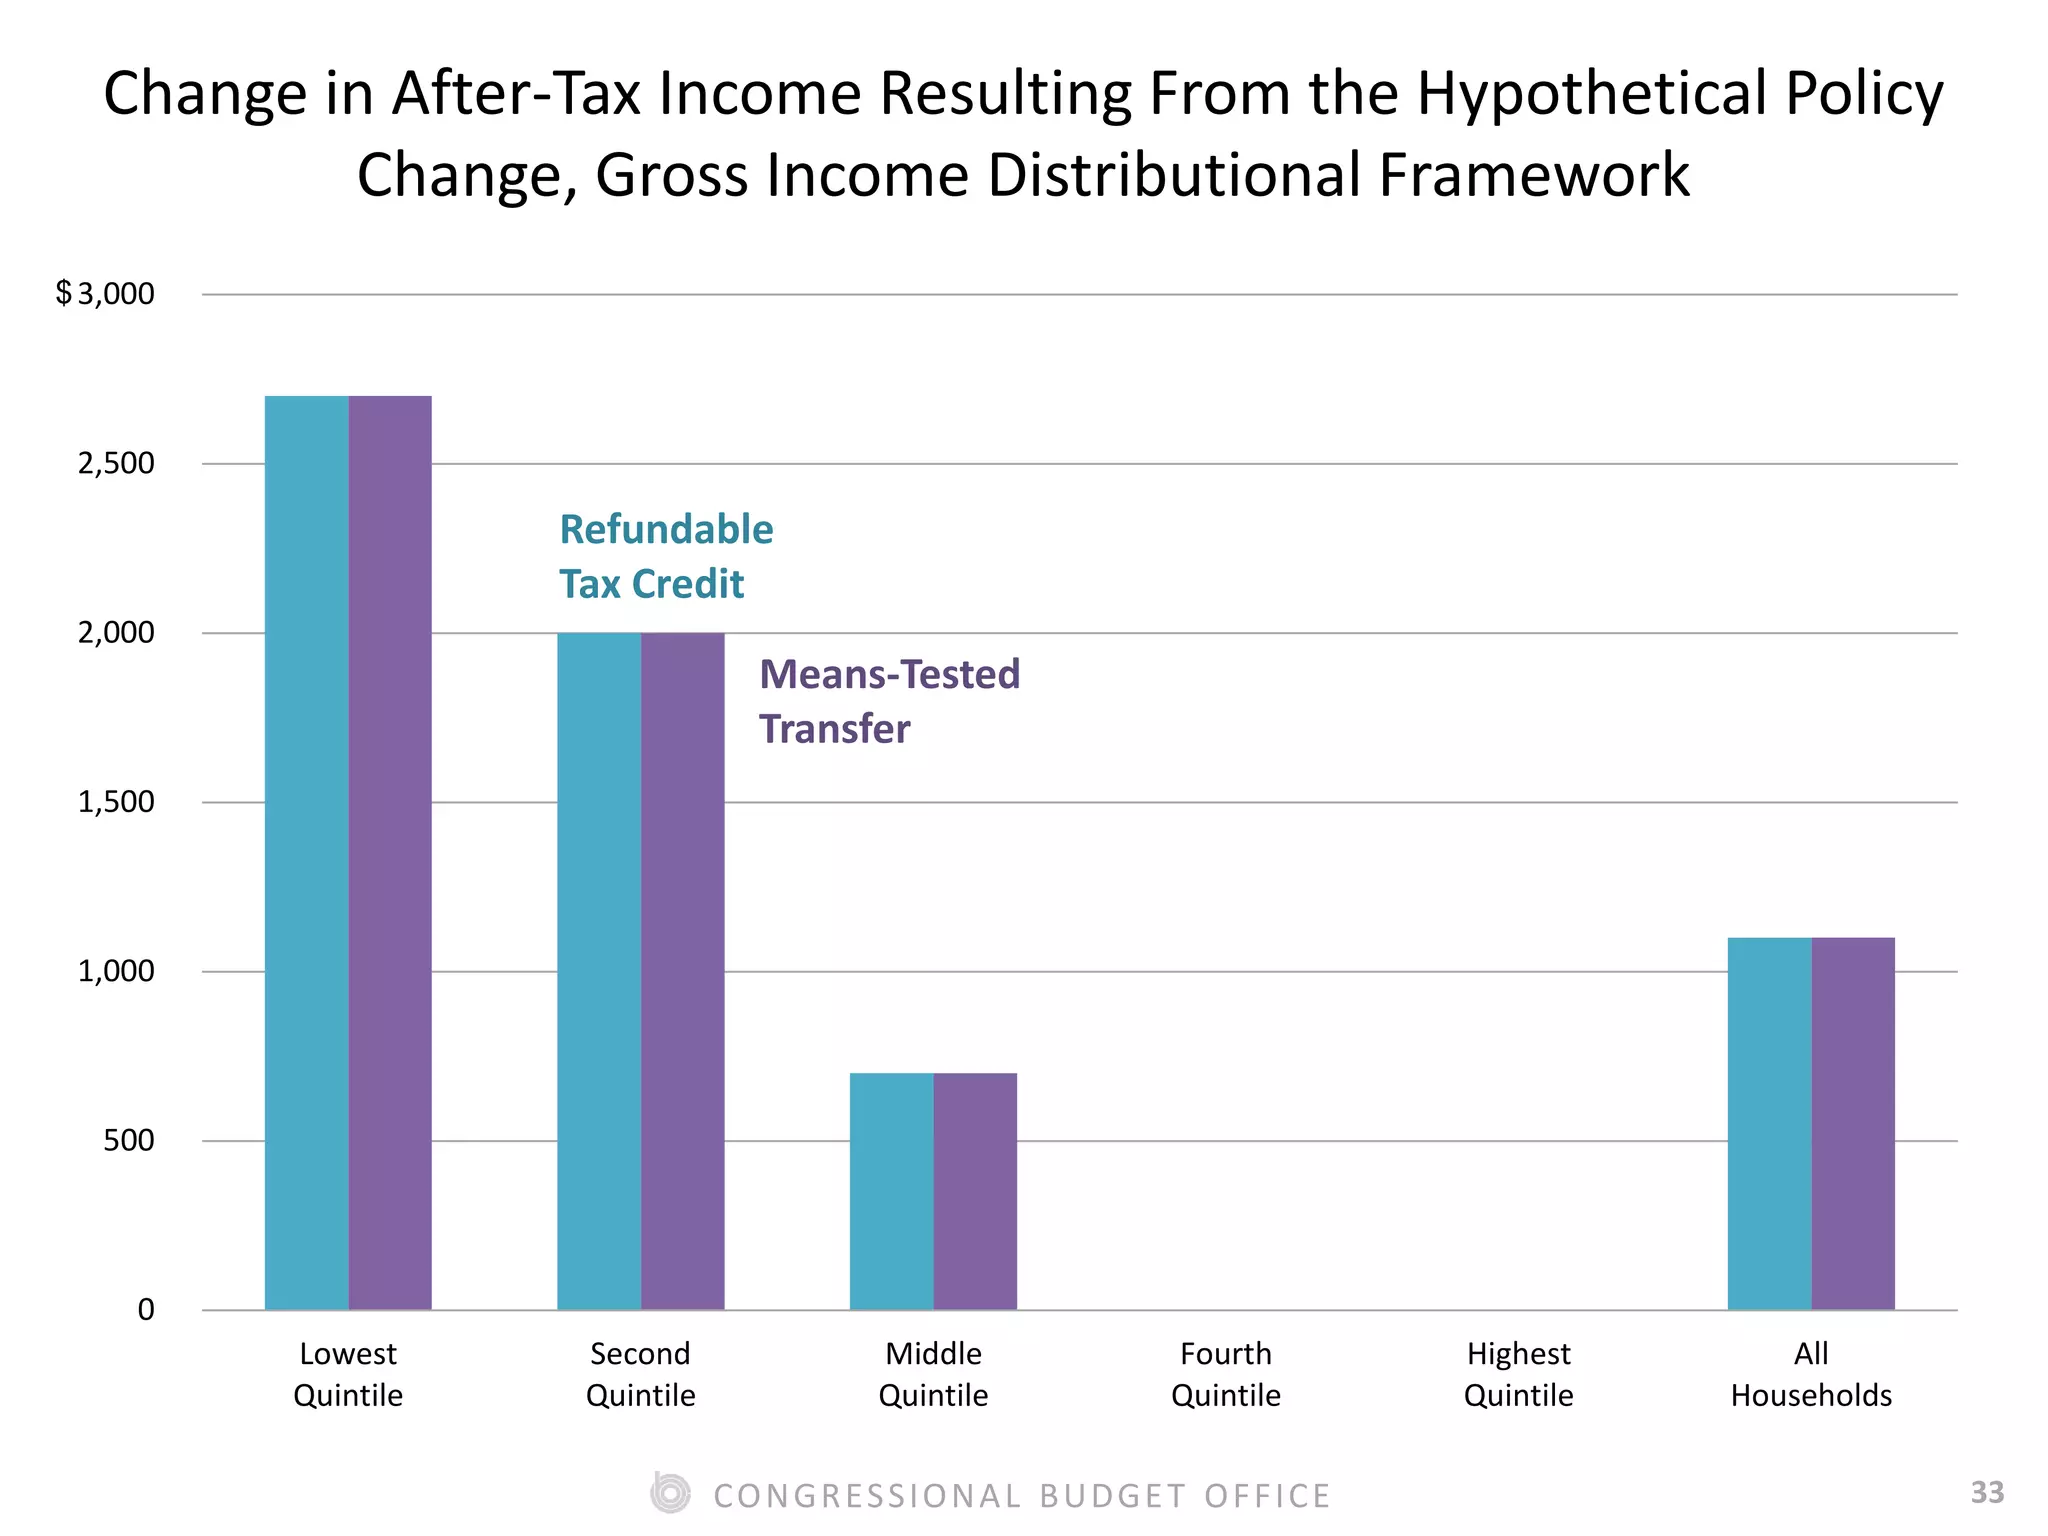
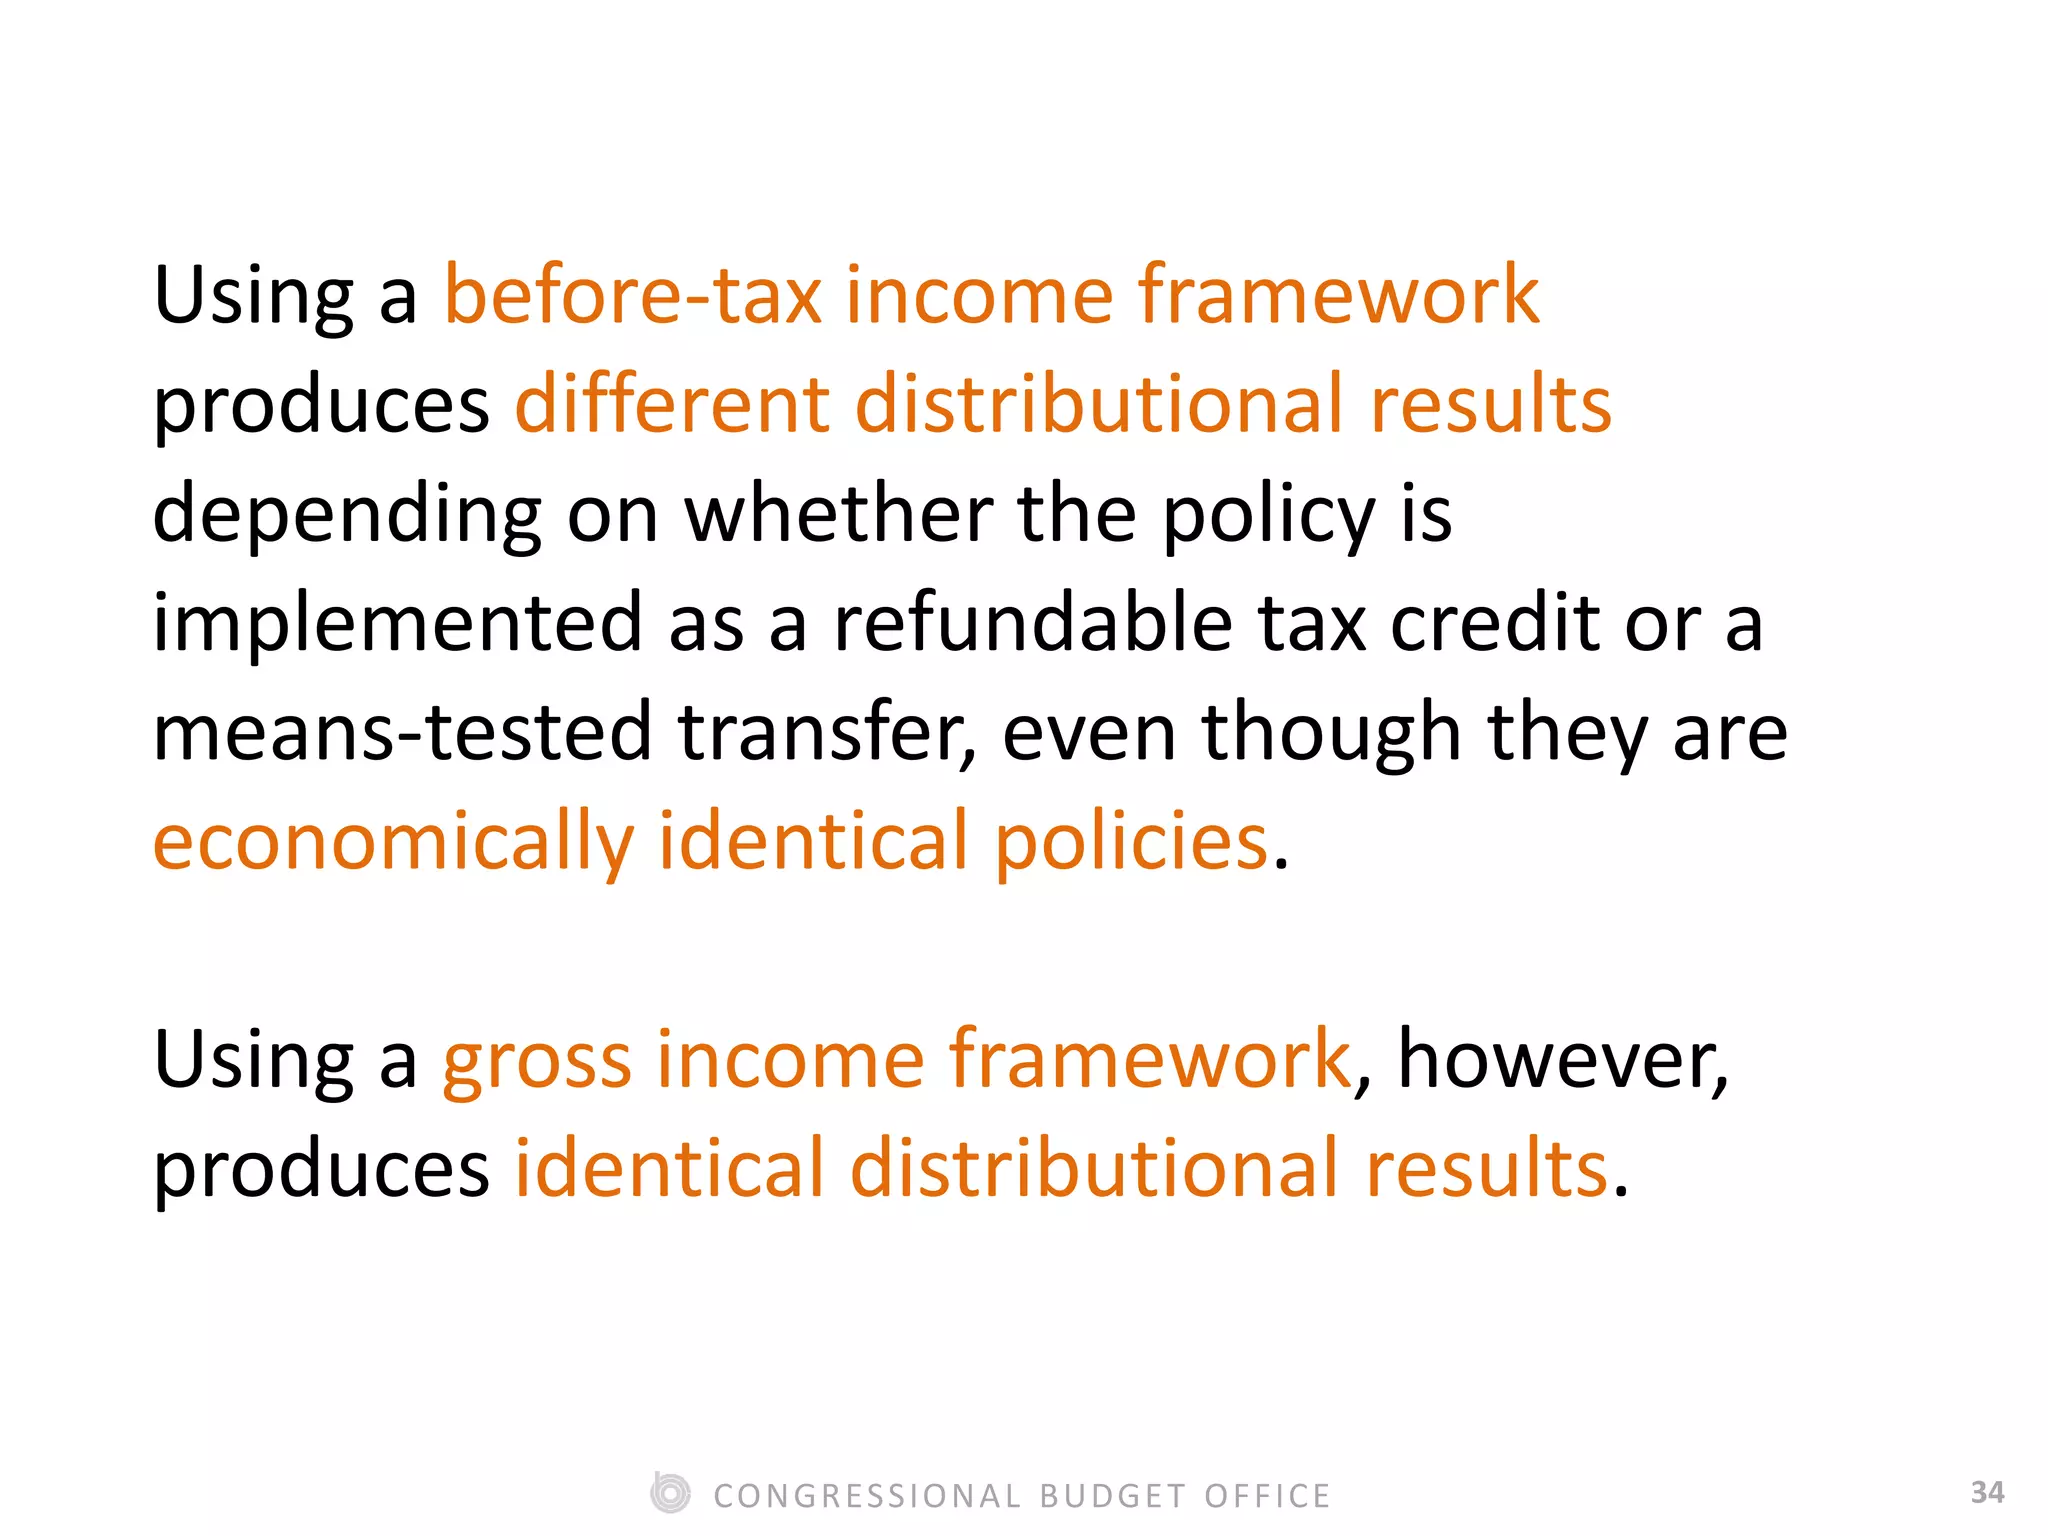
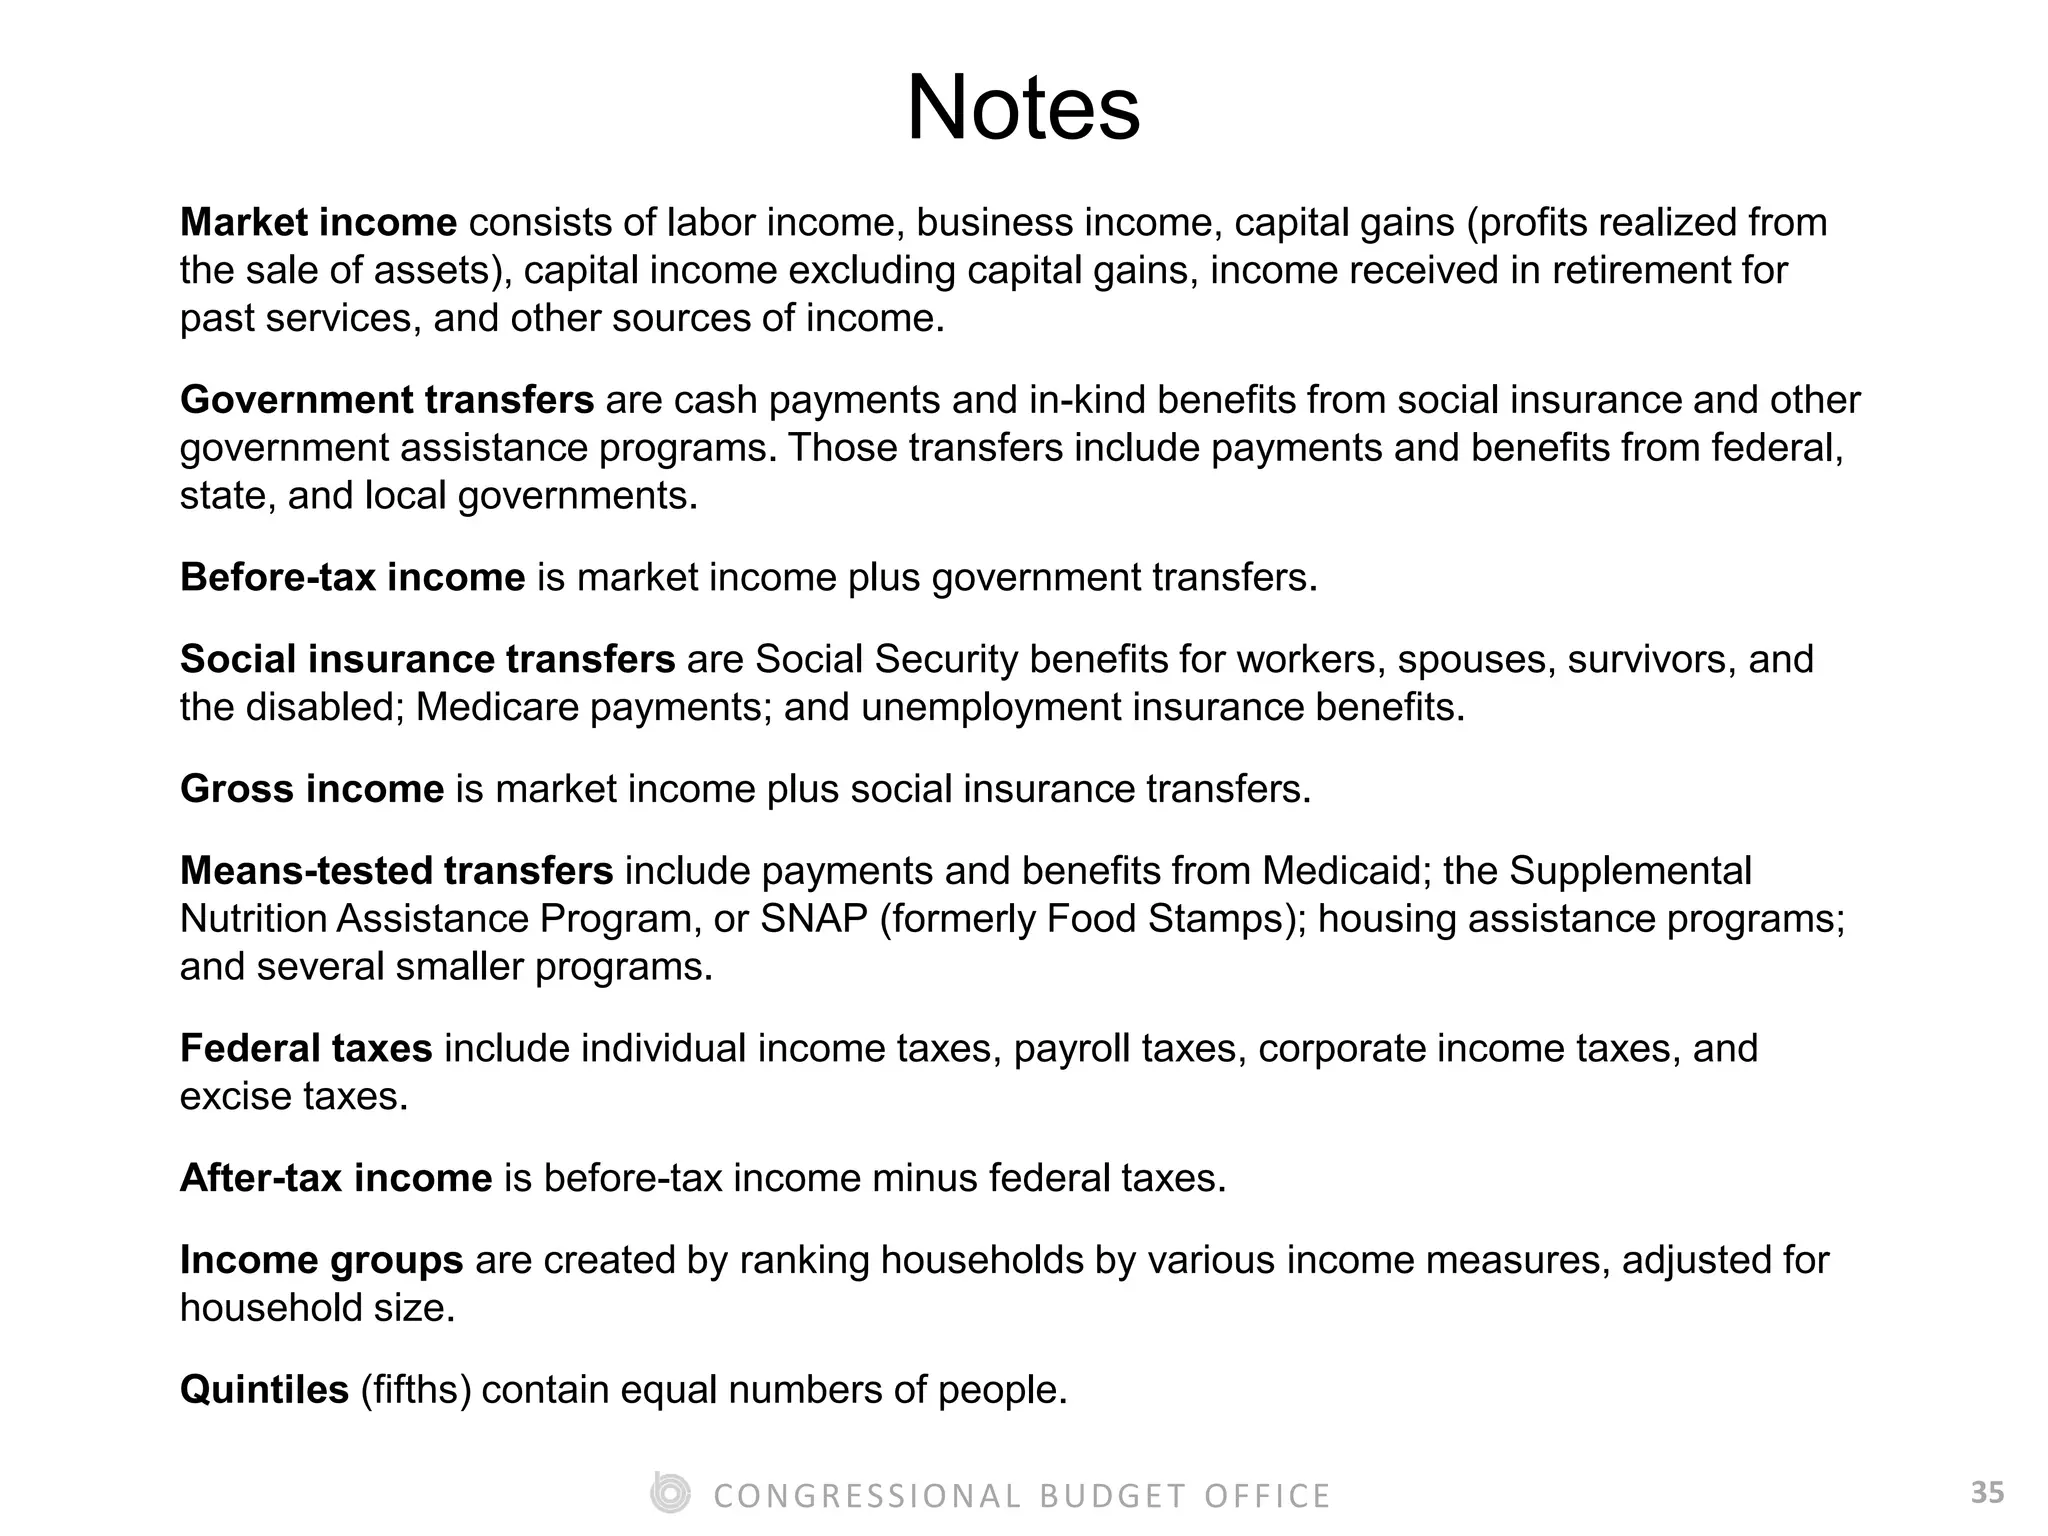
Congressional Budget Office
Annual Meeting of the Allied Social Science Associations
San Francisco, California
January 4, 2016
Kevin Perese
Principal Analyst, Tax Analysis Division
Frameworks for Distributional Analyses
1CONGRESSIONAL BUDGET OFFICE
Frameworks for Distributional Analyses
by
Edward Harris
Kevin Perese
Joshua Shakin
The information in this presentation is preliminary and
is being circulated to stimulate discussion and critical
comment as developmental work for analysis for the
Congress.
2CONGRESSIONAL BUDGET OFFICE
Distributional Analyses Have
Historically Been Tax-Centric
3CONGRESSIONAL BUDGET OFFICE
• Everyone pays taxes
(either directly or indirectly).
• There are explicit
progressive/redistributive properties in
the tax system.
• There are high-quality tax data.
• There is a lot of theoretical work on tax
incidence in the economics literature.
Why?
Distributional Analyses Have
Historically Been Tax-Centric
4CONGRESSIONAL BUDGET OFFICE
• Joint Committee on Taxation
• Congressional Budget Office, Tax Analysis Division
• Treasury Department, Office of Tax Analysis
• Tax Policy Center (Urban Institute/Brookings Institution)
Who Has Been Performing These Analyses?
Distributional Analyses Have
Historically Been Tax-Centric
5CONGRESSIONAL BUDGET OFFICE
But there’s more to government than just taxes.
Our goal is to use a framework that allows for
the analysis of the distributional effects of
government transfers while dealing with the
effects of large intergenerational transfer
programs in cross-sectional analyses of
household income.
6CONGRESSIONAL BUDGET OFFICE
CBO’s Current
Distributional Framework
(Based on Before-Tax Income)
7CONGRESSIONAL BUDGET OFFICE
Market
Income
Before-Tax
Income
After-Tax
Income
Cash and In-Kind
Govt. Transfers
Direct and Indirect
Federal Taxes
‒
=+
=
CBO’s Current Distributional Framework
Used to rank households and
as the denominator in average
tax rate calculations
8CONGRESSIONAL BUDGET OFFICE
Quintiles
Lowest Second Middle Fourth Highest All Households
Market Income 14,700 28,800 49,400 79,700 234,100 81,400
+ Government
Transfers 7,100 12,300 12,100 10,400 8,900 10,200
= Before-Tax
Income 21,800 41,100 61,500 90,000 243,000 91,600
− Federal Taxes 1,300 4,000 8,600 16,100 62,500 18,700
= After-Tax
Income 20,600 37,100 52,900 73,900 180,400 72,800
Average Federal
Tax Rate
(Percentage of
Before-Tax
Income) 5.7 9.8 14.1 17.9 25.7 20.5
Dollars
Distribution of Household Income, Government Transfers,
and Federal Taxes, 2006
(CBO’s Current Distributional Framework)
9CONGRESSIONAL BUDGET OFFICE
CBO’s Current Distributional Framework
Strengths Shortcomings
• Before-tax income, a broad
income measure, is a proxy
for both overall economic
well-being and ability to pay
tax liabilities.
• Before-tax income is
therefore an appropriate
denominator for calculating
average tax rates.
• Because before-tax income
includes government
transfers, retired households
are relatively evenly spread
among before-tax income
groups.
• The framework is tax-centric,
so it doesn’t allow for
analysis of government
transfers—that is, analysts
cannot calculate meaningful
transfer rates or net tax and
transfer rates.
• Therefore, the redistributive
properties of transfers and
taxes are not treated equally.
10CONGRESSIONAL BUDGET OFFICE
Market Income
Distributional Framework
11CONGRESSIONAL BUDGET OFFICE
Market
Income
Before-Tax
Income
After-Tax
Income
Cash and In-Kind
Govt. Transfers
Direct and Indirect
Federal Taxes
‒
=+
=
Market Income Distributional Framework
Used to rank households and
as the denominator in average
tax rate calculations
12CONGRESSIONAL BUDGET OFFICE
Market Income Distributional Framework
Strengths Shortcomings
• Market income is an intuitive
measure of pre-government
income.
• The framework lets analysts
calculate transfer rates, tax
rates, and net tax and
transfer rates.
• “Market income” suggests no
government intervention,
but the measure includes the
effects of other, less direct
governmental policies.
• Market income is not a good
proxy for overall economic
well-being and ability to pay
tax liabilities.
• Life-cycle patterns in market
income make retired people
appear poor in cross-
sectional analyses.
13CONGRESSIONAL BUDGET OFFICE
After-Tax Income
Distributional Framework
14CONGRESSIONAL BUDGET OFFICE
Market
Income
Before-Tax
Income
After-Tax
Income
Cash and In-Kind
Govt. Transfers
Direct and Indirect
Federal Taxes
‒
=+
=
After-Tax Income Distributional Framework
Used to rank households and
as the denominator in average
tax rate calculations
15CONGRESSIONAL BUDGET OFFICE
After-Tax Income Distributional Framework
Strengths Shortcomings
• After-tax income is a proxy
for overall economic well-
being.
• It can be used as a
benchmark for how income
inequality is changing over
time regardless of source
(market income, transfers, or
taxes).
• After-tax income is not an
appropriate denominator for
calculating tax or transfer
rates because taxes and
transfers are included in it.
16CONGRESSIONAL BUDGET OFFICE
Trying to Strike a Balance
17CONGRESSIONAL BUDGET OFFICE
Cross-Sectional
Analysis
Large Intergenerational
Transfers
Trying to Strike a Balance
18CONGRESSIONAL BUDGET OFFICE
Gross Income
Distributional Framework
19CONGRESSIONAL BUDGET OFFICE
Market
Income
Before-Tax
Income
After-Tax
Income
Social Insurance
Transfers
Direct and Indirect
Federal Taxes
‒ =
Gross Income Distributional Framework
Gross
Income
Means-Tested
Transfers
= =++
Used to rank households and
as the denominator in average
tax rate calculations
20CONGRESSIONAL BUDGET OFFICE
Gross Income Distributional Framework
Strengths Shortcomings
• The framework allows
analysts to calculate means-
tested transfer rates, tax
rates, and net tax and
transfer rates.
• It accounts for life-cycle
income patterns caused by
the receipt of social
insurance benefits.
• Gross income does not fully
represent people’s ability to
pay their tax liabilities.
• There is some redistribution
in social insurance programs
that the framework does not
capture.
• Social insurance benefits and
the taxes that finance them
are not treated equally.
• Not including public goods
results in an incomplete fiscal
picture when calculating net
tax and transfer rates.
21CONGRESSIONAL BUDGET OFFICE
Going From
Before-Tax Income Quintiles
to Gross Income Quintiles
Shuffles the Households.
22CONGRESSIONAL BUDGET OFFICE
Overlap Between Gross Income Quintiles and
Before-Tax Income Quintiles, 2006
Before-Tax Income Quintiles
Lowest Second Middle Fourth Highest Total
Gross
Income
Quintiles
Lowest 81.2 14.5 3.9 0.5 0.0 100
Second 18.6 73.8 6.5 1.0 0.1 100
Middle 0.0 11.2 84.7 3.9 0.2 100
Fourth 0.0 0.0 5.5 92.8 1.7 100
Highest 0.0 0.0 0.0 2.0 98.0 100
Percentage Points
23CONGRESSIONAL BUDGET OFFICE
Before-TaxIncome
Lowest Quintile Second Quintile
24CONGRESSIONAL BUDGET OFFICE
Before-TaxIncomeGrossIncome
Second QuintileLowest Quintile
25CONGRESSIONAL BUDGET OFFICE
Before-TaxIncomeGrossIncome
From Middle, Fourth,
and Highest Quintiles
Second QuintileLowest Quintile
26CONGRESSIONAL BUDGET OFFICE
Before-TaxIncomeGrossIncome
Second QuintileLowest Quintile
27CONGRESSIONAL BUDGET OFFICE
Before-TaxIncomeGrossIncome
From Middle,
Fourth, and
Highest
Quintiles
Second QuintileLowest Quintile
28CONGRESSIONAL BUDGET OFFICE
A Hypothetical Policy Change
A targeted payment of $3,000 to households below
100 percent of the federal poverty guidelines that
phases out linearly between 100 percent and 400
percent of the federal poverty guidelines
29CONGRESSIONAL BUDGET OFFICE
0
500
1,000
1,500
2,000
2,500
3,000
3,500
0 50 100 150 200 250 300 350 400 450 500
Recipient’s Income as a Percentage of the Federal Poverty Guidelines
$3,500
A Hypothetical Policy ChangeGovernmentBenefitReceived
30CONGRESSIONAL BUDGET OFFICE
What are the distributional effects of such a
policy (implemented as a means-tested
transfer program or as a refundable tax credit)
using a before-tax income framework and a
gross income framework?
31CONGRESSIONAL BUDGET OFFICE
0
500
1,000
1,500
2,000
2,500
3,000
Lowest
Quintile
Second
Quintile
Middle
Quintile
Fourth
Quintile
Highest
Quintile
All
Households
Refundable
Tax Credit
$
Change in After-Tax Income Resulting From the Hypothetical Policy
Change, Before-Tax Income Distributional Framework
32CONGRESSIONAL BUDGET OFFICE
0
500
1,000
1,500
2,000
2,500
3,000
Lowest
Quintile
Second
Quintile
Middle
Quintile
Fourth
Quintile
Highest
Quintile
All
Households
Refundable
Tax Credit
Means-Tested
Transfer
$
Change in After-Tax Income Resulting From the Hypothetical Policy
Change, Before-Tax Income Distributional Framework
33CONGRESSIONAL BUDGET OFFICE
0
500
1,000
1,500
2,000
2,500
3,000
Lowest
Quintile
Second
Quintile
Middle
Quintile
Fourth
Quintile
Highest
Quintile
All
Households
Refundable
Tax Credit
Means-Tested
Transfer
$
Change in After-Tax Income Resulting From the Hypothetical Policy
Change, Gross Income Distributional Framework
34CONGRESSIONAL BUDGET OFFICE
Using a before-tax income framework
produces different distributional results
depending on whether the policy is
implemented as a refundable tax credit or a
means-tested transfer, even though they are
economically identical policies.
Using a gross income framework, however,
produces identical distributional results.
35CONGRESSIONAL BUDGET OFFICE
Notes
Market income consists of labor income, business income, capital gains (profits realized from
the sale of assets), capital income excluding capital gains, income received in retirement for
past services, and other sources of income.
Government transfers are cash payments and in-kind benefits from social insurance and other
government assistance programs. Those transfers include payments and benefits from federal,
state, and local governments.
Before-tax income is market income plus government transfers.
Social insurance transfers are Social Security benefits for workers, spouses, survivors, and
the disabled; Medicare payments; and unemployment insurance benefits.
Gross income is market income plus social insurance transfers.
Means-tested transfers include payments and benefits from Medicaid; the Supplemental
Nutrition Assistance Program, or SNAP (formerly Food Stamps); housing assistance programs;
and several smaller programs.
Federal taxes include individual income taxes, payroll taxes, corporate income taxes, and
excise taxes.
After-tax income is before-tax income minus federal taxes.
Income groups are created by ranking households by various income measures, adjusted for
household size.
Quintiles (fifths) contain equal numbers of people.

Frameworks for Distributional Analyses

  • 1.
    Congressional Budget Office AnnualMeeting of the Allied Social Science Associations San Francisco, California January 4, 2016 Kevin Perese Principal Analyst, Tax Analysis Division Frameworks for Distributional Analyses
  • 2.
    1CONGRESSIONAL BUDGET OFFICE Frameworksfor Distributional Analyses by Edward Harris Kevin Perese Joshua Shakin The information in this presentation is preliminary and is being circulated to stimulate discussion and critical comment as developmental work for analysis for the Congress.
  • 3.
    2CONGRESSIONAL BUDGET OFFICE DistributionalAnalyses Have Historically Been Tax-Centric
  • 4.
    3CONGRESSIONAL BUDGET OFFICE •Everyone pays taxes (either directly or indirectly). • There are explicit progressive/redistributive properties in the tax system. • There are high-quality tax data. • There is a lot of theoretical work on tax incidence in the economics literature. Why? Distributional Analyses Have Historically Been Tax-Centric
  • 5.
    4CONGRESSIONAL BUDGET OFFICE •Joint Committee on Taxation • Congressional Budget Office, Tax Analysis Division • Treasury Department, Office of Tax Analysis • Tax Policy Center (Urban Institute/Brookings Institution) Who Has Been Performing These Analyses? Distributional Analyses Have Historically Been Tax-Centric
  • 6.
    5CONGRESSIONAL BUDGET OFFICE Butthere’s more to government than just taxes. Our goal is to use a framework that allows for the analysis of the distributional effects of government transfers while dealing with the effects of large intergenerational transfer programs in cross-sectional analyses of household income.
  • 7.
    6CONGRESSIONAL BUDGET OFFICE CBO’sCurrent Distributional Framework (Based on Before-Tax Income)
  • 8.
    7CONGRESSIONAL BUDGET OFFICE Market Income Before-Tax Income After-Tax Income Cashand In-Kind Govt. Transfers Direct and Indirect Federal Taxes ‒ =+ = CBO’s Current Distributional Framework Used to rank households and as the denominator in average tax rate calculations
  • 9.
    8CONGRESSIONAL BUDGET OFFICE Quintiles LowestSecond Middle Fourth Highest All Households Market Income 14,700 28,800 49,400 79,700 234,100 81,400 + Government Transfers 7,100 12,300 12,100 10,400 8,900 10,200 = Before-Tax Income 21,800 41,100 61,500 90,000 243,000 91,600 − Federal Taxes 1,300 4,000 8,600 16,100 62,500 18,700 = After-Tax Income 20,600 37,100 52,900 73,900 180,400 72,800 Average Federal Tax Rate (Percentage of Before-Tax Income) 5.7 9.8 14.1 17.9 25.7 20.5 Dollars Distribution of Household Income, Government Transfers, and Federal Taxes, 2006 (CBO’s Current Distributional Framework)
  • 10.
    9CONGRESSIONAL BUDGET OFFICE CBO’sCurrent Distributional Framework Strengths Shortcomings • Before-tax income, a broad income measure, is a proxy for both overall economic well-being and ability to pay tax liabilities. • Before-tax income is therefore an appropriate denominator for calculating average tax rates. • Because before-tax income includes government transfers, retired households are relatively evenly spread among before-tax income groups. • The framework is tax-centric, so it doesn’t allow for analysis of government transfers—that is, analysts cannot calculate meaningful transfer rates or net tax and transfer rates. • Therefore, the redistributive properties of transfers and taxes are not treated equally.
  • 11.
    10CONGRESSIONAL BUDGET OFFICE MarketIncome Distributional Framework
  • 12.
    11CONGRESSIONAL BUDGET OFFICE Market Income Before-Tax Income After-Tax Income Cashand In-Kind Govt. Transfers Direct and Indirect Federal Taxes ‒ =+ = Market Income Distributional Framework Used to rank households and as the denominator in average tax rate calculations
  • 13.
    12CONGRESSIONAL BUDGET OFFICE MarketIncome Distributional Framework Strengths Shortcomings • Market income is an intuitive measure of pre-government income. • The framework lets analysts calculate transfer rates, tax rates, and net tax and transfer rates. • “Market income” suggests no government intervention, but the measure includes the effects of other, less direct governmental policies. • Market income is not a good proxy for overall economic well-being and ability to pay tax liabilities. • Life-cycle patterns in market income make retired people appear poor in cross- sectional analyses.
  • 14.
    13CONGRESSIONAL BUDGET OFFICE After-TaxIncome Distributional Framework
  • 15.
    14CONGRESSIONAL BUDGET OFFICE Market Income Before-Tax Income After-Tax Income Cashand In-Kind Govt. Transfers Direct and Indirect Federal Taxes ‒ =+ = After-Tax Income Distributional Framework Used to rank households and as the denominator in average tax rate calculations
  • 16.
    15CONGRESSIONAL BUDGET OFFICE After-TaxIncome Distributional Framework Strengths Shortcomings • After-tax income is a proxy for overall economic well- being. • It can be used as a benchmark for how income inequality is changing over time regardless of source (market income, transfers, or taxes). • After-tax income is not an appropriate denominator for calculating tax or transfer rates because taxes and transfers are included in it.
  • 17.
  • 18.
    17CONGRESSIONAL BUDGET OFFICE Cross-Sectional Analysis LargeIntergenerational Transfers Trying to Strike a Balance
  • 19.
    18CONGRESSIONAL BUDGET OFFICE GrossIncome Distributional Framework
  • 20.
    19CONGRESSIONAL BUDGET OFFICE Market Income Before-Tax Income After-Tax Income SocialInsurance Transfers Direct and Indirect Federal Taxes ‒ = Gross Income Distributional Framework Gross Income Means-Tested Transfers = =++ Used to rank households and as the denominator in average tax rate calculations
  • 21.
    20CONGRESSIONAL BUDGET OFFICE GrossIncome Distributional Framework Strengths Shortcomings • The framework allows analysts to calculate means- tested transfer rates, tax rates, and net tax and transfer rates. • It accounts for life-cycle income patterns caused by the receipt of social insurance benefits. • Gross income does not fully represent people’s ability to pay their tax liabilities. • There is some redistribution in social insurance programs that the framework does not capture. • Social insurance benefits and the taxes that finance them are not treated equally. • Not including public goods results in an incomplete fiscal picture when calculating net tax and transfer rates.
  • 22.
    21CONGRESSIONAL BUDGET OFFICE GoingFrom Before-Tax Income Quintiles to Gross Income Quintiles Shuffles the Households.
  • 23.
    22CONGRESSIONAL BUDGET OFFICE OverlapBetween Gross Income Quintiles and Before-Tax Income Quintiles, 2006 Before-Tax Income Quintiles Lowest Second Middle Fourth Highest Total Gross Income Quintiles Lowest 81.2 14.5 3.9 0.5 0.0 100 Second 18.6 73.8 6.5 1.0 0.1 100 Middle 0.0 11.2 84.7 3.9 0.2 100 Fourth 0.0 0.0 5.5 92.8 1.7 100 Highest 0.0 0.0 0.0 2.0 98.0 100 Percentage Points
  • 24.
  • 25.
  • 26.
    25CONGRESSIONAL BUDGET OFFICE Before-TaxIncomeGrossIncome FromMiddle, Fourth, and Highest Quintiles Second QuintileLowest Quintile
  • 27.
  • 28.
    27CONGRESSIONAL BUDGET OFFICE Before-TaxIncomeGrossIncome FromMiddle, Fourth, and Highest Quintiles Second QuintileLowest Quintile
  • 29.
    28CONGRESSIONAL BUDGET OFFICE AHypothetical Policy Change A targeted payment of $3,000 to households below 100 percent of the federal poverty guidelines that phases out linearly between 100 percent and 400 percent of the federal poverty guidelines
  • 30.
    29CONGRESSIONAL BUDGET OFFICE 0 500 1,000 1,500 2,000 2,500 3,000 3,500 050 100 150 200 250 300 350 400 450 500 Recipient’s Income as a Percentage of the Federal Poverty Guidelines $3,500 A Hypothetical Policy ChangeGovernmentBenefitReceived
  • 31.
    30CONGRESSIONAL BUDGET OFFICE Whatare the distributional effects of such a policy (implemented as a means-tested transfer program or as a refundable tax credit) using a before-tax income framework and a gross income framework?
  • 32.
    31CONGRESSIONAL BUDGET OFFICE 0 500 1,000 1,500 2,000 2,500 3,000 Lowest Quintile Second Quintile Middle Quintile Fourth Quintile Highest Quintile All Households Refundable TaxCredit $ Change in After-Tax Income Resulting From the Hypothetical Policy Change, Before-Tax Income Distributional Framework
  • 33.
    32CONGRESSIONAL BUDGET OFFICE 0 500 1,000 1,500 2,000 2,500 3,000 Lowest Quintile Second Quintile Middle Quintile Fourth Quintile Highest Quintile All Households Refundable TaxCredit Means-Tested Transfer $ Change in After-Tax Income Resulting From the Hypothetical Policy Change, Before-Tax Income Distributional Framework
  • 34.
    33CONGRESSIONAL BUDGET OFFICE 0 500 1,000 1,500 2,000 2,500 3,000 Lowest Quintile Second Quintile Middle Quintile Fourth Quintile Highest Quintile All Households Refundable TaxCredit Means-Tested Transfer $ Change in After-Tax Income Resulting From the Hypothetical Policy Change, Gross Income Distributional Framework
  • 35.
    34CONGRESSIONAL BUDGET OFFICE Usinga before-tax income framework produces different distributional results depending on whether the policy is implemented as a refundable tax credit or a means-tested transfer, even though they are economically identical policies. Using a gross income framework, however, produces identical distributional results.
  • 36.
    35CONGRESSIONAL BUDGET OFFICE Notes Marketincome consists of labor income, business income, capital gains (profits realized from the sale of assets), capital income excluding capital gains, income received in retirement for past services, and other sources of income. Government transfers are cash payments and in-kind benefits from social insurance and other government assistance programs. Those transfers include payments and benefits from federal, state, and local governments. Before-tax income is market income plus government transfers. Social insurance transfers are Social Security benefits for workers, spouses, survivors, and the disabled; Medicare payments; and unemployment insurance benefits. Gross income is market income plus social insurance transfers. Means-tested transfers include payments and benefits from Medicaid; the Supplemental Nutrition Assistance Program, or SNAP (formerly Food Stamps); housing assistance programs; and several smaller programs. Federal taxes include individual income taxes, payroll taxes, corporate income taxes, and excise taxes. After-tax income is before-tax income minus federal taxes. Income groups are created by ranking households by various income measures, adjusted for household size. Quintiles (fifths) contain equal numbers of people.