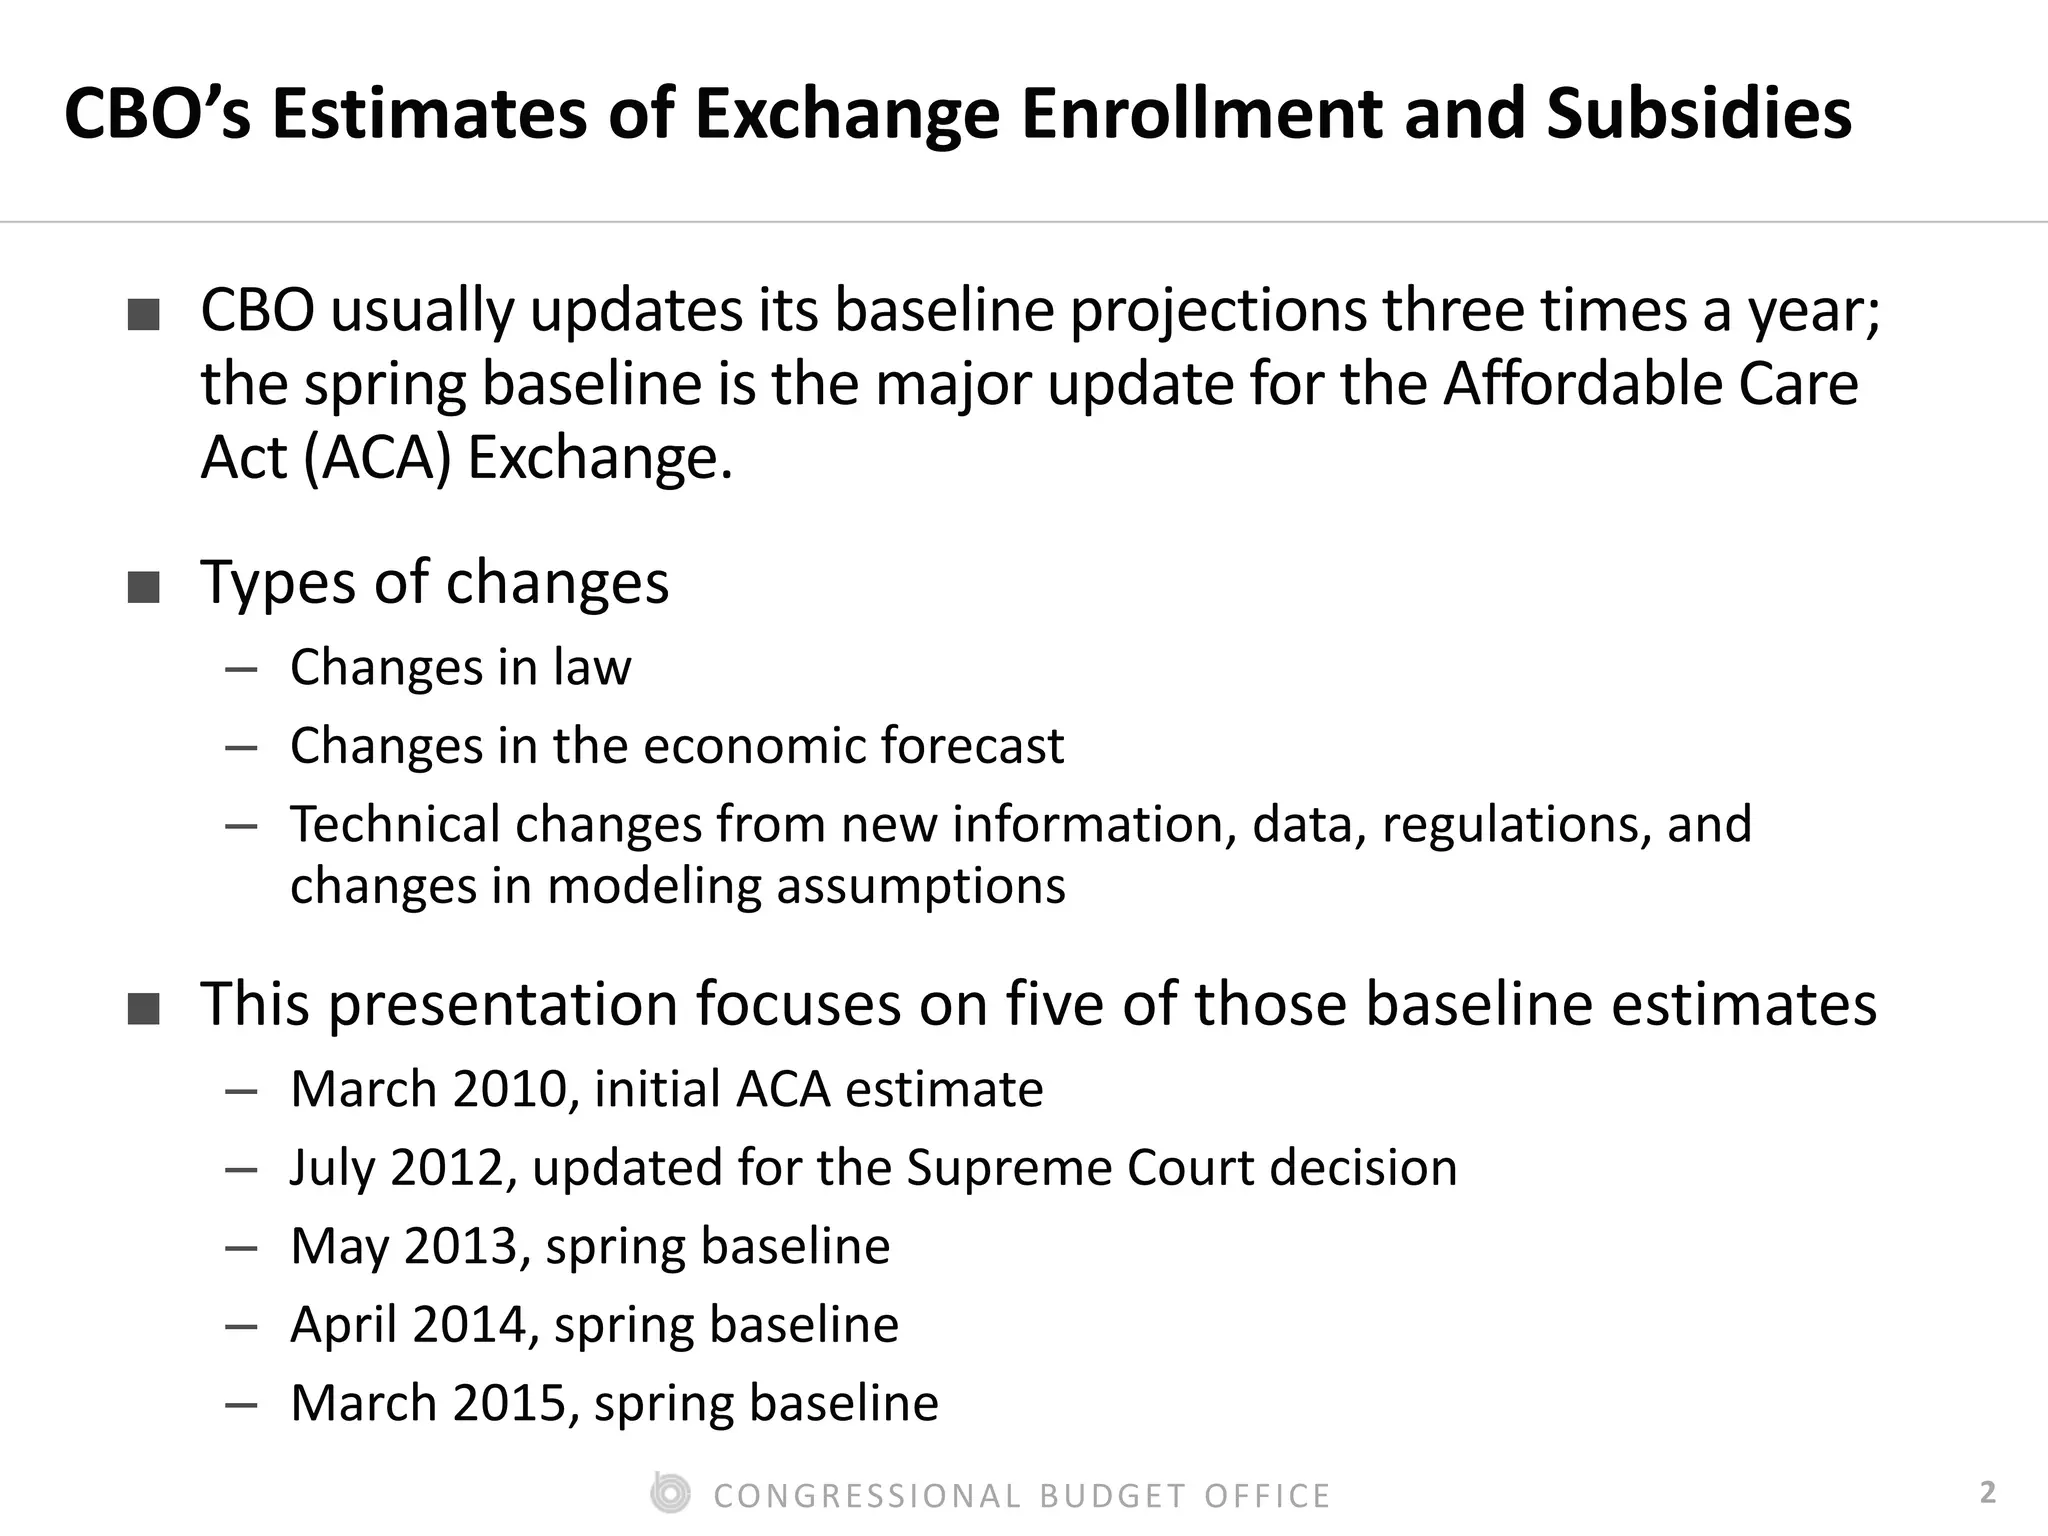
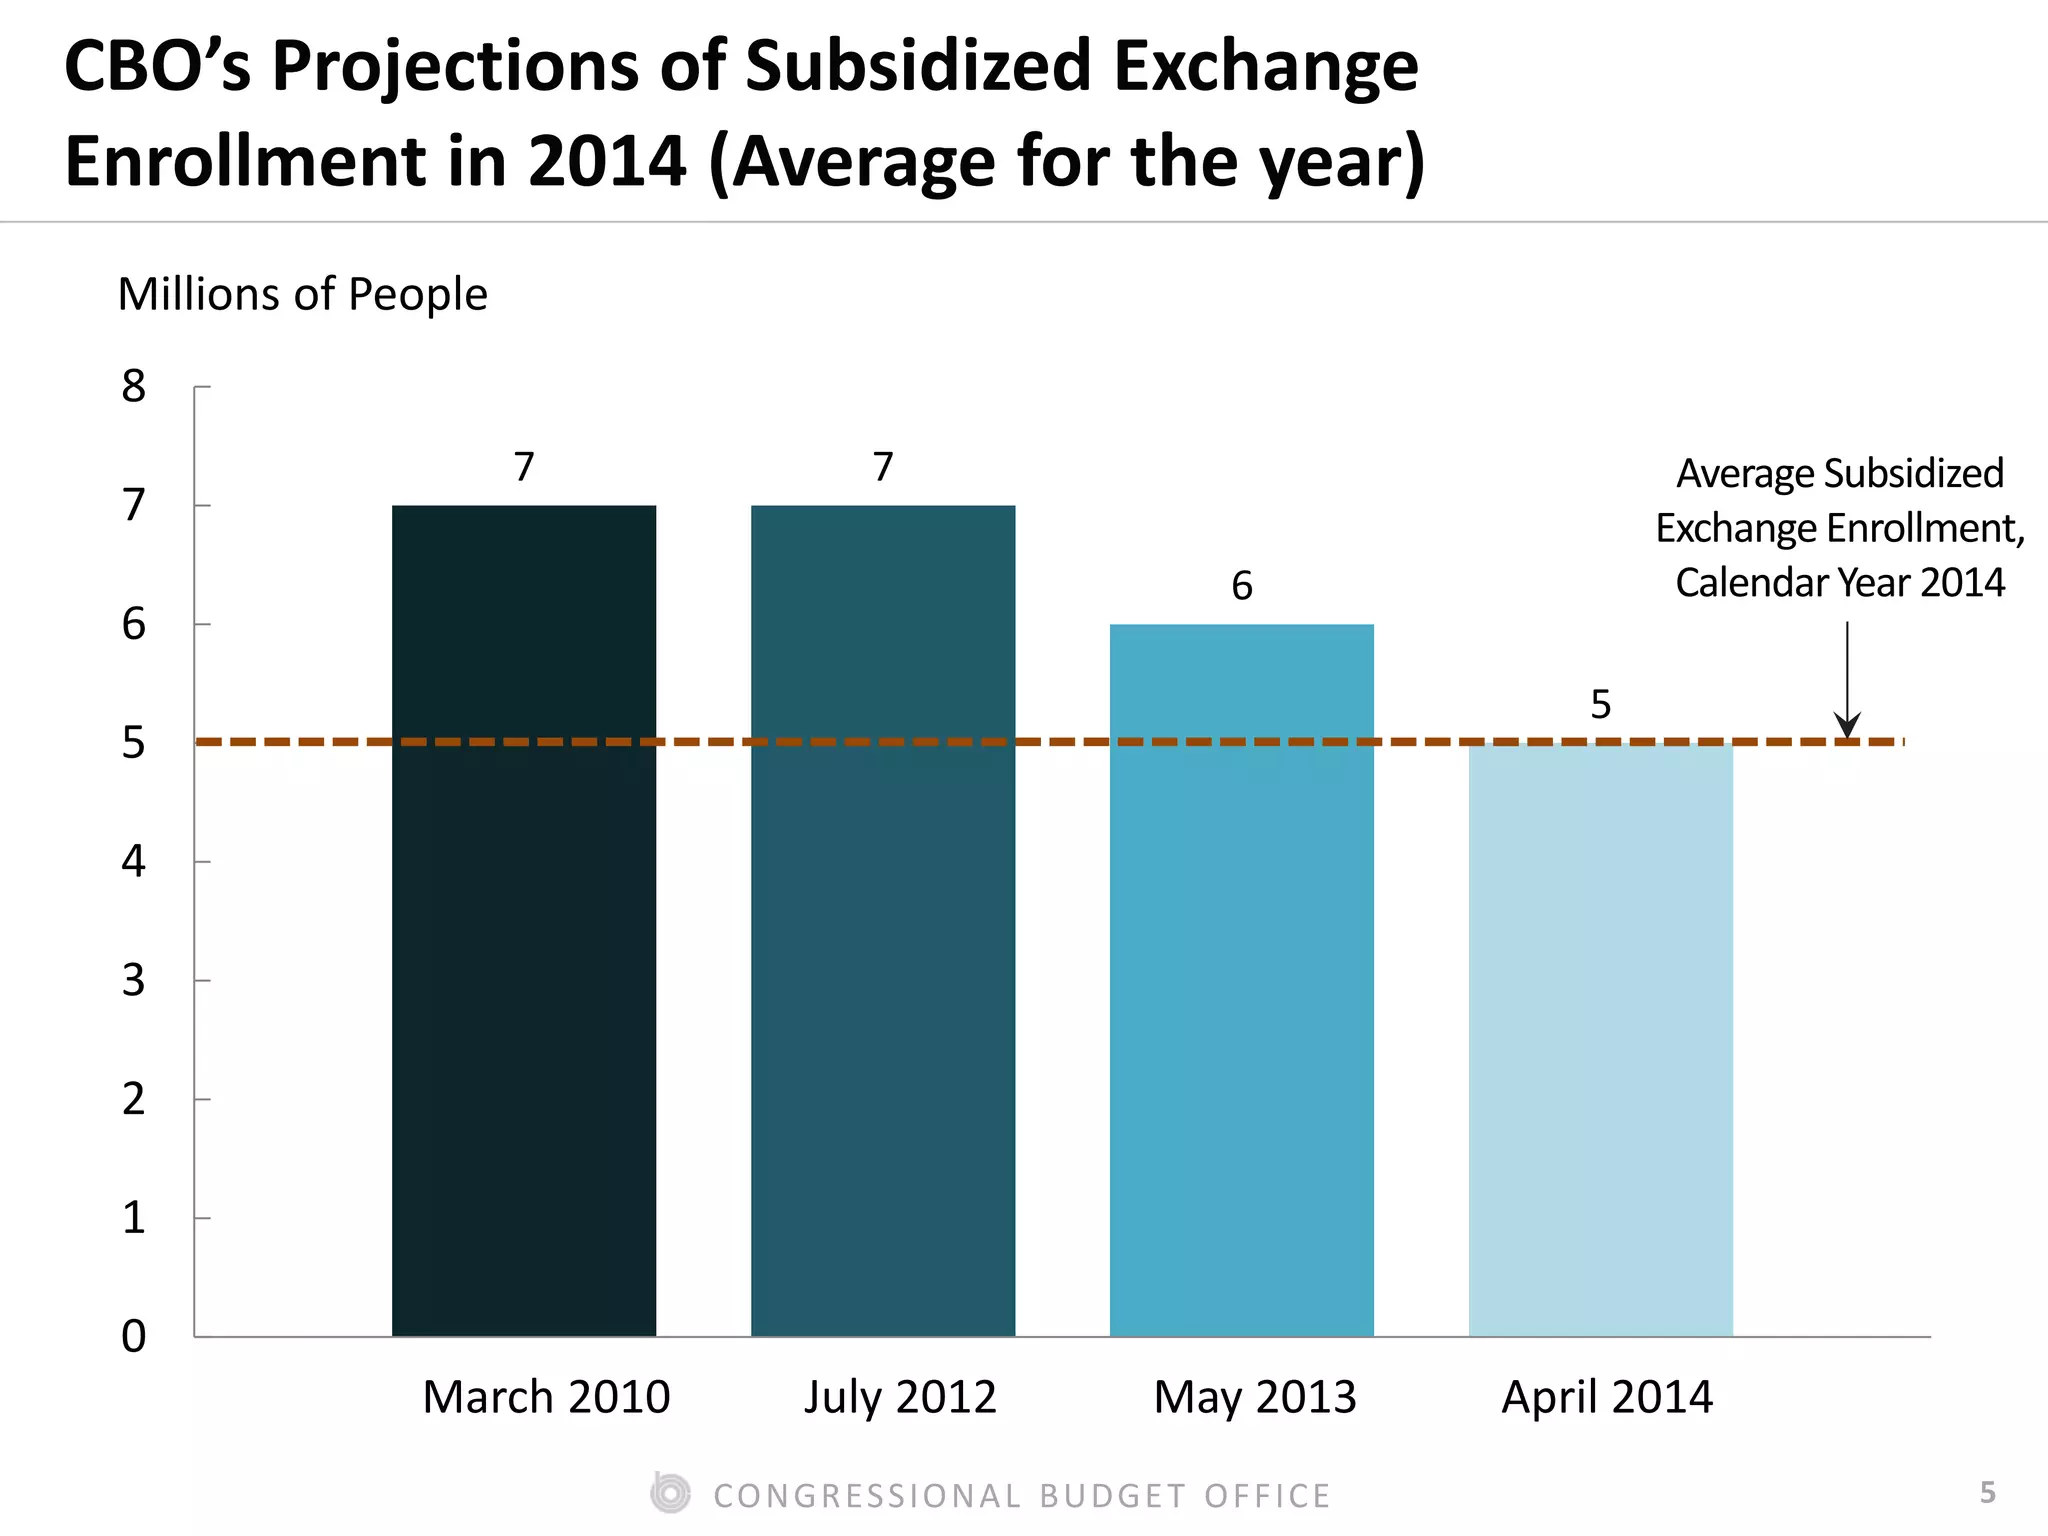
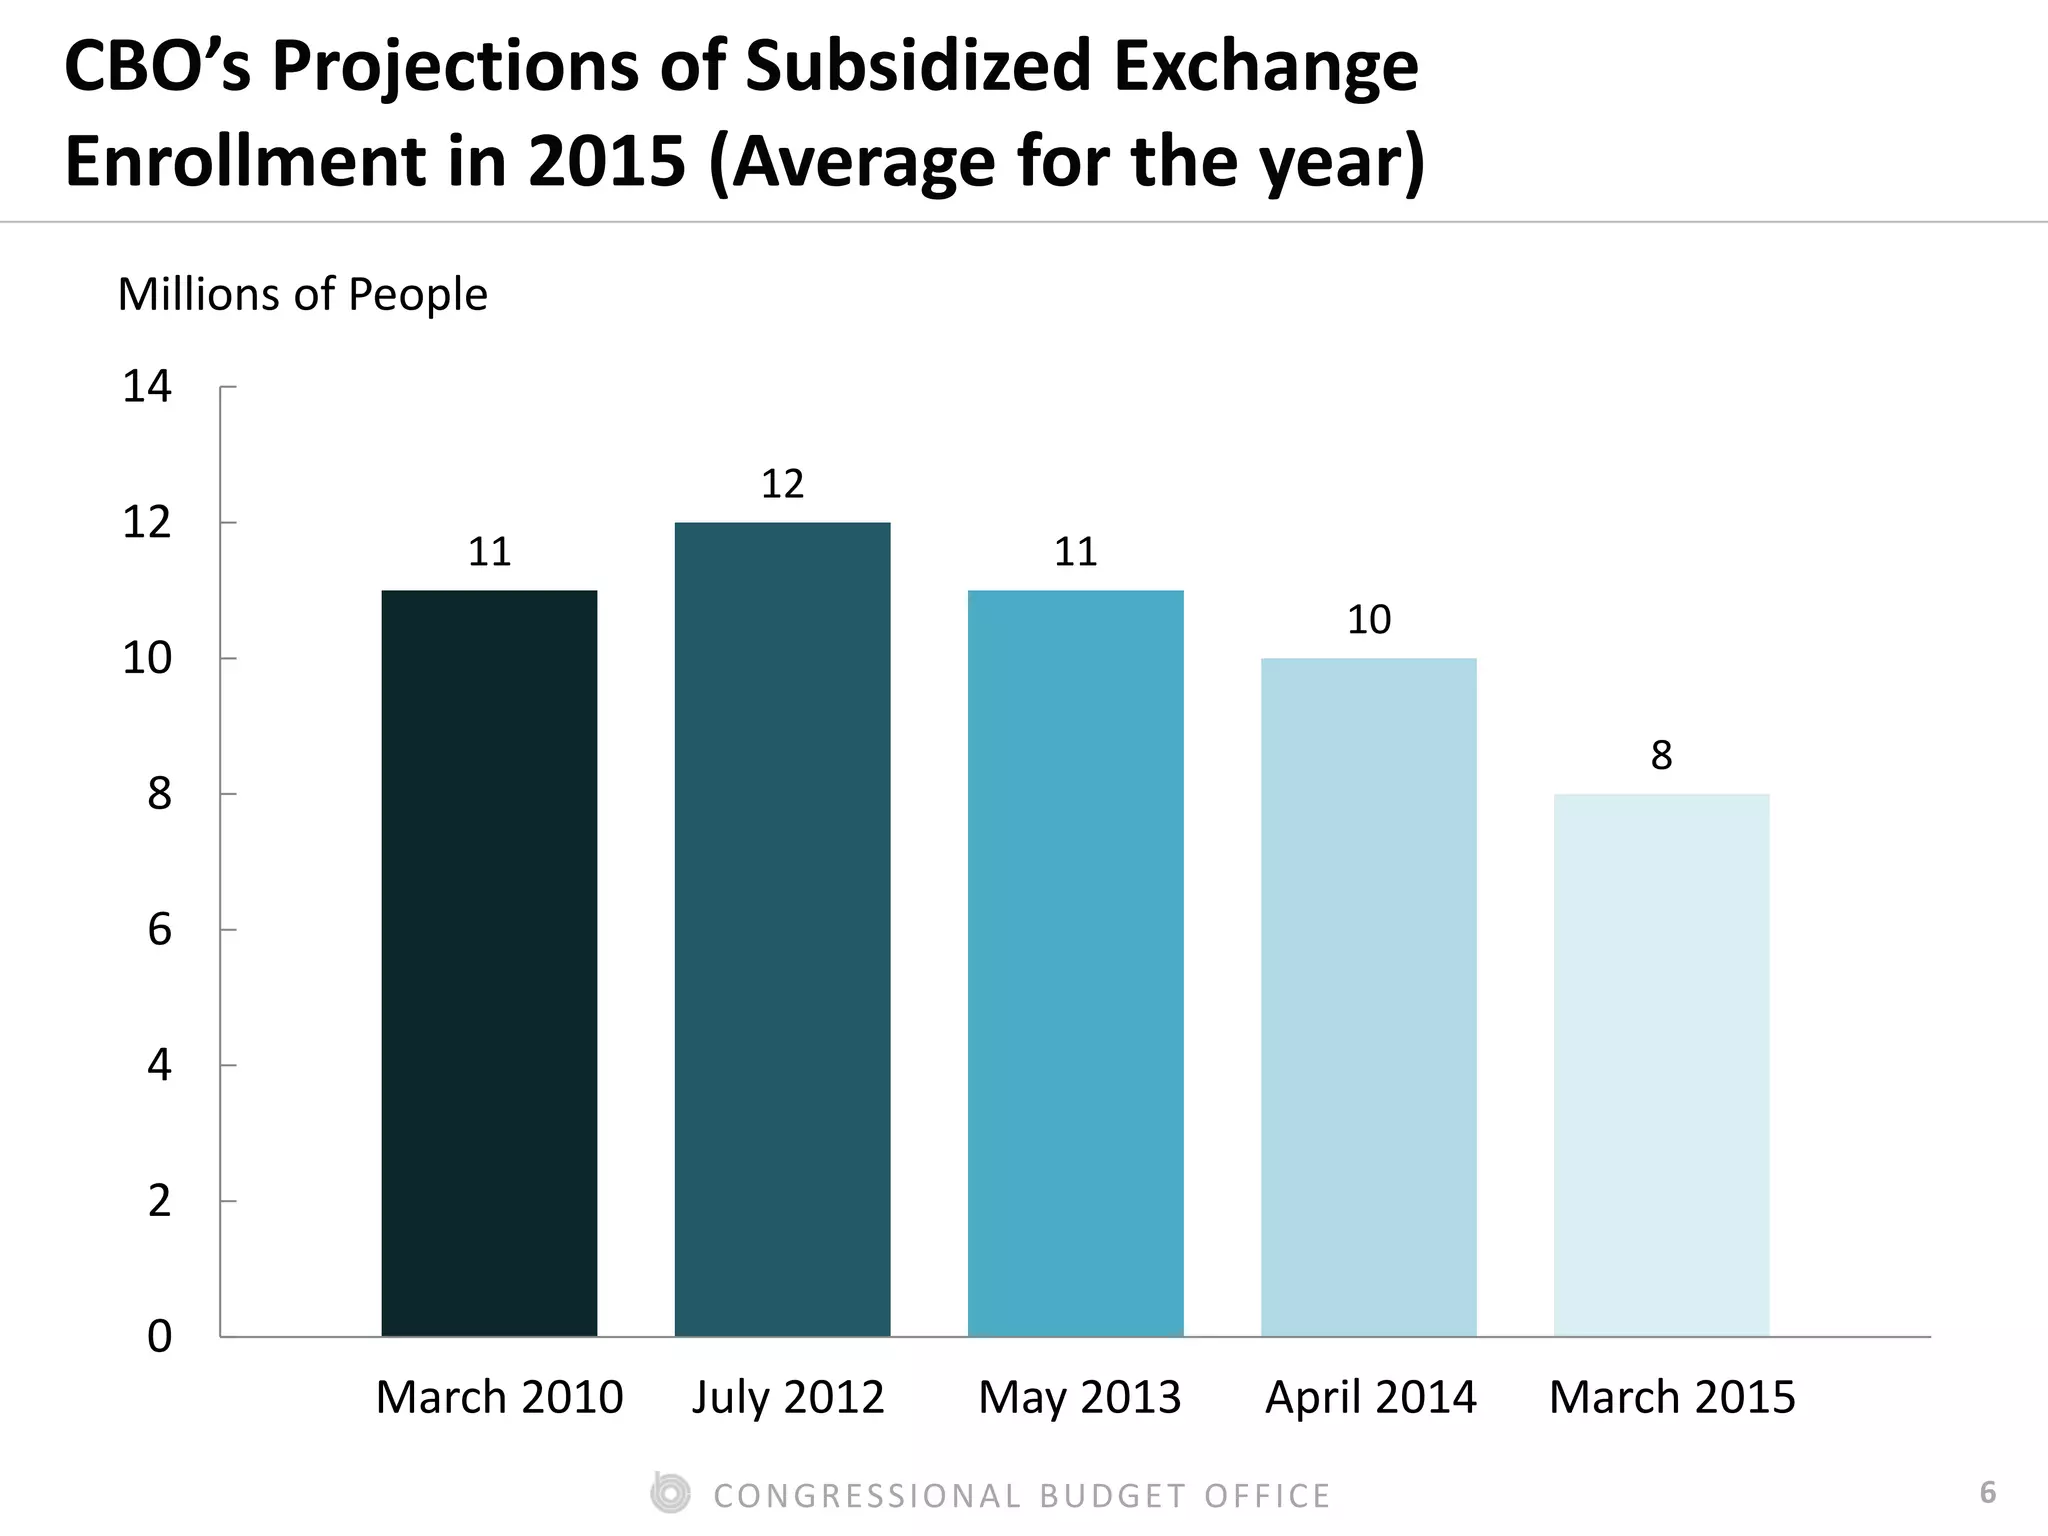
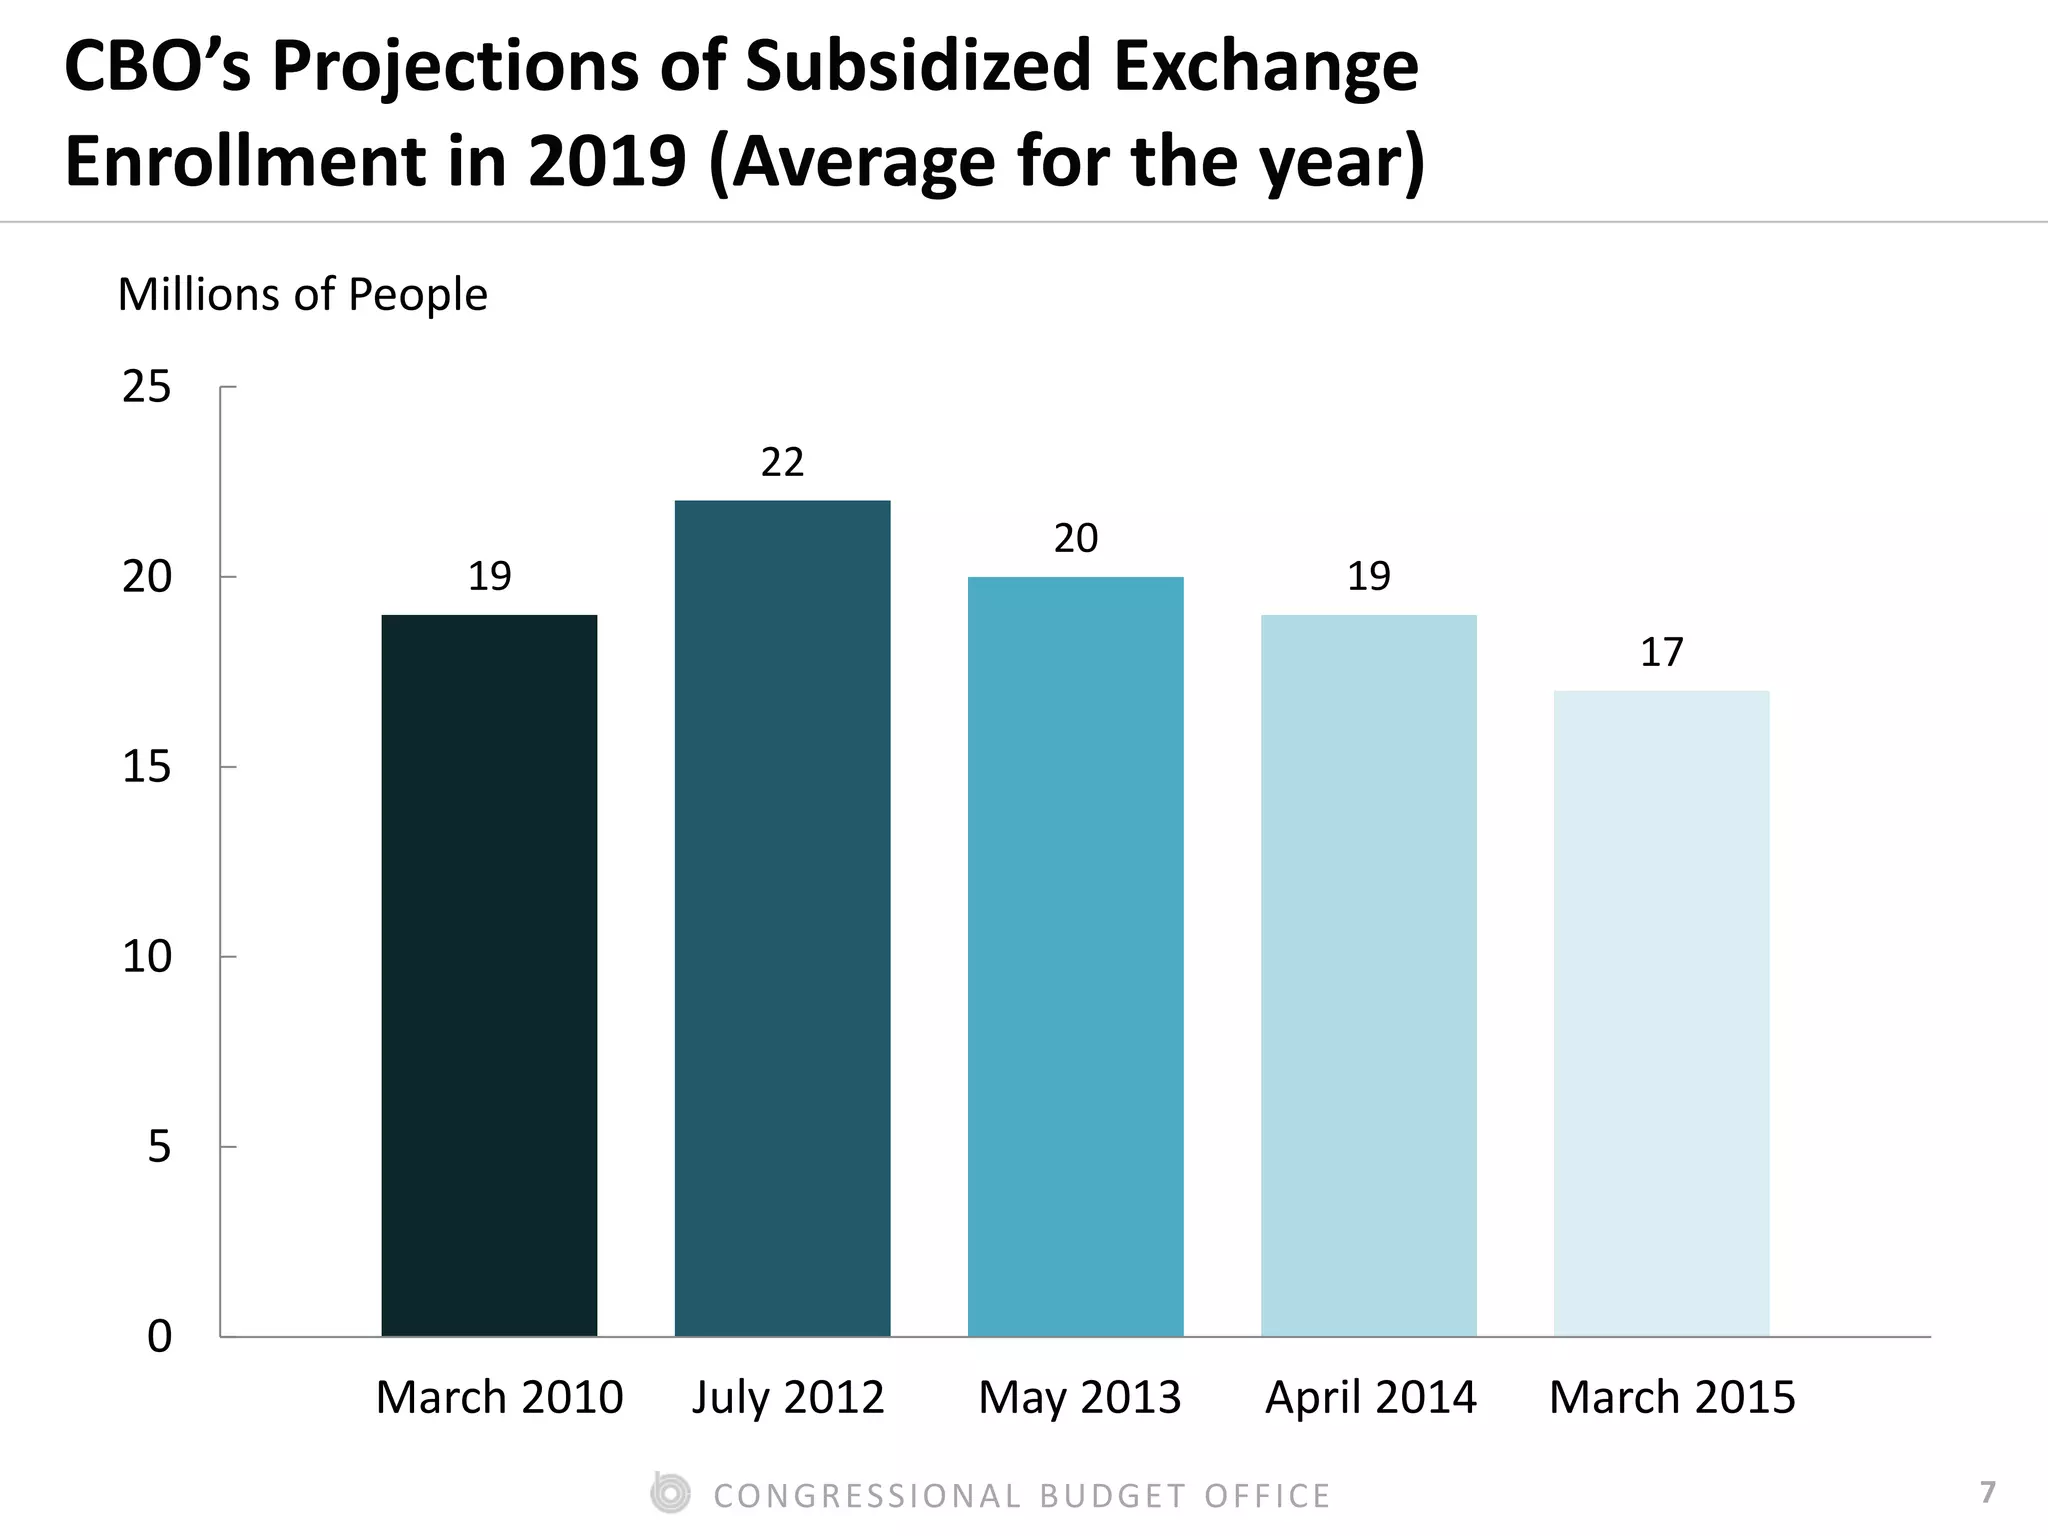
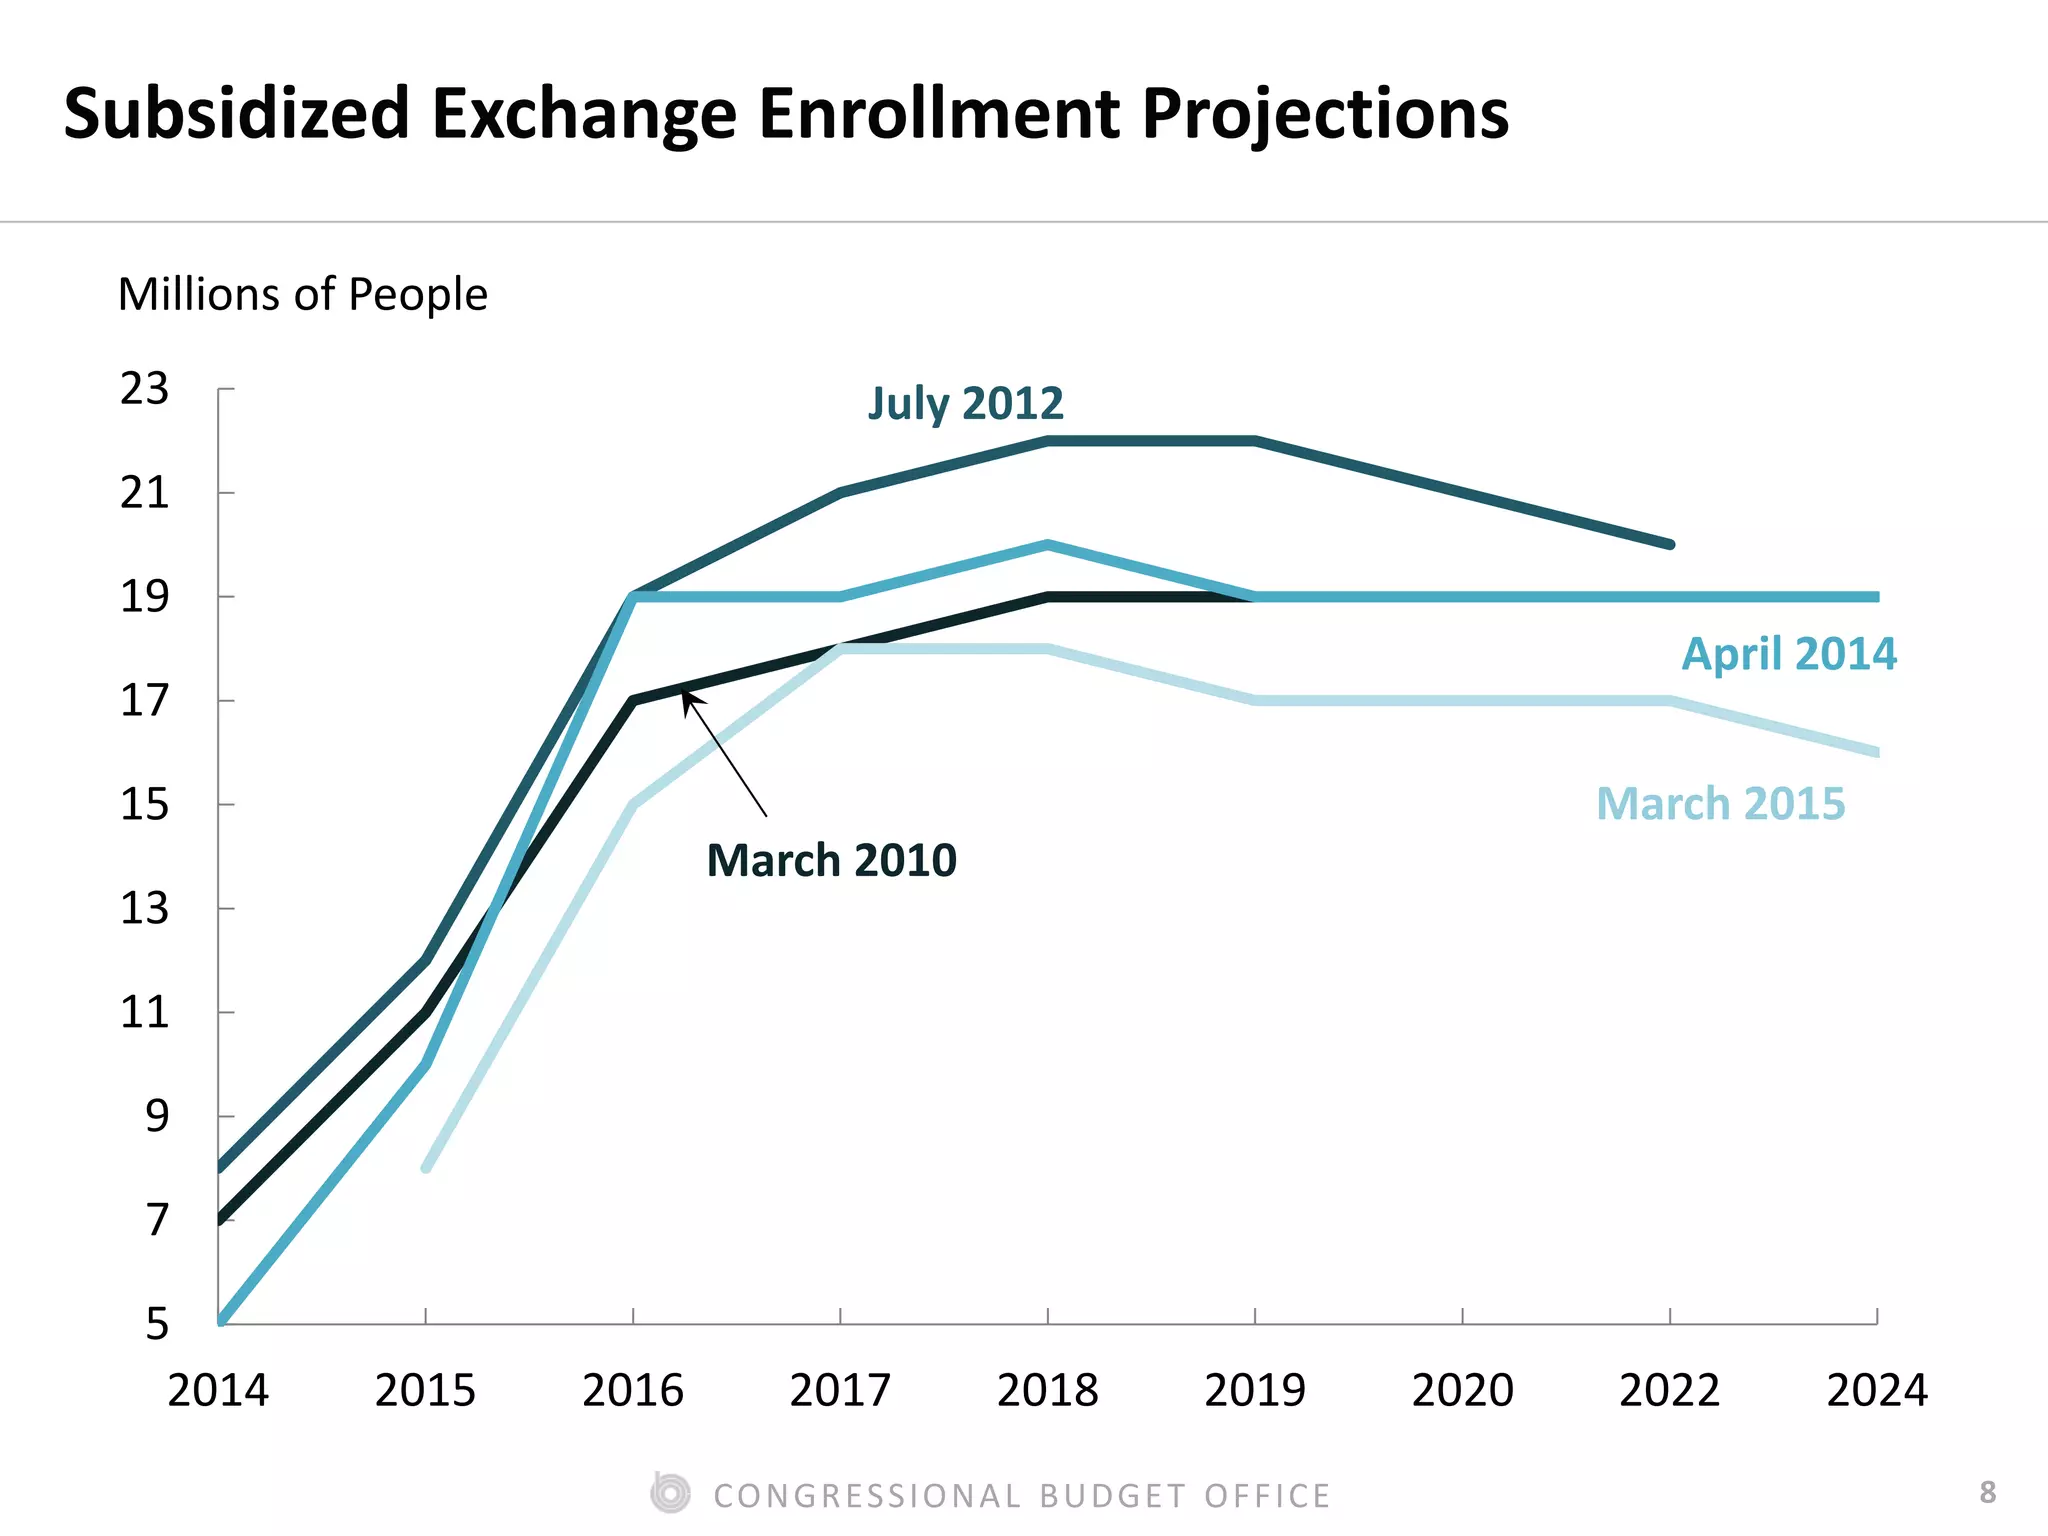
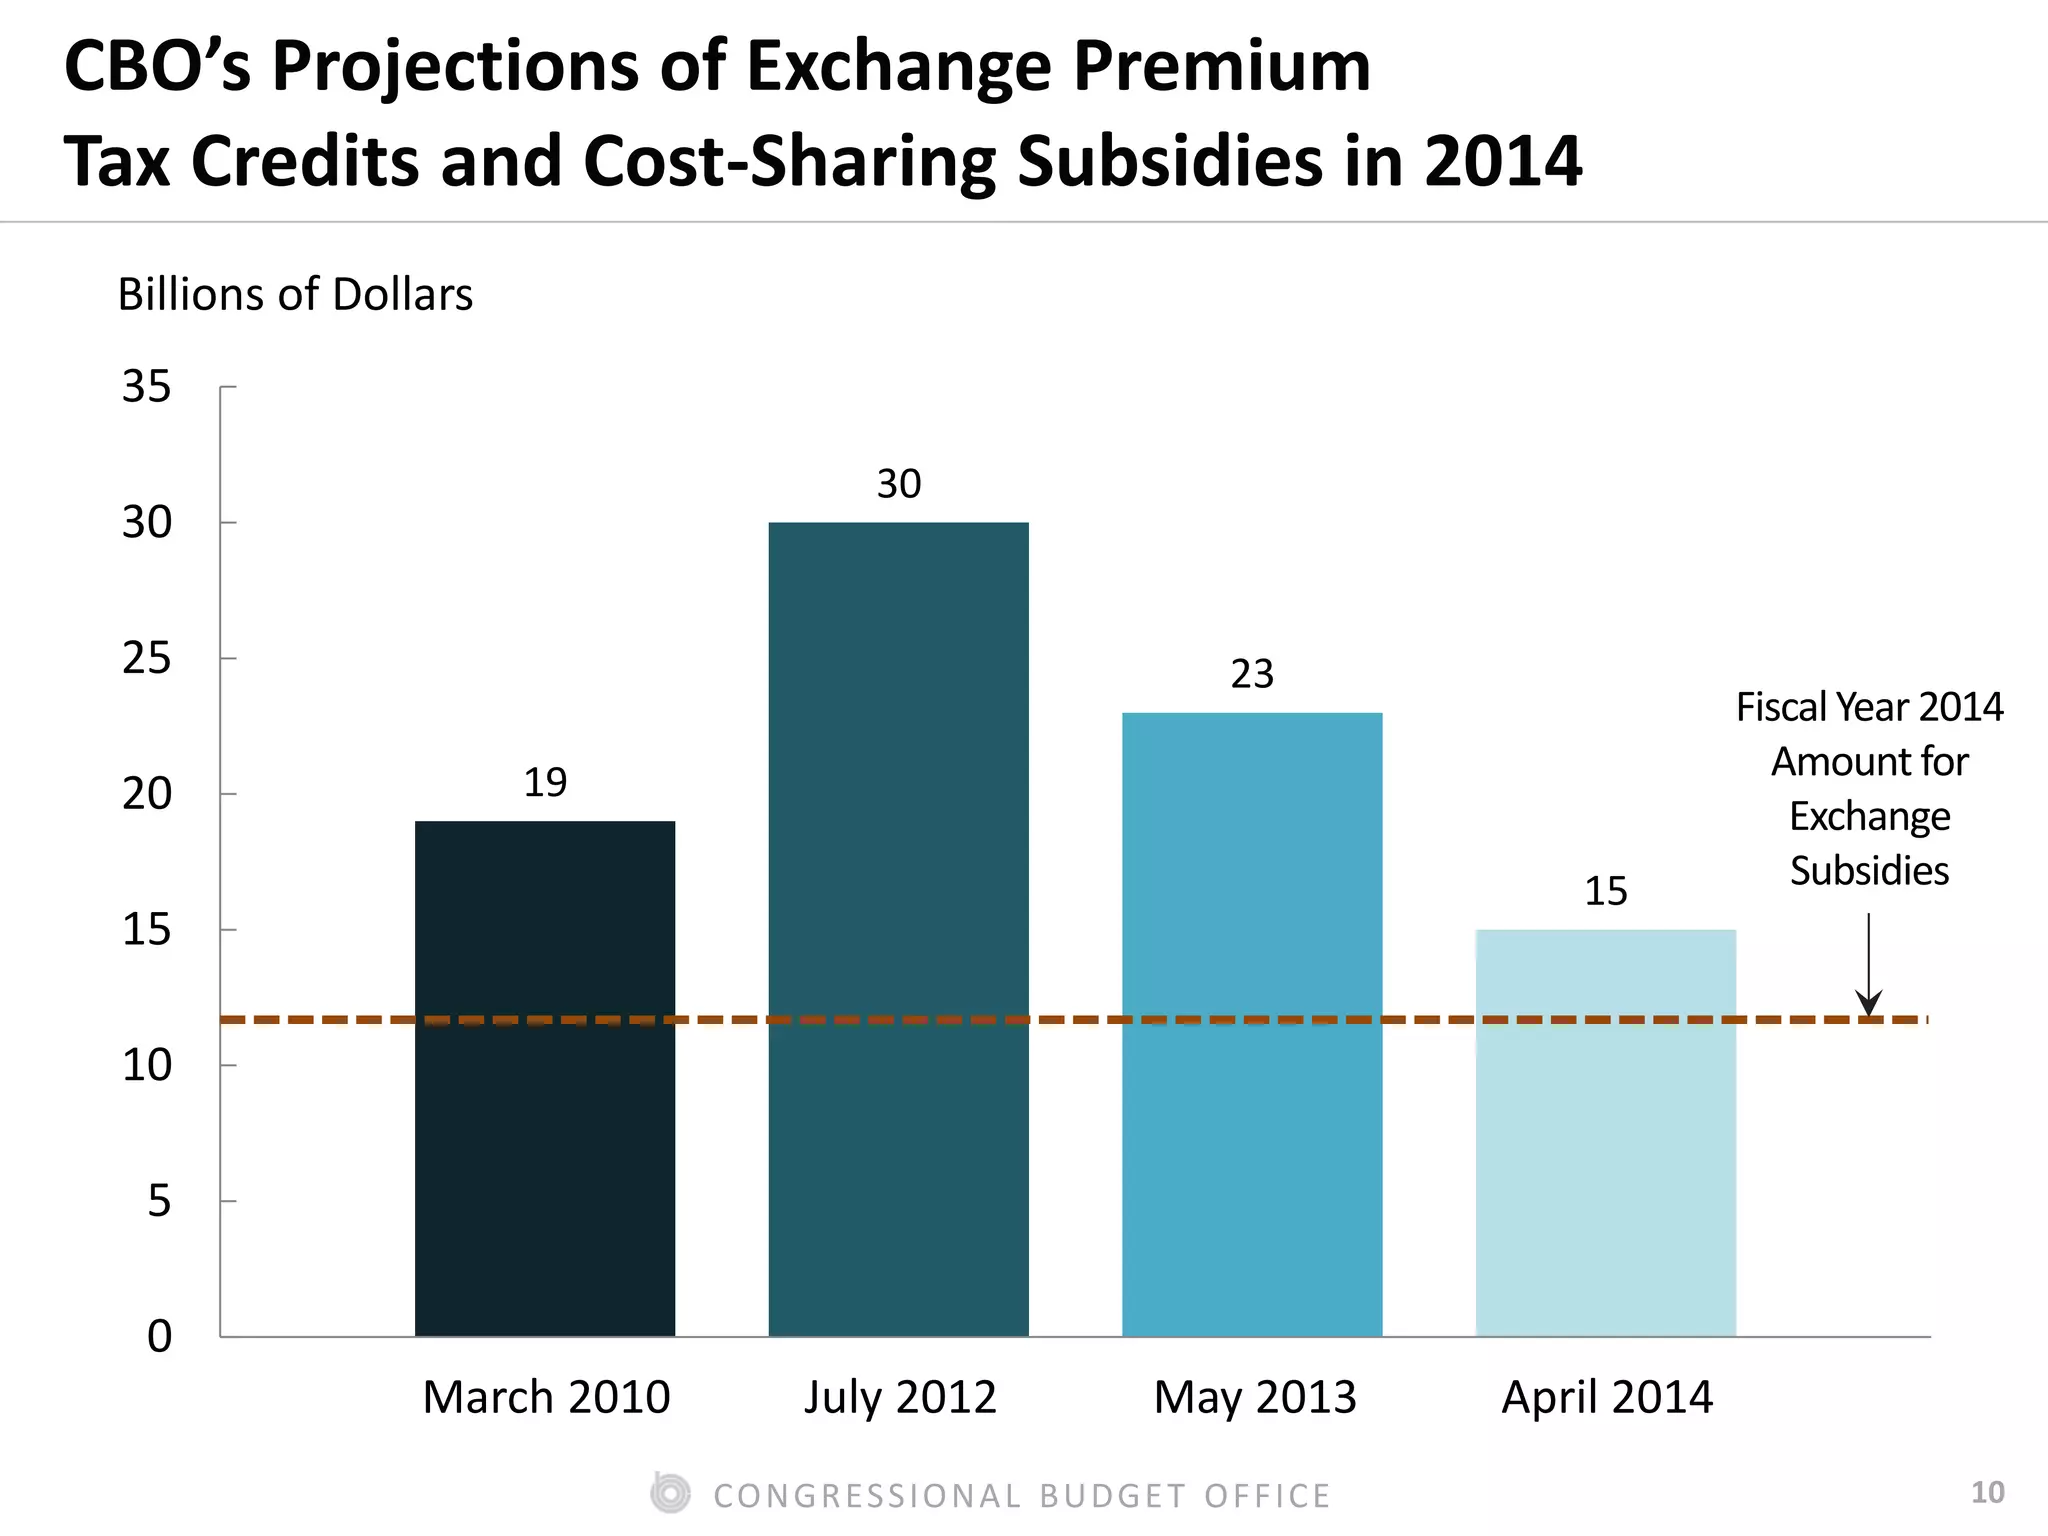
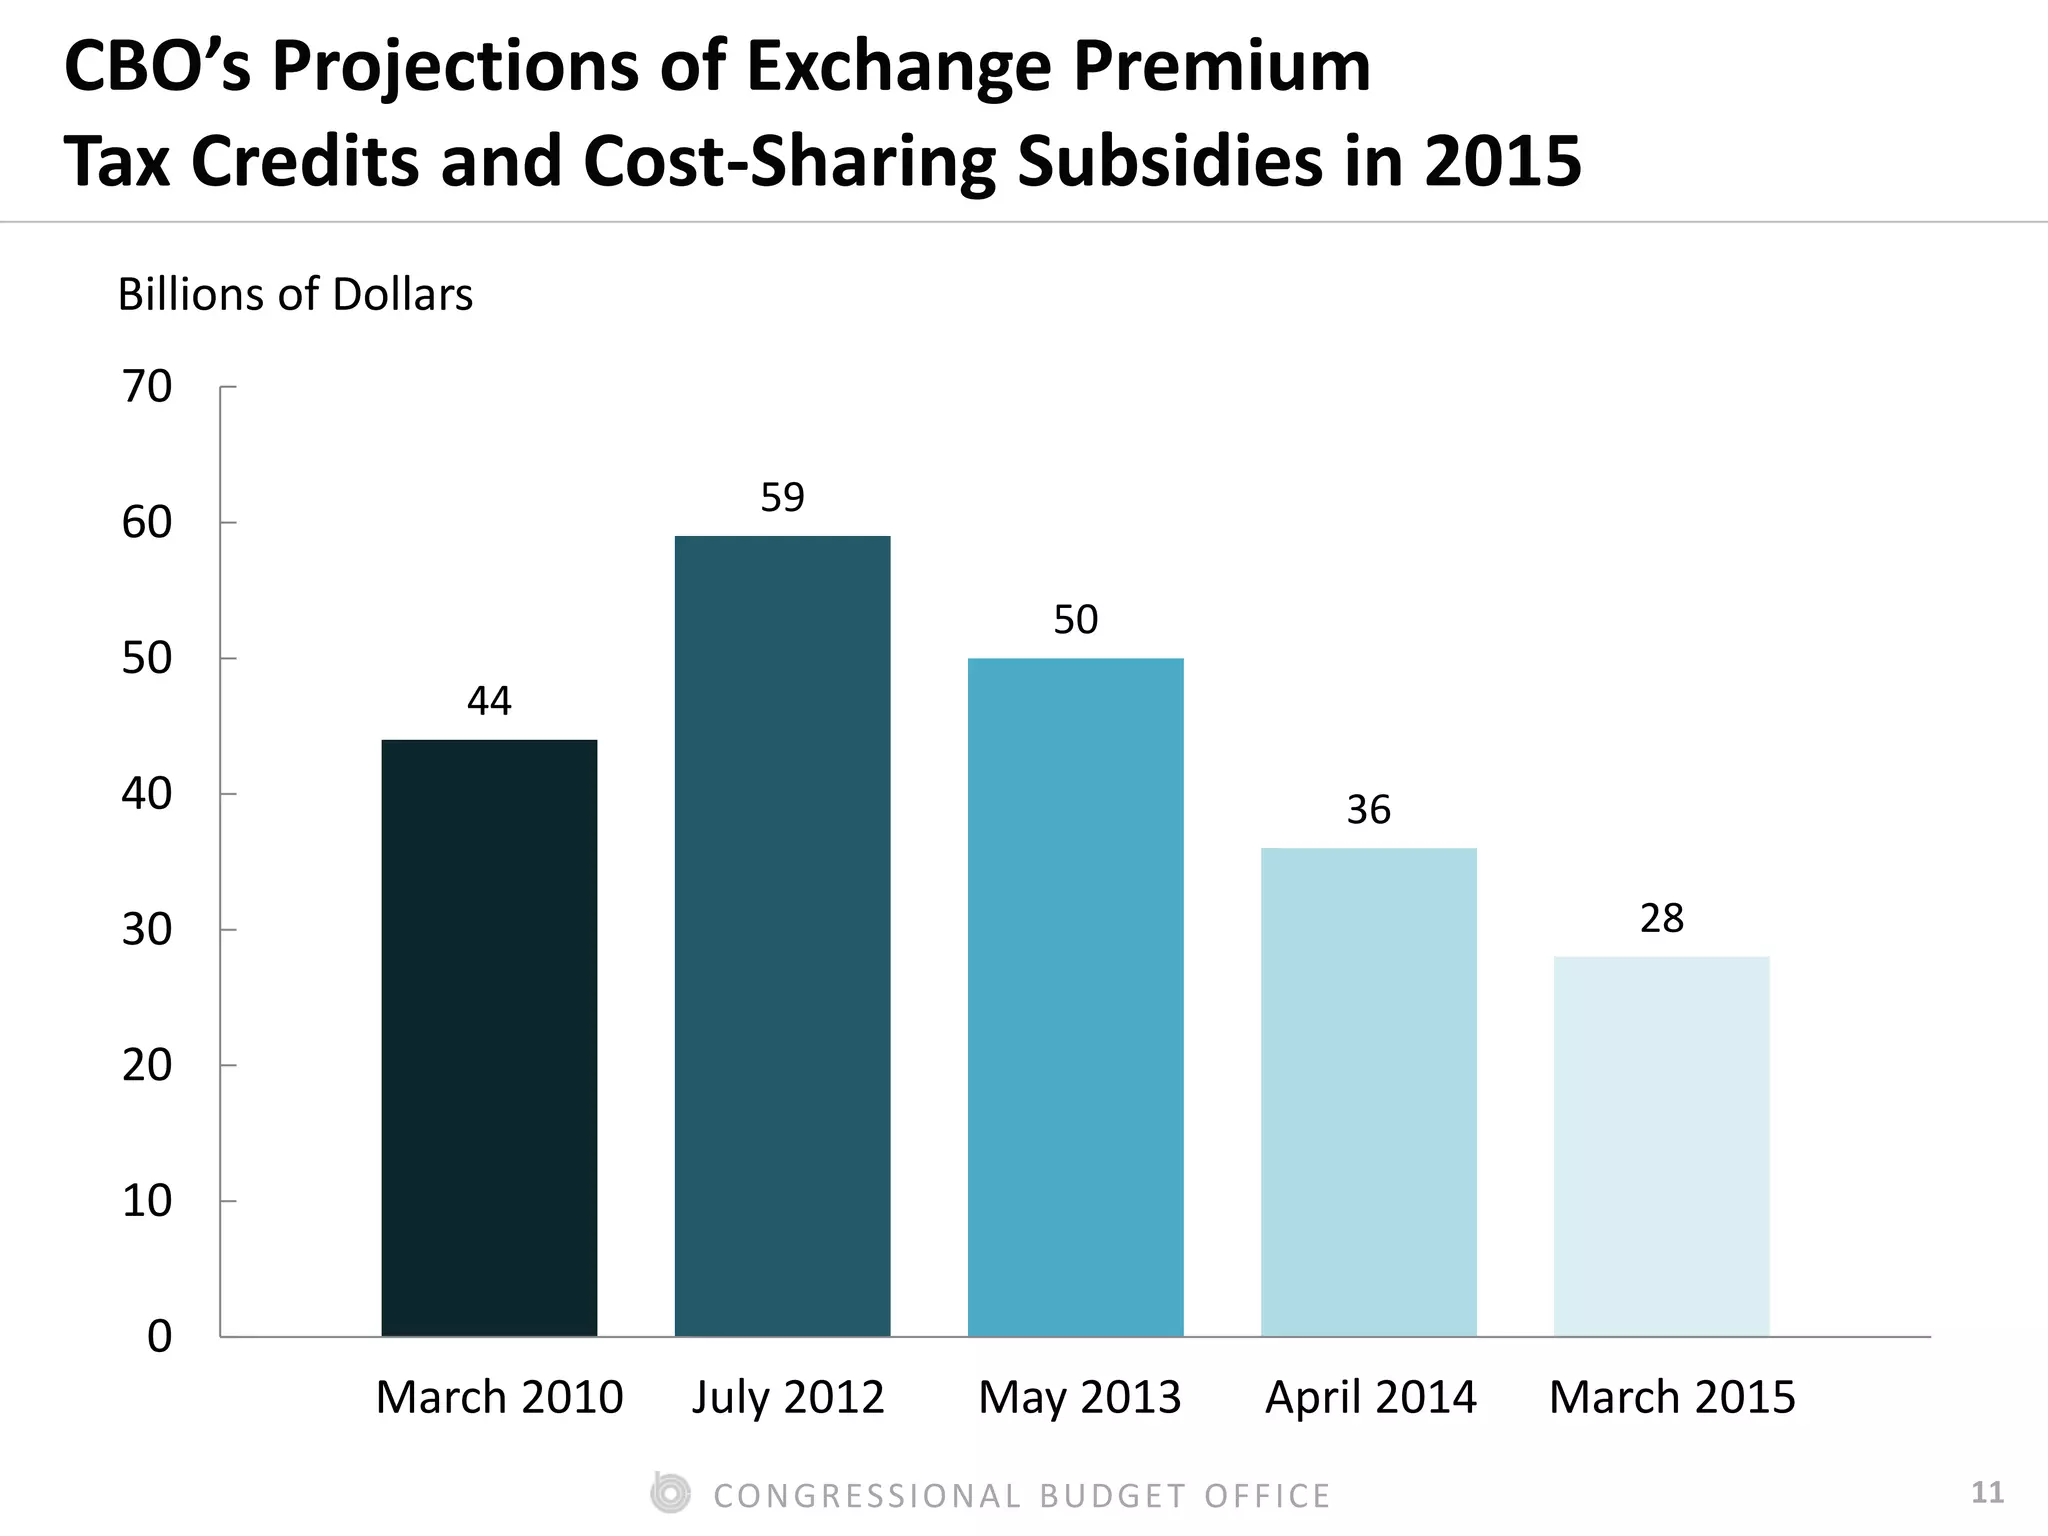
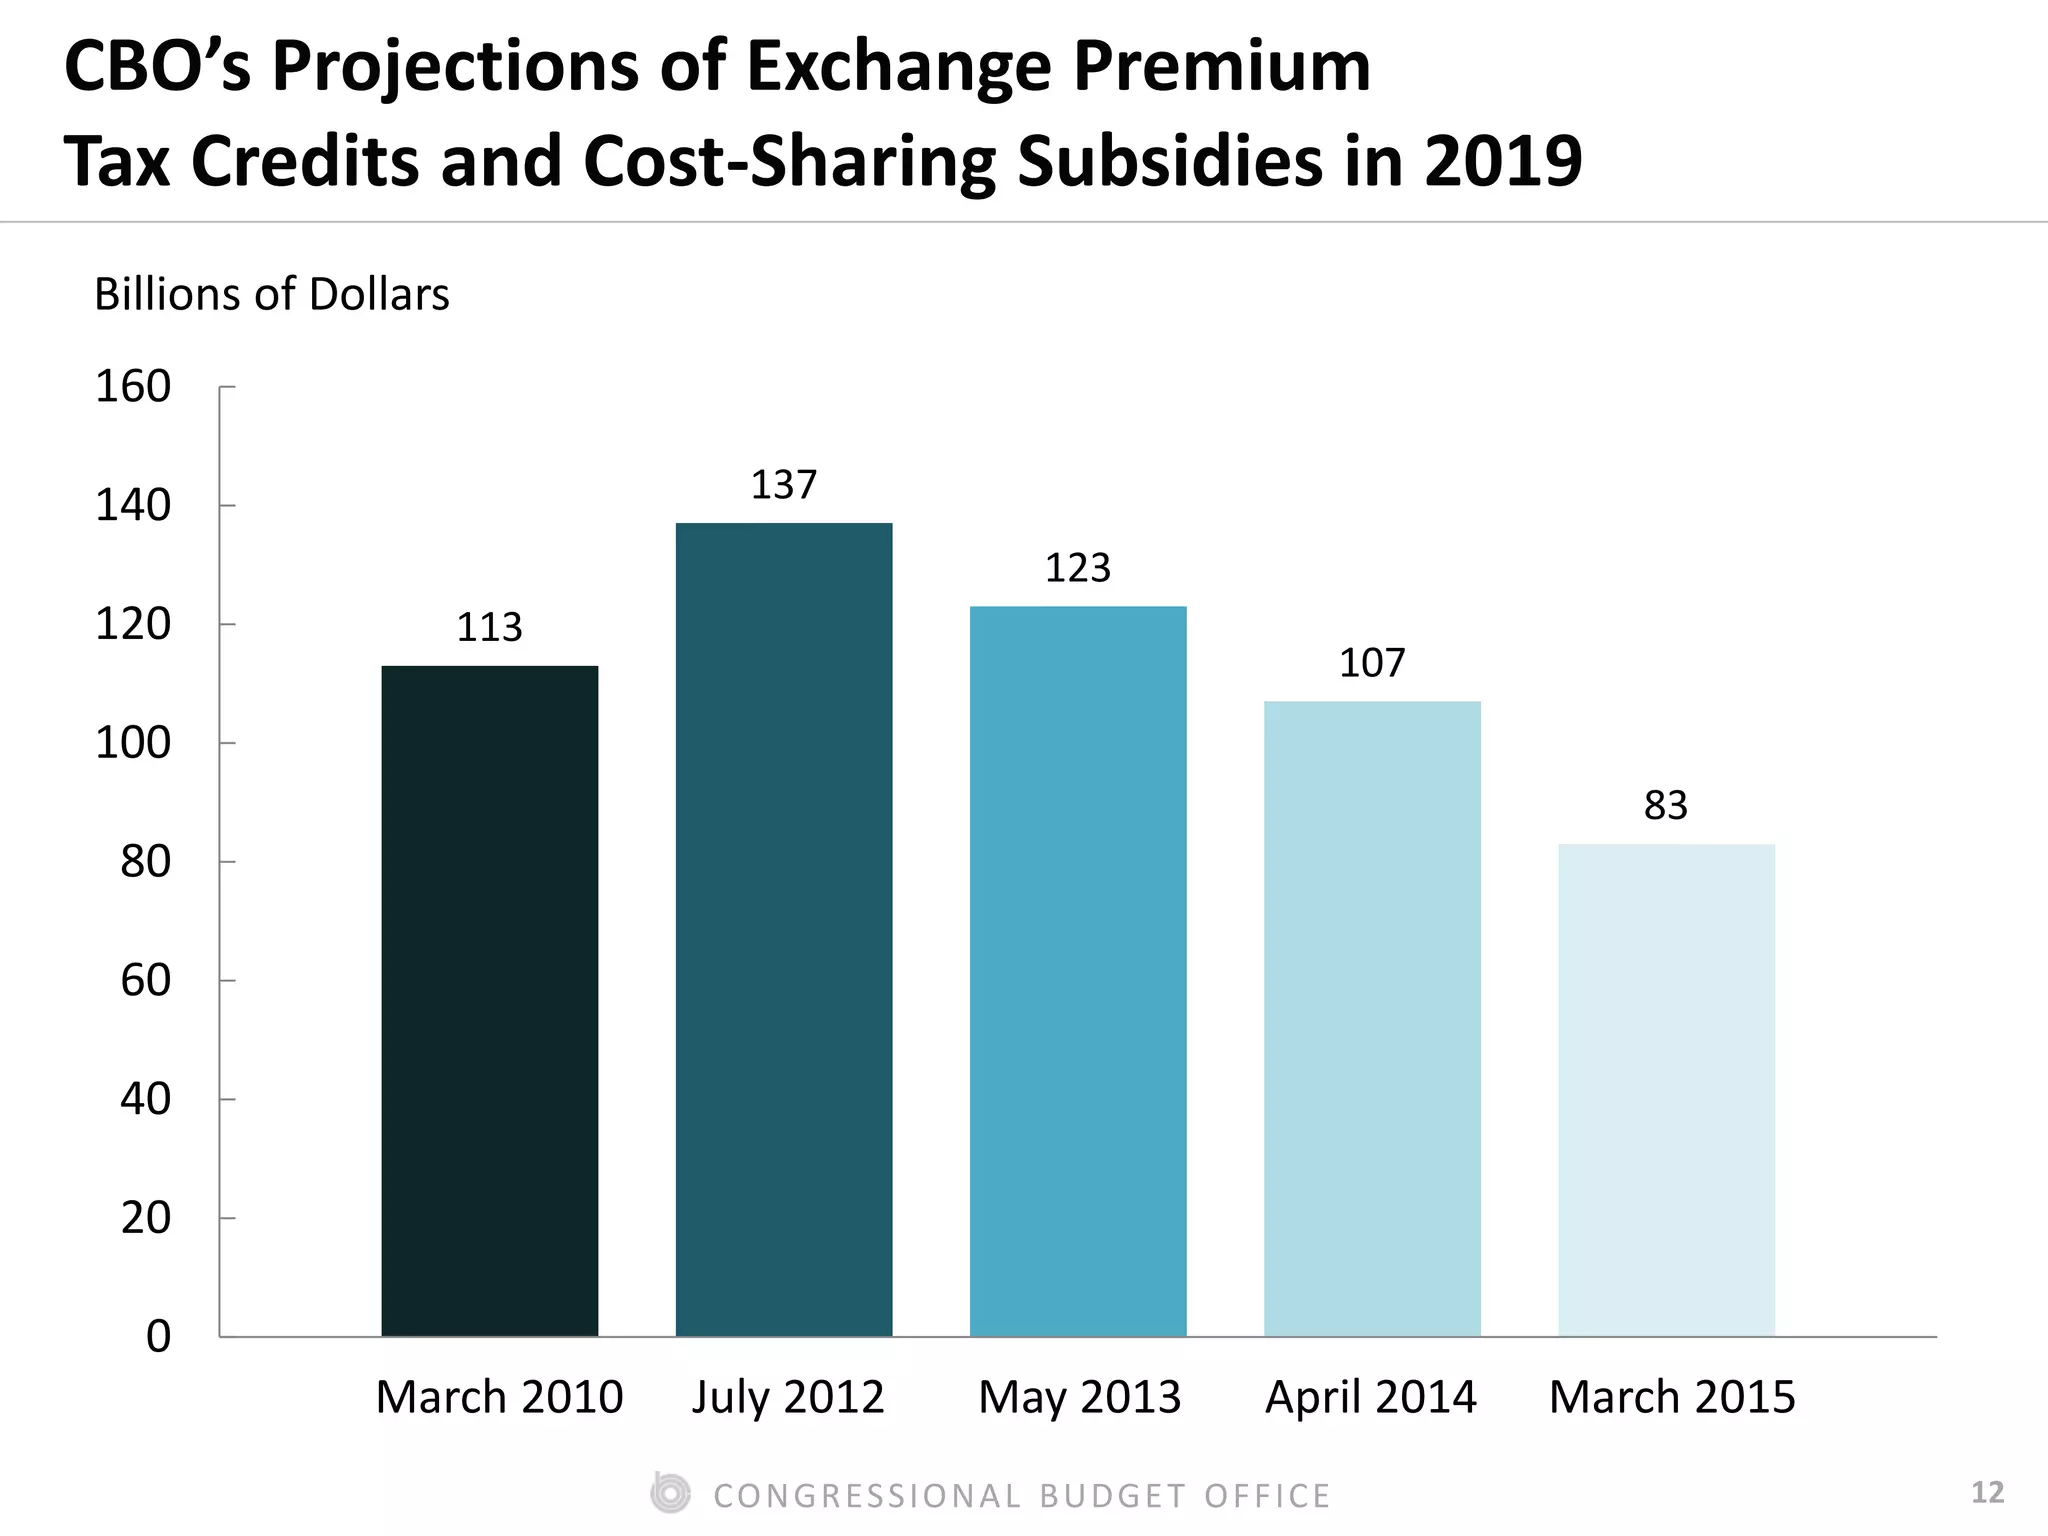
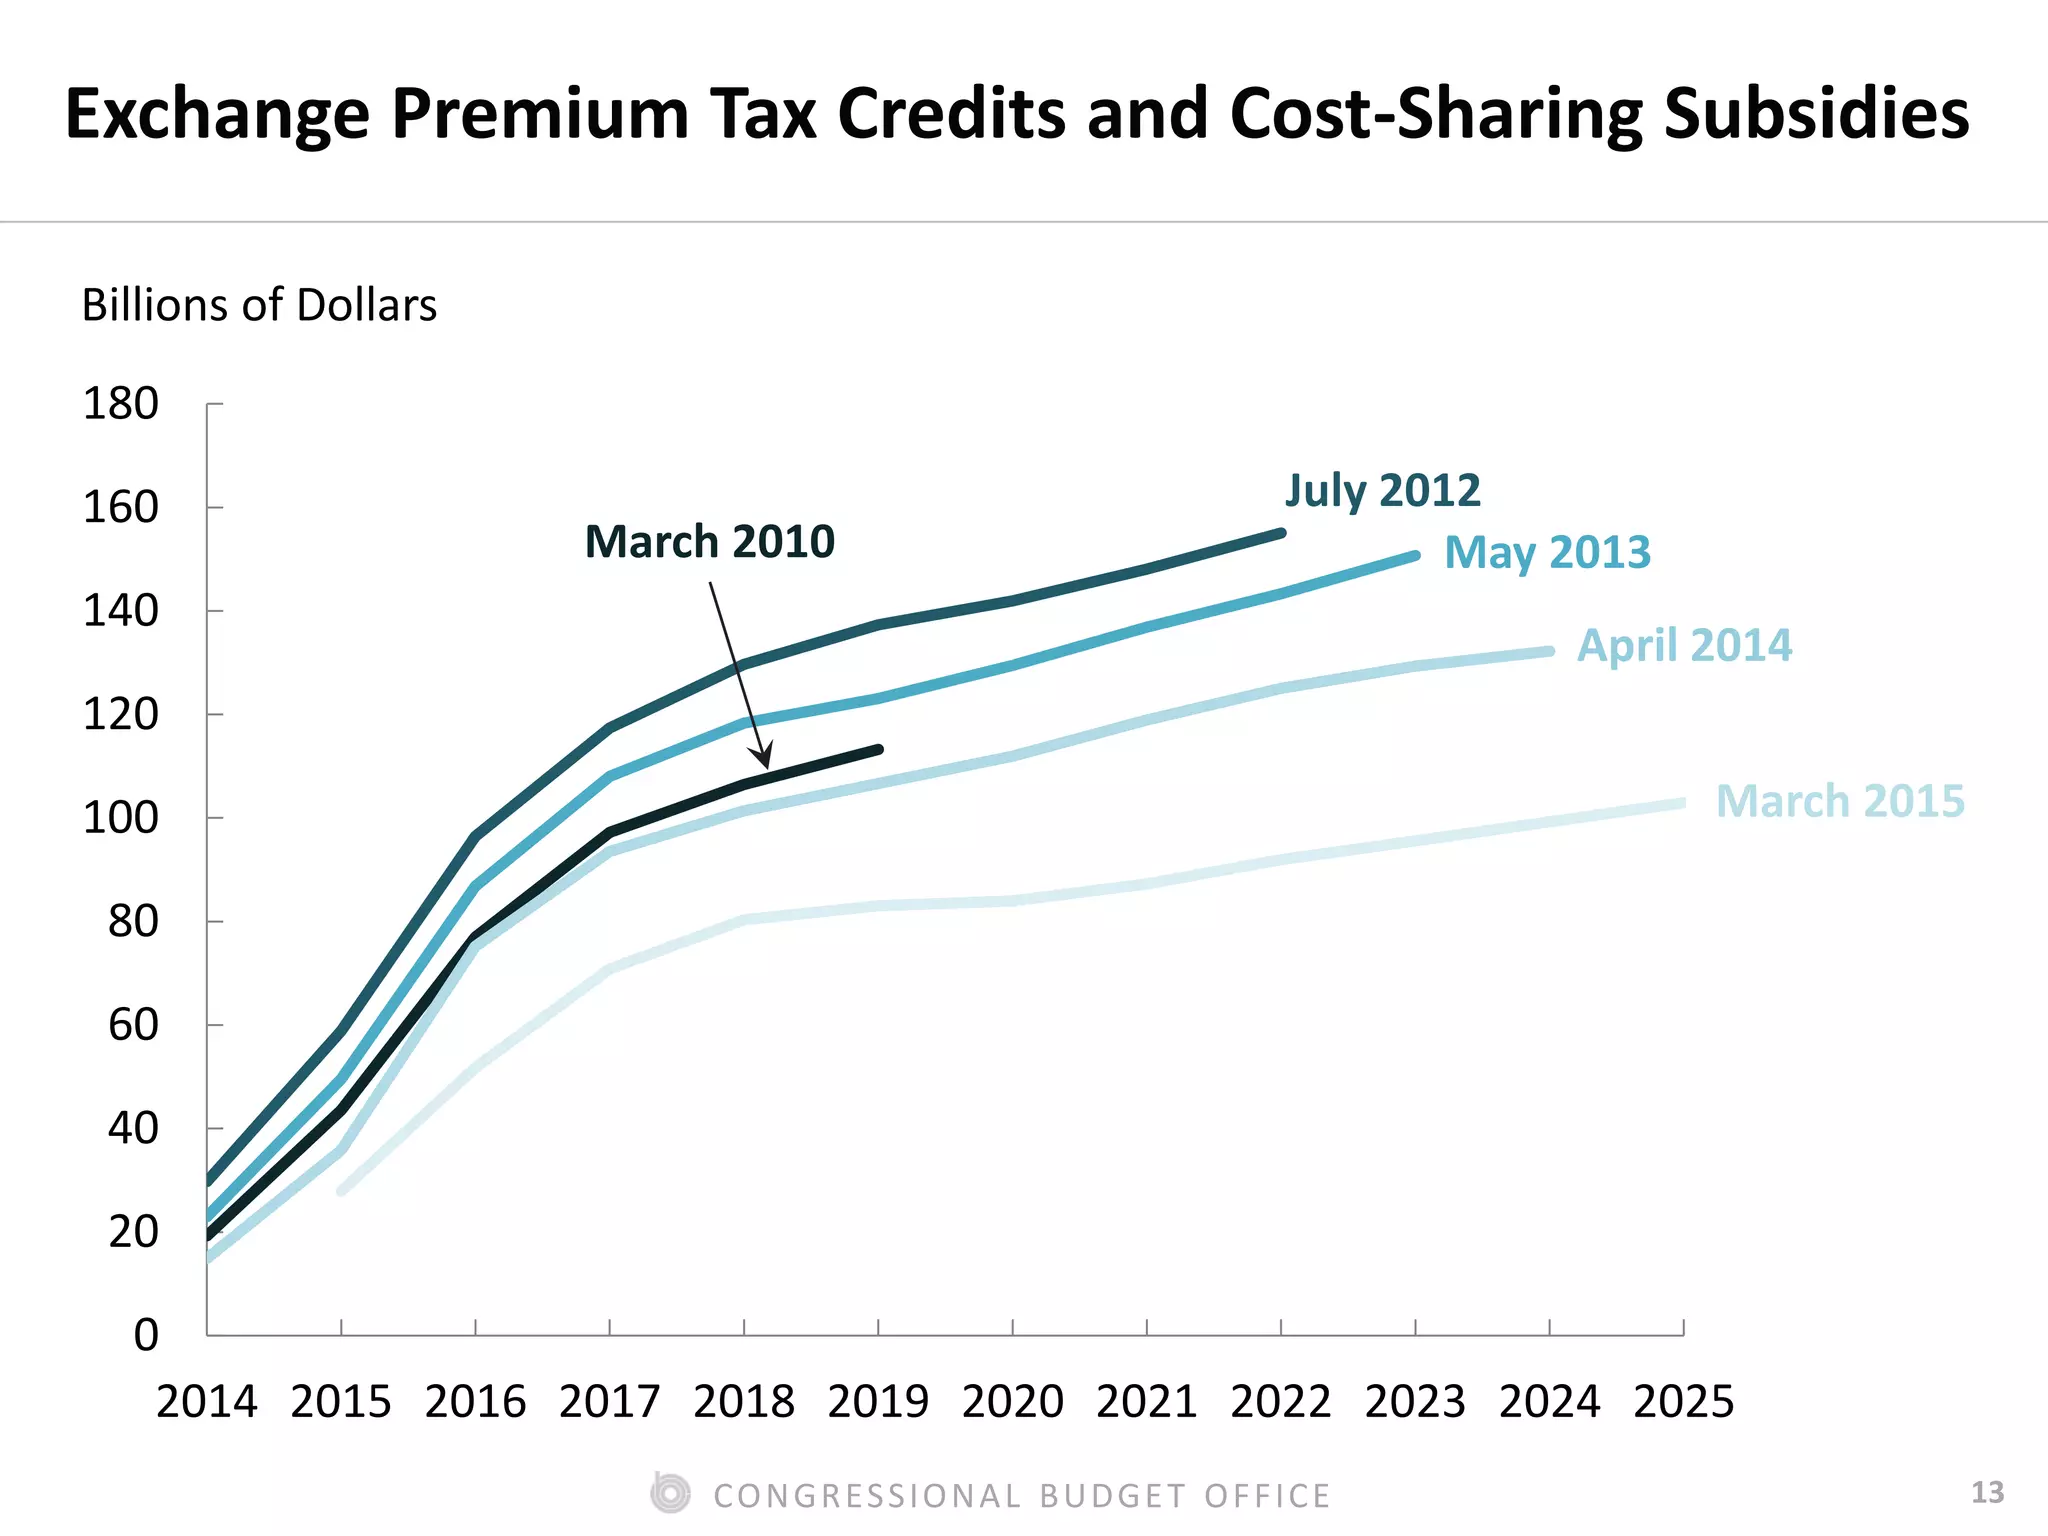
Congressional Budget Office
Roundtable: Forecasting the Effects of
Public Policies on Budgets and People
Association for Public Policy Analysis and Management
Miami, Florida
November 14, 2015
Jessica S. Banthin, Deputy Assistant Director
Health, Retirement, and Long-Term Analysis Division
Forecasting Enrollment and
Subsidies in the ACA Exchanges
1CONGRESSIONAL BUDGET OFFICE
Relevant CBO Reports
■ Cost estimate for H.R. 4872, Reconciliation Act of 2010 (Final Health
Care Legislation) (March 20, 2010), www.cbo.gov/publication/21351.
■ Estimates for the Insurance Coverage Provisions of the
Affordable Care Act Updated for the Recent Supreme Court
Decision (July 24, 2012), www.cbo.gov/publication/43472.
■ Updated Budget Projections: Fiscal Years 2013 to 2023
(May 14, 2013), www.cbo.gov/publication/44172.
■ Updated Estimates of the Effects of the Insurance Coverage
Provisions of the Affordable Care Act (April 14, 2014),
www.cbo.gov/publication/45231.
■ Updated Budget Projections: 2015 to 2025 (March 9, 2015),
www.cbo.gov/publication/49973.
2CONGRESSIONAL BUDGET OFFICE
CBO’s Estimates of Exchange Enrollment and Subsidies
■ CBO usually updates its baseline projections three times a year;
the spring baseline is the major update for the Affordable Care
Act (ACA) Exchange.
■ Types of changes
– Changes in law
– Changes in the economic forecast
– Technical changes from new information, data, regulations, and
changes in modeling assumptions
■ This presentation focuses on five of those baseline estimates
– March 2010, initial ACA estimate
– July 2012, updated for the Supreme Court decision
– May 2013, spring baseline
– April 2014, spring baseline
– March 2015, spring baseline
3CONGRESSIONAL BUDGET OFFICE
Main Challenges in Forecasting Exchange Enrollment
■ New program
■ Duration of the phase-in period
■ Effect of the individual mandate
■ Supreme Court decision regarding Medicaid expansion
4CONGRESSIONAL BUDGET OFFICE
CBO’s Projections of Subsidized Exchange Enrollment
■ Many people who obtain insurance through the exchanges
receive federal subsidies, but some do not.
■ The following figures focus on the number of subsidized enrollees.
■ CBO’s estimates of subsidized exchange enrollment are
presented as average annual enrollment for the year.
5CONGRESSIONAL BUDGET OFFICE
CBO’s Projections of Subsidized Exchange
Enrollment in 2014 (Average for the year)
7 7
6
5
0
1
2
3
4
5
6
7
8
Millions of People
March 2010 July 2012 May 2013 April 2014
Average Subsidized
ExchangeEnrollment,
CalendarYear 2014
6CONGRESSIONAL BUDGET OFFICE
CBO’s Projections of Subsidized Exchange
Enrollment in 2015 (Average for the year)
11
12
11
10
8
0
2
4
6
8
10
12
14
Millions of People
March 2010 July 2012 May 2013 April 2014 March 2015
7CONGRESSIONAL BUDGET OFFICE
CBO’s Projections of Subsidized Exchange
Enrollment in 2019 (Average for the year)
19
22
20
19
17
0
5
10
15
20
25
Millions of People
March 2010 July 2012 May 2013 April 2014 March 2015
8CONGRESSIONAL BUDGET OFFICE
Subsidized Exchange Enrollment Projections
5
7
9
11
13
15
17
19
21
23
2014 2015 2016 2017 2018 2019 2020 2022 2024
Millions of People
March 2010
July 2012
March 2015
April 2014
9CONGRESSIONAL BUDGET OFFICE
Main Challenges in Forecasting Exchange
Premiums and Subsidies
■ Health status of new enrollees
■ Continued slowdown in health care cost growth
■ Extent of insurer participation in new program
■ Characteristics of plans offered
■ Income and age distribution of enrollees, which determines
aggregate subsidies
10CONGRESSIONAL BUDGET OFFICE
CBO’s Projections of Exchange Premium
Tax Credits and Cost-Sharing Subsidies in 2014
19
30
23
15
0
5
10
15
20
25
30
35
Billions of Dollars
March 2010 July 2012 May 2013 April 2014
Fiscal Year 2014
Amount for
Exchange
Subsidies
11CONGRESSIONAL BUDGET OFFICE
CBO’s Projections of Exchange Premium
Tax Credits and Cost-Sharing Subsidies in 2015
44
59
50
36
28
0
10
20
30
40
50
60
70
Billions of Dollars
March 2010 July 2012 May 2013 April 2014 March 2015
12CONGRESSIONAL BUDGET OFFICE
CBO’s Projections of Exchange Premium
Tax Credits and Cost-Sharing Subsidies in 2019
113
137
123
107
83
0
20
40
60
80
100
120
140
160
March 2010 July 2012 May 2013 April 2014 March 2015
Billions of Dollars
13CONGRESSIONAL BUDGET OFFICE
Exchange Premium Tax Credits and Cost-Sharing Subsidies
0
20
40
60
80
100
120
140
160
180
2014 2015 2016 2017 2018 2019 2020 2021 2022 2023 2024 2025
Billions of Dollars
March 2010
July 2012
March 2015
April 2014
May 2013

Forecasting Enrollment and Subsidies in the ACA Exchanges

  • 1.
    Congressional Budget Office Roundtable:Forecasting the Effects of Public Policies on Budgets and People Association for Public Policy Analysis and Management Miami, Florida November 14, 2015 Jessica S. Banthin, Deputy Assistant Director Health, Retirement, and Long-Term Analysis Division Forecasting Enrollment and Subsidies in the ACA Exchanges
  • 2.
    1CONGRESSIONAL BUDGET OFFICE RelevantCBO Reports ■ Cost estimate for H.R. 4872, Reconciliation Act of 2010 (Final Health Care Legislation) (March 20, 2010), www.cbo.gov/publication/21351. ■ Estimates for the Insurance Coverage Provisions of the Affordable Care Act Updated for the Recent Supreme Court Decision (July 24, 2012), www.cbo.gov/publication/43472. ■ Updated Budget Projections: Fiscal Years 2013 to 2023 (May 14, 2013), www.cbo.gov/publication/44172. ■ Updated Estimates of the Effects of the Insurance Coverage Provisions of the Affordable Care Act (April 14, 2014), www.cbo.gov/publication/45231. ■ Updated Budget Projections: 2015 to 2025 (March 9, 2015), www.cbo.gov/publication/49973.
  • 3.
    2CONGRESSIONAL BUDGET OFFICE CBO’sEstimates of Exchange Enrollment and Subsidies ■ CBO usually updates its baseline projections three times a year; the spring baseline is the major update for the Affordable Care Act (ACA) Exchange. ■ Types of changes – Changes in law – Changes in the economic forecast – Technical changes from new information, data, regulations, and changes in modeling assumptions ■ This presentation focuses on five of those baseline estimates – March 2010, initial ACA estimate – July 2012, updated for the Supreme Court decision – May 2013, spring baseline – April 2014, spring baseline – March 2015, spring baseline
  • 4.
    3CONGRESSIONAL BUDGET OFFICE MainChallenges in Forecasting Exchange Enrollment ■ New program ■ Duration of the phase-in period ■ Effect of the individual mandate ■ Supreme Court decision regarding Medicaid expansion
  • 5.
    4CONGRESSIONAL BUDGET OFFICE CBO’sProjections of Subsidized Exchange Enrollment ■ Many people who obtain insurance through the exchanges receive federal subsidies, but some do not. ■ The following figures focus on the number of subsidized enrollees. ■ CBO’s estimates of subsidized exchange enrollment are presented as average annual enrollment for the year.
  • 6.
    5CONGRESSIONAL BUDGET OFFICE CBO’sProjections of Subsidized Exchange Enrollment in 2014 (Average for the year) 7 7 6 5 0 1 2 3 4 5 6 7 8 Millions of People March 2010 July 2012 May 2013 April 2014 Average Subsidized ExchangeEnrollment, CalendarYear 2014
  • 7.
    6CONGRESSIONAL BUDGET OFFICE CBO’sProjections of Subsidized Exchange Enrollment in 2015 (Average for the year) 11 12 11 10 8 0 2 4 6 8 10 12 14 Millions of People March 2010 July 2012 May 2013 April 2014 March 2015
  • 8.
    7CONGRESSIONAL BUDGET OFFICE CBO’sProjections of Subsidized Exchange Enrollment in 2019 (Average for the year) 19 22 20 19 17 0 5 10 15 20 25 Millions of People March 2010 July 2012 May 2013 April 2014 March 2015
  • 9.
    8CONGRESSIONAL BUDGET OFFICE SubsidizedExchange Enrollment Projections 5 7 9 11 13 15 17 19 21 23 2014 2015 2016 2017 2018 2019 2020 2022 2024 Millions of People March 2010 July 2012 March 2015 April 2014
  • 10.
    9CONGRESSIONAL BUDGET OFFICE MainChallenges in Forecasting Exchange Premiums and Subsidies ■ Health status of new enrollees ■ Continued slowdown in health care cost growth ■ Extent of insurer participation in new program ■ Characteristics of plans offered ■ Income and age distribution of enrollees, which determines aggregate subsidies
  • 11.
    10CONGRESSIONAL BUDGET OFFICE CBO’sProjections of Exchange Premium Tax Credits and Cost-Sharing Subsidies in 2014 19 30 23 15 0 5 10 15 20 25 30 35 Billions of Dollars March 2010 July 2012 May 2013 April 2014 Fiscal Year 2014 Amount for Exchange Subsidies
  • 12.
    11CONGRESSIONAL BUDGET OFFICE CBO’sProjections of Exchange Premium Tax Credits and Cost-Sharing Subsidies in 2015 44 59 50 36 28 0 10 20 30 40 50 60 70 Billions of Dollars March 2010 July 2012 May 2013 April 2014 March 2015
  • 13.
    12CONGRESSIONAL BUDGET OFFICE CBO’sProjections of Exchange Premium Tax Credits and Cost-Sharing Subsidies in 2019 113 137 123 107 83 0 20 40 60 80 100 120 140 160 March 2010 July 2012 May 2013 April 2014 March 2015 Billions of Dollars
  • 14.
    13CONGRESSIONAL BUDGET OFFICE ExchangePremium Tax Credits and Cost-Sharing Subsidies 0 20 40 60 80 100 120 140 160 180 2014 2015 2016 2017 2018 2019 2020 2021 2022 2023 2024 2025 Billions of Dollars March 2010 July 2012 March 2015 April 2014 May 2013