Time What Who
16:00-16:05Welcome Emilia Schützenhofer, DIO
16.05-16.20 AI-CENTIVE: project highlights
Lyndon Nixon, MODUL Technology |
AI-CENTIVE project leader
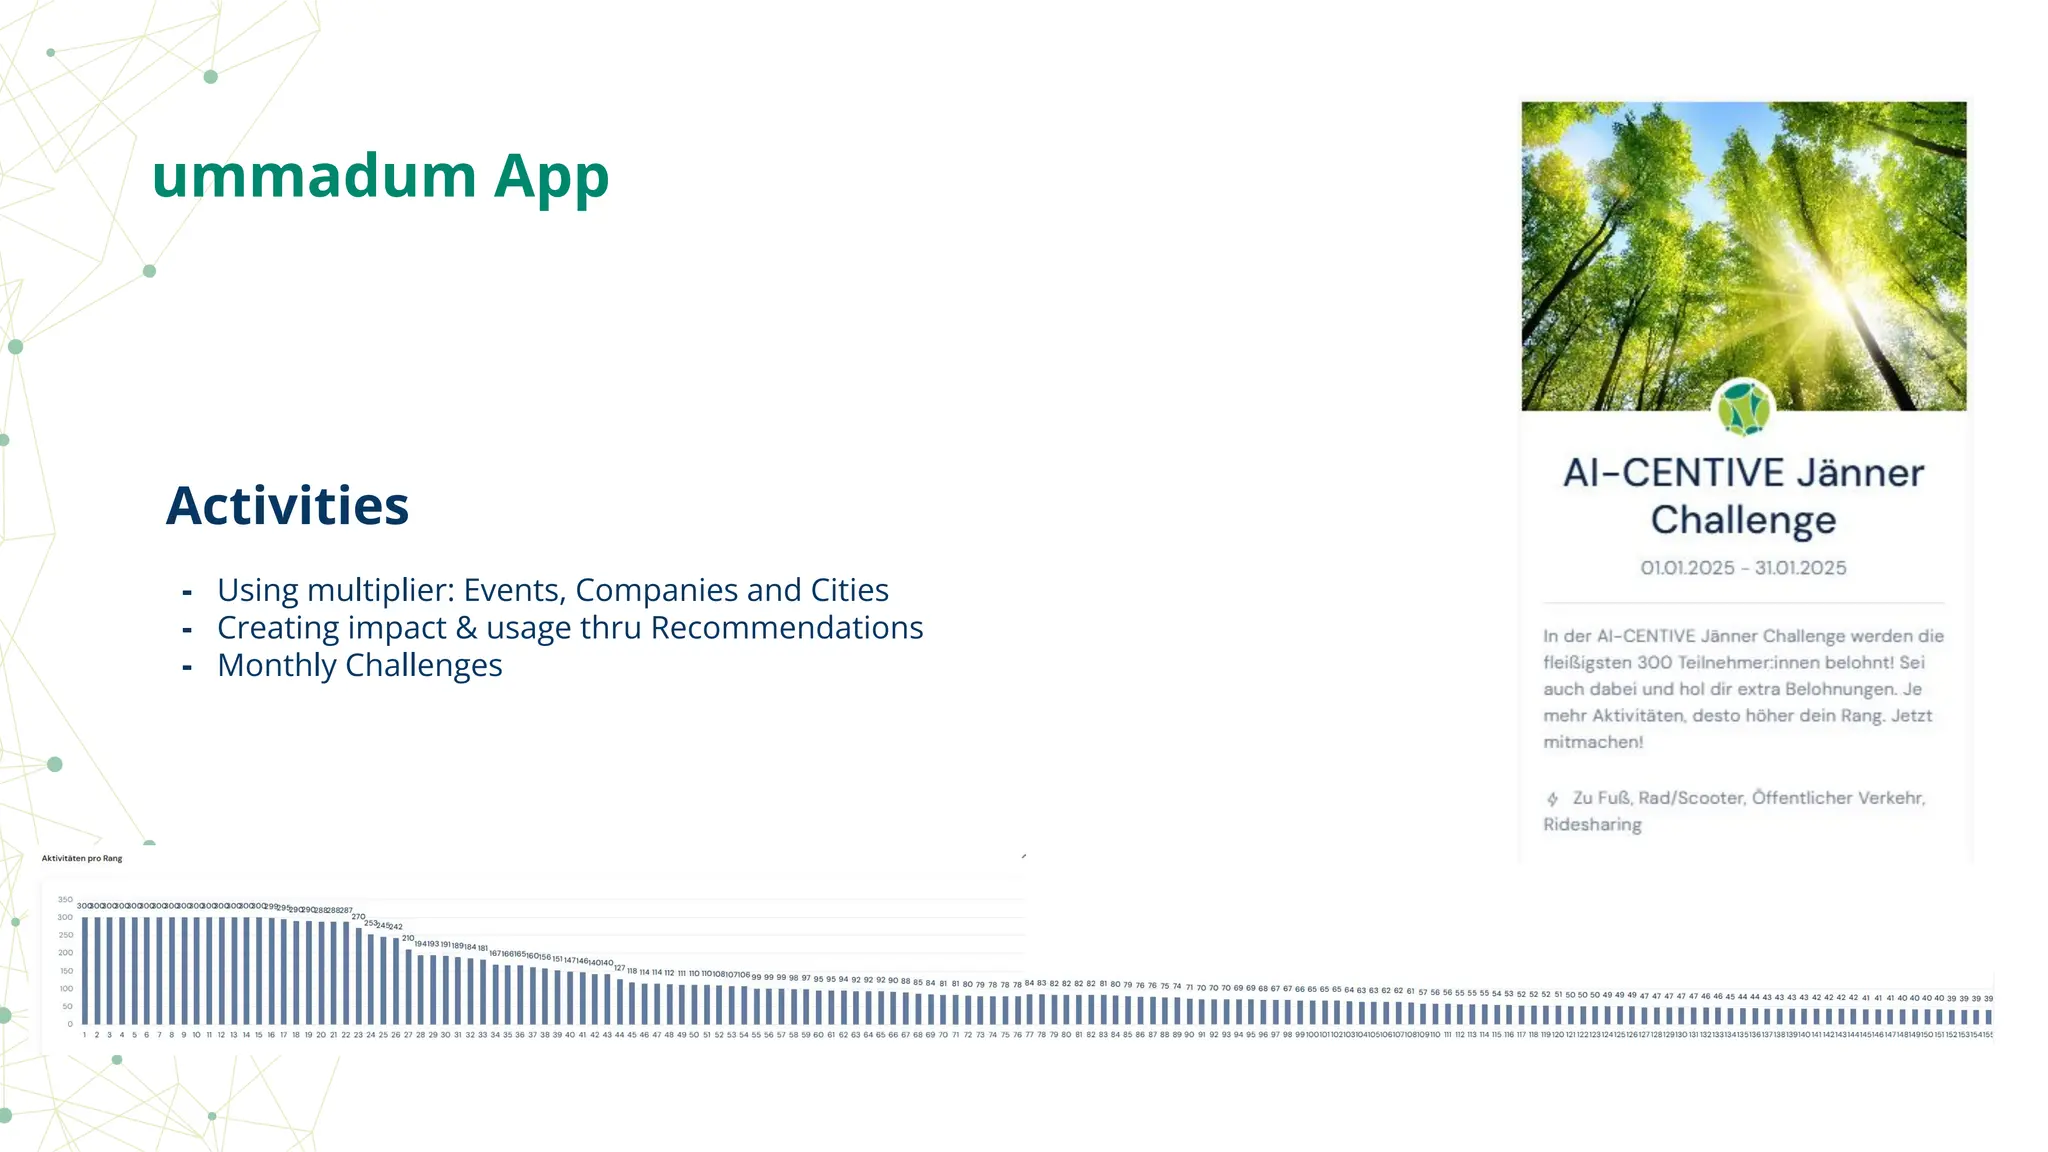
16.20-16.35 An app for sustainable mobility incentives Dave Kock, ummadum
16.35-16.50 AI improved weather prediction Toni Jurlina, Geosphere
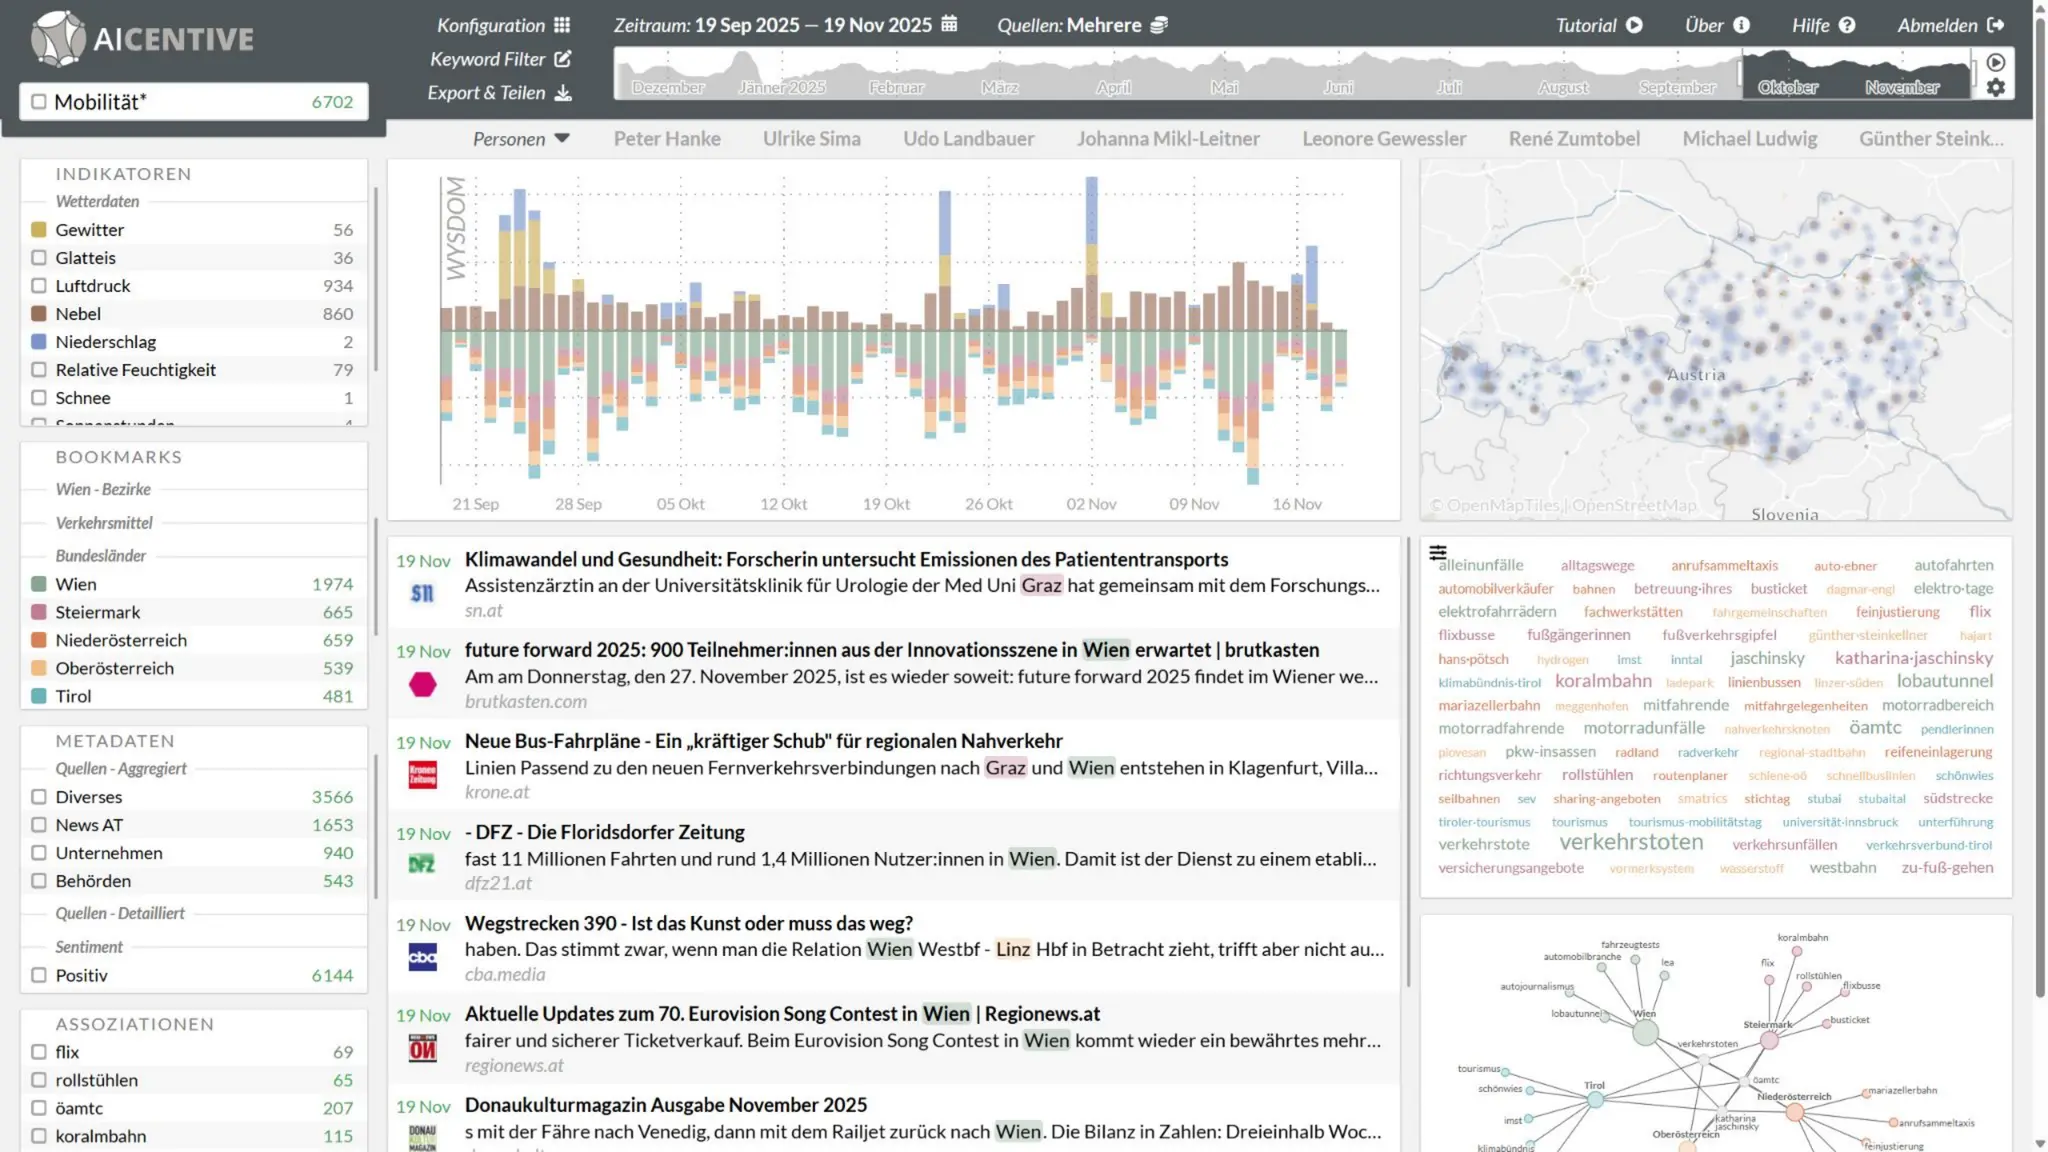
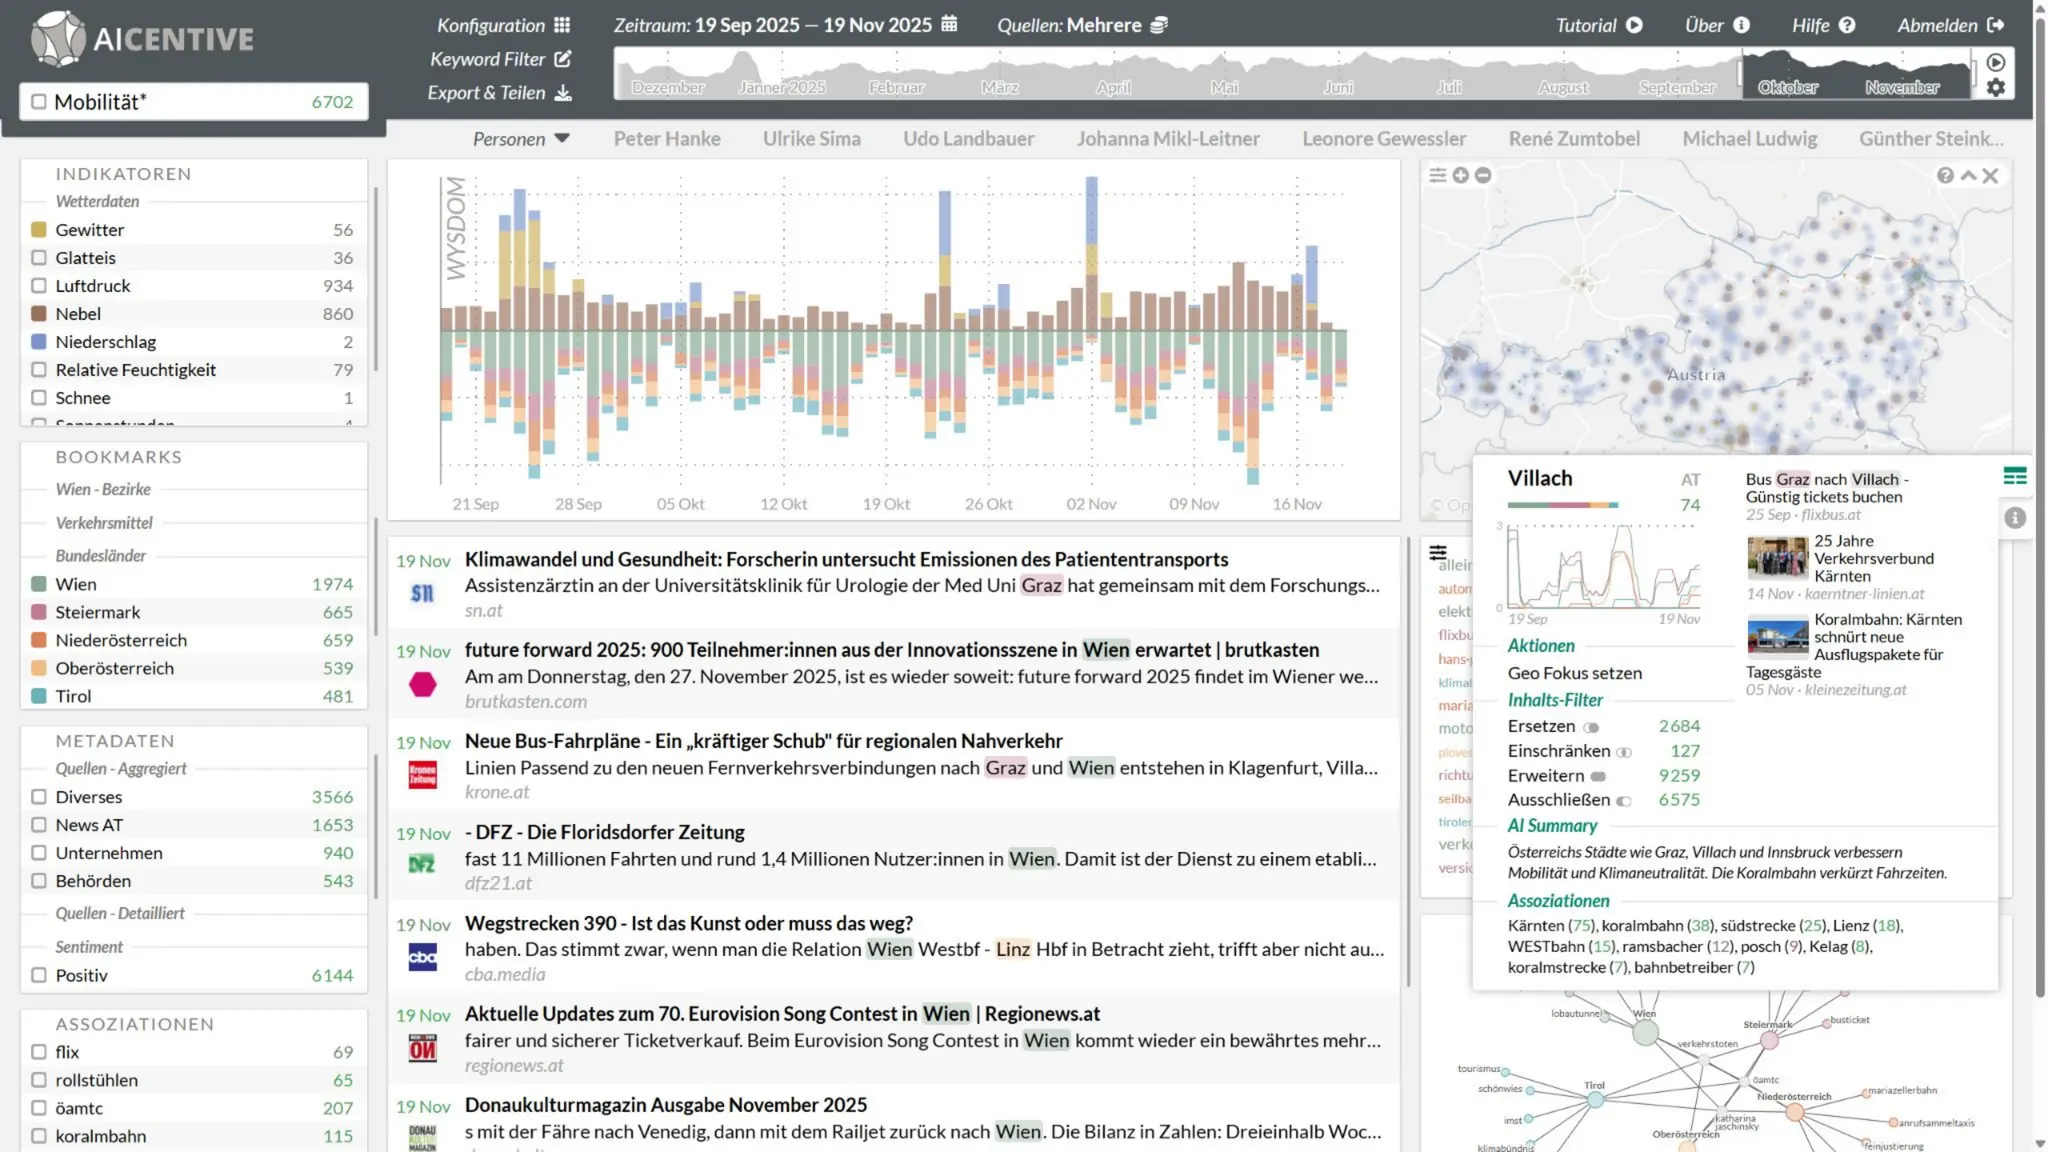
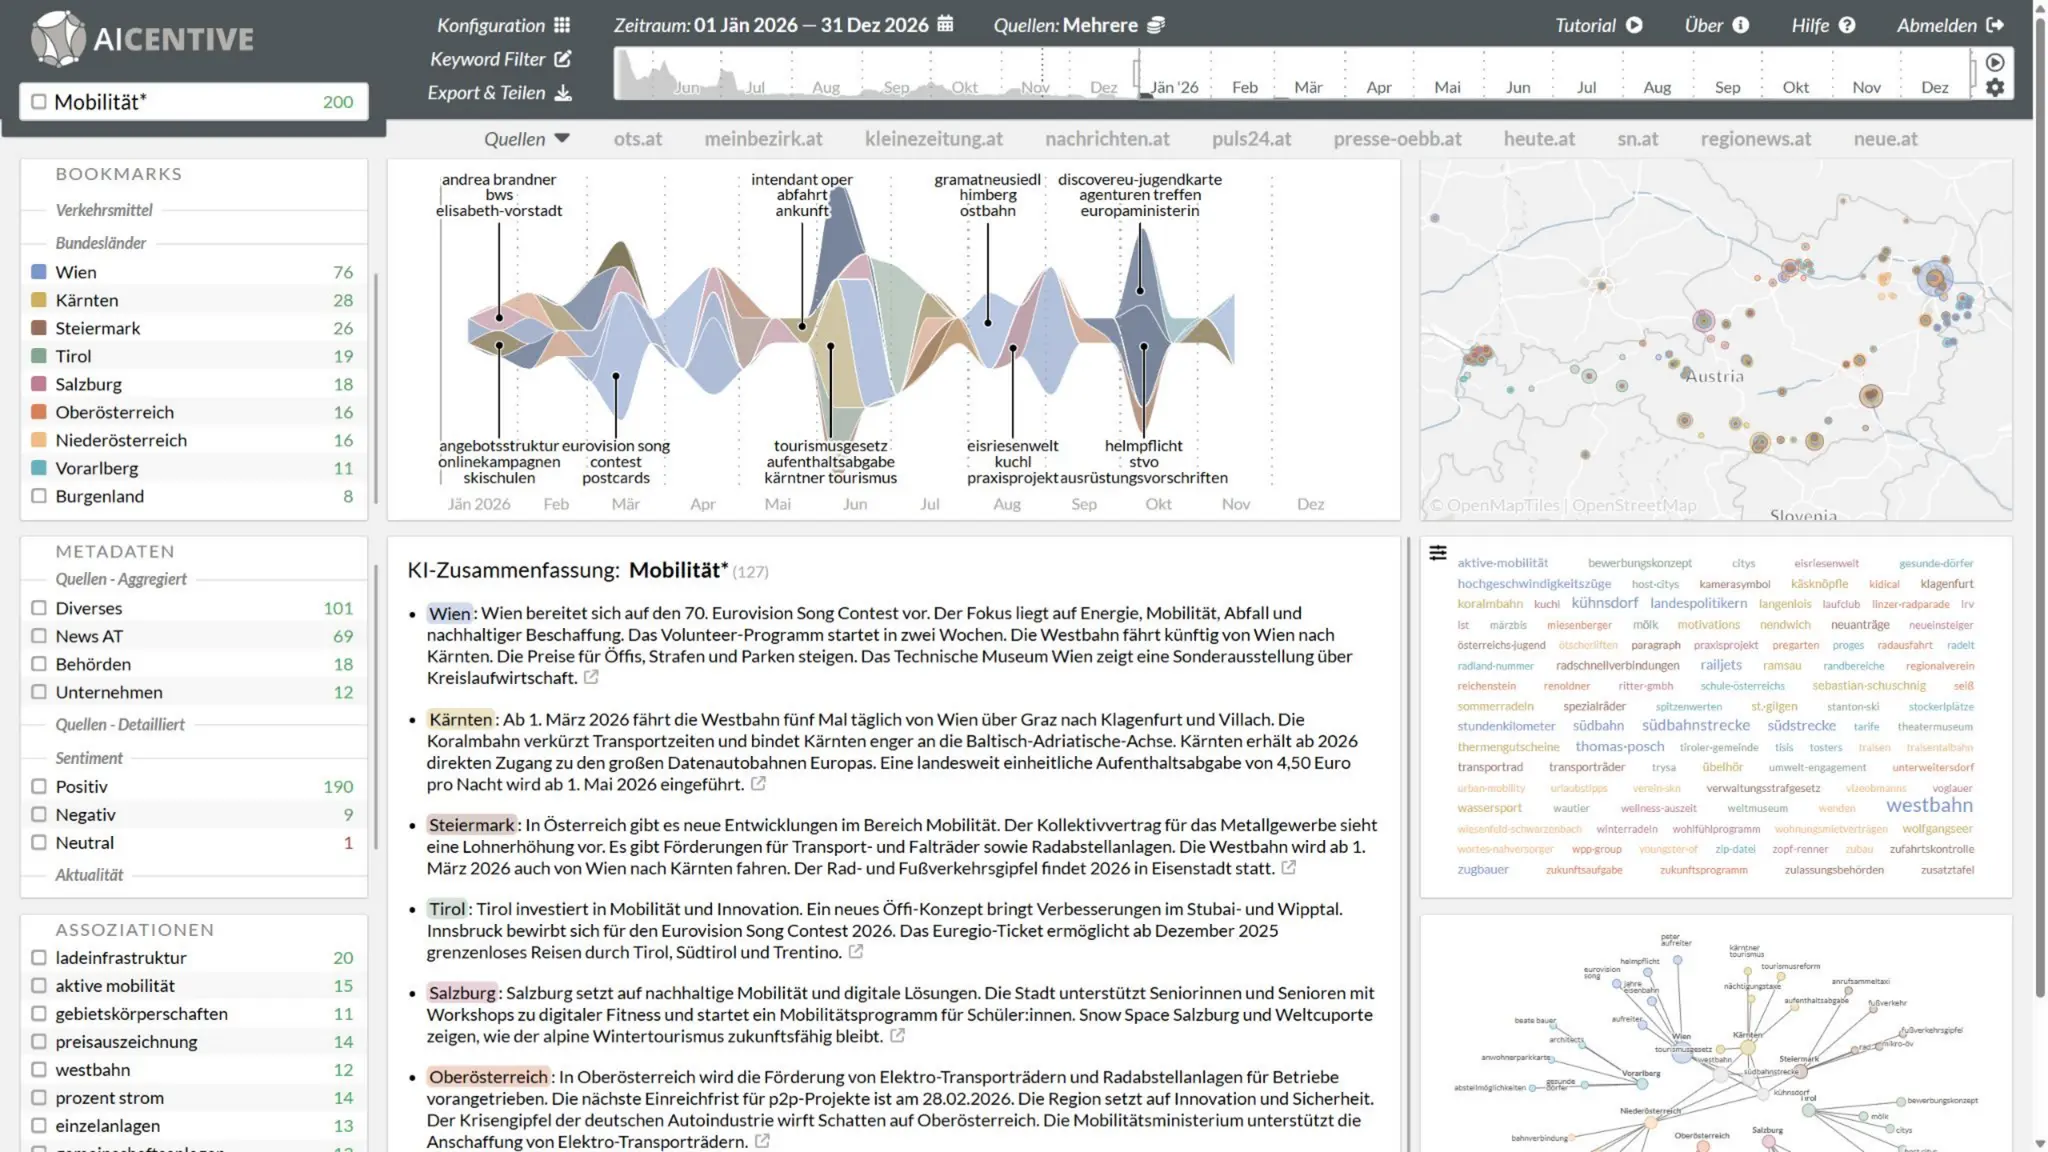
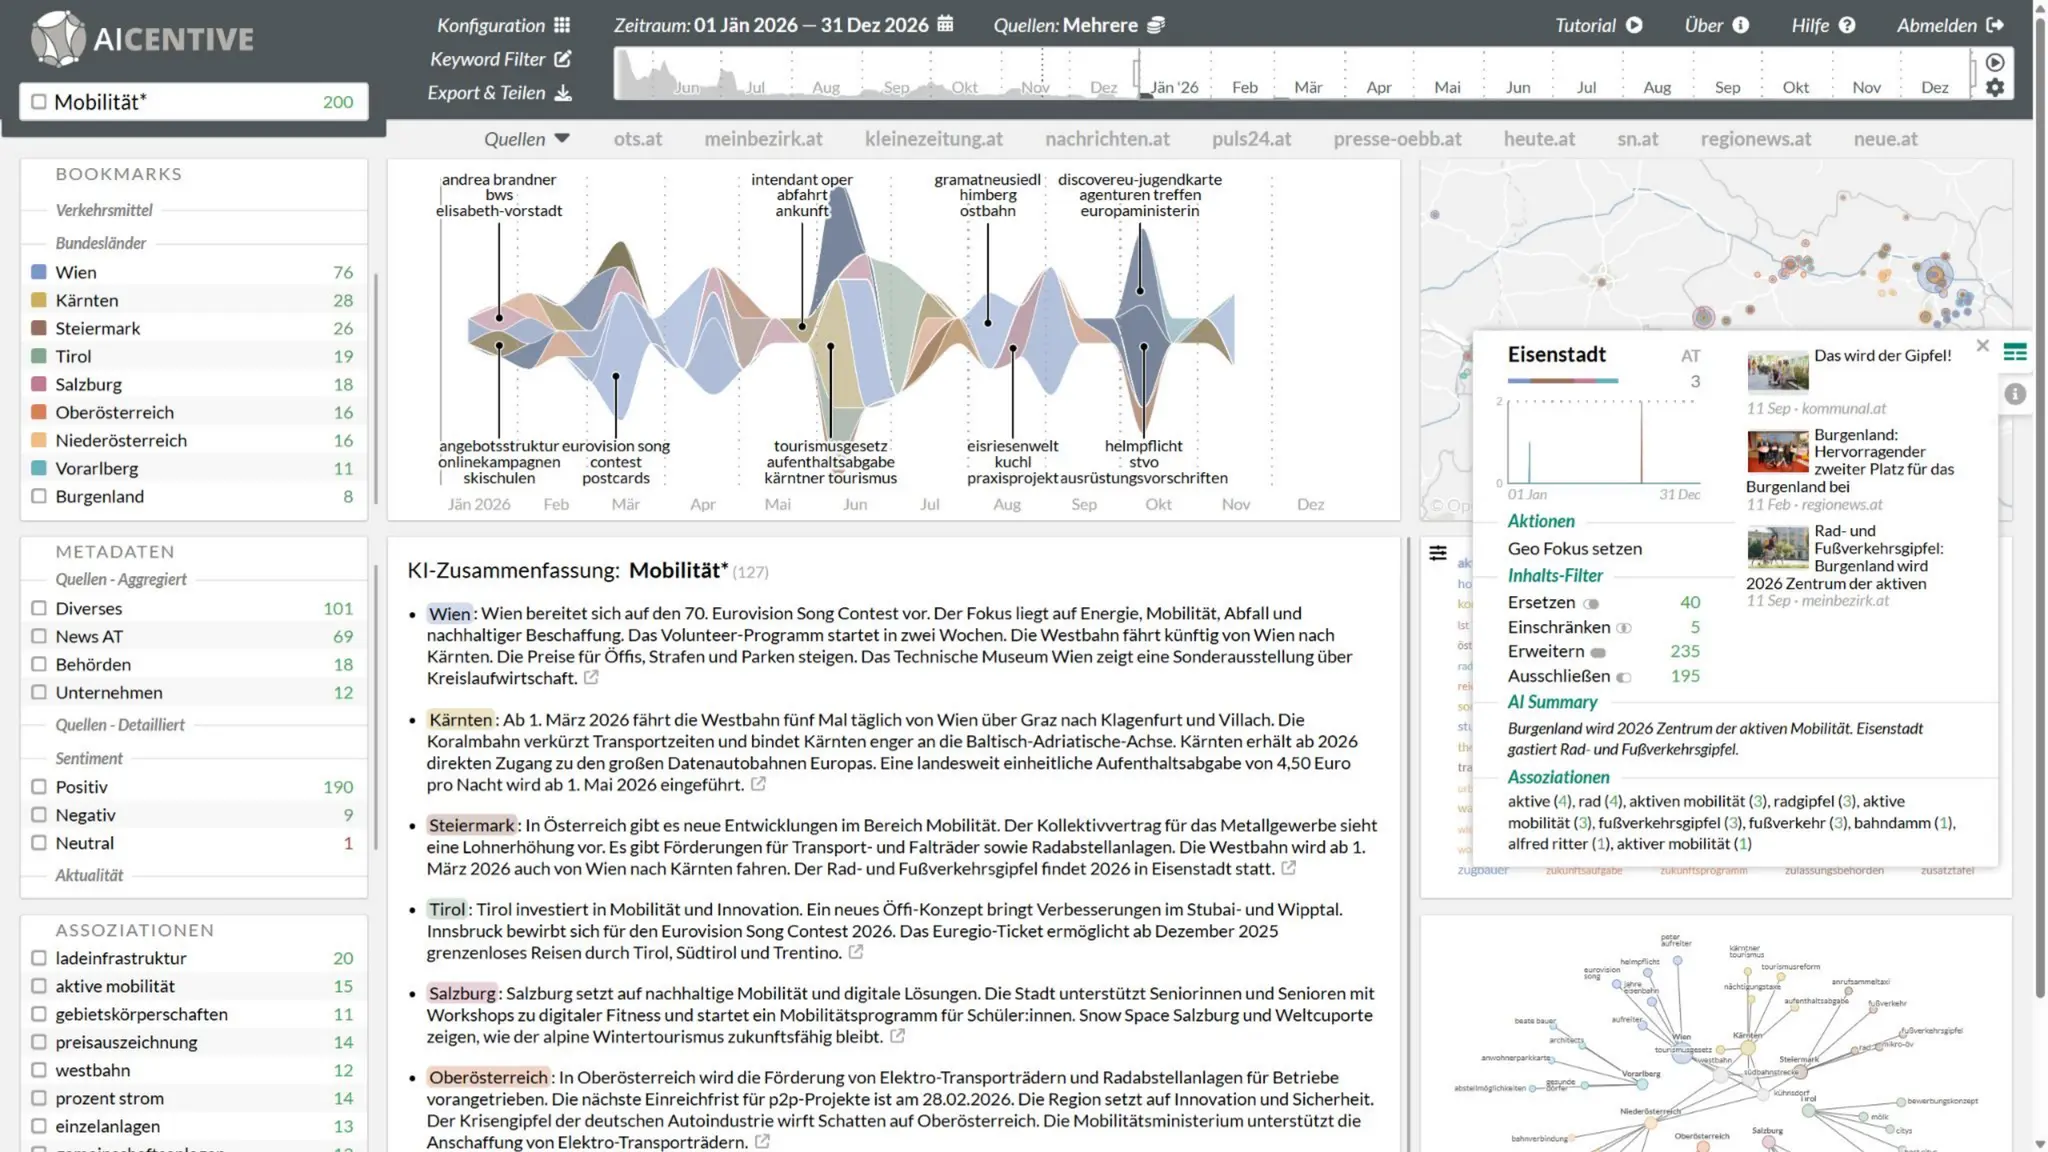
16.50-17.05 A dashboard for sustainable mobility insights Arno Scharl, webLyzard
17.05-17.20 Impacts on mobility behaviour and sustainability Astrid Gühnemann, BOKU
17.20-17.30 Short break
17.30-18.00
Panel: wrap up on how we can promote more sustainable
mobility in Austria in the future
All project partners
18.00 Networking
Agenda
Mission & Vision
Sustainablemobility behaviour is a difficult goal to reach, as people are not
willing to easily change their habits just because it may help the environment.
• Our mission is to develop AI- based incentivisation techniques for influencing
citizen’s mobility choices based on multimodal models of mobility activity and
data analytics.
• Our ultimate vision is to enable and incentivize Austrian citizens to find more
sustainable mobility choices, increasing awareness and affecting public opinion
to develop a more positive attitude towards those sustainable mobility choices.
6.
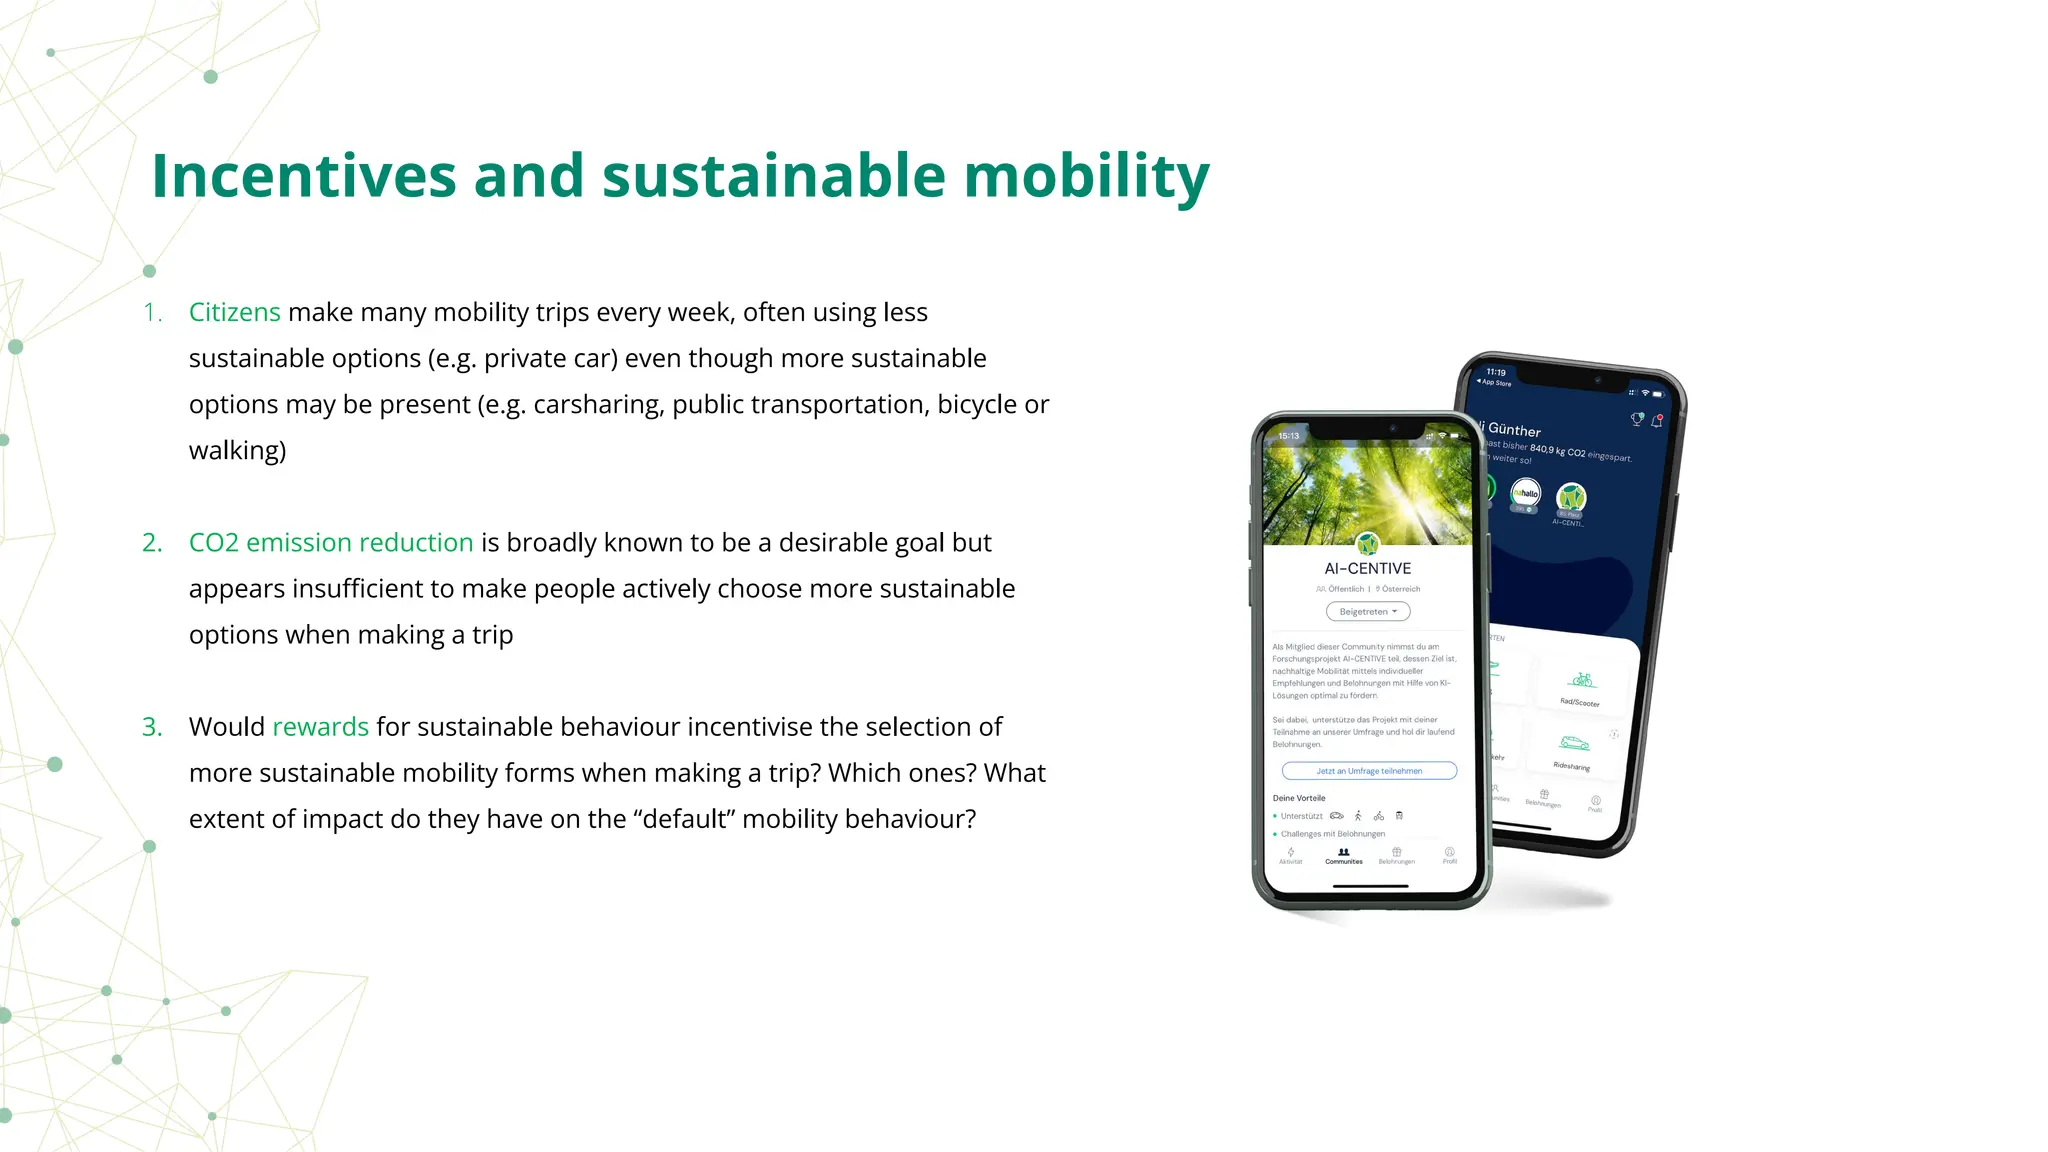
1. Citizens makemany mobility trips every week, often using less
sustainable options (e.g. private car) even though more sustainable
options may be present (e.g. carsharing, public transportation, bicycle or
walking)
2. CO2 emission reduction is broadly known to be a desirable goal but
appears insufficient to make people actively choose more sustainable
options when making a trip
3. Would rewards for sustainable behaviour incentivise the selection of
more sustainable mobility forms when making a trip? Which ones? What
extent of impact do they have on the “default” mobility behaviour?
Incentives and sustainable mobility
7.
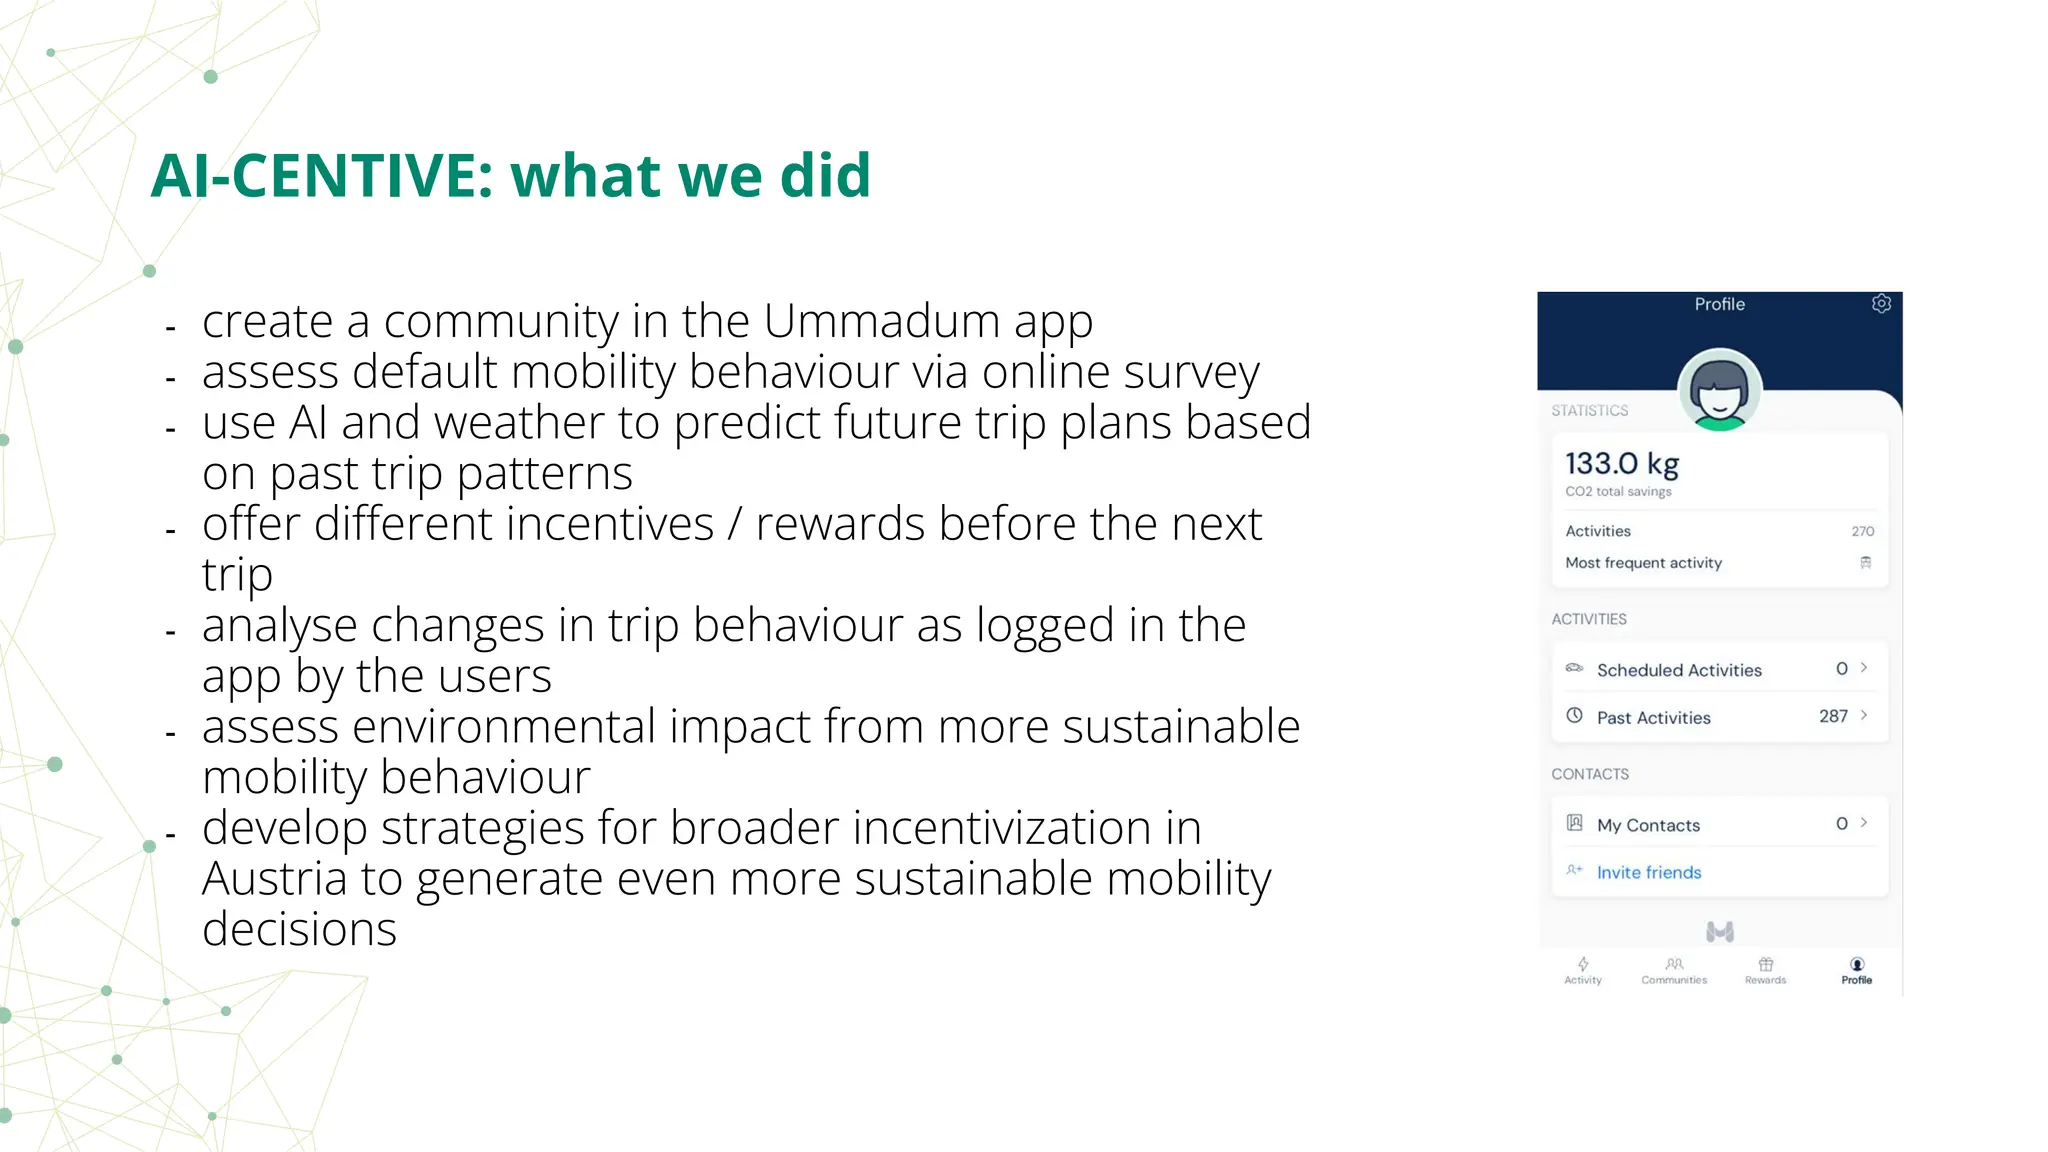
- create acommunity in the Ummadum app
- assess default mobility behaviour via online survey
- use AI and weather to predict future trip plans based
on past trip patterns
- offer different incentives / rewards before the next
trip
- analyse changes in trip behaviour as logged in the
app by the users
- assess environmental impact from more sustainable
mobility behaviour
- develop strategies for broader incentivization in
Austria to generate even more sustainable mobility
decisions
AI-CENTIVE: what we did
8.
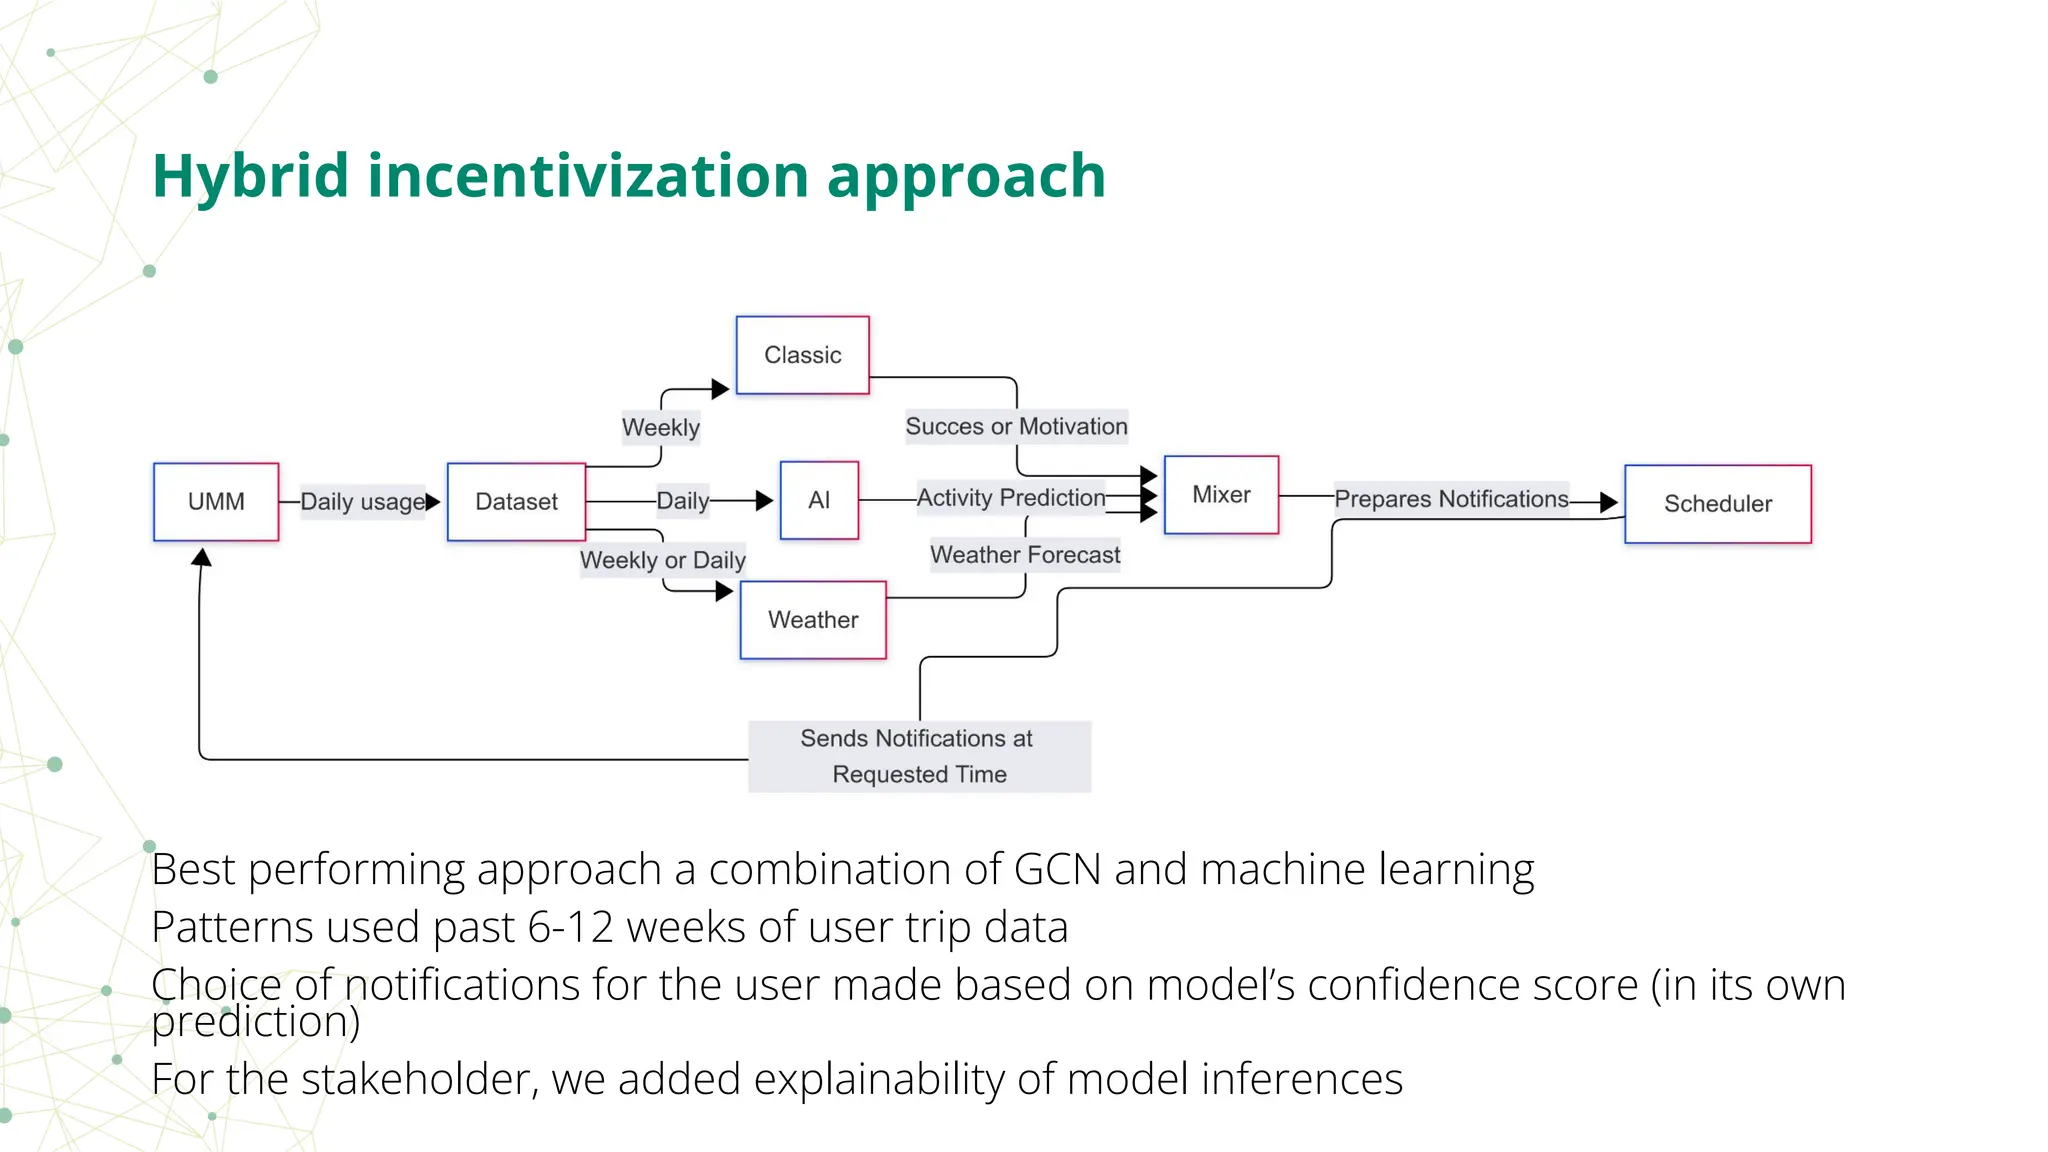
Best performing approacha combination of GCN and machine learning
Patterns used past 6-12 weeks of user trip data
Choice of notifications for the user made based on model’s confidence score (in its own
prediction)
For the stakeholder, we added explainability of model inferences
Hybrid incentivization approach
9.
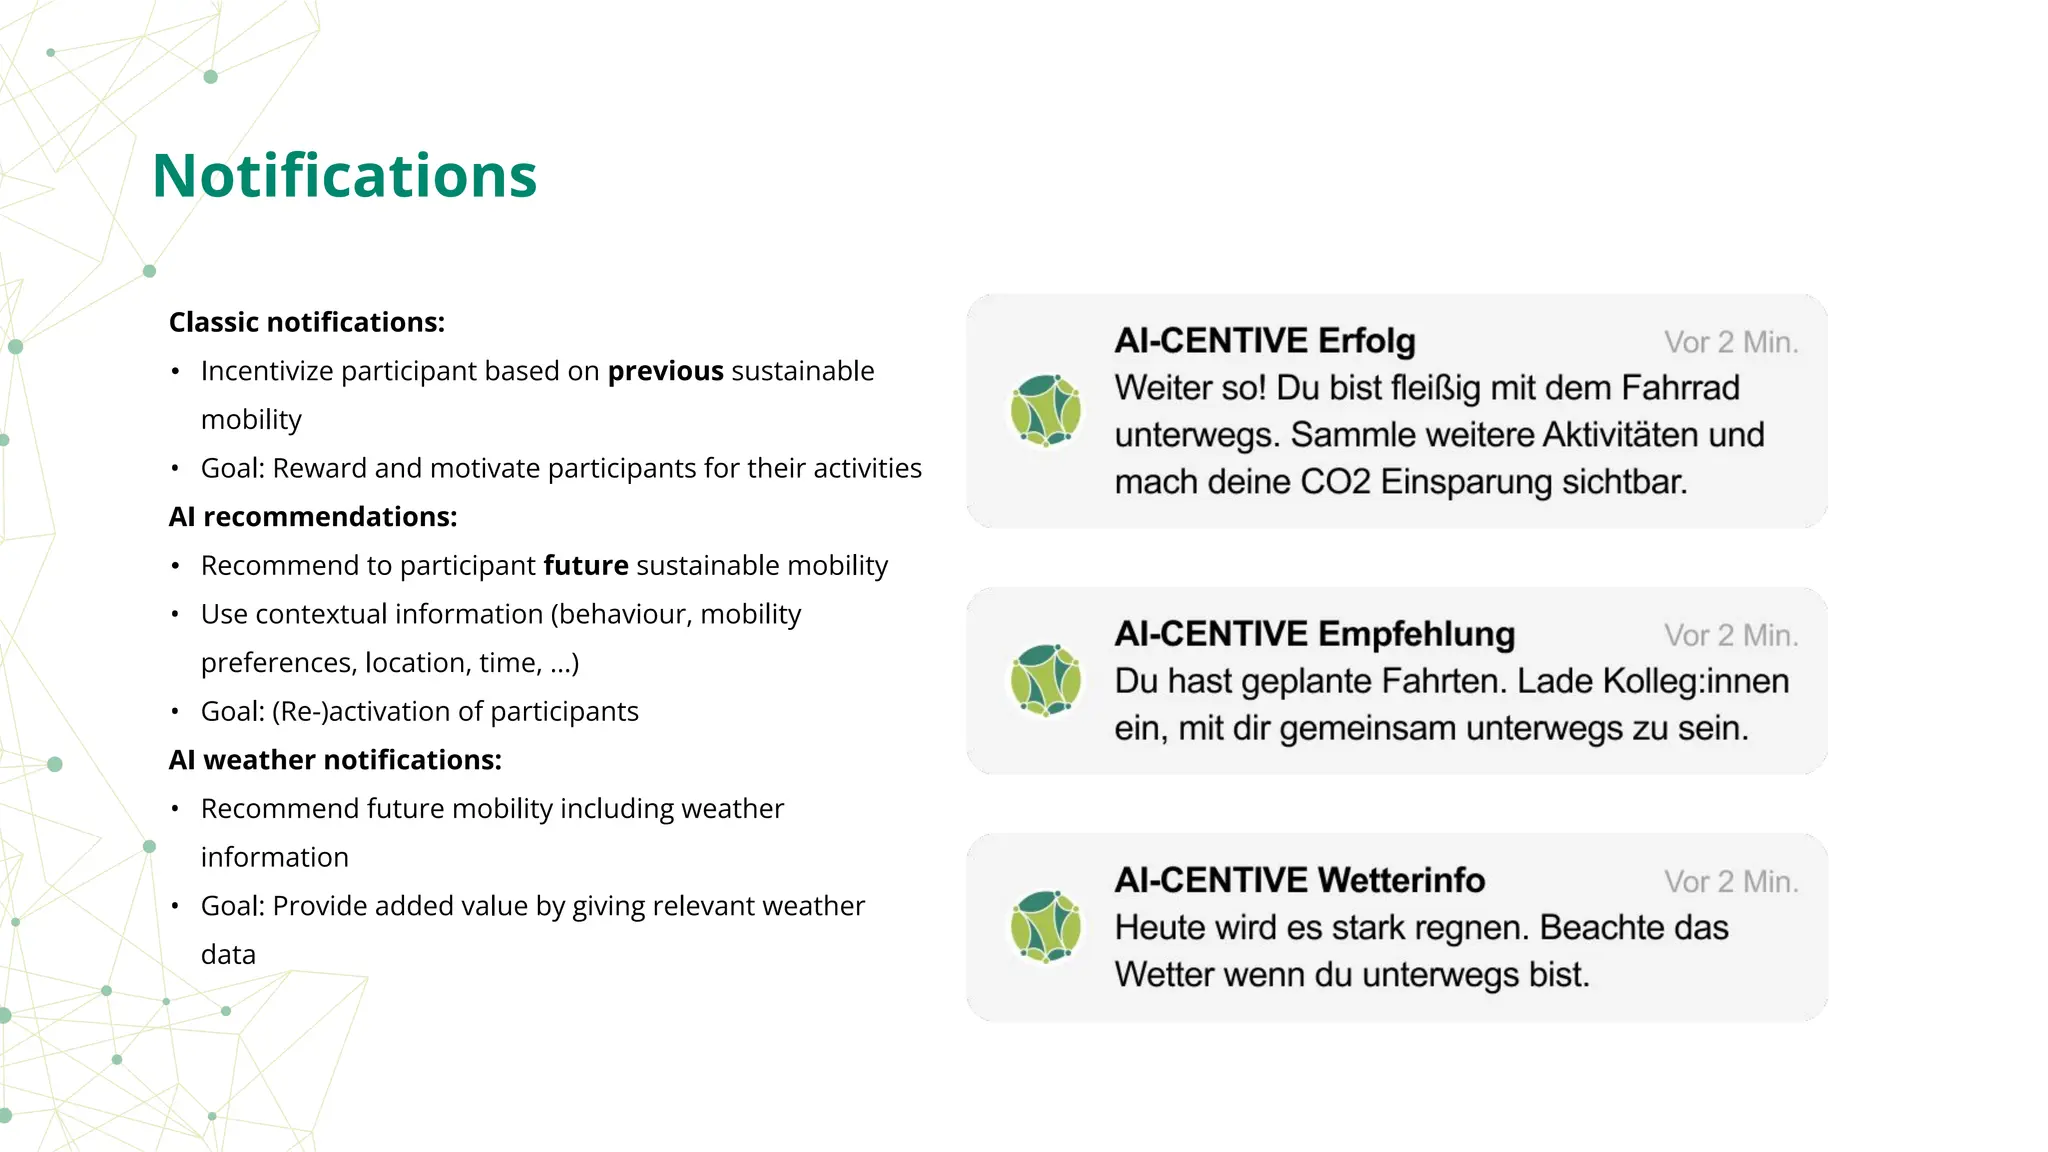
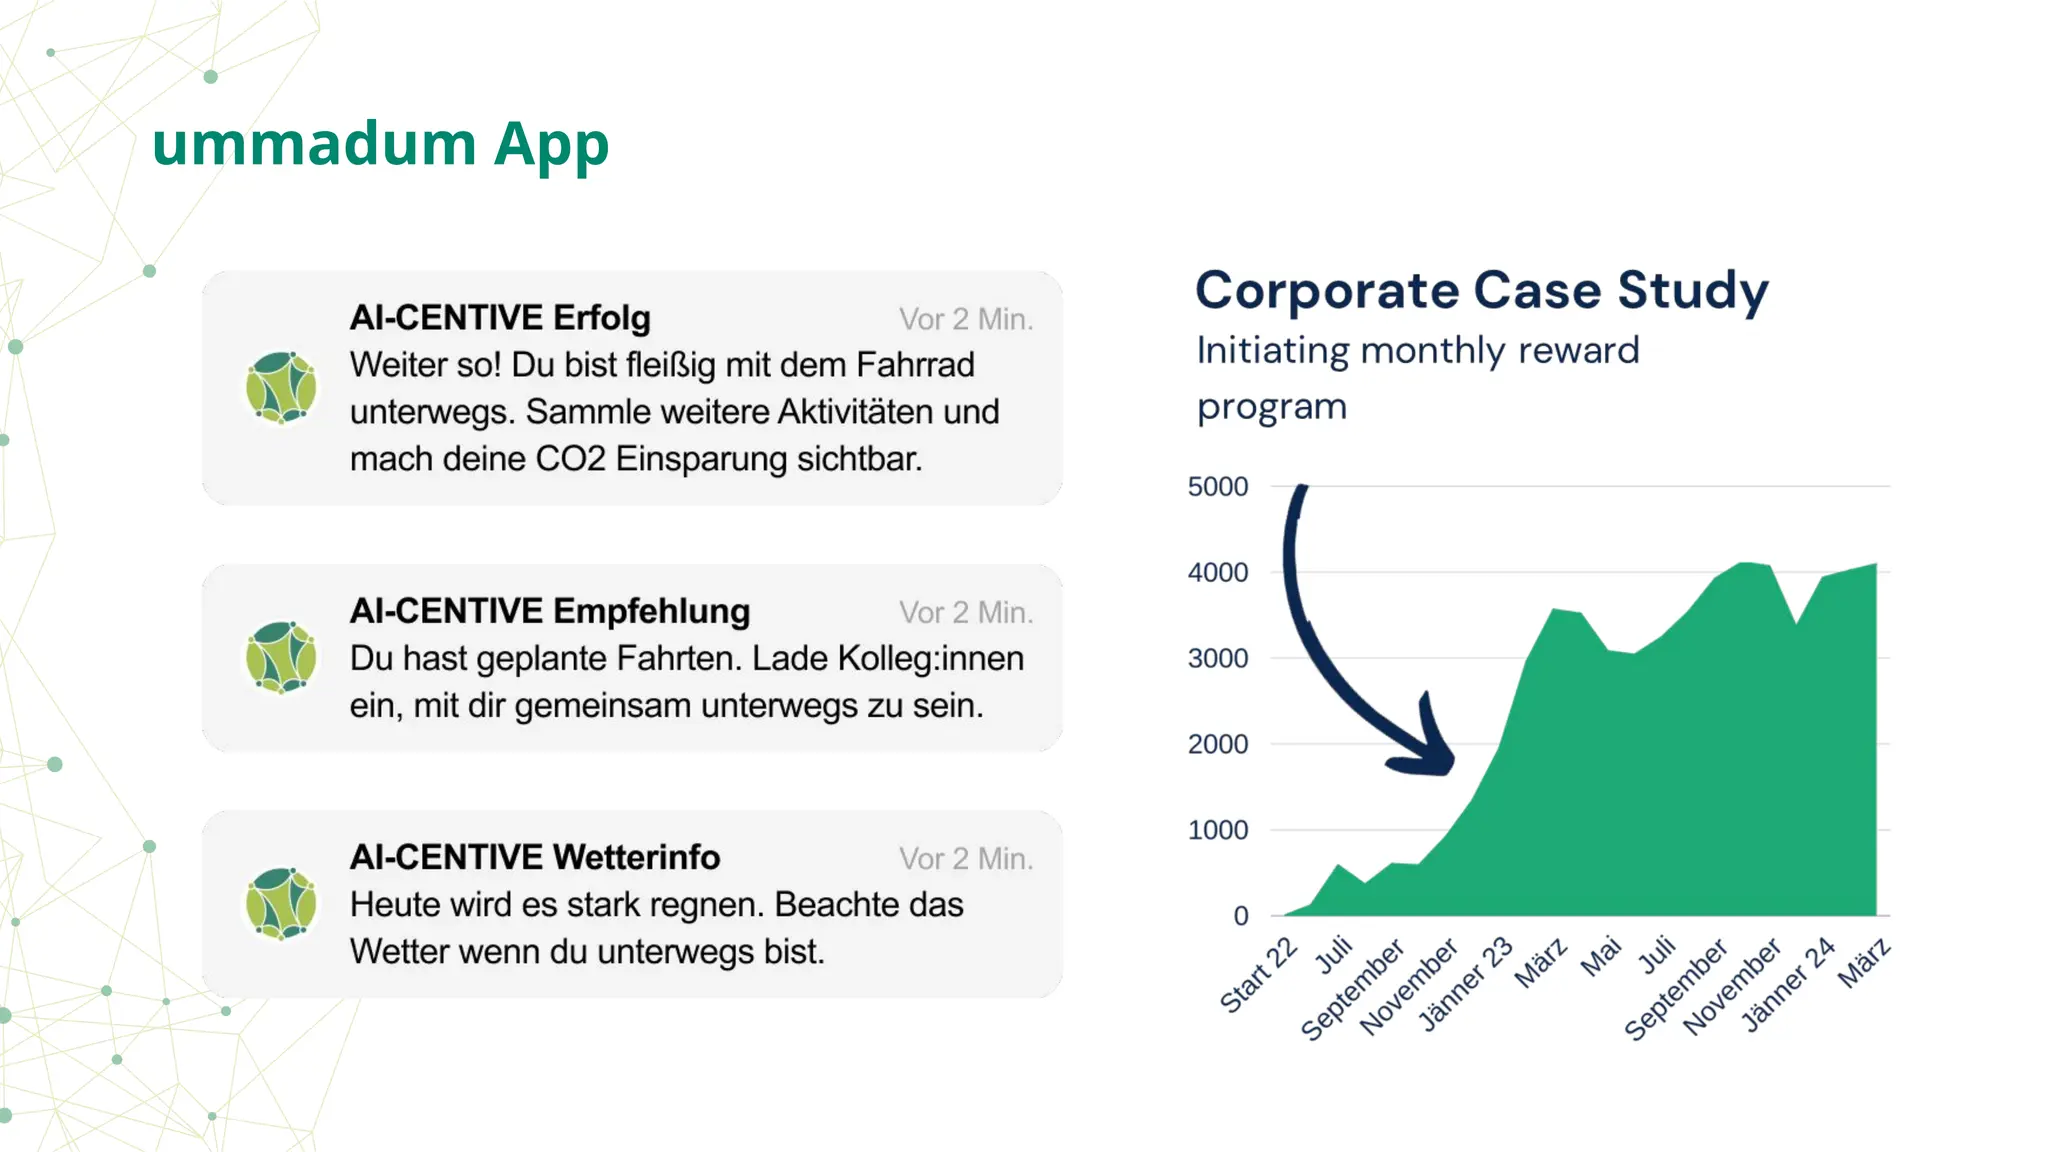
Classic notifications:
• Incentivizeparticipant based on previous sustainable
mobility
• Goal: Reward and motivate participants for their activities
AI recommendations:
• Recommend to participant future sustainable mobility
• Use contextual information (behaviour, mobility
preferences, location, time, ...)
• Goal: (Re-)activation of participants
AI weather notifications:
• Recommend future mobility including weather
information
• Goal: Provide added value by giving relevant weather
data
Notifications
10.
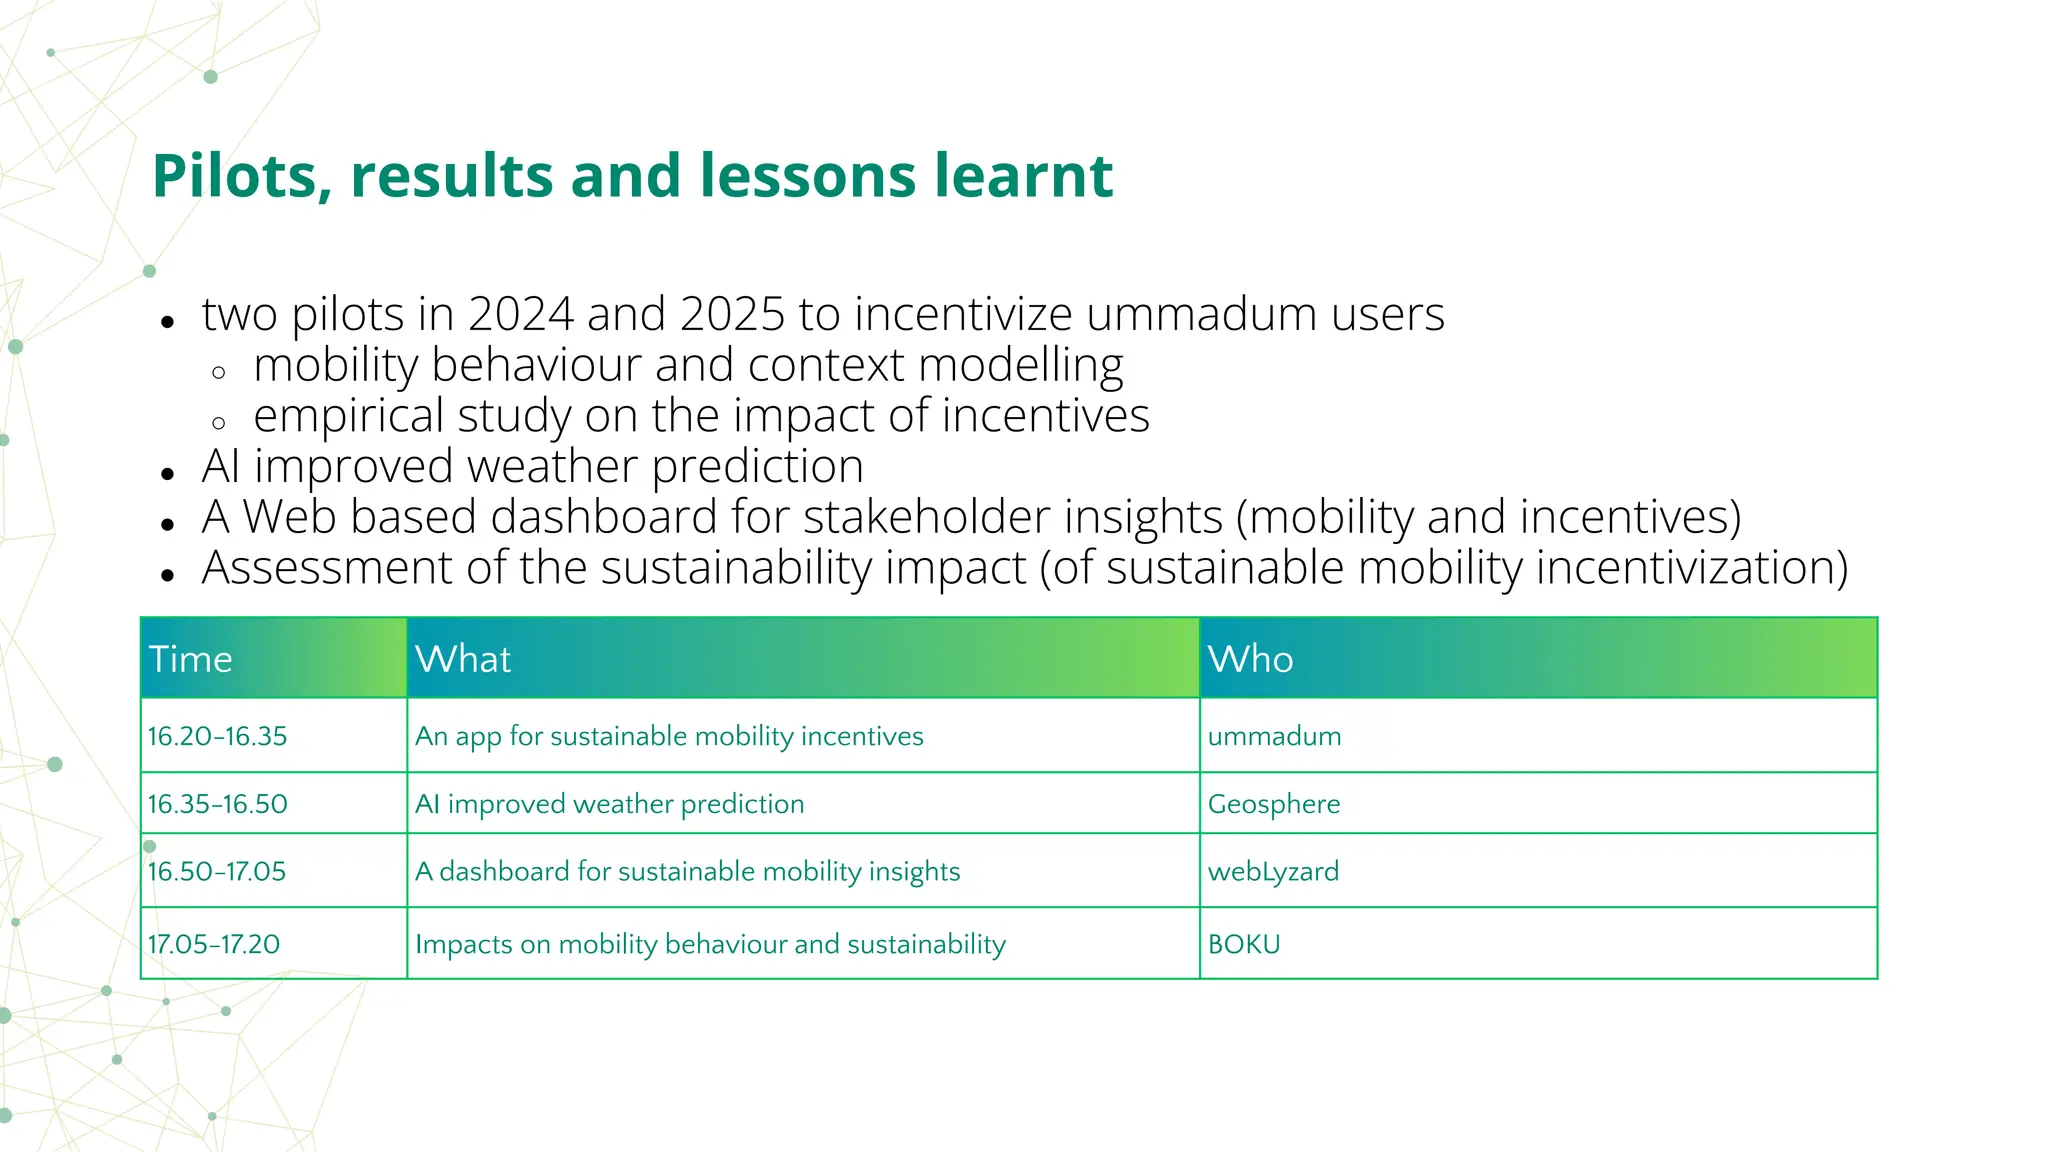
● two pilotsin 2024 and 2025 to incentivize ummadum users
○ mobility behaviour and context modelling
○ empirical study on the impact of incentives
● AI improved weather prediction
● A Web based dashboard for stakeholder insights (mobility and incentives)
● Assessment of the sustainability impact (of sustainable mobility incentivization)
Pilots, results and lessons learnt
Time What Who
16.20-16.35 An app for sustainable mobility incentives ummadum
16.35-16.50 AI improved weather prediction Geosphere
16.50-17.05 A dashboard for sustainable mobility insights webLyzard
17.05-17.20 Impacts on mobility behaviour and sustainability BOKU
11.
An app forsustainable
mobility incentives
Dave Kock
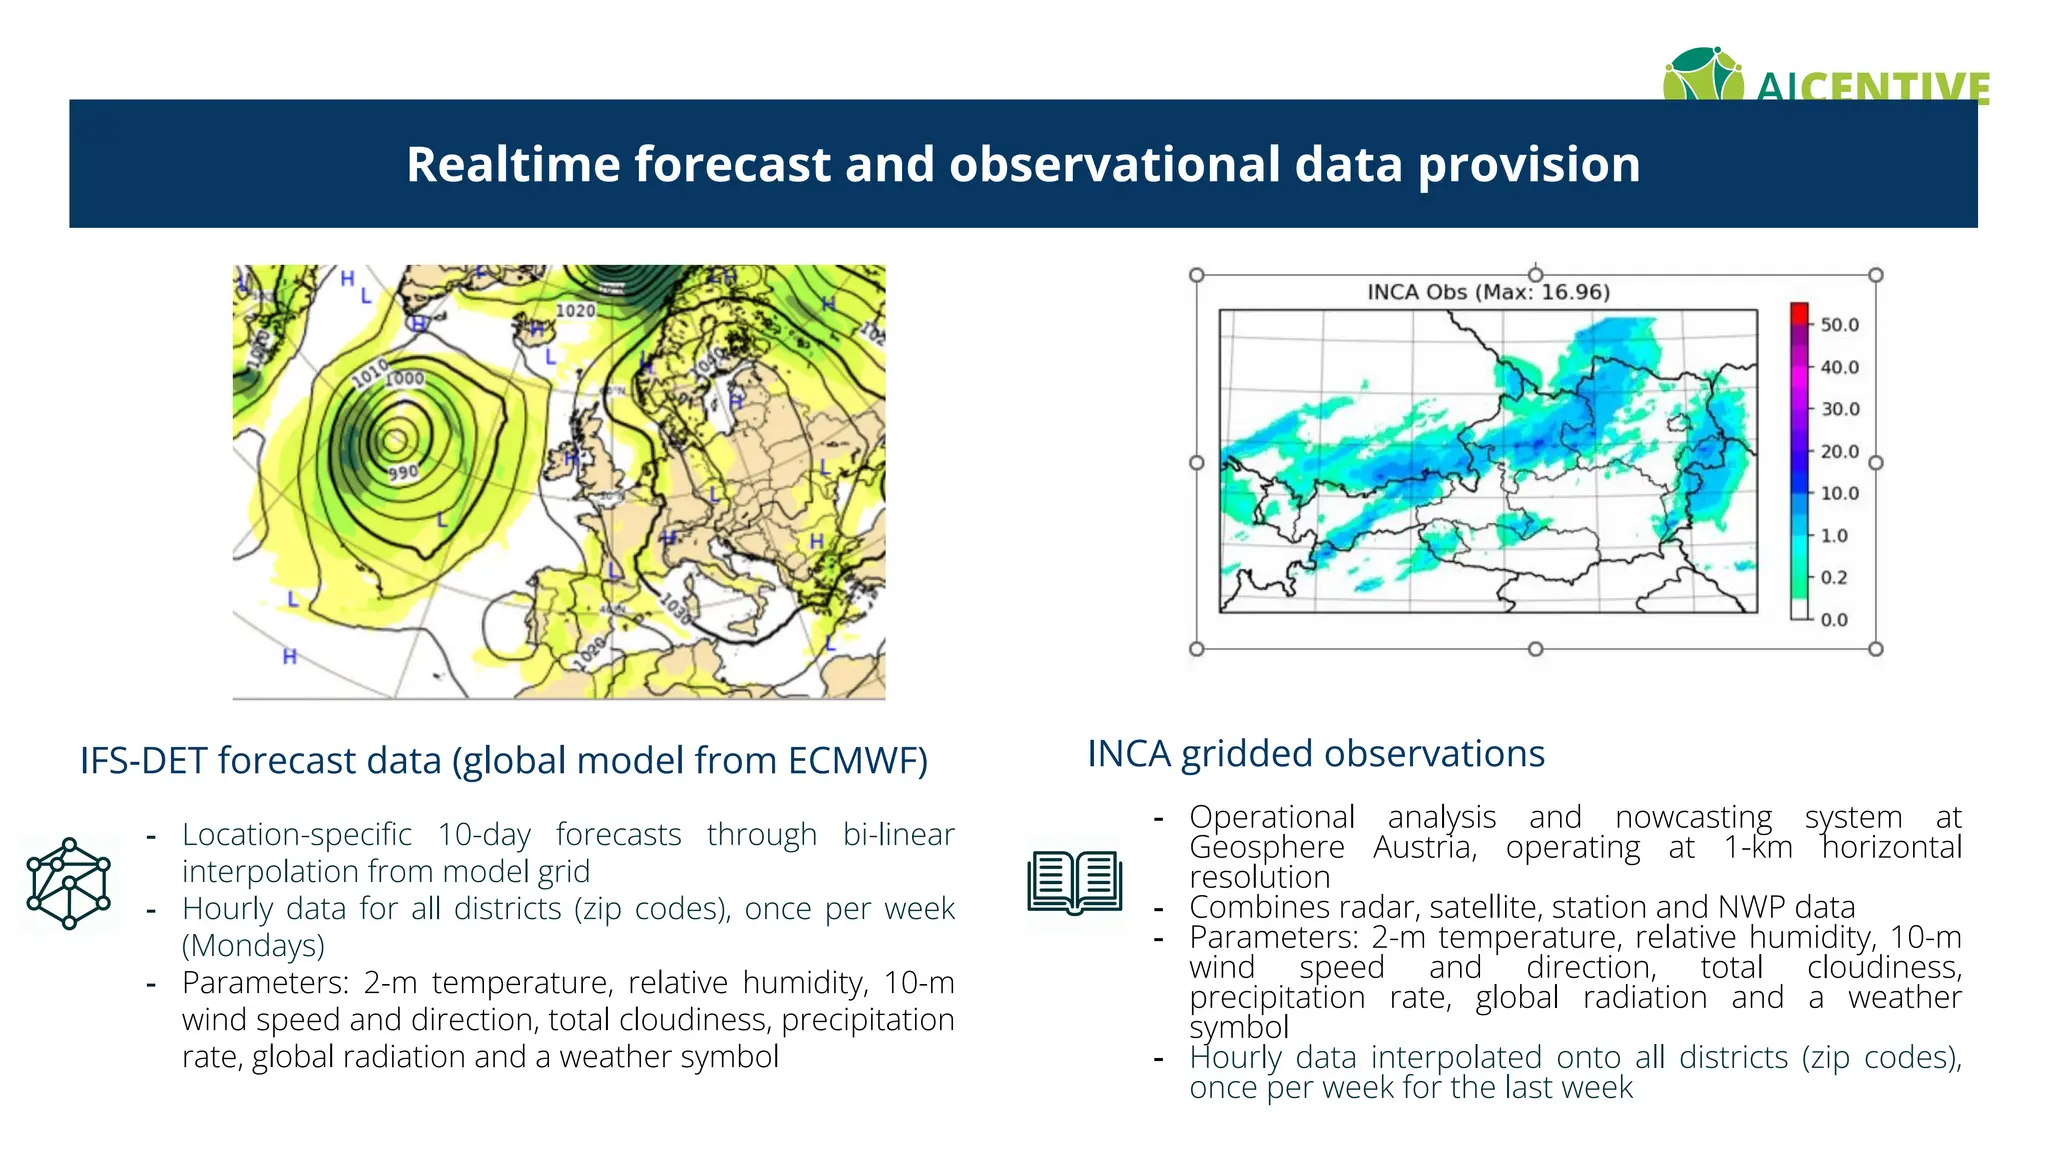
Realtime forecast andobservational data provision
IFS-DET forecast data (global model from ECMWF)
- Location-specific 10-day forecasts through bi-linear
interpolation from model grid
- Hourly data for all districts (zip codes), once per week
(Mondays)
- Parameters: 2-m temperature, relative humidity, 10-m
wind speed and direction, total cloudiness, precipitation
rate, global radiation and a weather symbol
INCA gridded observations
- Operational analysis and nowcasting system at
Geosphere Austria, operating at 1-km horizontal
resolution
- Combines radar, satellite, station and NWP data
- Parameters: 2-m temperature, relative humidity, 10-m
wind speed and direction, total cloudiness,
precipitation rate, global radiation and a weather
symbol
- Hourly data interpolated onto all districts (zip codes),
once per week for the last week
17.
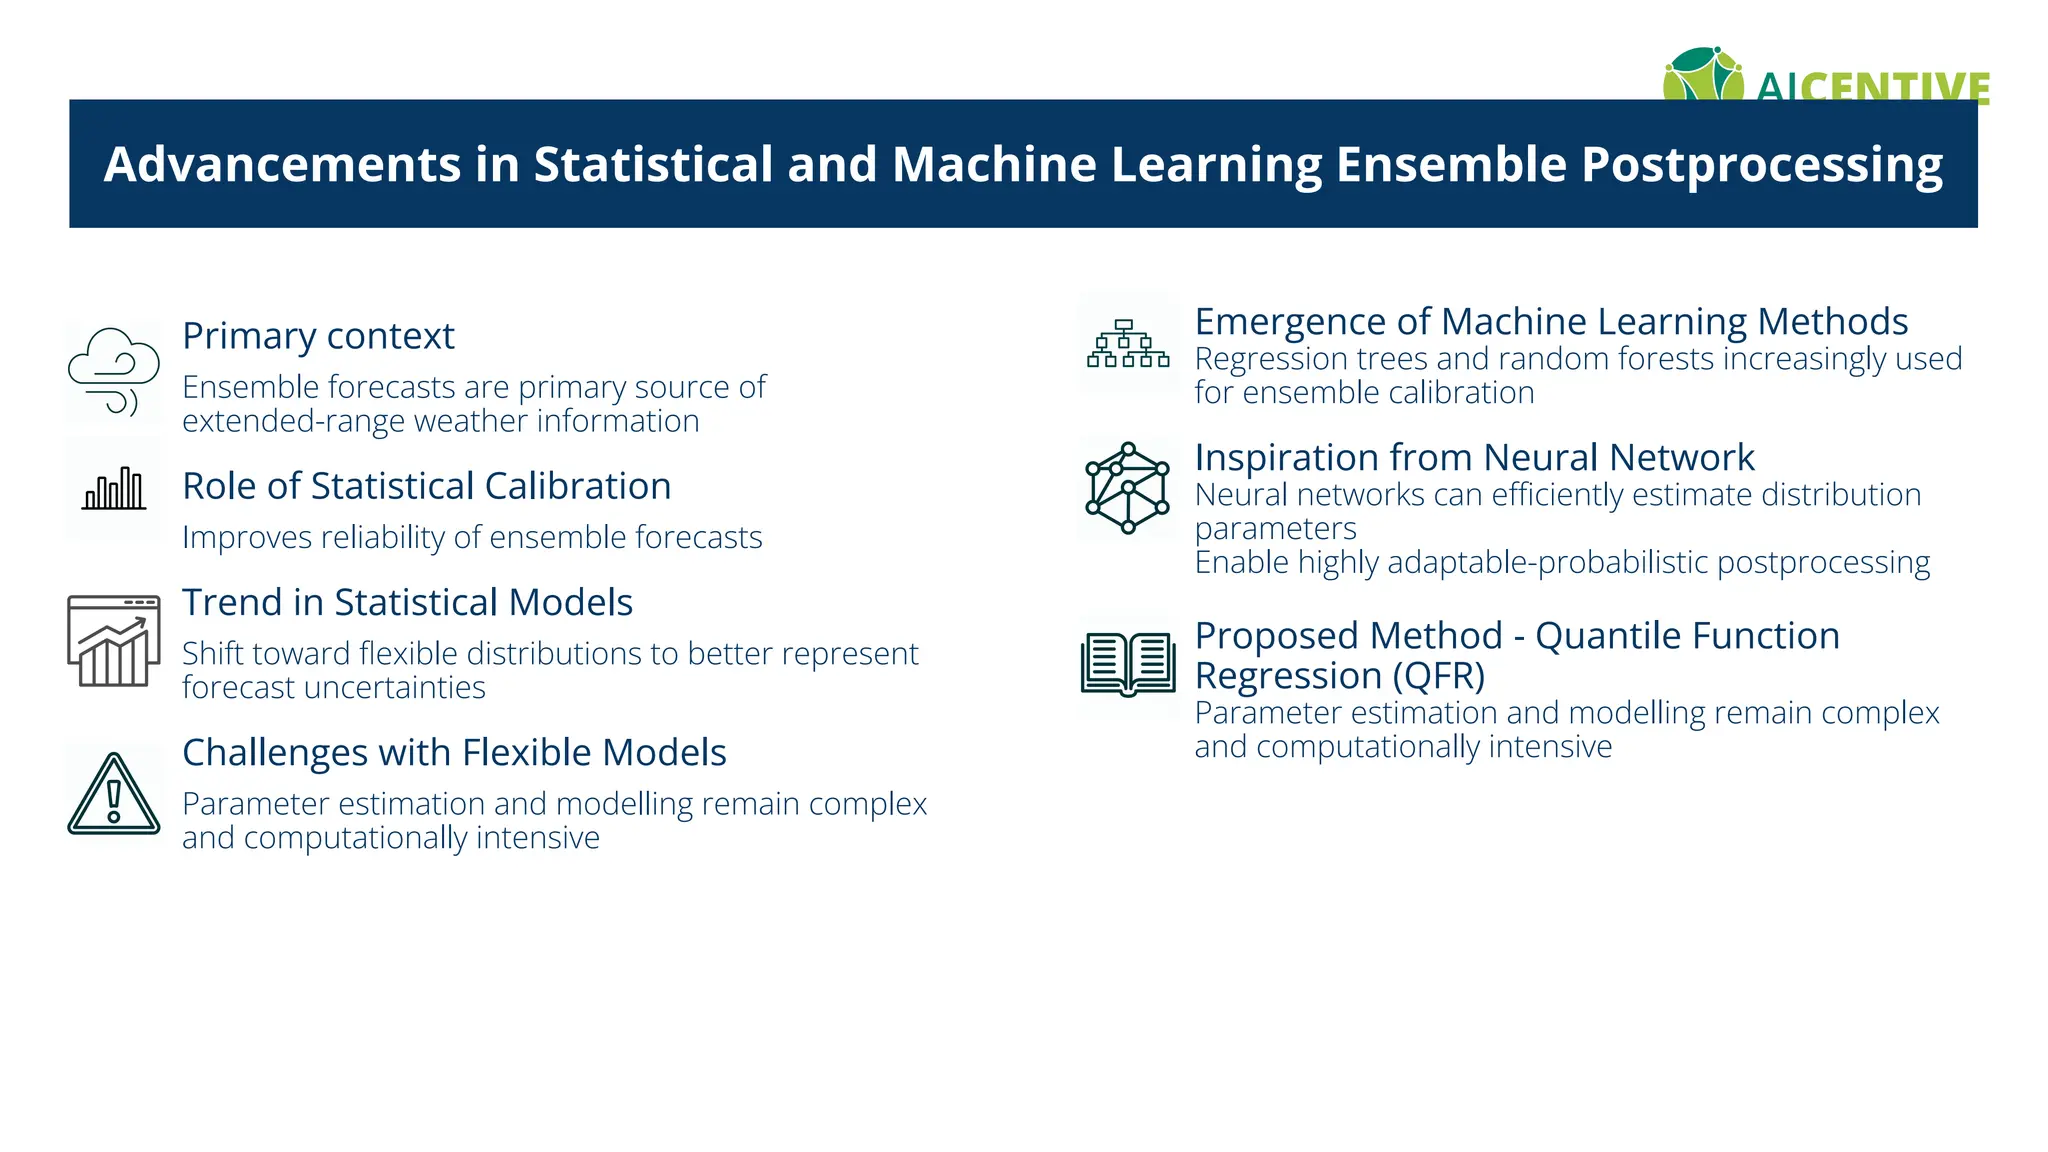
Advancements in Statisticaland Machine Learning Ensemble Postprocessing
Primary context
Ensemble forecasts are primary source of
extended-range weather information
Role of Statistical Calibration
Improves reliability of ensemble forecasts
Trend in Statistical Models
Shift toward flexible distributions to better represent
forecast uncertainties
Challenges with Flexible Models
Parameter estimation and modelling remain complex
and computationally intensive
Emergence of Machine Learning Methods
Regression trees and random forests increasingly used
for ensemble calibration
Inspiration from Neural Network
Neural networks can efficiently estimate distribution
parameters
Enable highly adaptable-probabilistic postprocessing
Proposed Method - Quantile Function
Regression (QFR)
Parameter estimation and modelling remain complex
and computationally intensive
18.
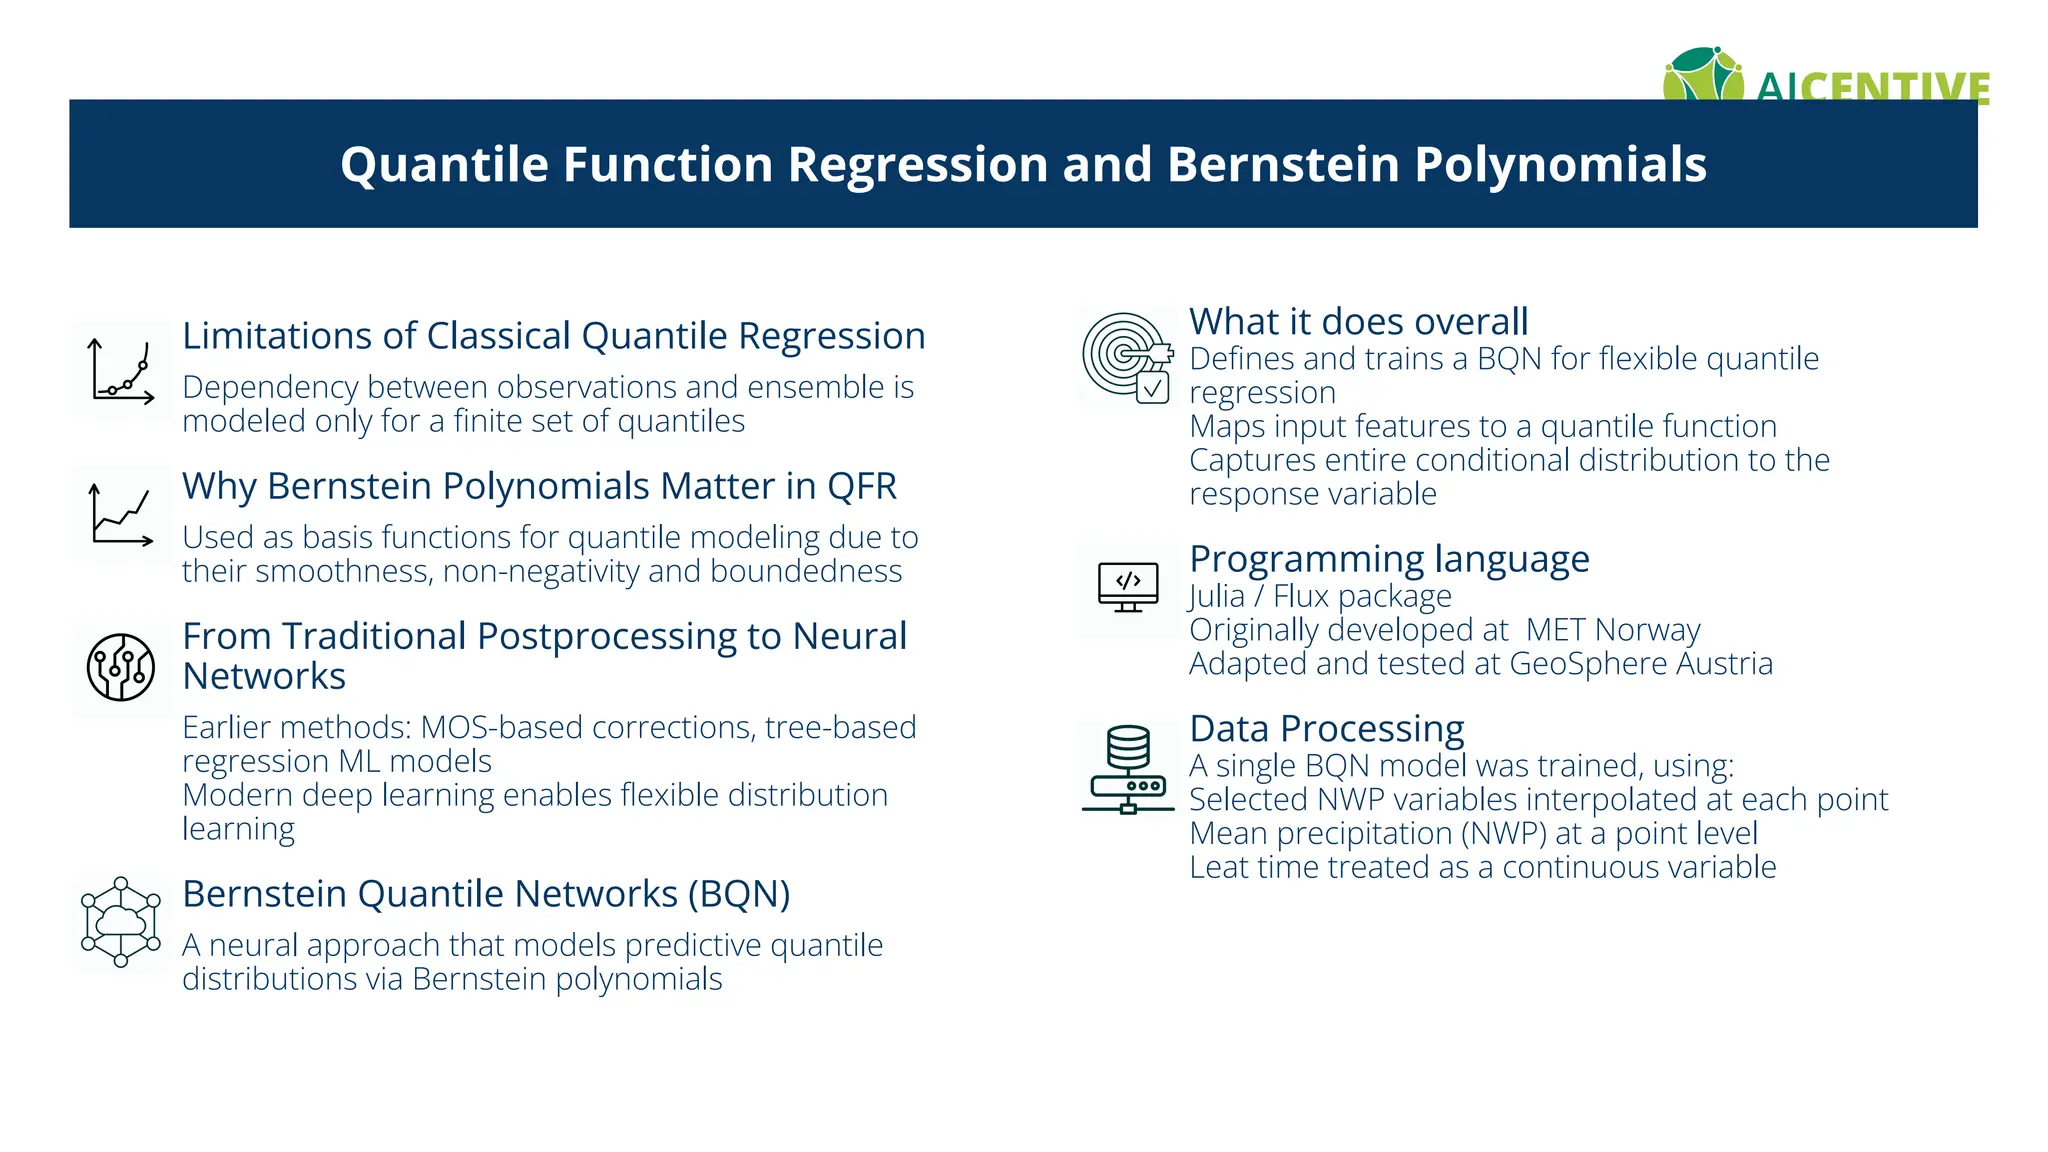
Quantile Function Regressionand Bernstein Polynomials
Limitations of Classical Quantile Regression
Dependency between observations and ensemble is
modeled only for a finite set of quantiles
Why Bernstein Polynomials Matter in QFR
Used as basis functions for quantile modeling due to
their smoothness, non-negativity and boundedness
From Traditional Postprocessing to Neural
Networks
Earlier methods: MOS-based corrections, tree-based
regression ML models
Modern deep learning enables flexible distribution
learning
Bernstein Quantile Networks (BQN)
A neural approach that models predictive quantile
distributions via Bernstein polynomials
What it does overall
Defines and trains a BQN for flexible quantile
regression
Maps input features to a quantile function
Captures entire conditional distribution to the
response variable
Programming language
Julia / Flux package
Originally developed at MET Norway
Adapted and tested at GeoSphere Austria
Data Processing
• A single BQN model was trained, using:
Selected NWP variables interpolated at each point
Mean precipitation (NWP) at a point level
Leat time treated as a continuous variable
19.
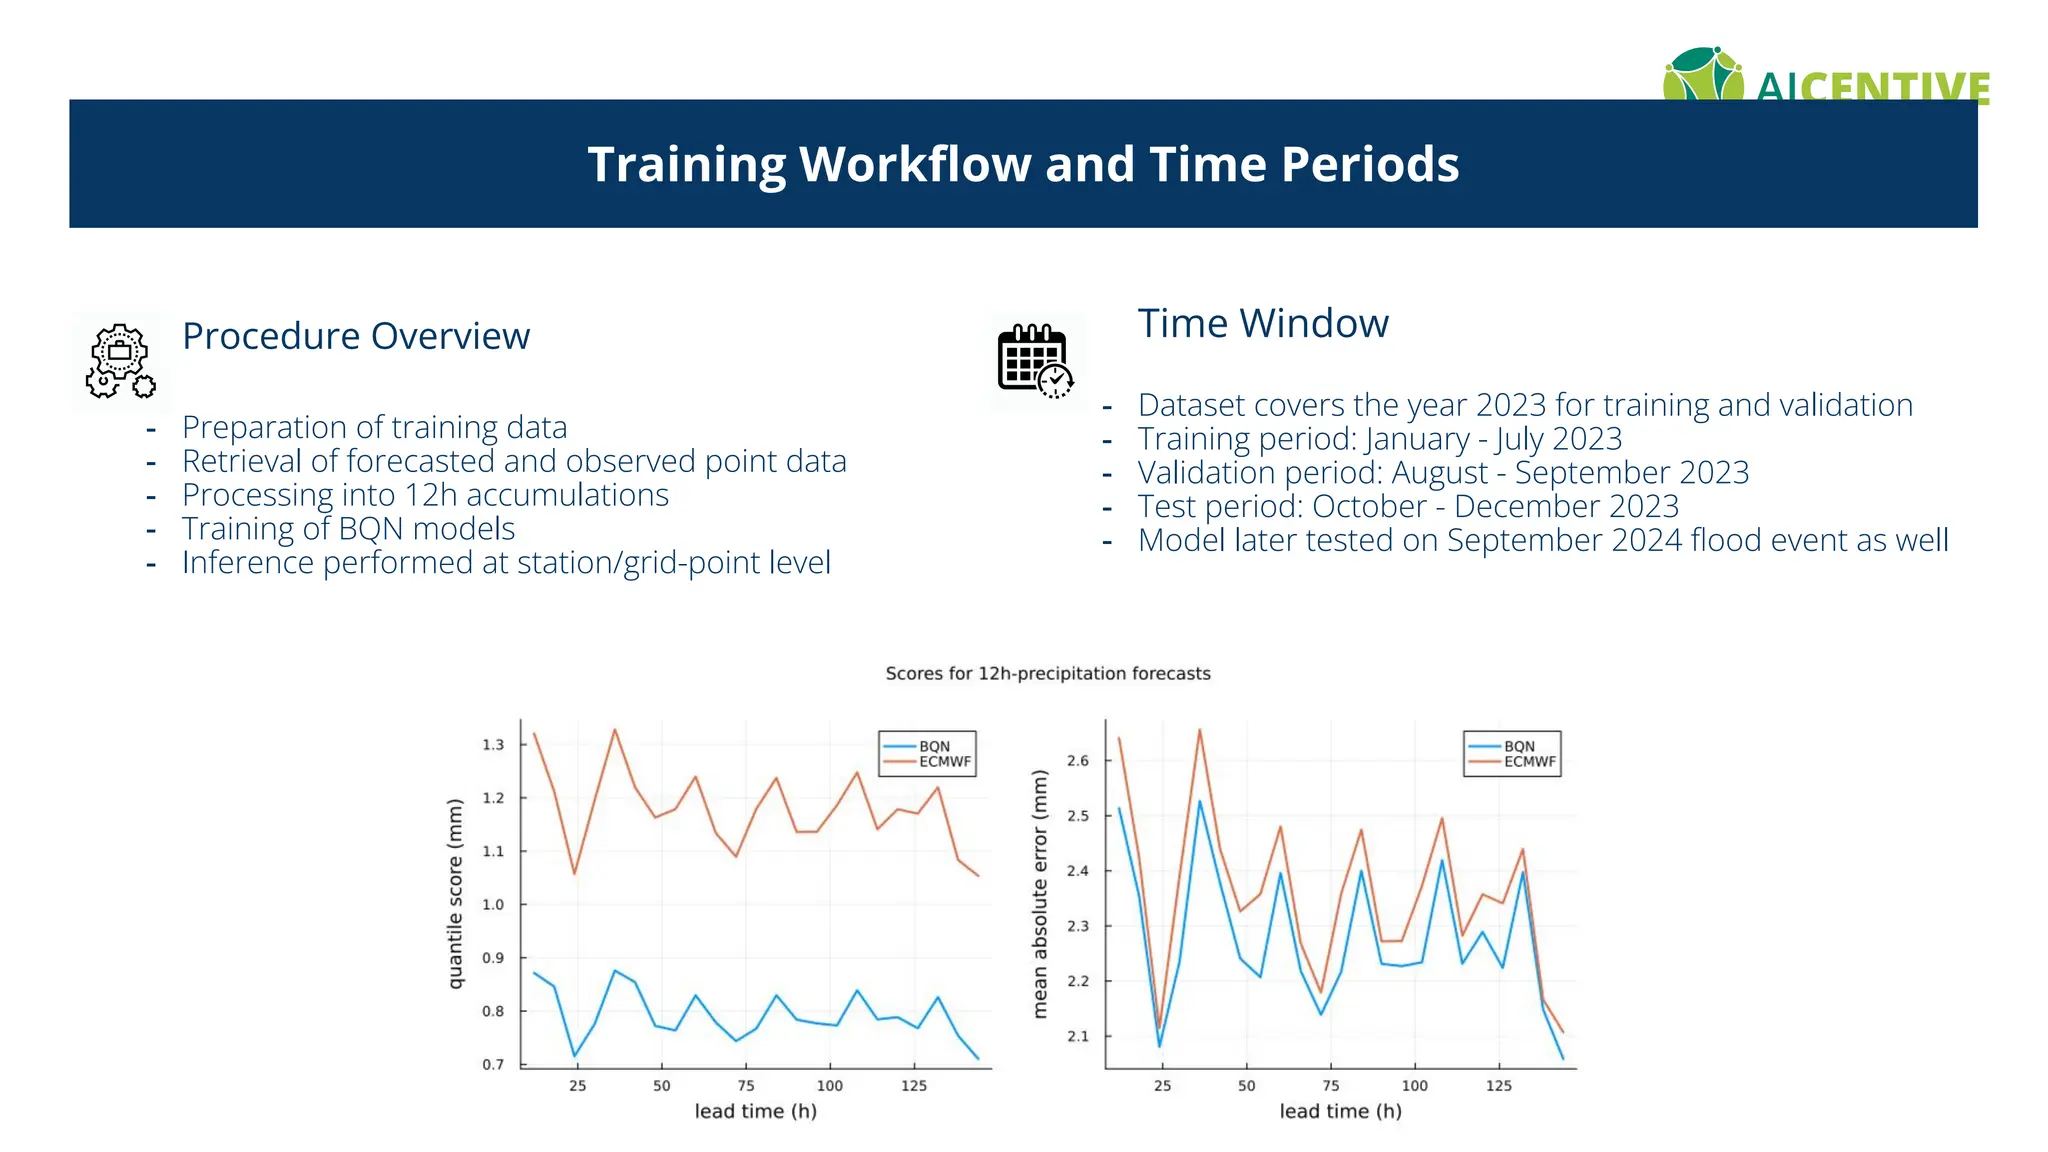
Training Workflow andTime Periods
Procedure Overview
- Preparation of training data
- Retrieval of forecasted and observed point data
- Processing into 12h accumulations
- Training of BQN models
- Inference performed at station/grid-point level
Time Window
- Dataset covers the year 2023 for training and validation
- Training period: January - July 2023
- Validation period: August - September 2023
- Test period: October - December 2023
- Model later tested on September 2024 flood event as well
20.
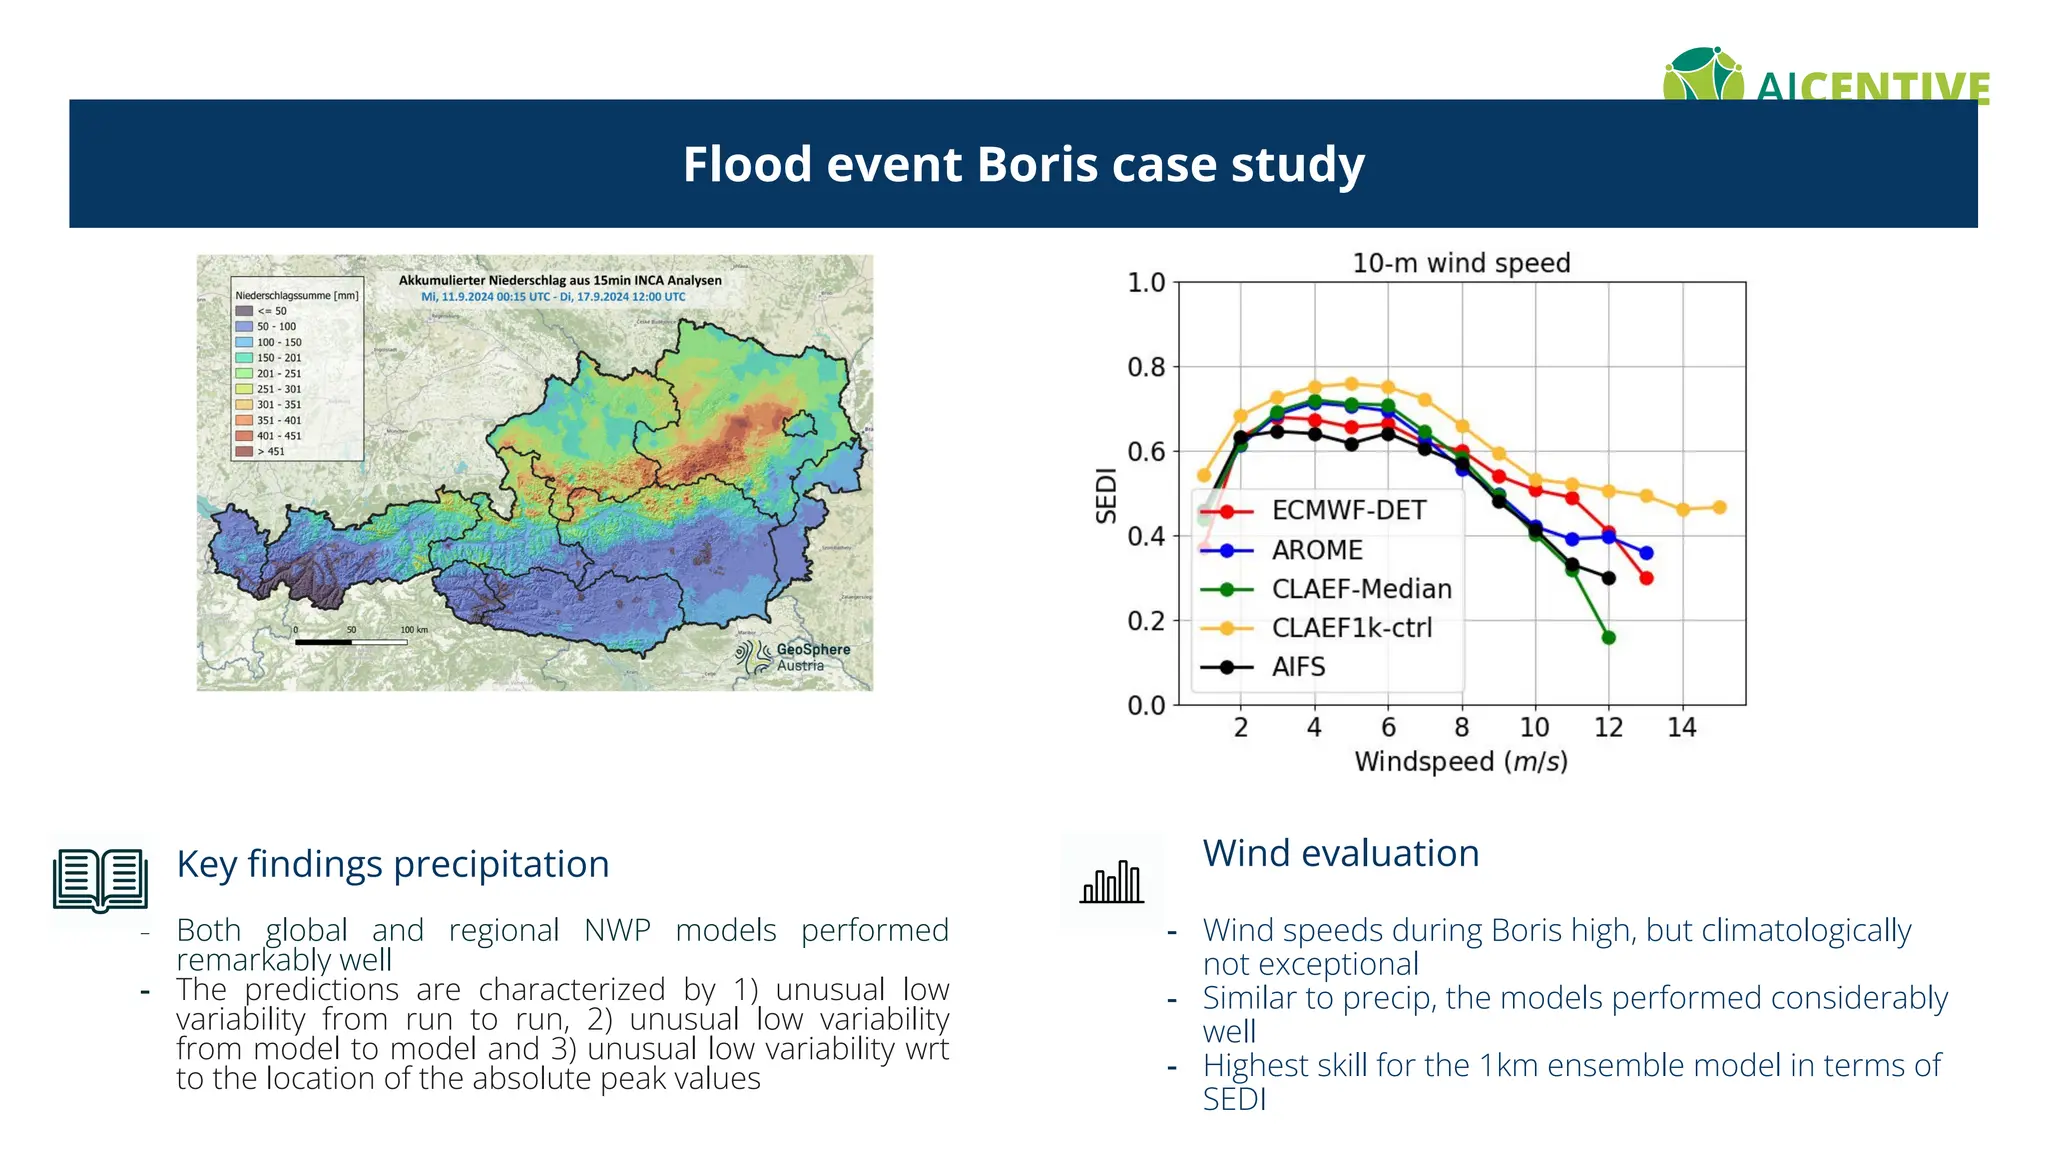
Flood event Boriscase study
Key findings precipitation
- Both global and regional NWP models performed
remarkably well
- The predictions are characterized by 1) unusual low
variability from run to run, 2) unusual low variability
from model to model and 3) unusual low variability wrt
to the location of the absolute peak values
Wind evaluation
- Wind speeds during Boris high, but climatologically
not exceptional
- Similar to precip, the models performed considerably
well
- Highest skill for the 1km ensemble model in terms of
SEDI
21.
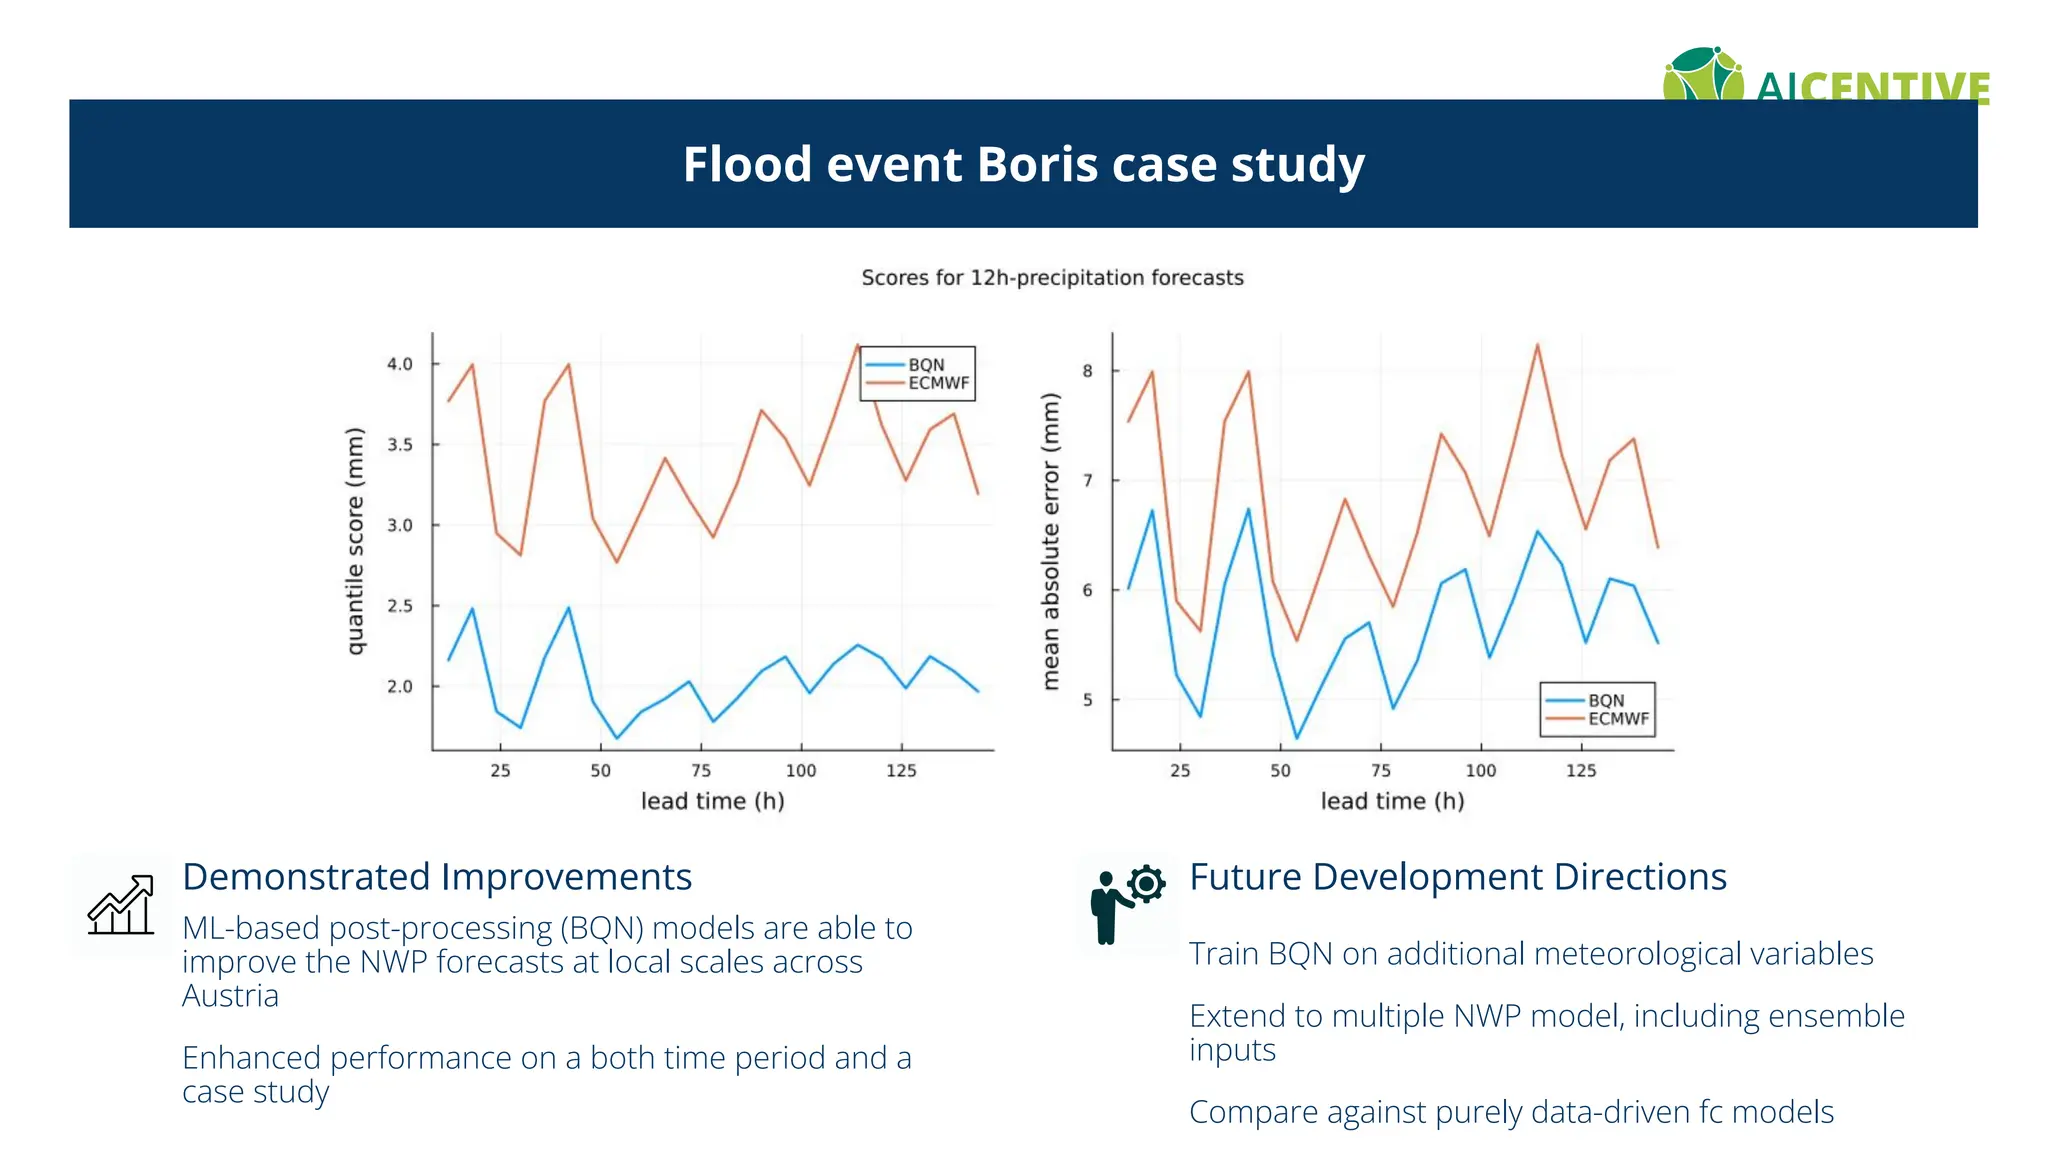
Flood event Boriscase study
Demonstrated Improvements
ML-based post-processing (BQN) models are able to
improve the NWP forecasts at local scales across
Austria
Enhanced performance on a both time period and a
case study
Future Development Directions
Train BQN on additional meteorological variables
Extend to multiple NWP model, including ensemble
inputs
Compare against purely data-driven fc models
Impacts on mobilitybehaviour
and sustainability
Astrid Gühnemann
(Reinhard Hössinger, Tobias Dürrhammer, Valerie Jeepjua)
30.
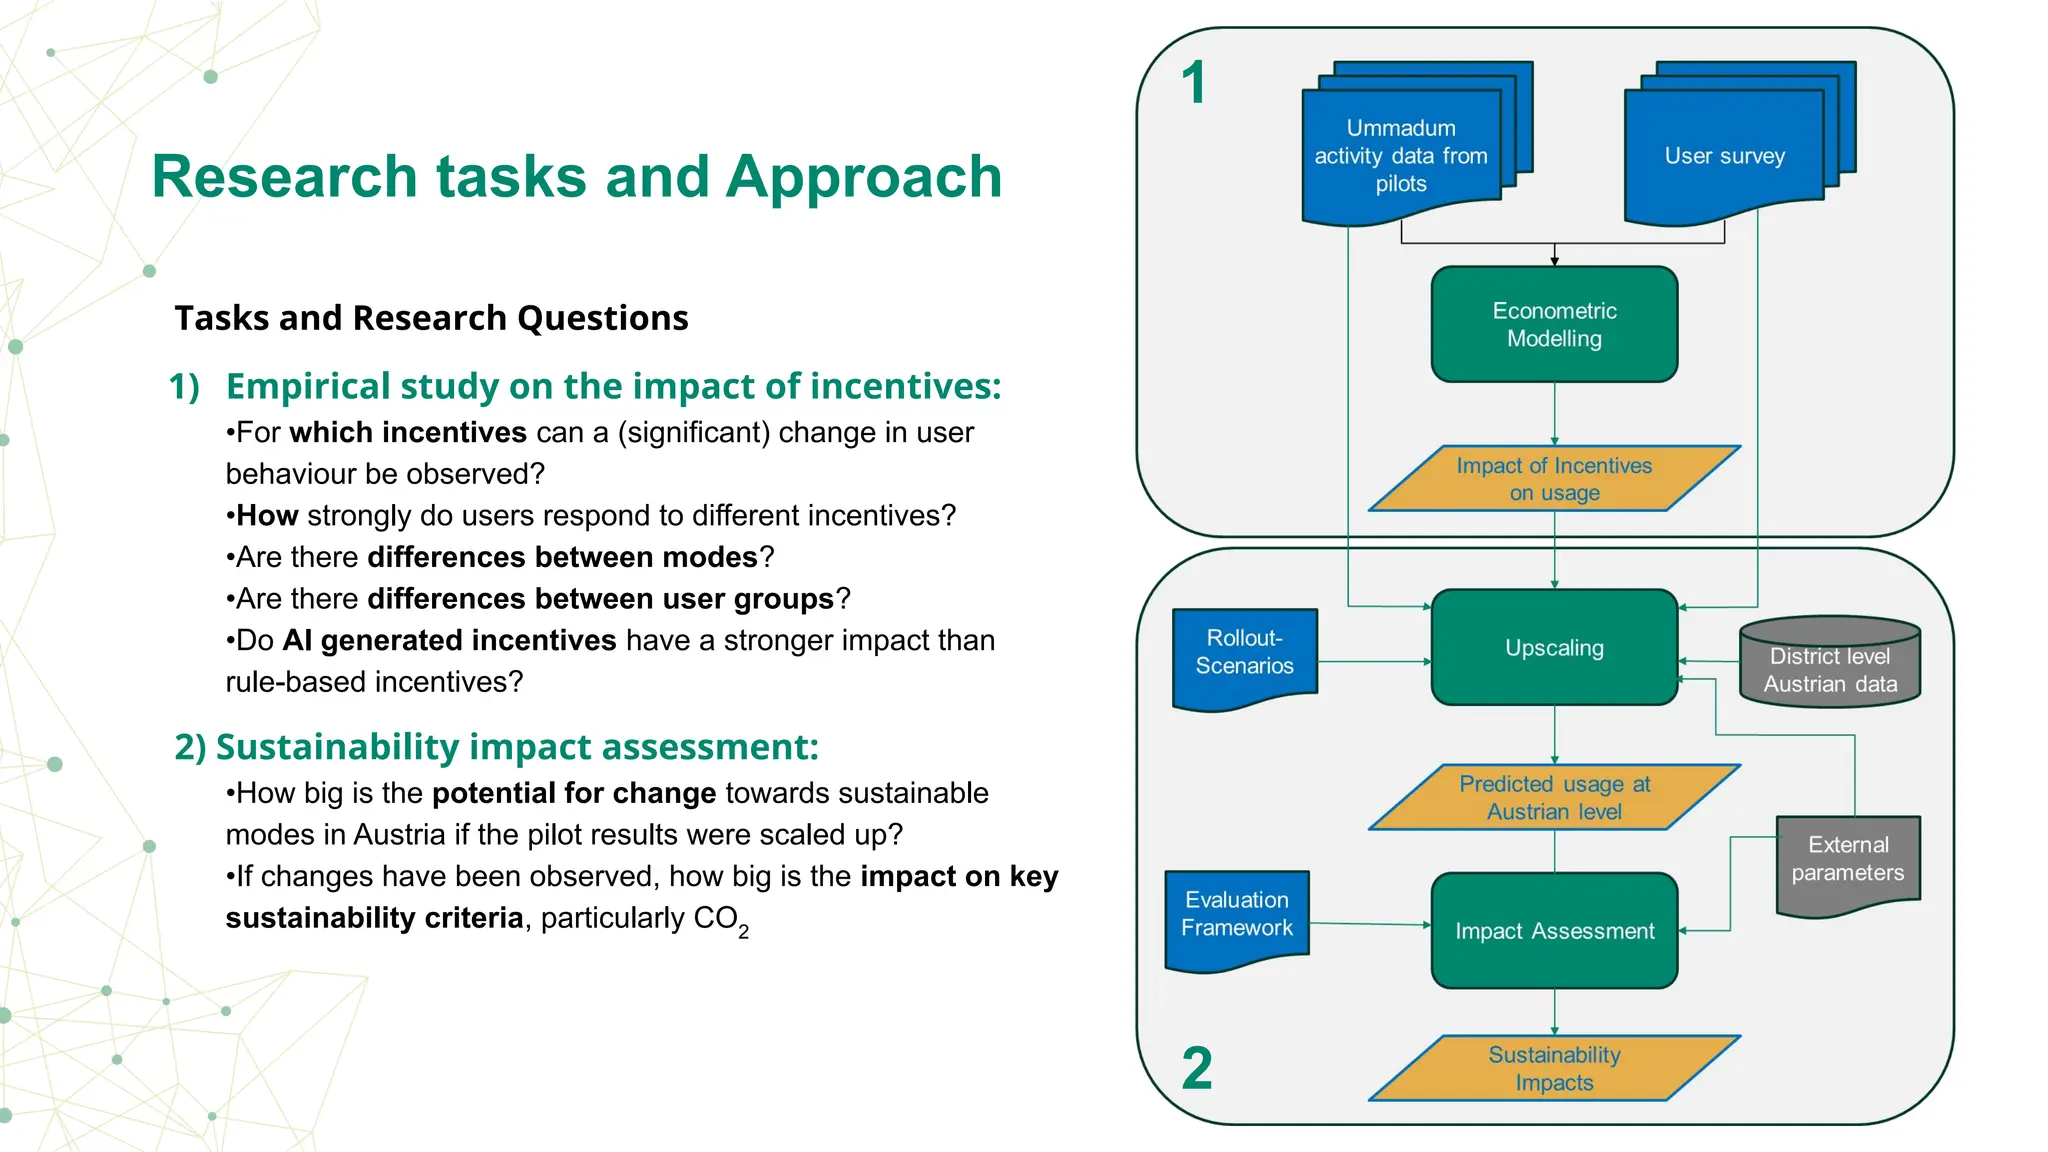
Research tasks andApproach
Tasks and Research Questions
1) Empirical study on the impact of incentives:
•For which incentives can a (significant) change in user
behaviour be observed?
•How strongly do users respond to different incentives?
•Are there differences between modes?
•Are there differences between user groups?
•Do AI generated incentives have a stronger impact than
rule-based incentives?
2) Sustainability impact assessment:
•How big is the potential for change towards sustainable
modes in Austria if the pilot results were scaled up?
•If changes have been observed, how big is the impact on key
sustainability criteria, particularly CO2
2
1
31.
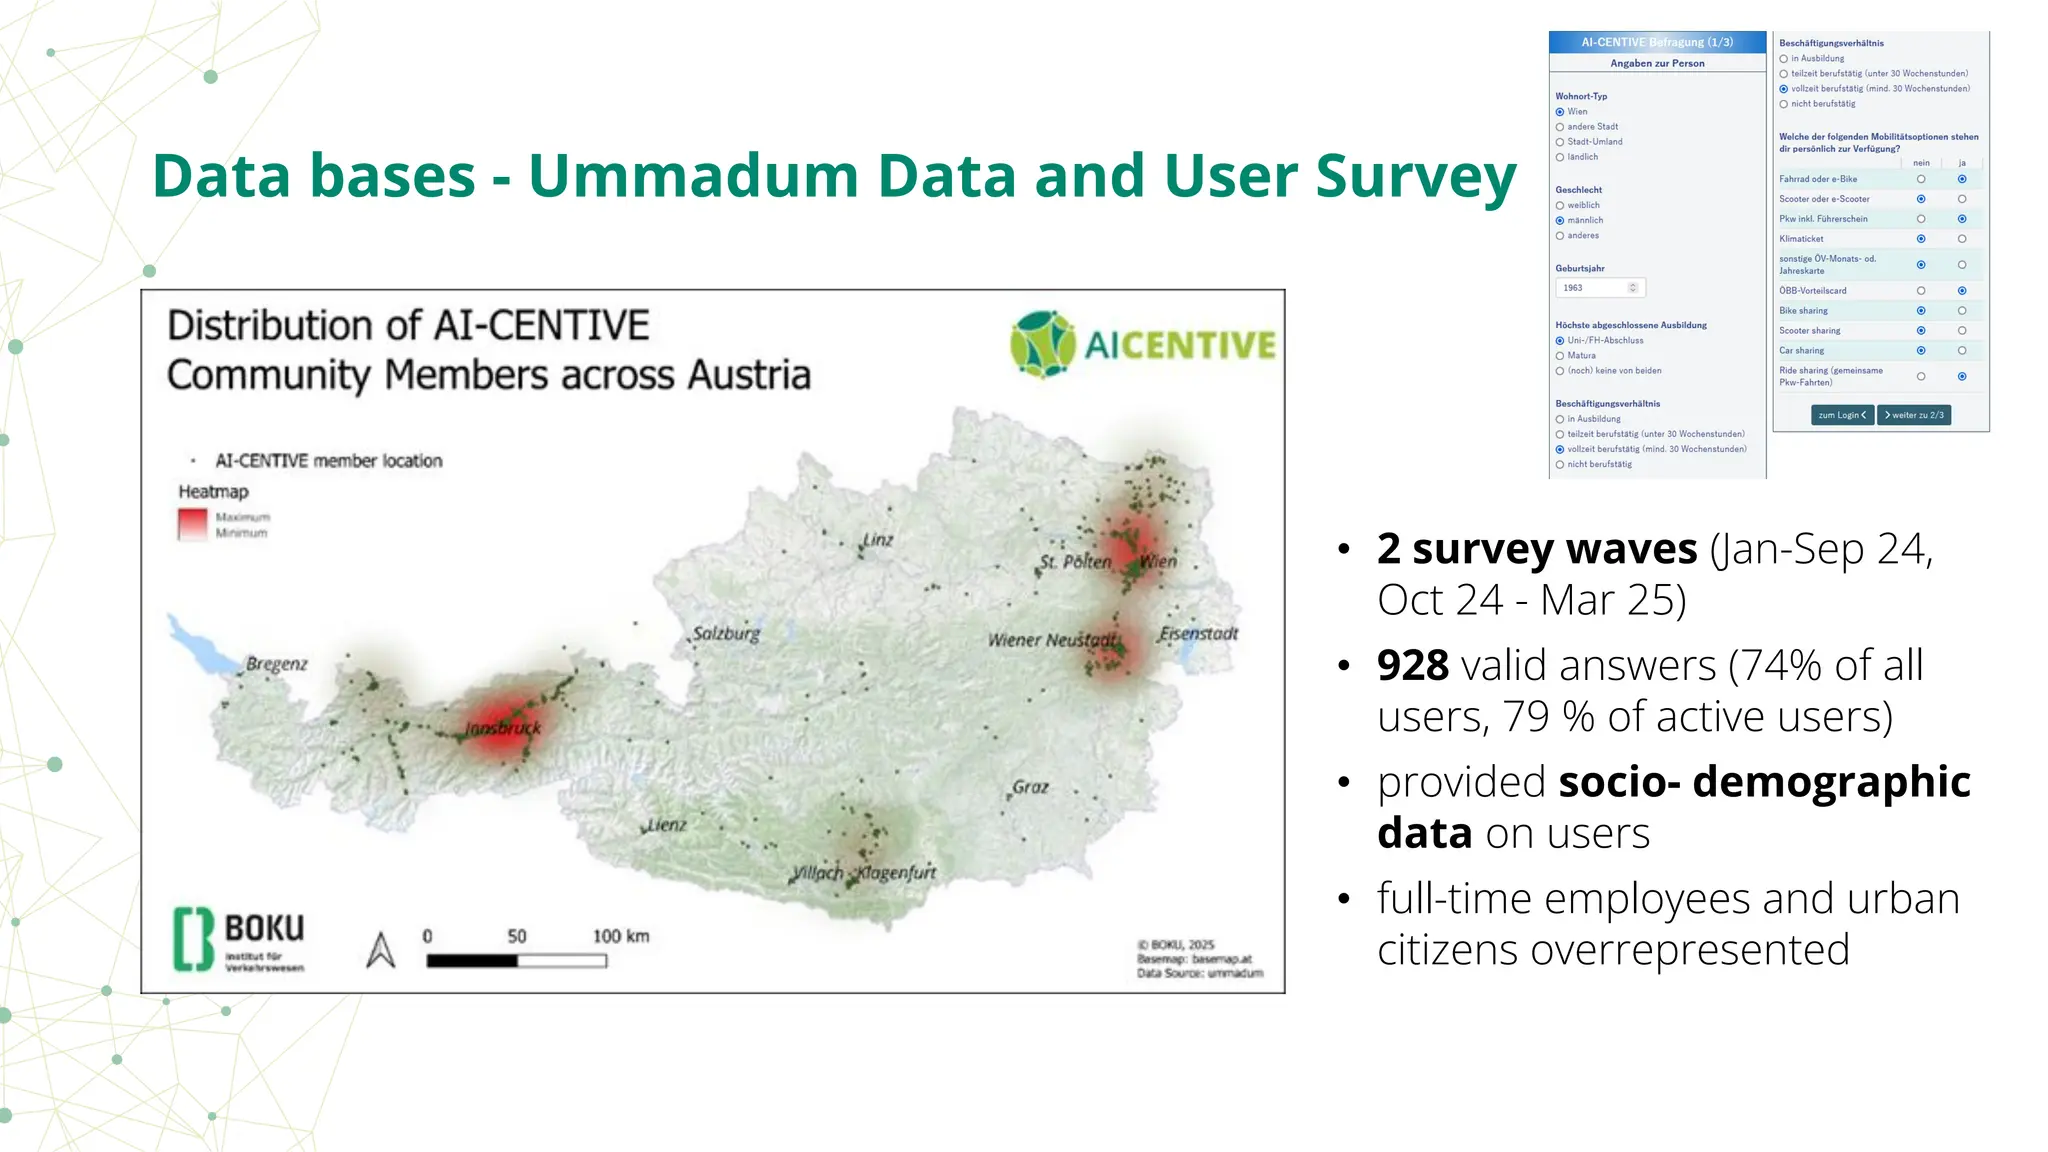
Data bases -Ummadum Data and User Survey
• 2 survey waves (Jan-Sep 24,
Oct 24 - Mar 25)
• 928 valid answers (74% of all
users, 79 % of active users)
• provided socio- demographic
data on users
• full-time employees and urban
citizens overrepresented
32.
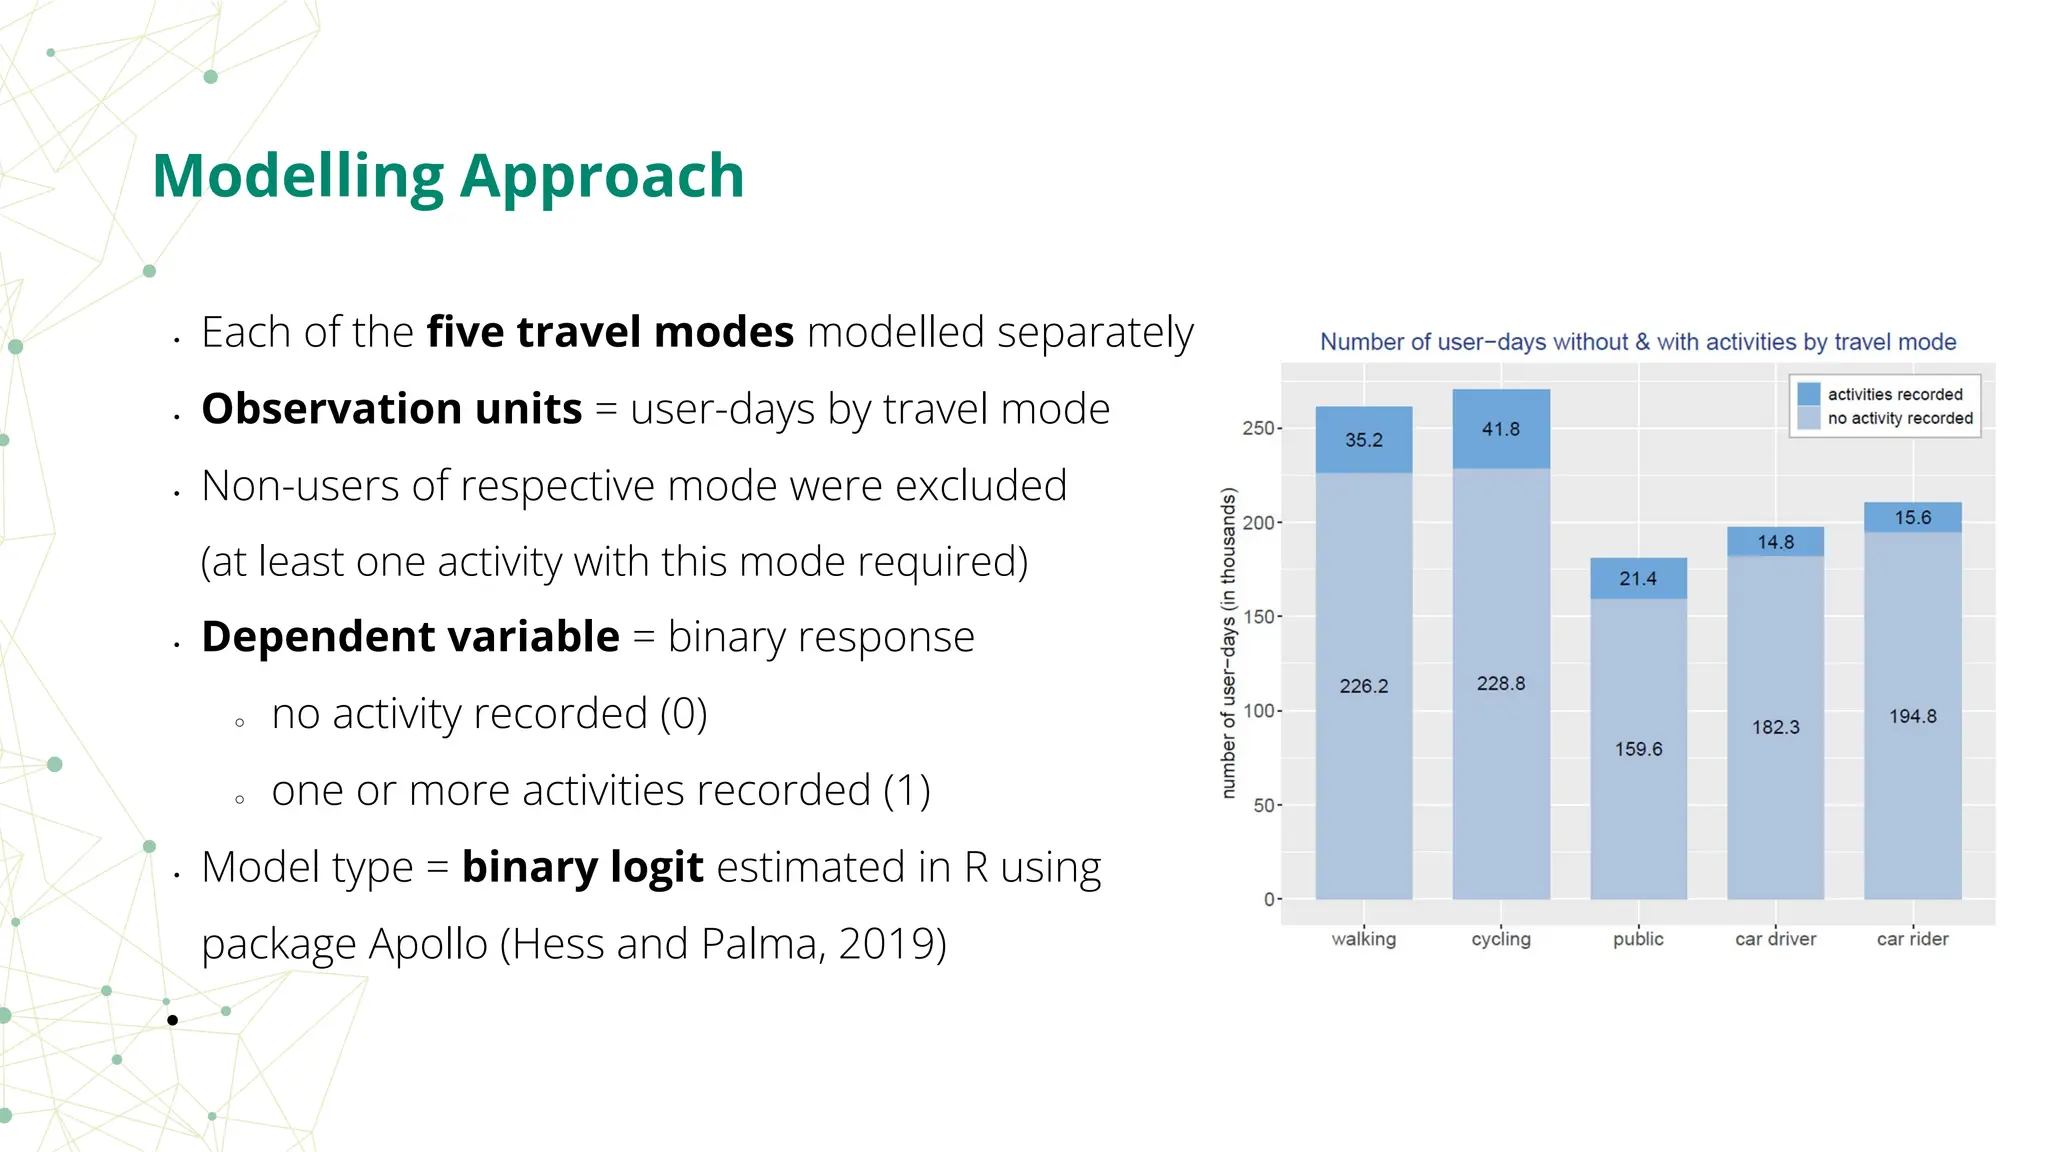
• Each ofthe five travel modes modelled separately
• Observation units = user-days by travel mode
• Non-users of respective mode were excluded
(at least one activity with this mode required)
• Dependent variable = binary response
○ no activity recorded (0)
○ one or more activities recorded (1)
• Model type = binary logit estimated in R using
package Apollo (Hess and Palma, 2019)
•
Modelling Approach
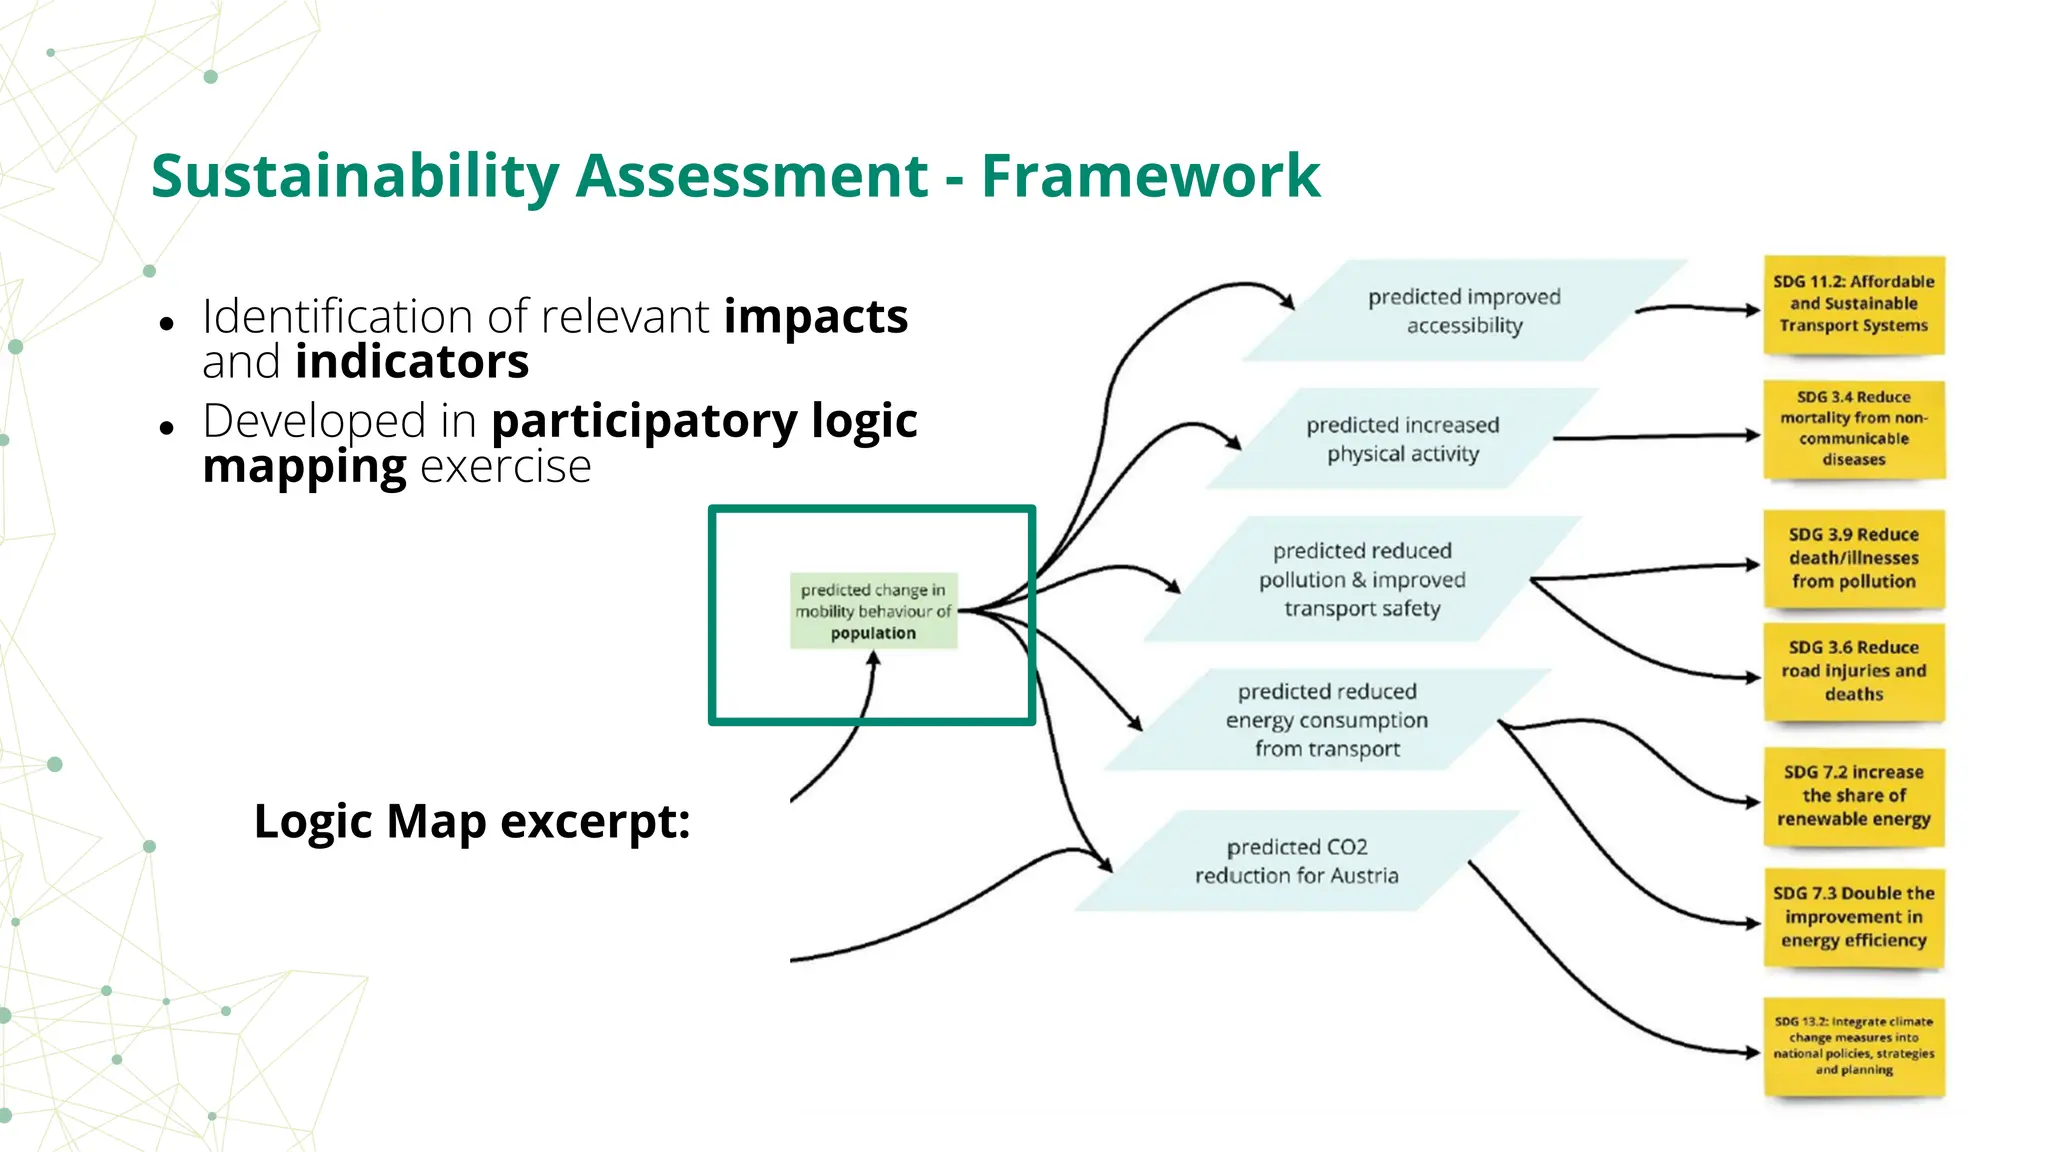
Sustainability Assessment -Framework
● Identification of relevant impacts
and indicators
● Developed in participatory logic
mapping exercise
Logic Map excerpt:
35.
Scaling-up Approach -Prediction of Uptake
1. Prediction of average daily km recorded
by mode for each participant for each
district in Austria
○ Same incentive regime as AI-CENTIVE pilots assumed
Scenario Number of persons participating
companies communities
S1 54 718 27 623
S2 136 795 95 122
S3 547 182 239 039
Average daily distance [km] recorded by participants
walking cycling public transport ridesharing passenger
company member 0,22 0,78 0,67 1,45
community member 0,34 0,54 0,27 0,75
2. Prediction of participants
○ Companies with CSRD reporting requirements main
targets (> 250 staff) for rollout
○ 3 rollout scenarios: 10%, 25%, 100% participate
○ 30% of employees of those participate
○ residents in municipalities proportionally
36.
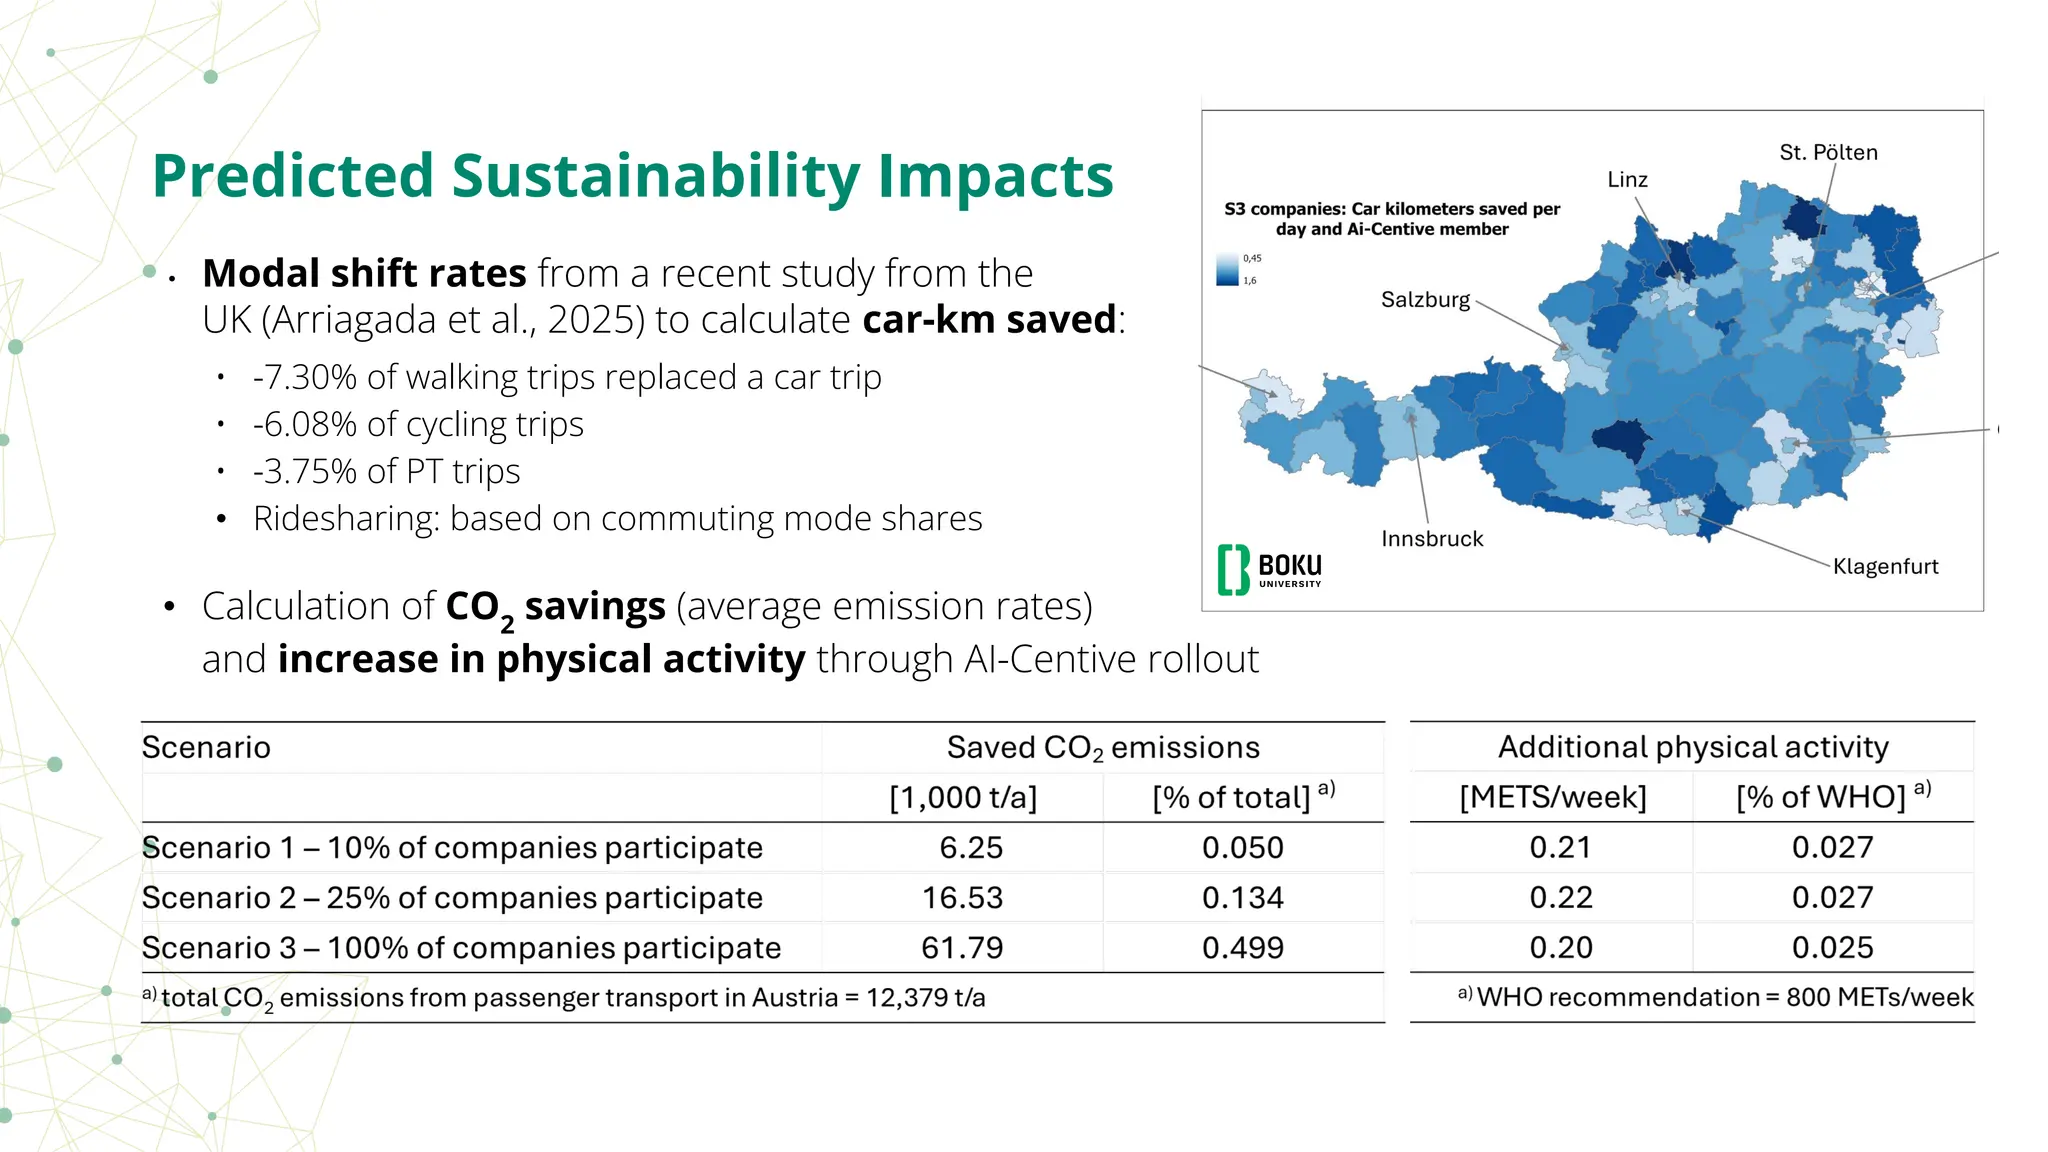
• Modal shiftrates from a recent study from the
UK (Arriagada et al., 2025) to calculate car-km saved:
• -7.30% of walking trips replaced a car trip
• -6.08% of cycling trips
• -3.75% of PT trips
• Ridesharing: based on commuting mode shares
Predicted Sustainability Impacts
• Calculation of CO2
savings (average emission rates)
and increase in physical activity through AI-Centive rollout
37.
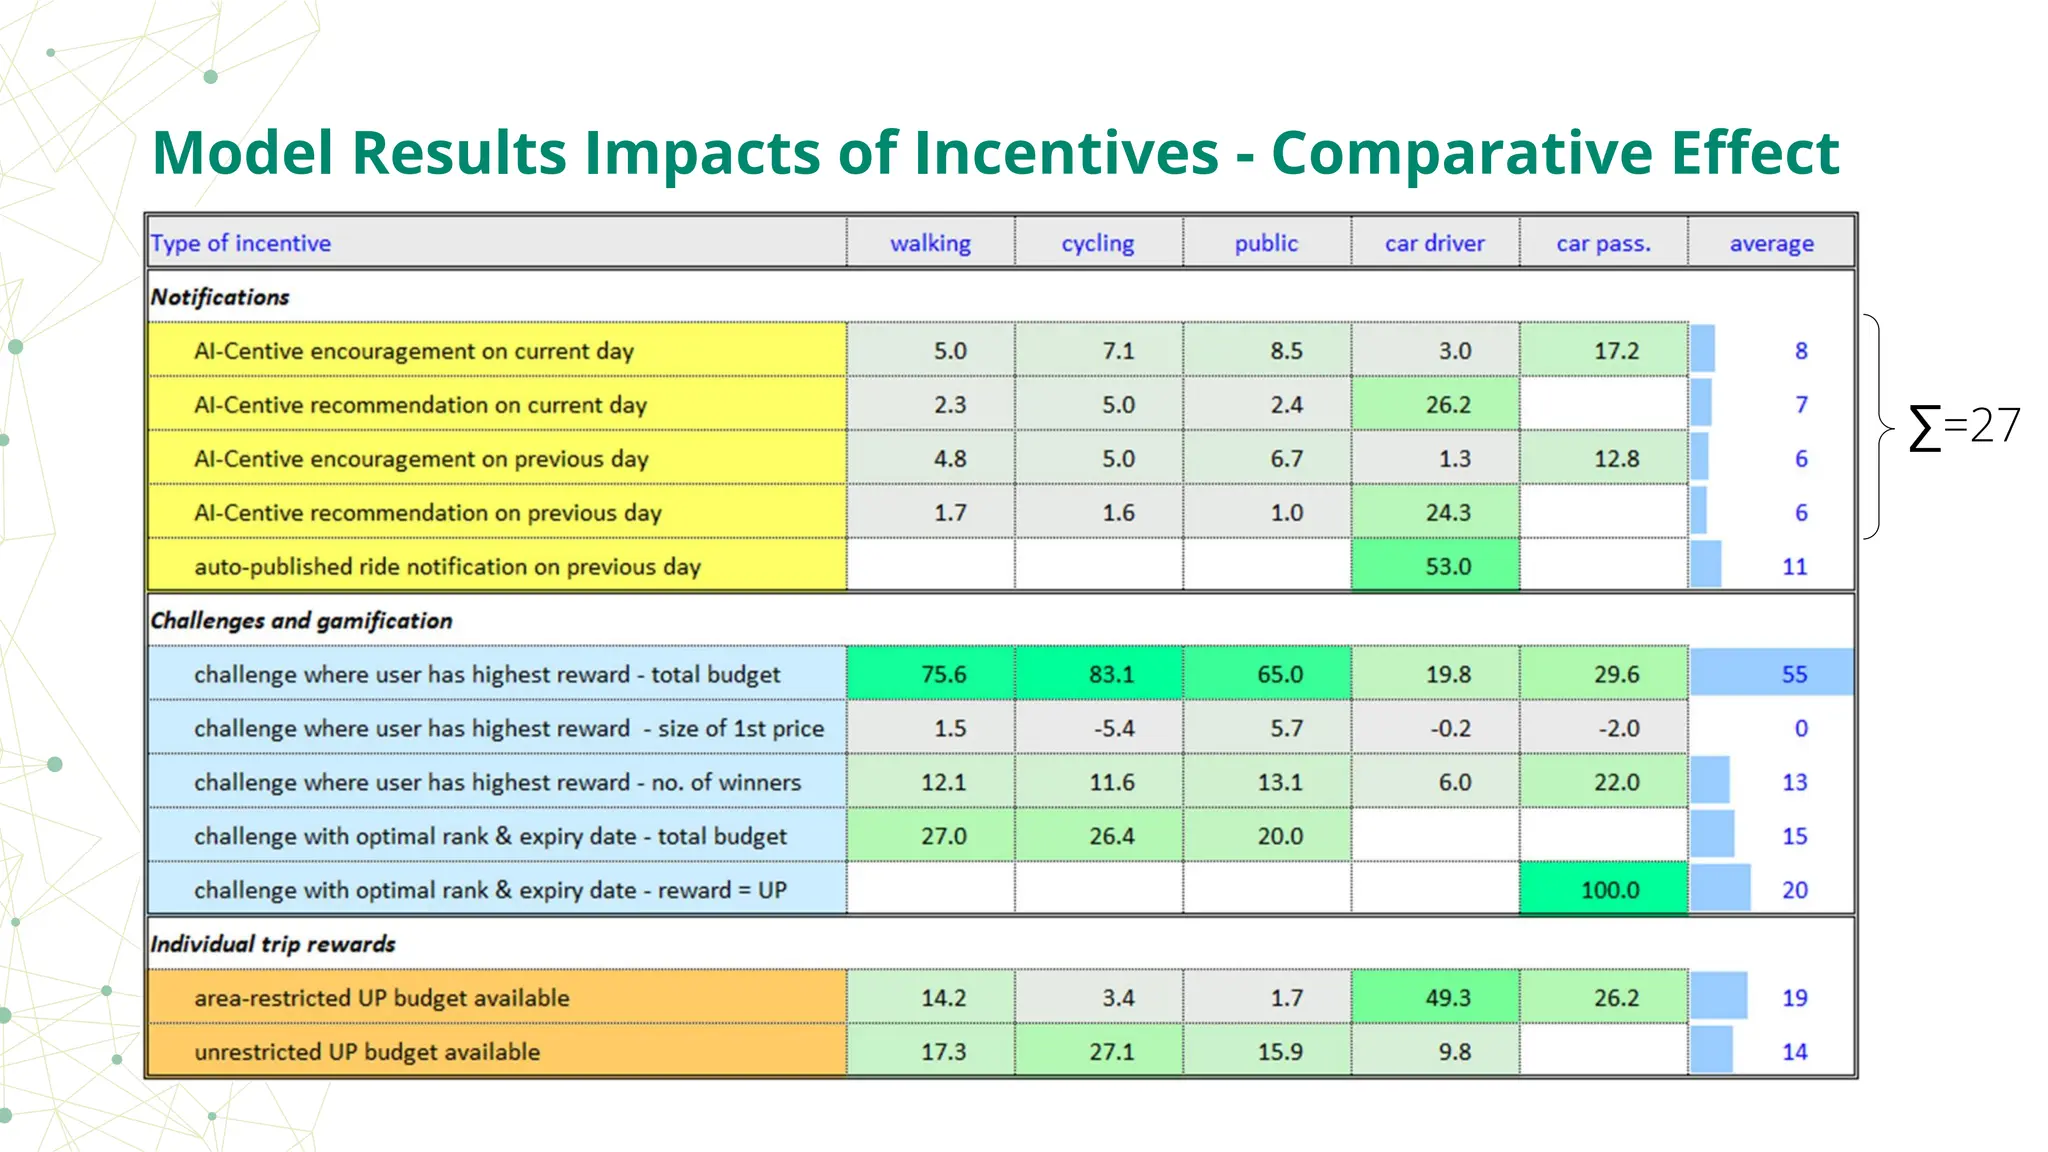
• Carefully craftedincenctives can support the use of sustainable modes
• Well-designed challenges with high chance for any reward are particularly effective
• "Umweltverbund" respond more to gamification elements, ride-sharing more to
economic benefits
• AI can particularly support the delivery of targeted and timely reminders that keep
users engaged
• Long-term user engagement is essential for sustaining the app business
• Continuous user engagement is a requisite for establishing and maintaining habits
of sustainable mode choice
• Sustainability impact of "soft" measures such as incentives are known to be limited
on their own but important to accompany "hard" measures (e.g. better infrastructure,
parking restrictions ...)
Conclusions


![Scaling-up Approach - Prediction of Uptake
1. Prediction of average daily km recorded
by mode for each participant for each
district in Austria
○ Same incentive regime as AI-CENTIVE pilots assumed
Scenario Number of persons participating
companies communities
S1 54 718 27 623
S2 136 795 95 122
S3 547 182 239 039
Average daily distance [km] recorded by participants
walking cycling public transport ridesharing passenger
company member 0,22 0,78 0,67 1,45
community member 0,34 0,54 0,27 0,75
2. Prediction of participants
○ Companies with CSRD reporting requirements main
targets (> 250 staff) for rollout
○ 3 rollout scenarios: 10%, 25%, 100% participate
○ 30% of employees of those participate
○ residents in municipalities proportionally](https://image.slidesharecdn.com/master-ppai-centivefinalstakeholdermeeting20251119-251125083945-7a335208/75/AI-CENTIVE-Final-Results-Final-Stakeholder-Meeting-35-2048.jpg)