Download to read offline
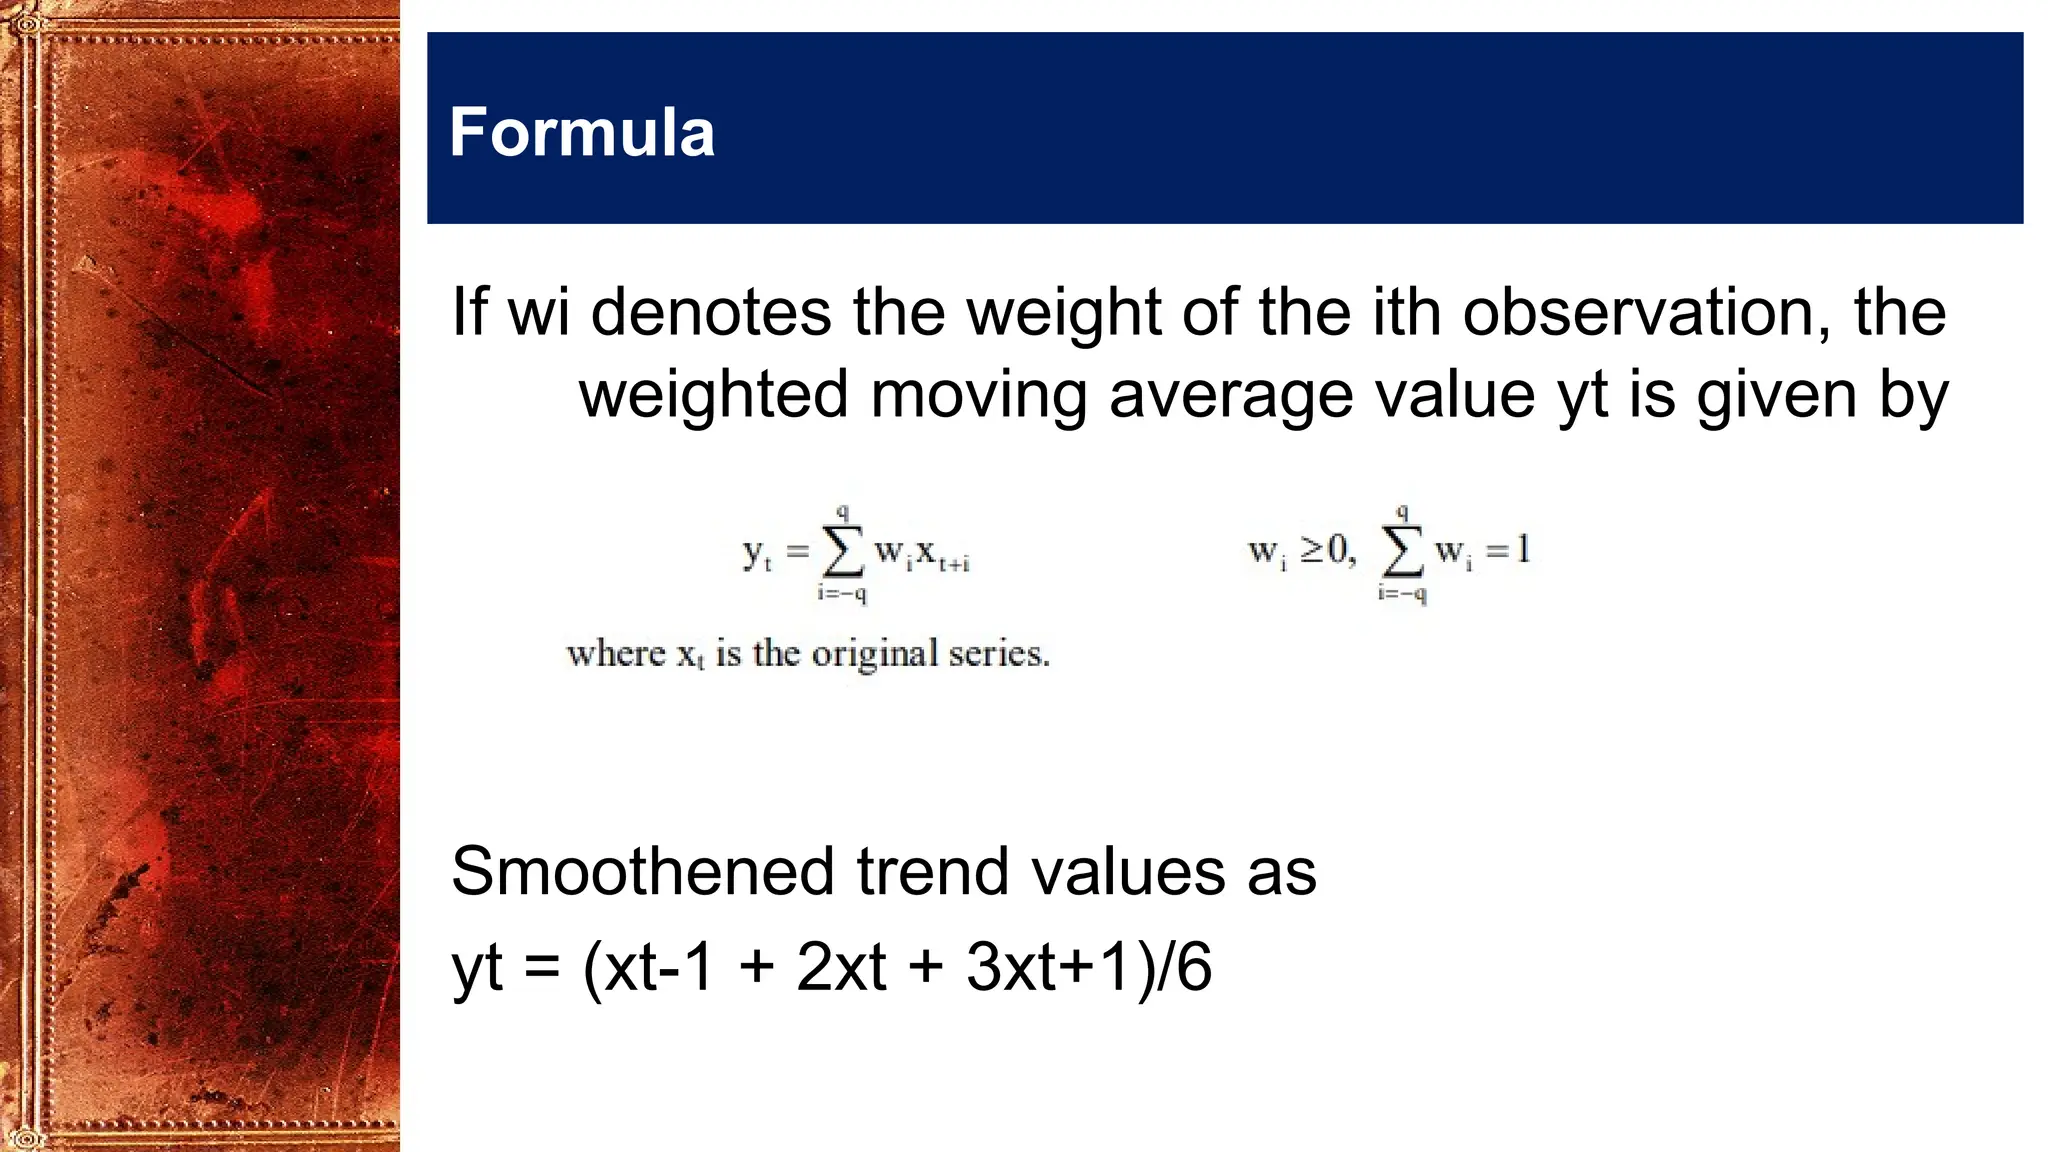
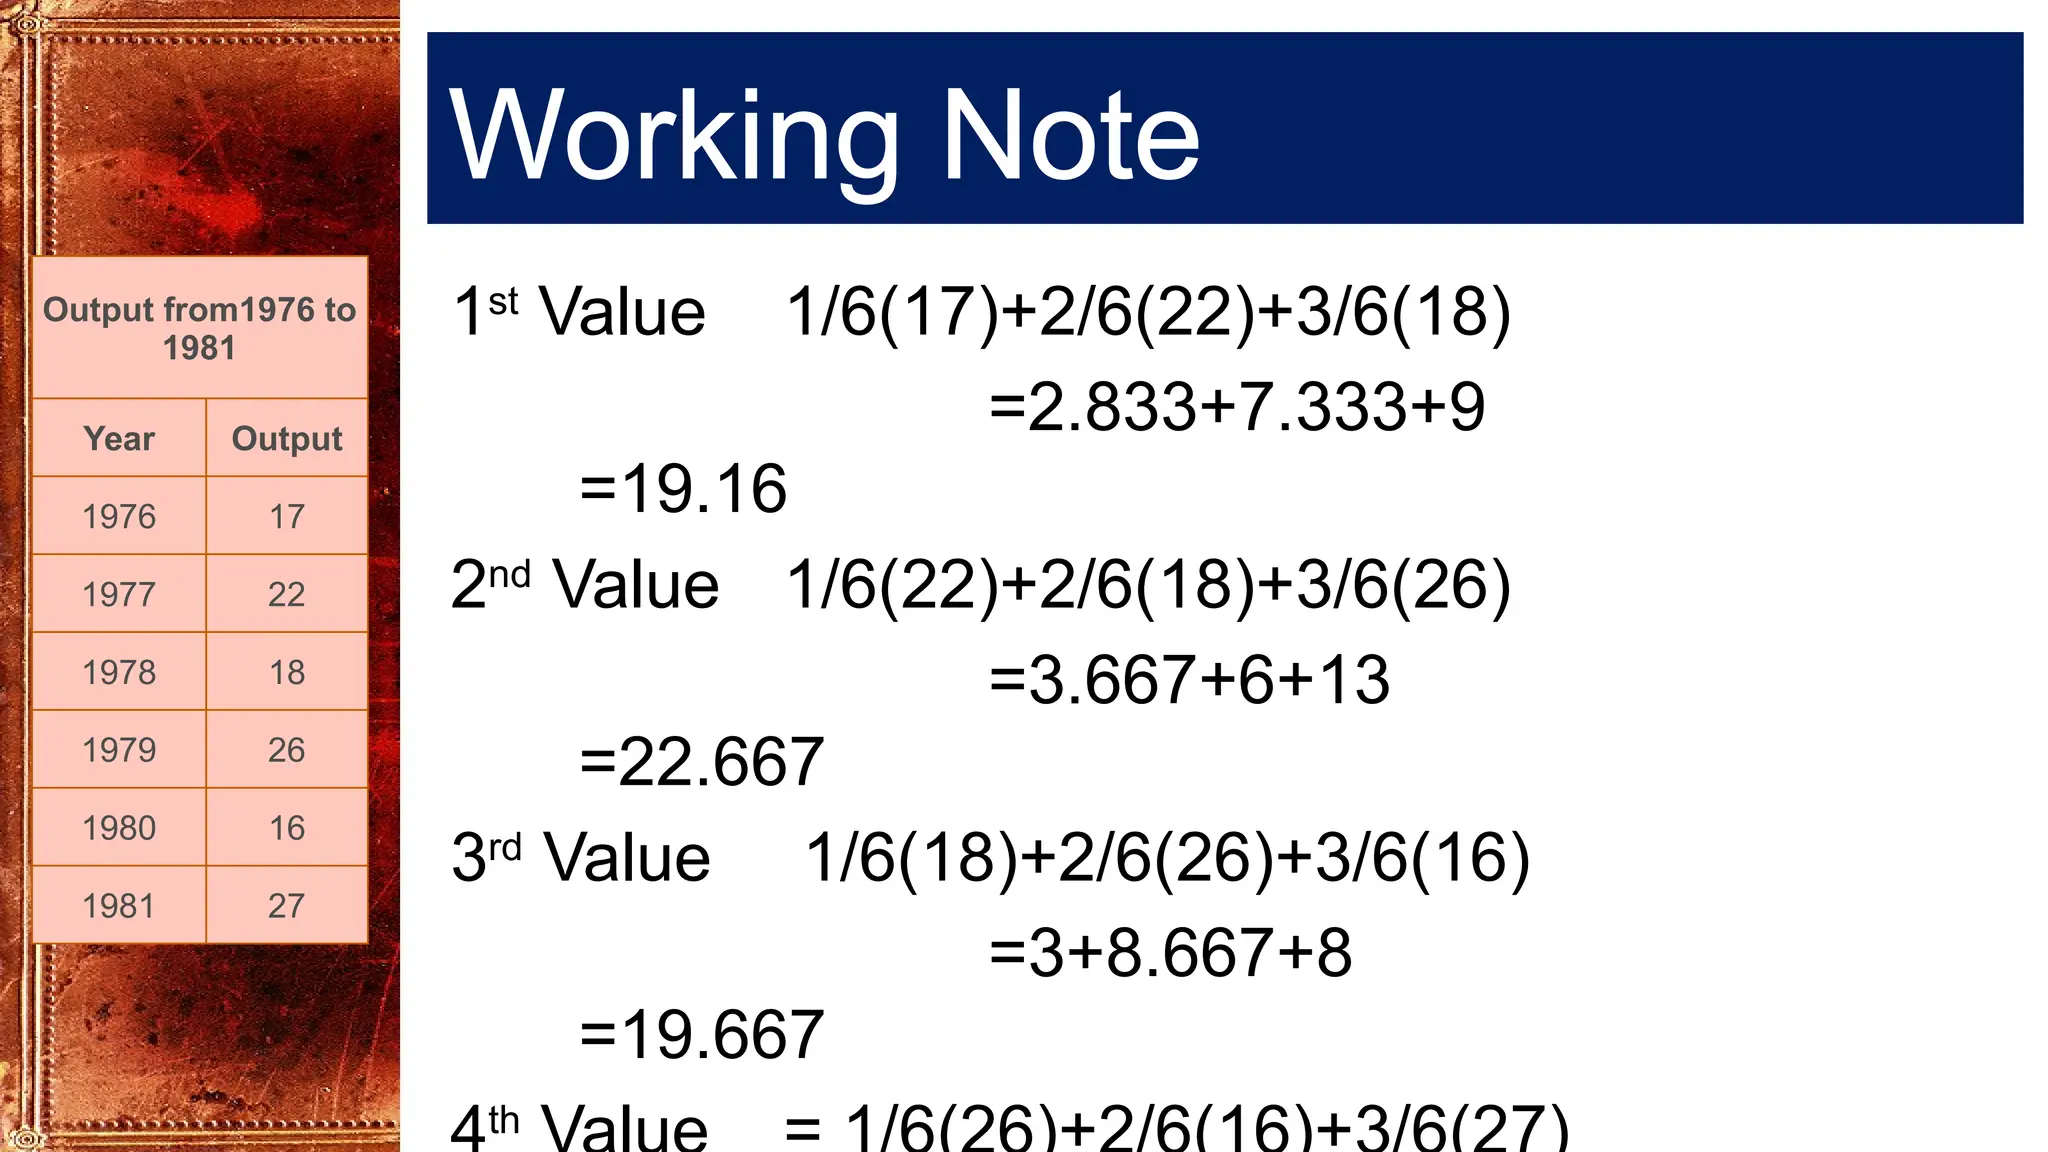
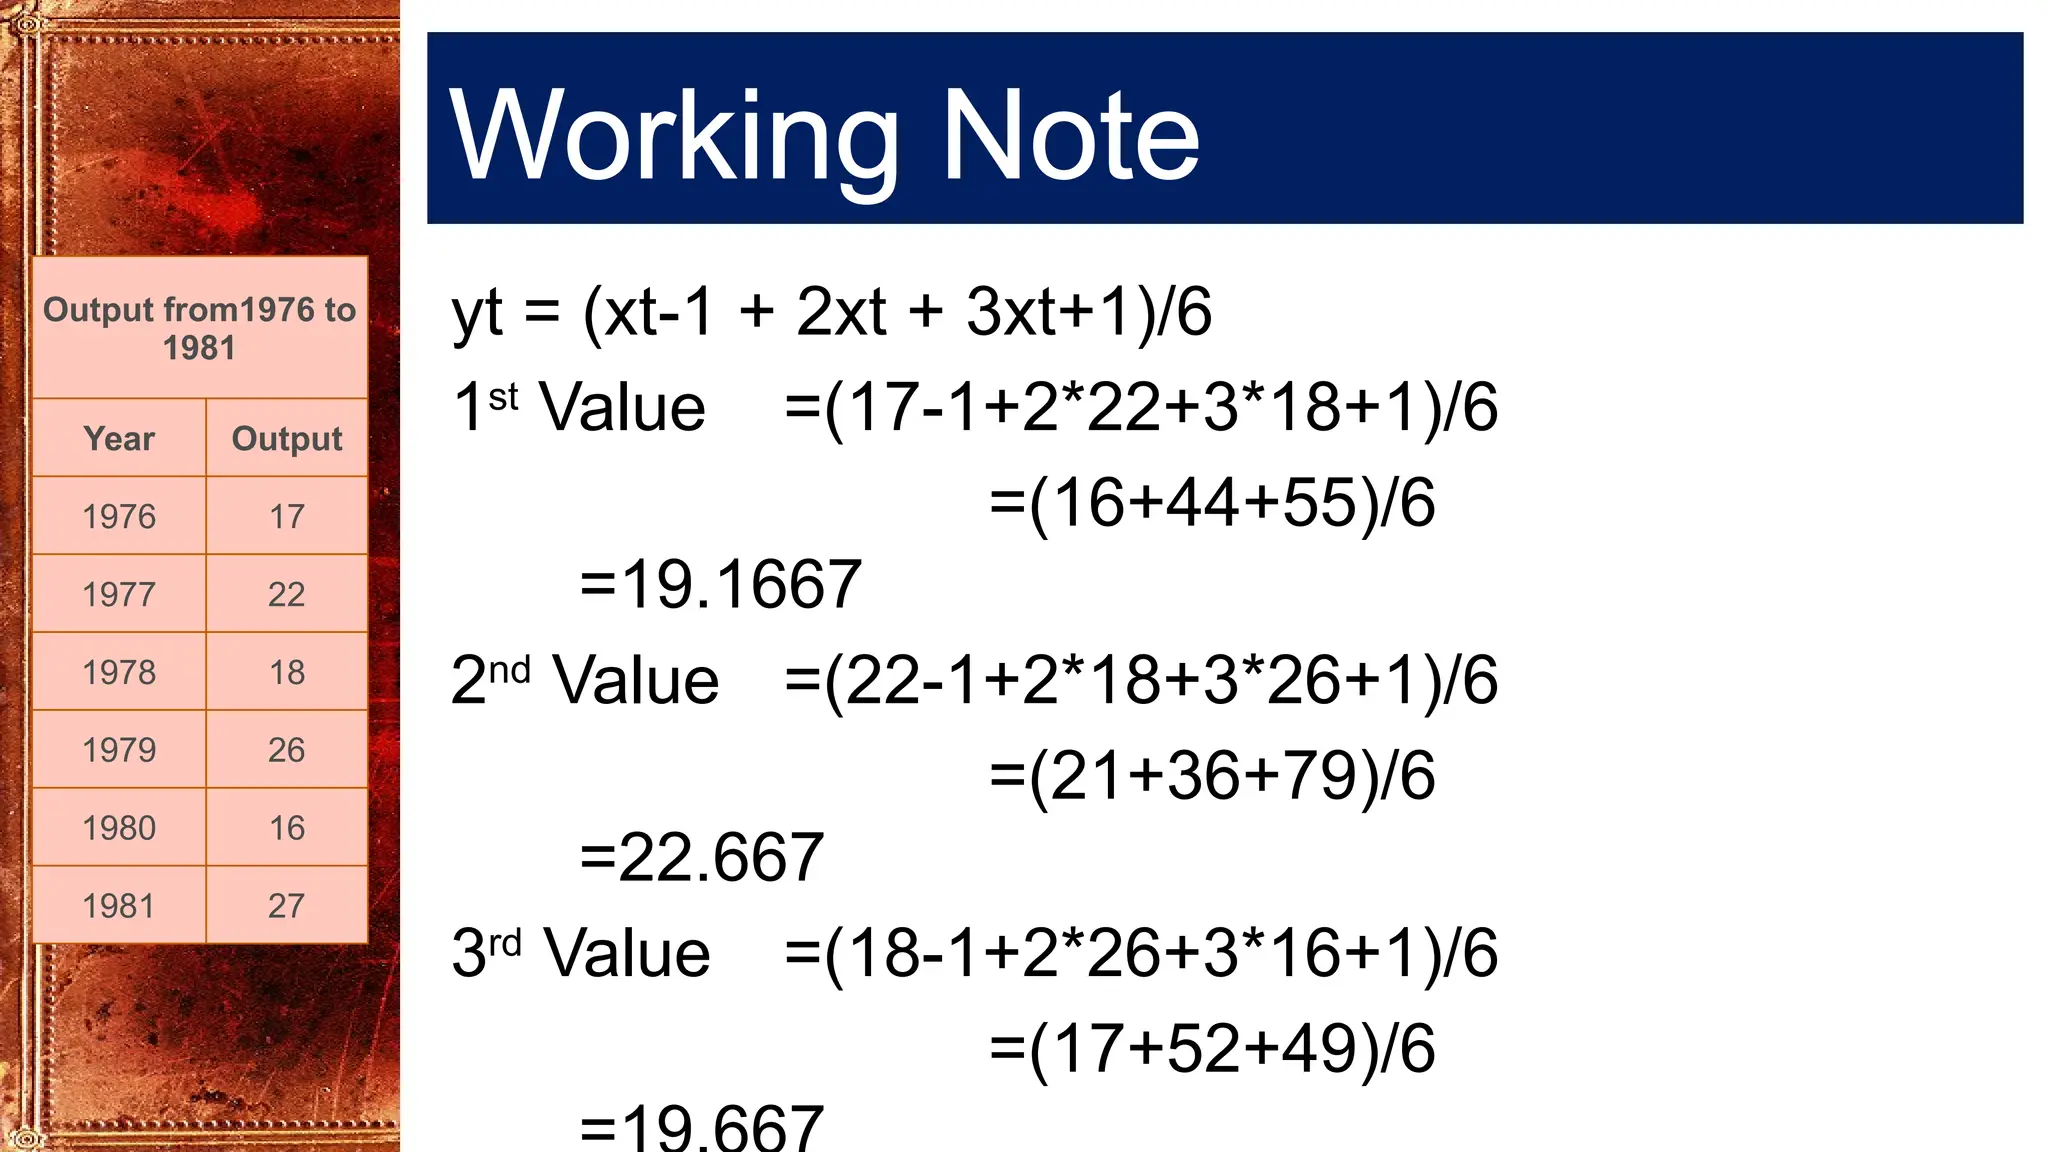
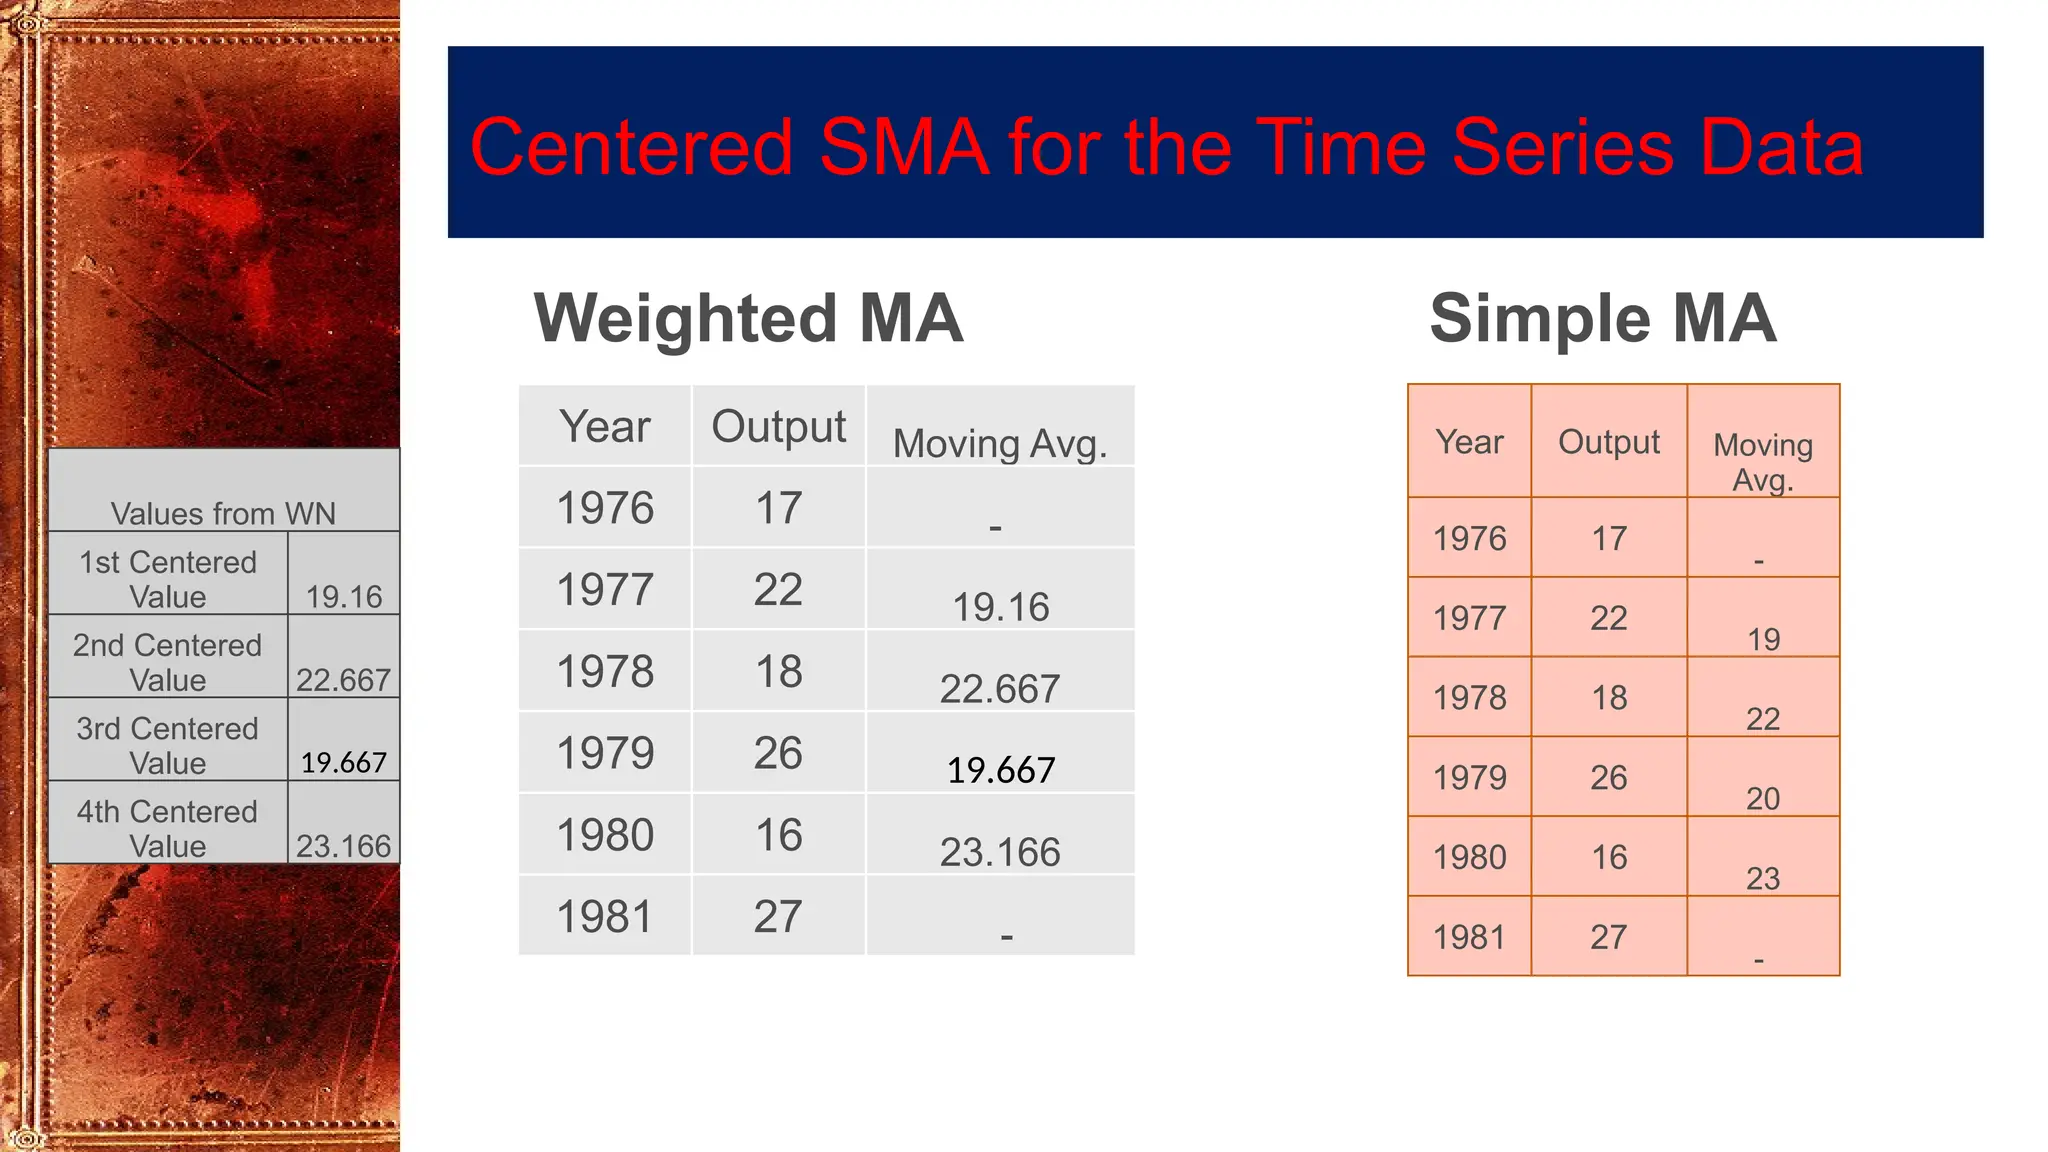
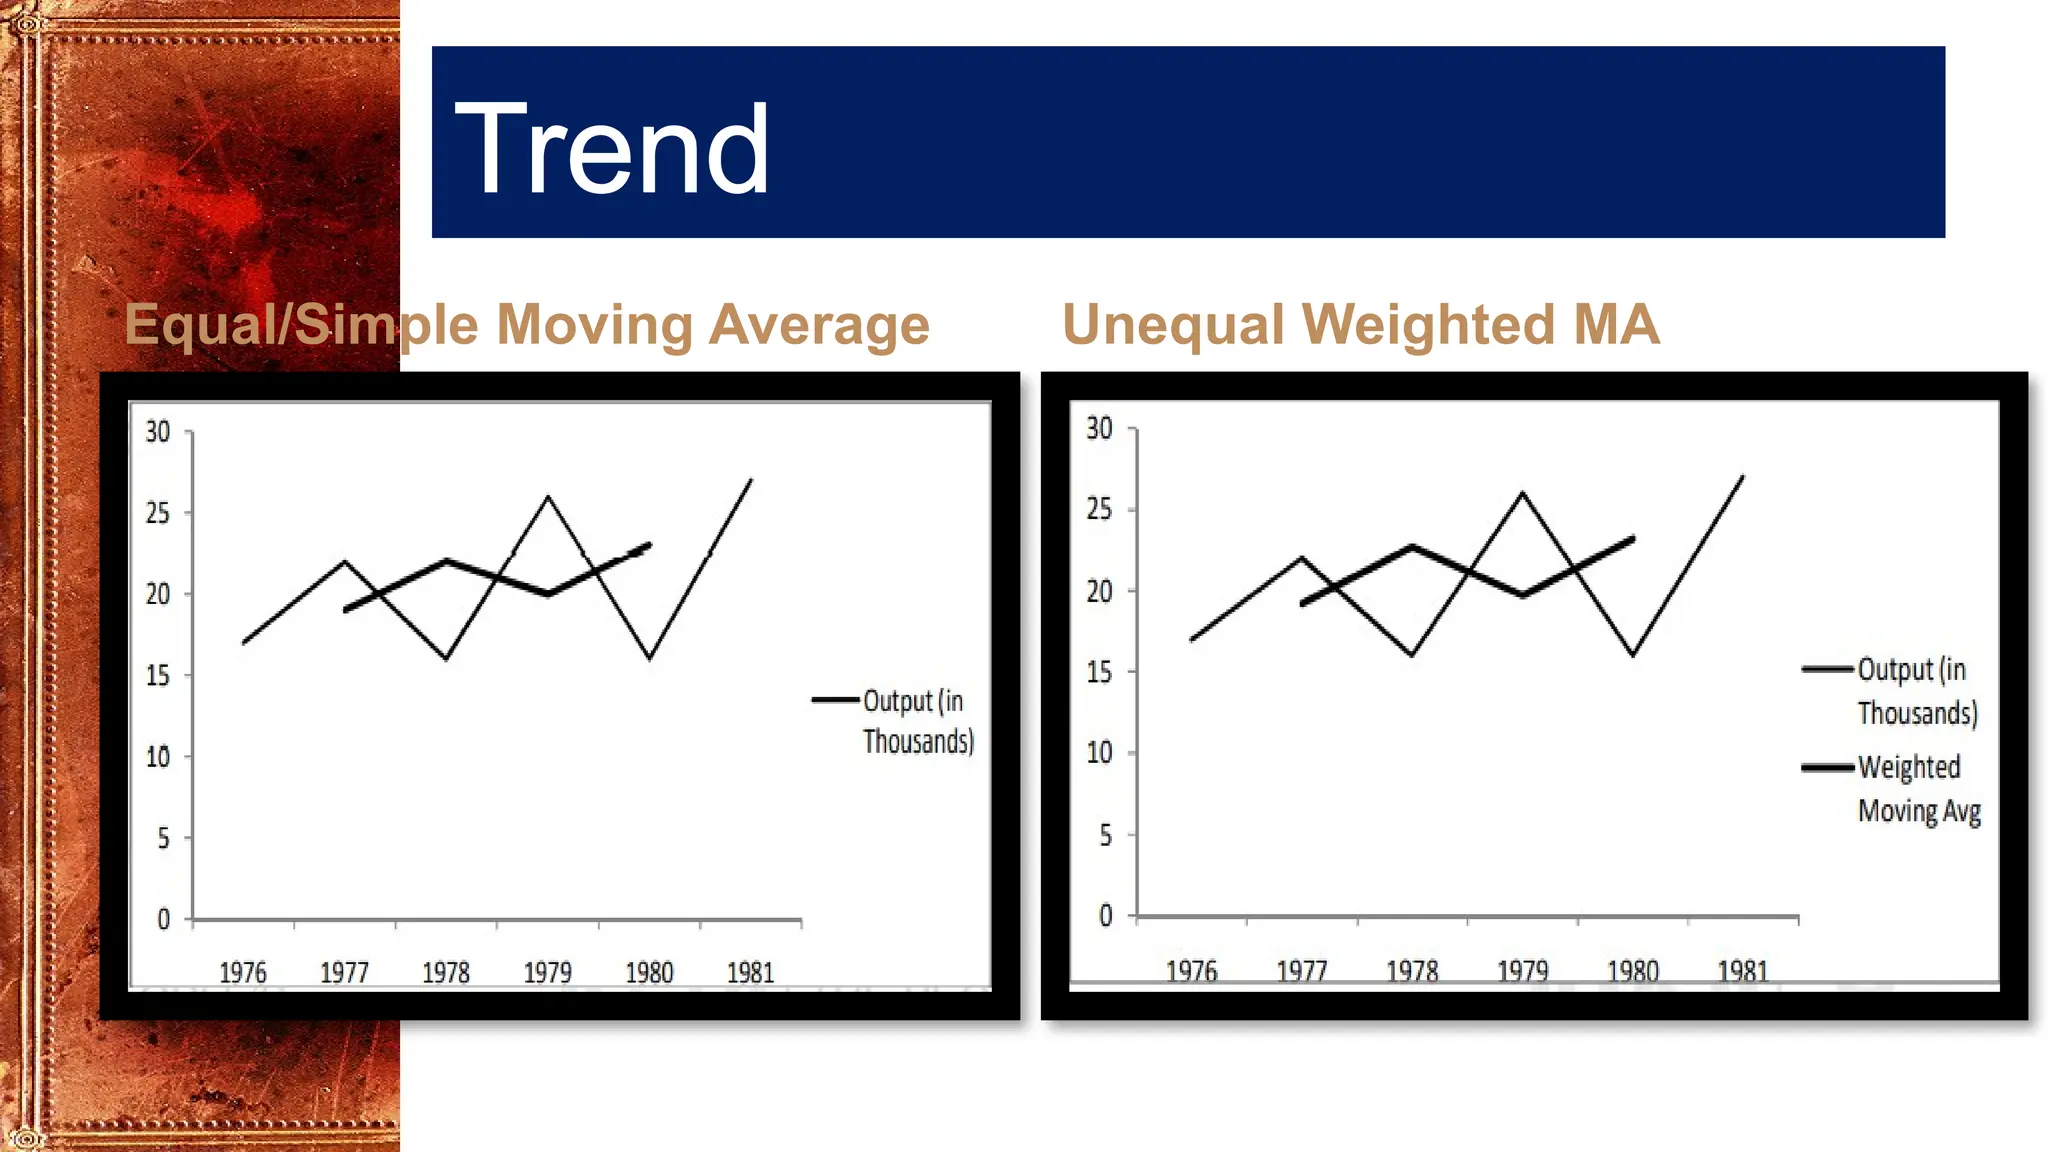
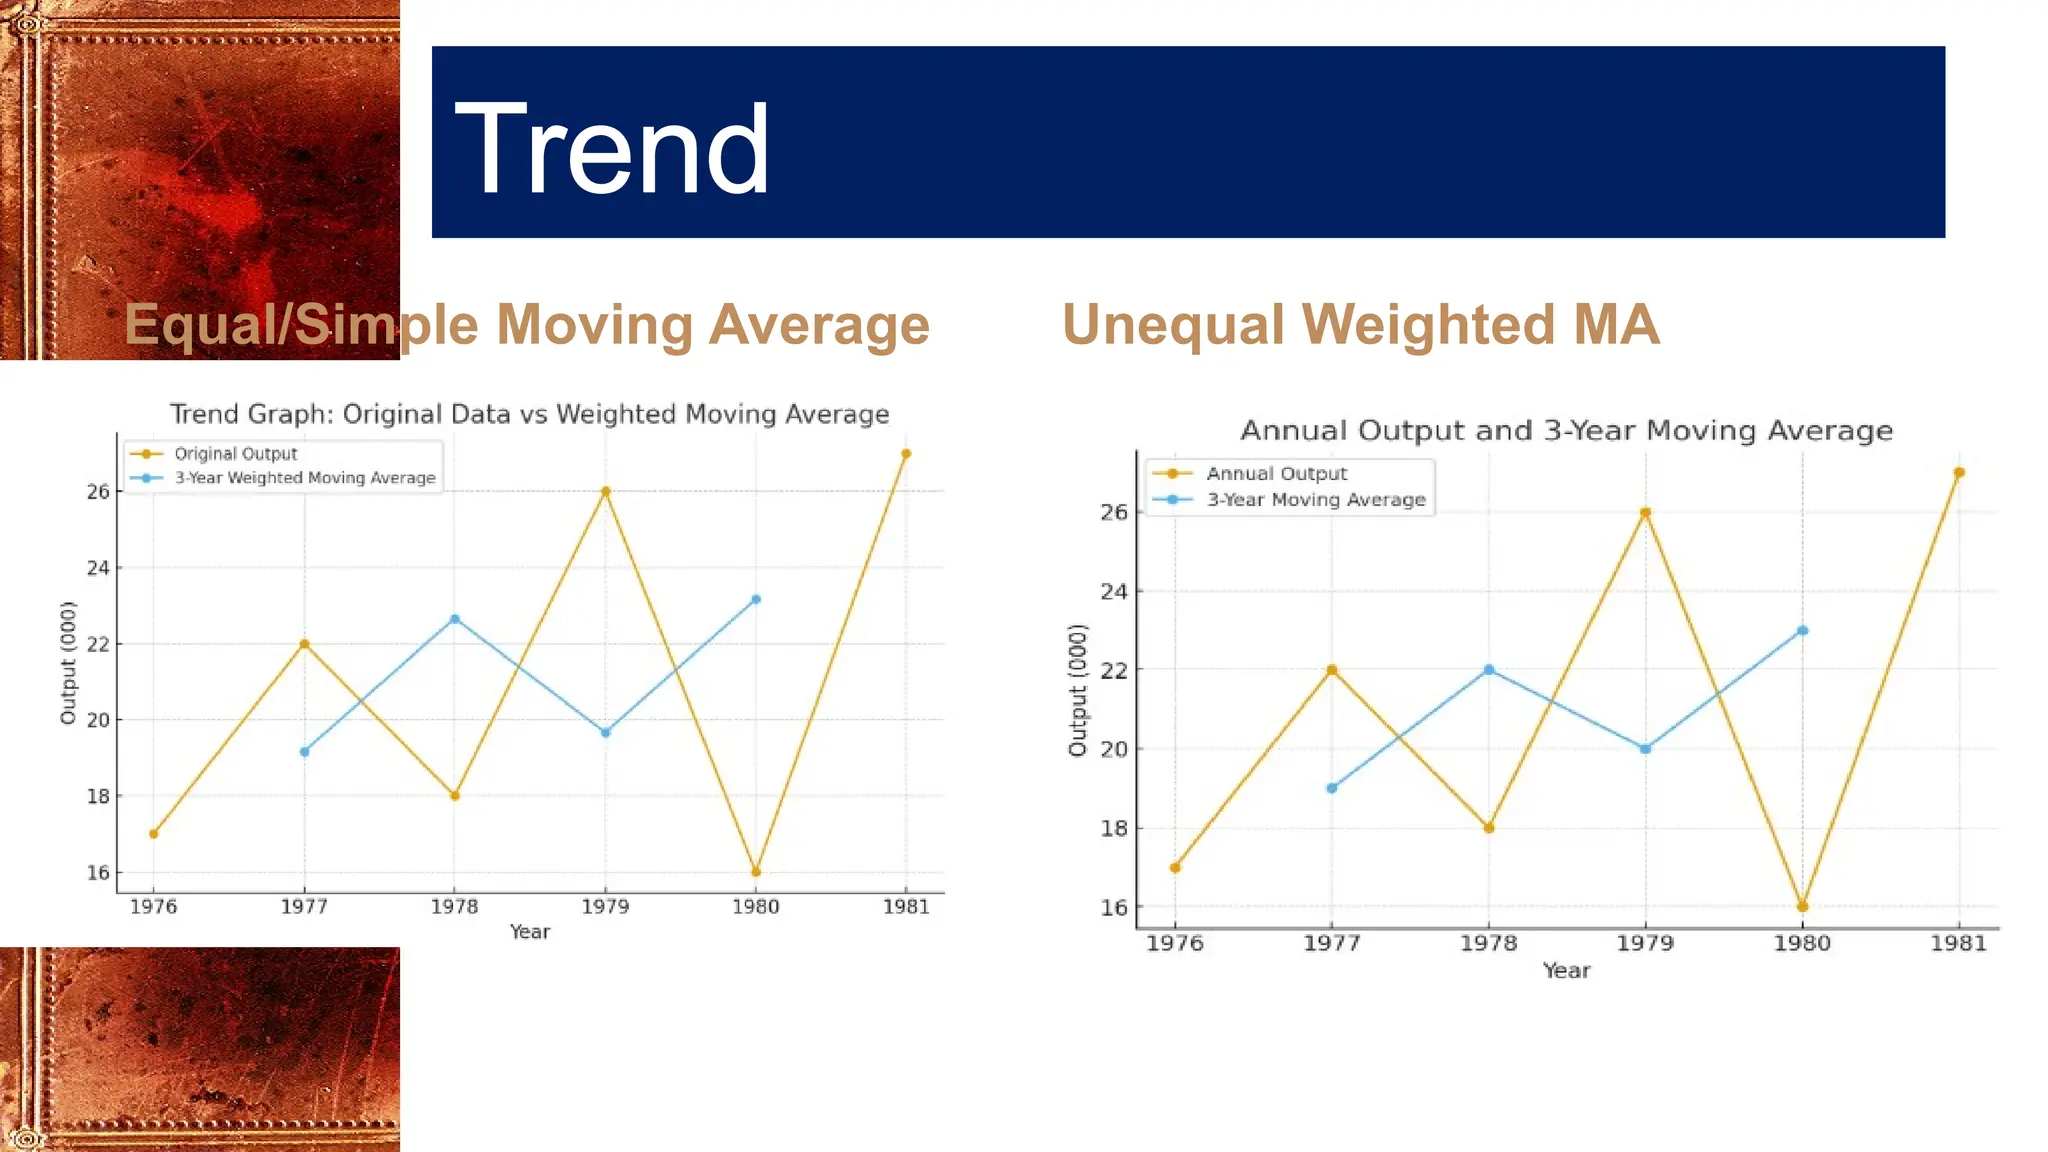

The simple moving average method is not generally recommended for measuring trend although it can be useful for removing seasonal variation. It may also not lie close to the latest values. Therefore, the weighted (unequal) moving averages method is used. In this method, instead of giving equal weights to all values, unequal weights are given in such a way that all the weights are positive and their sum is equal to 1.


![time series.ppt [Autosaved].pdf](https://cdn.slidesharecdn.com/ss_thumbnails/timeseries-231013231623-6993e801-thumbnail.jpg?width=640&height=640&fit=bounds)