Download to read offline
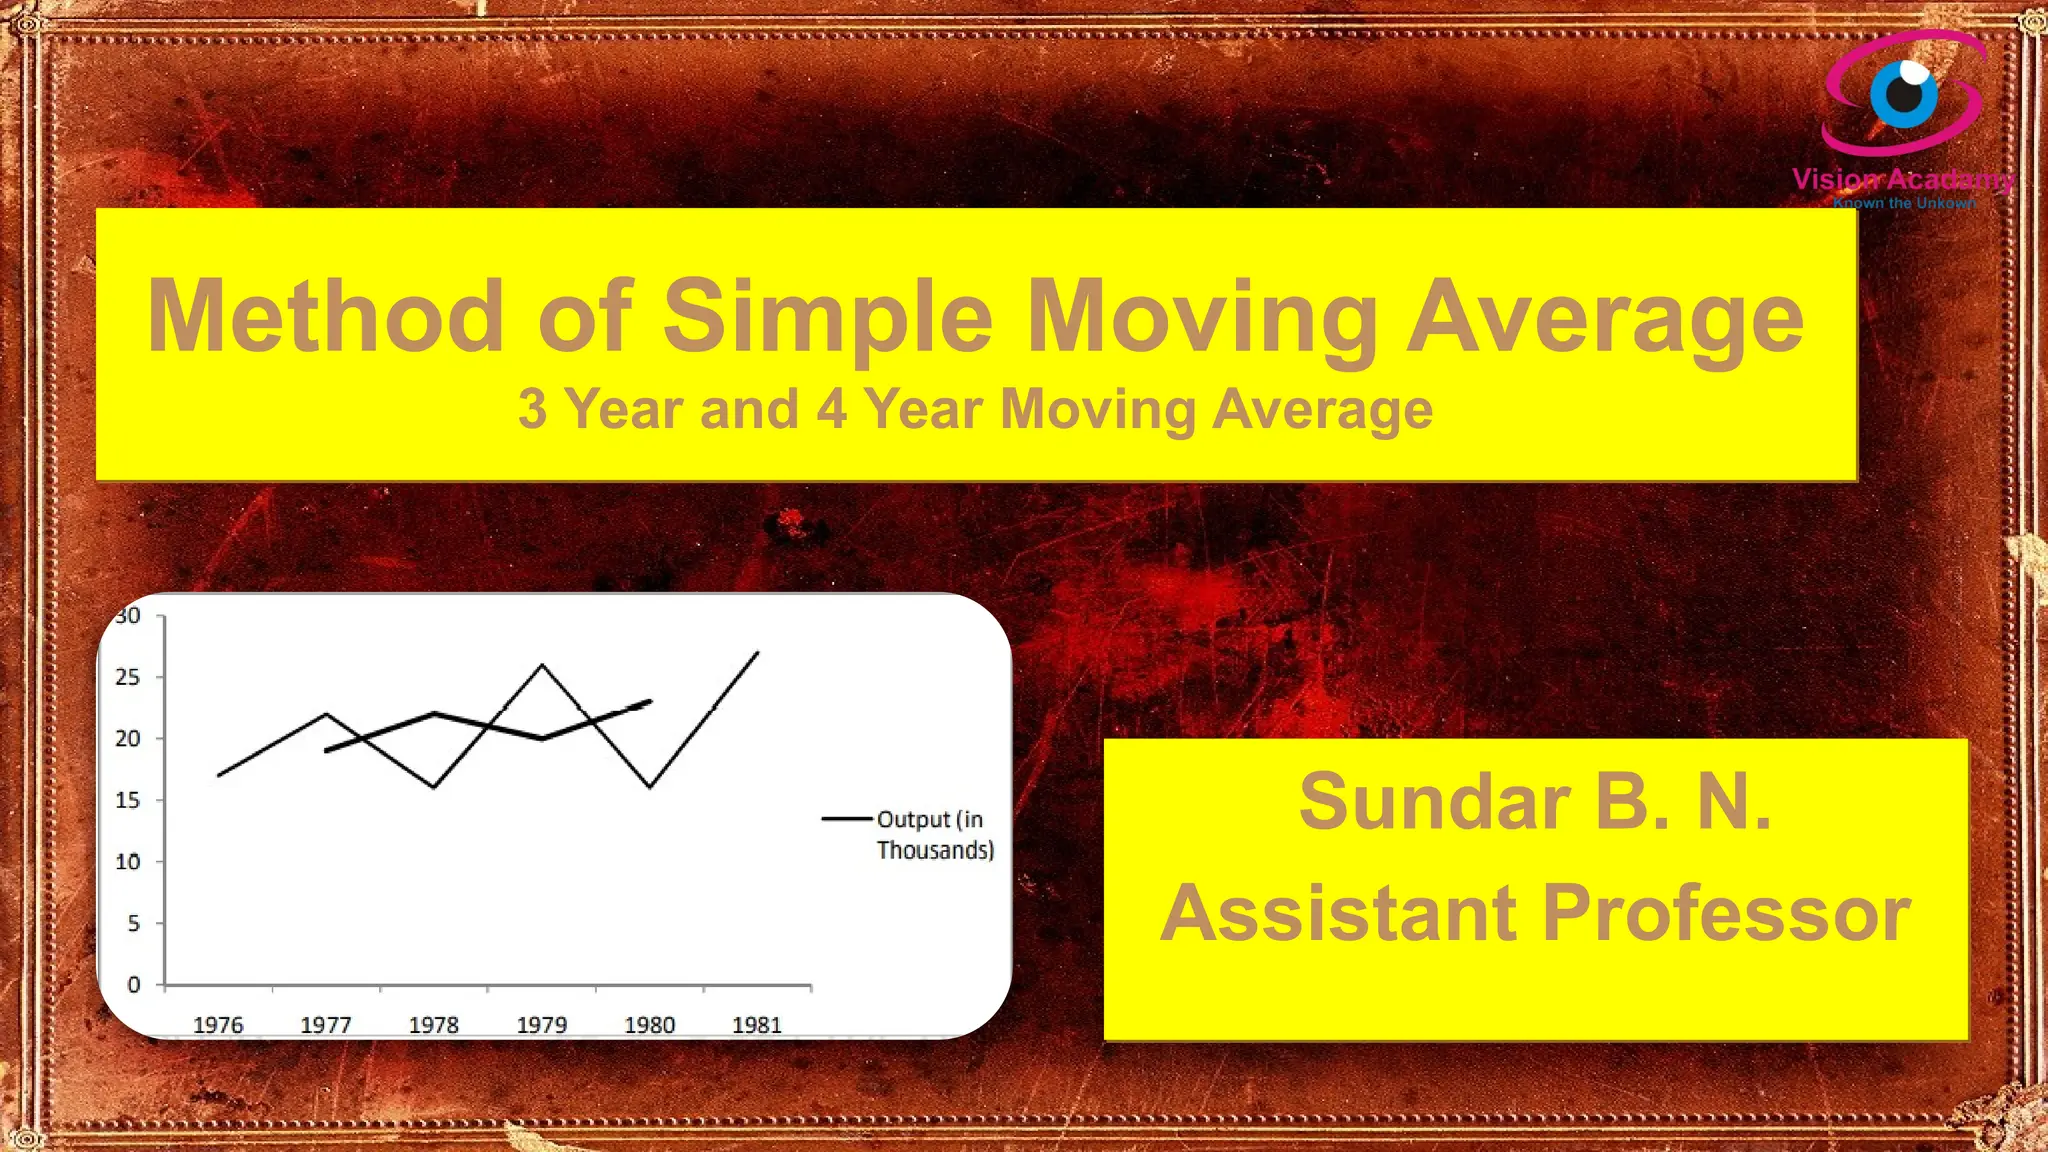
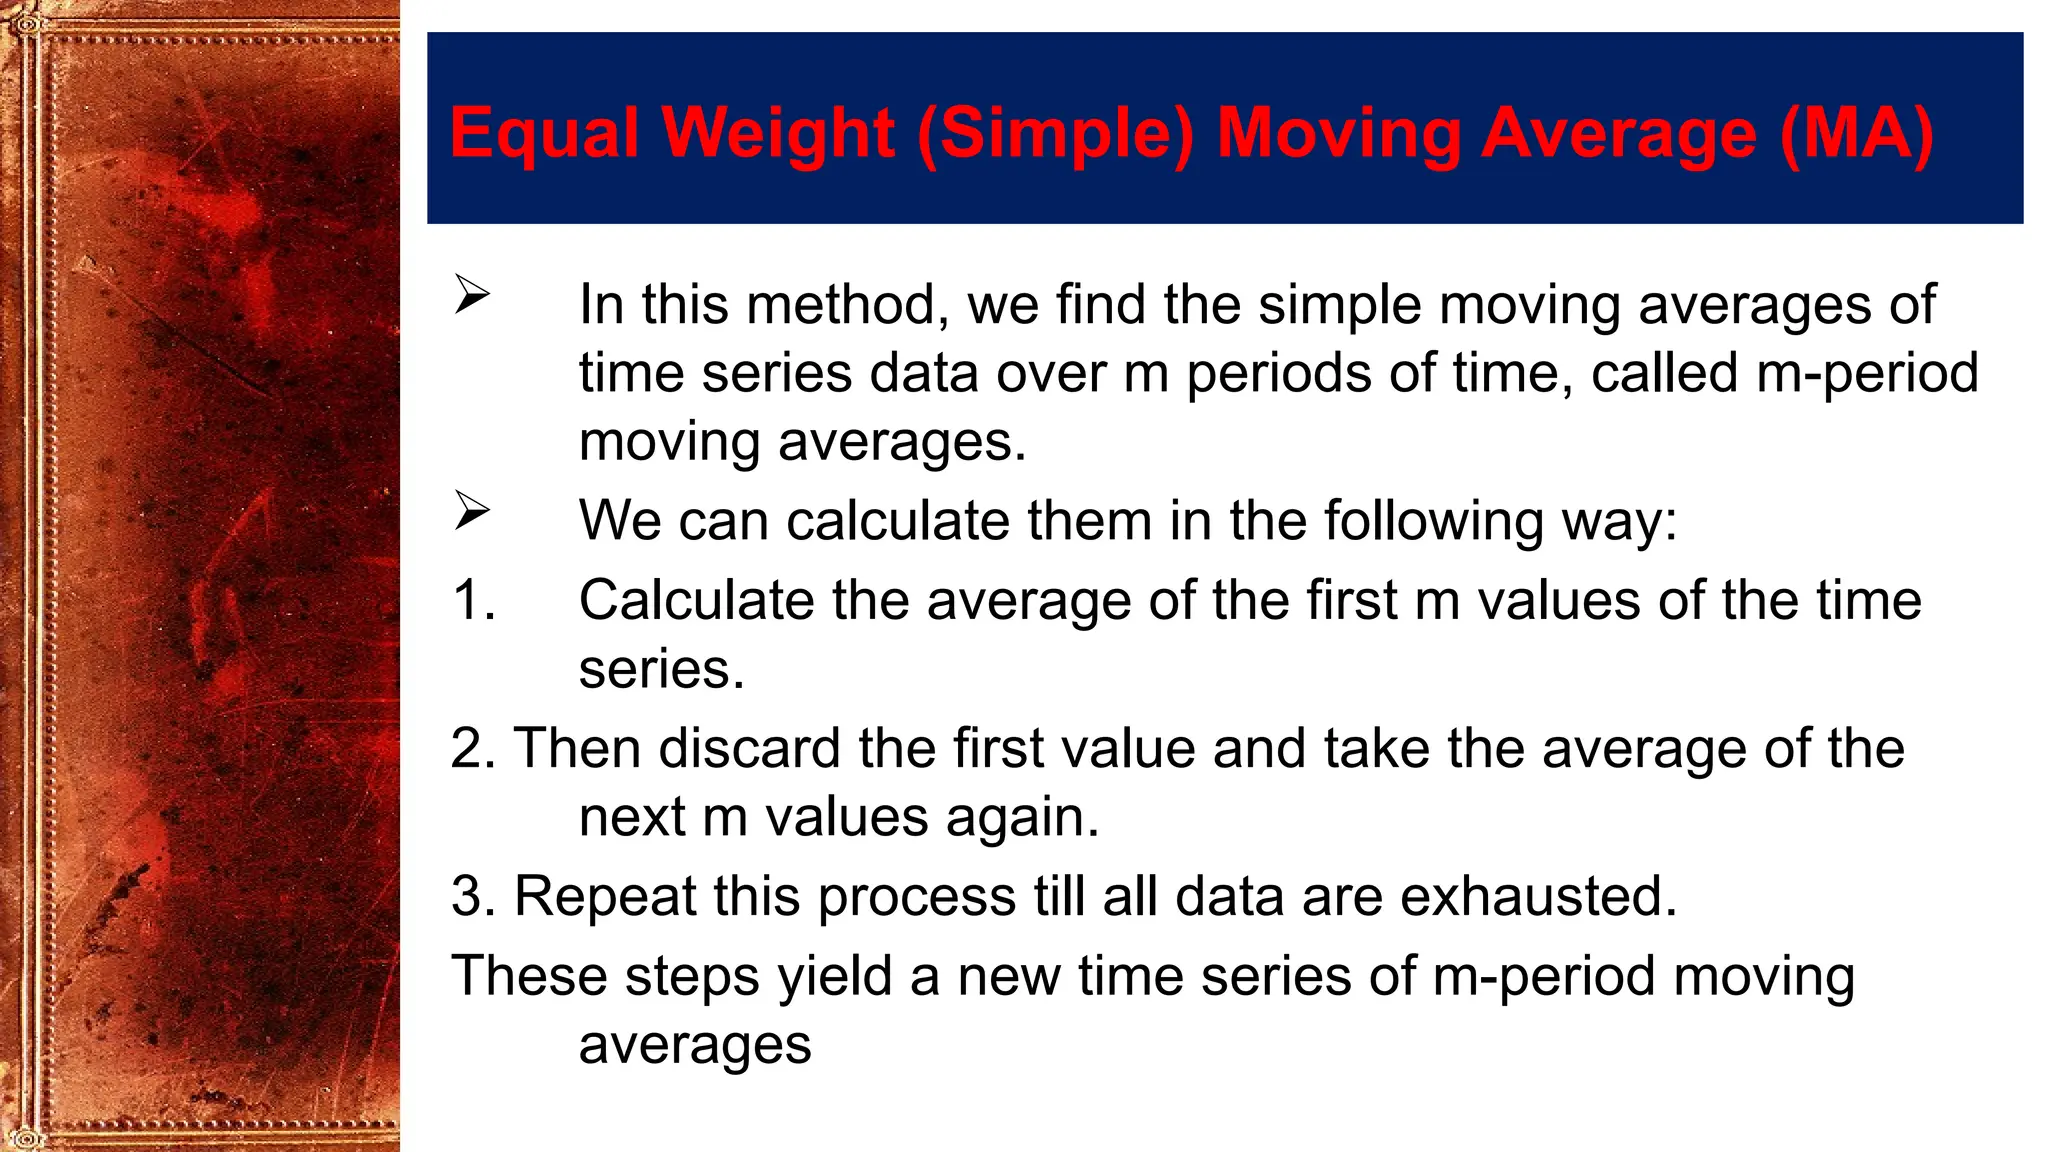
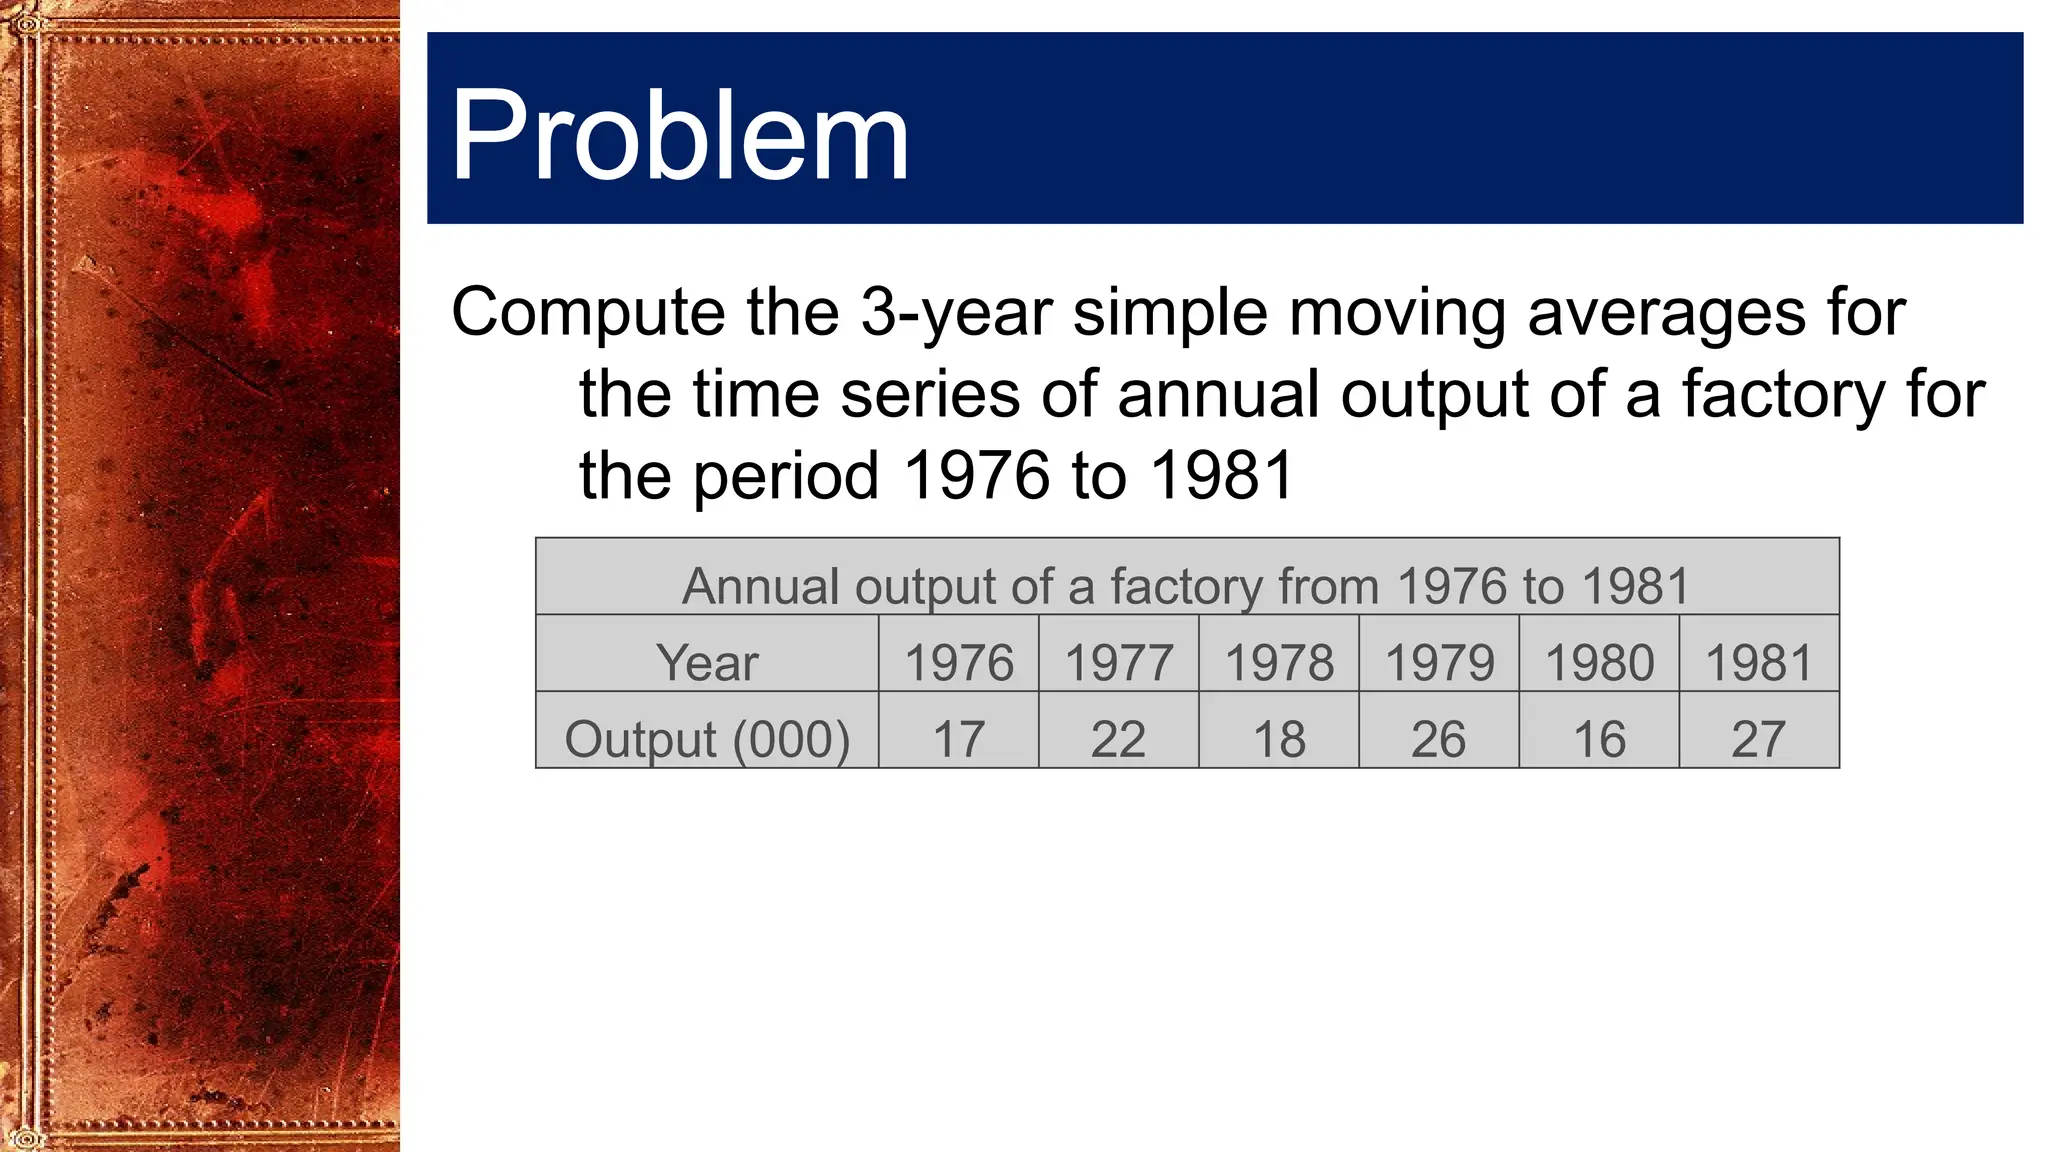
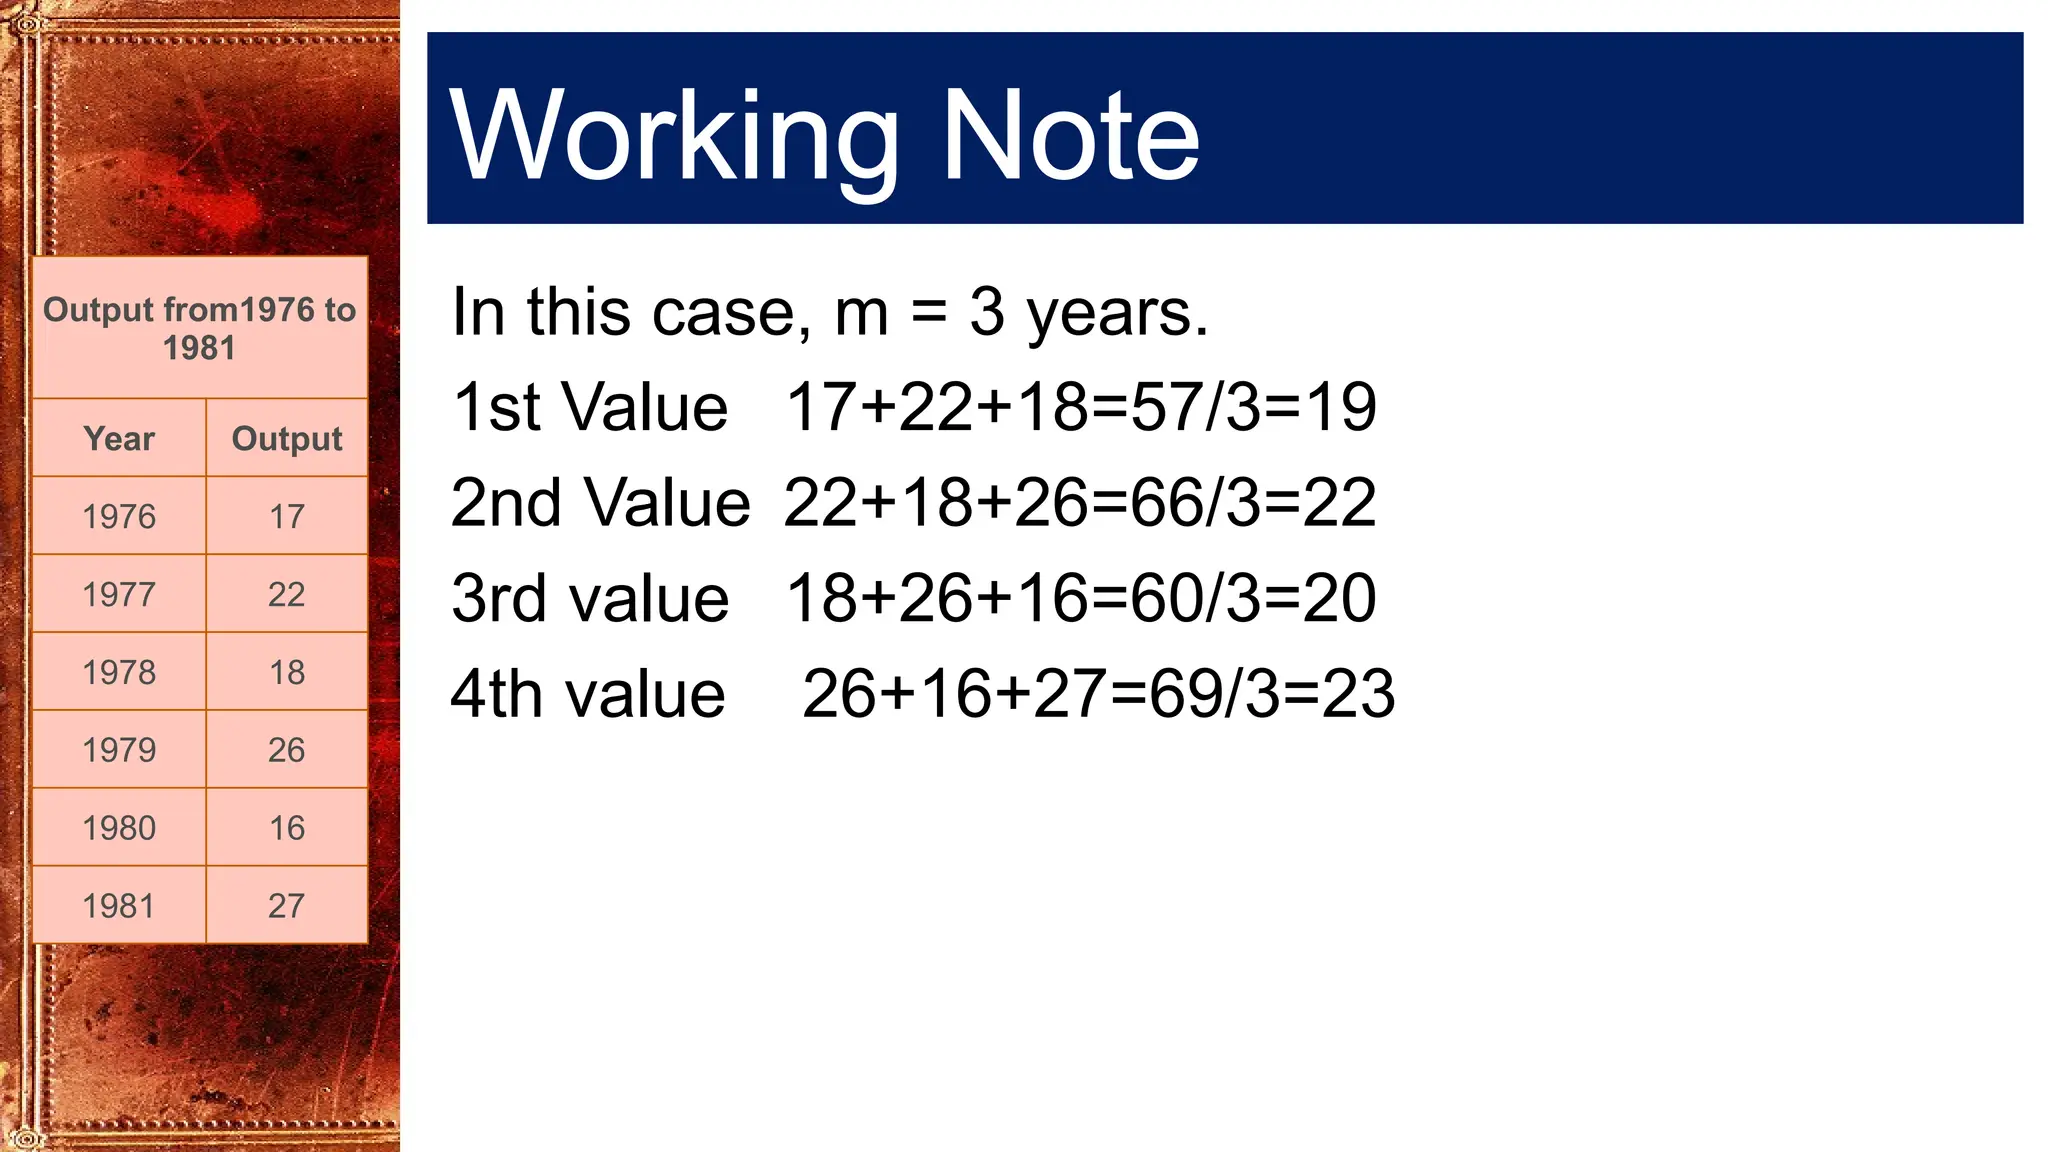
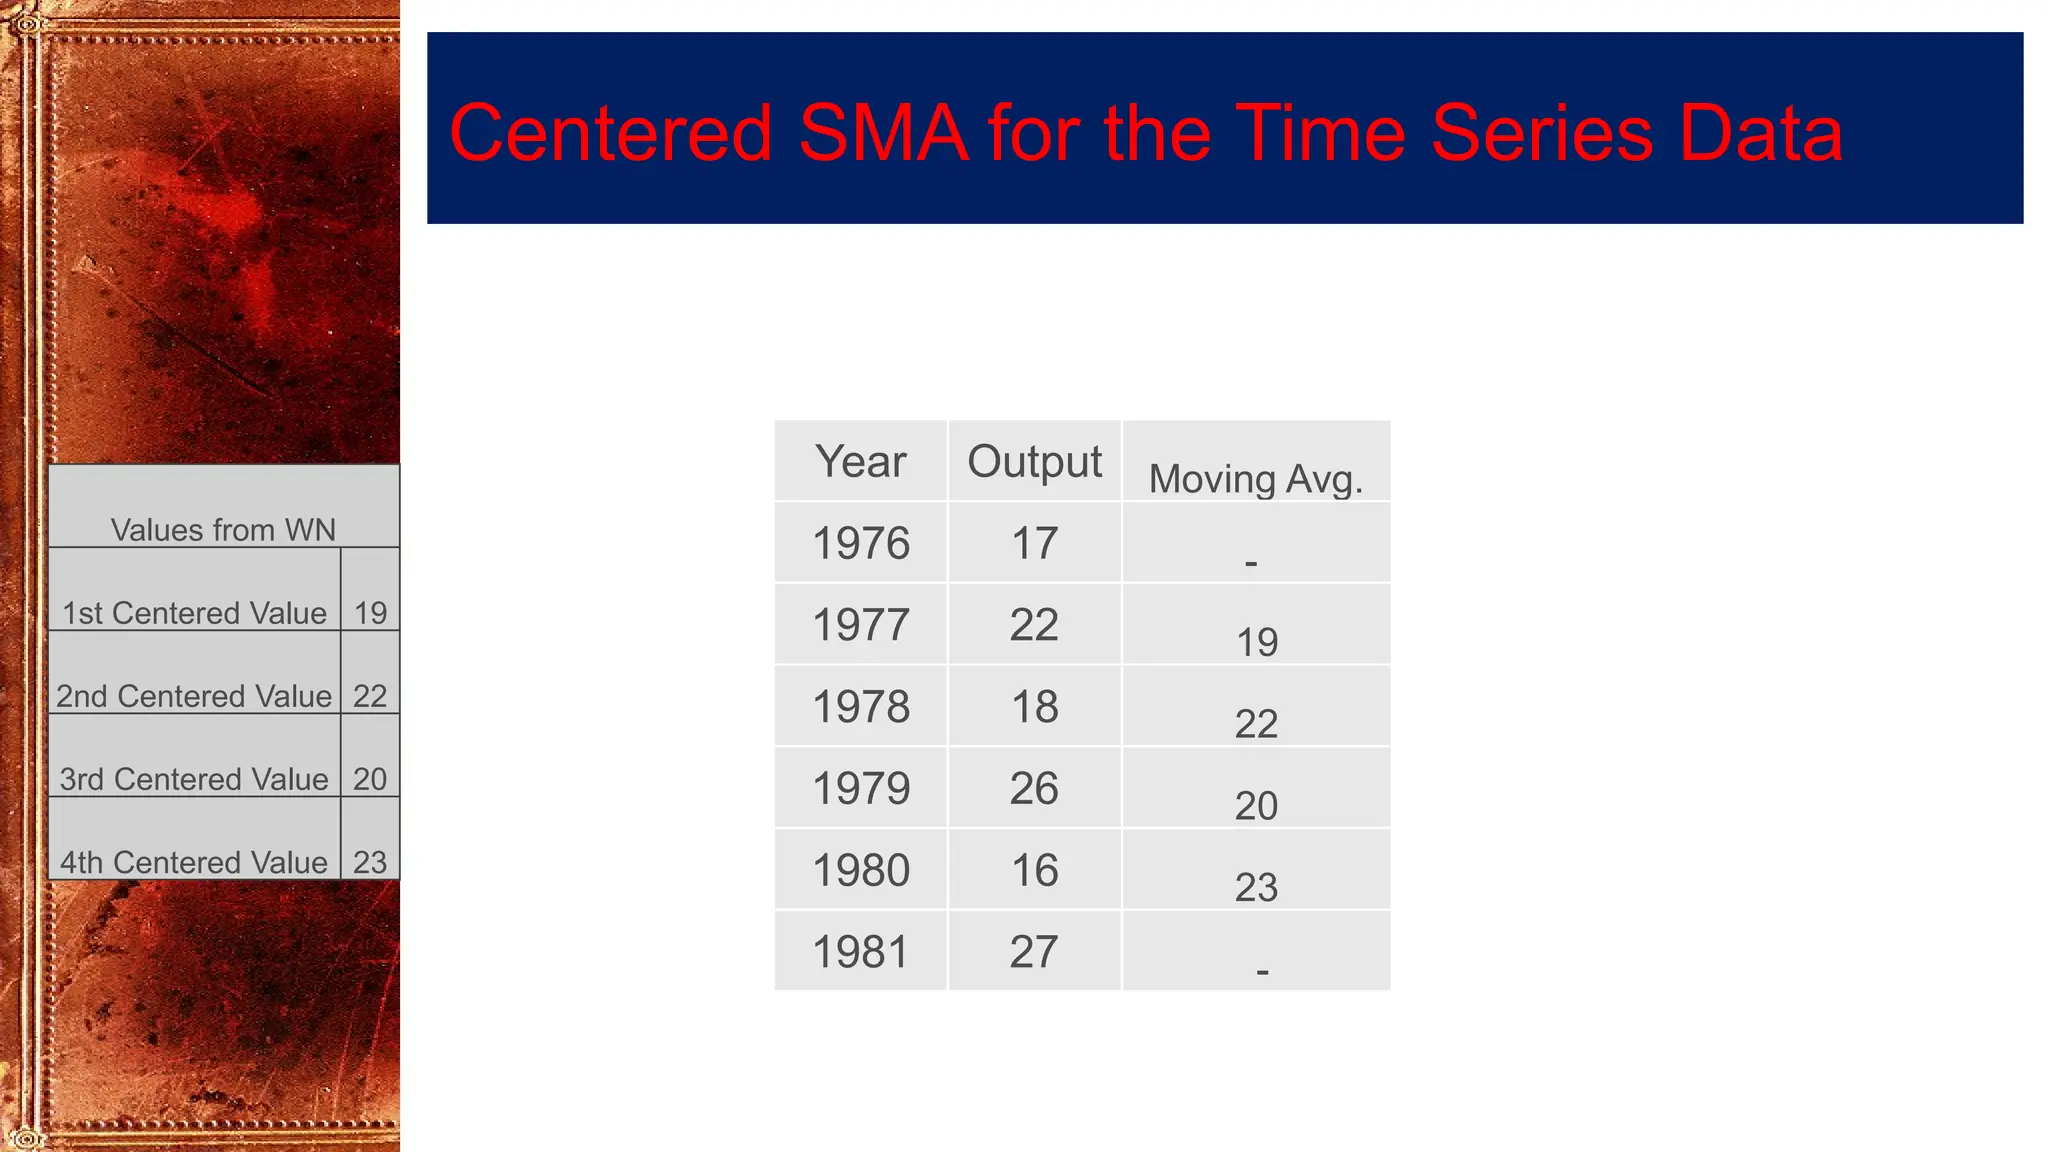
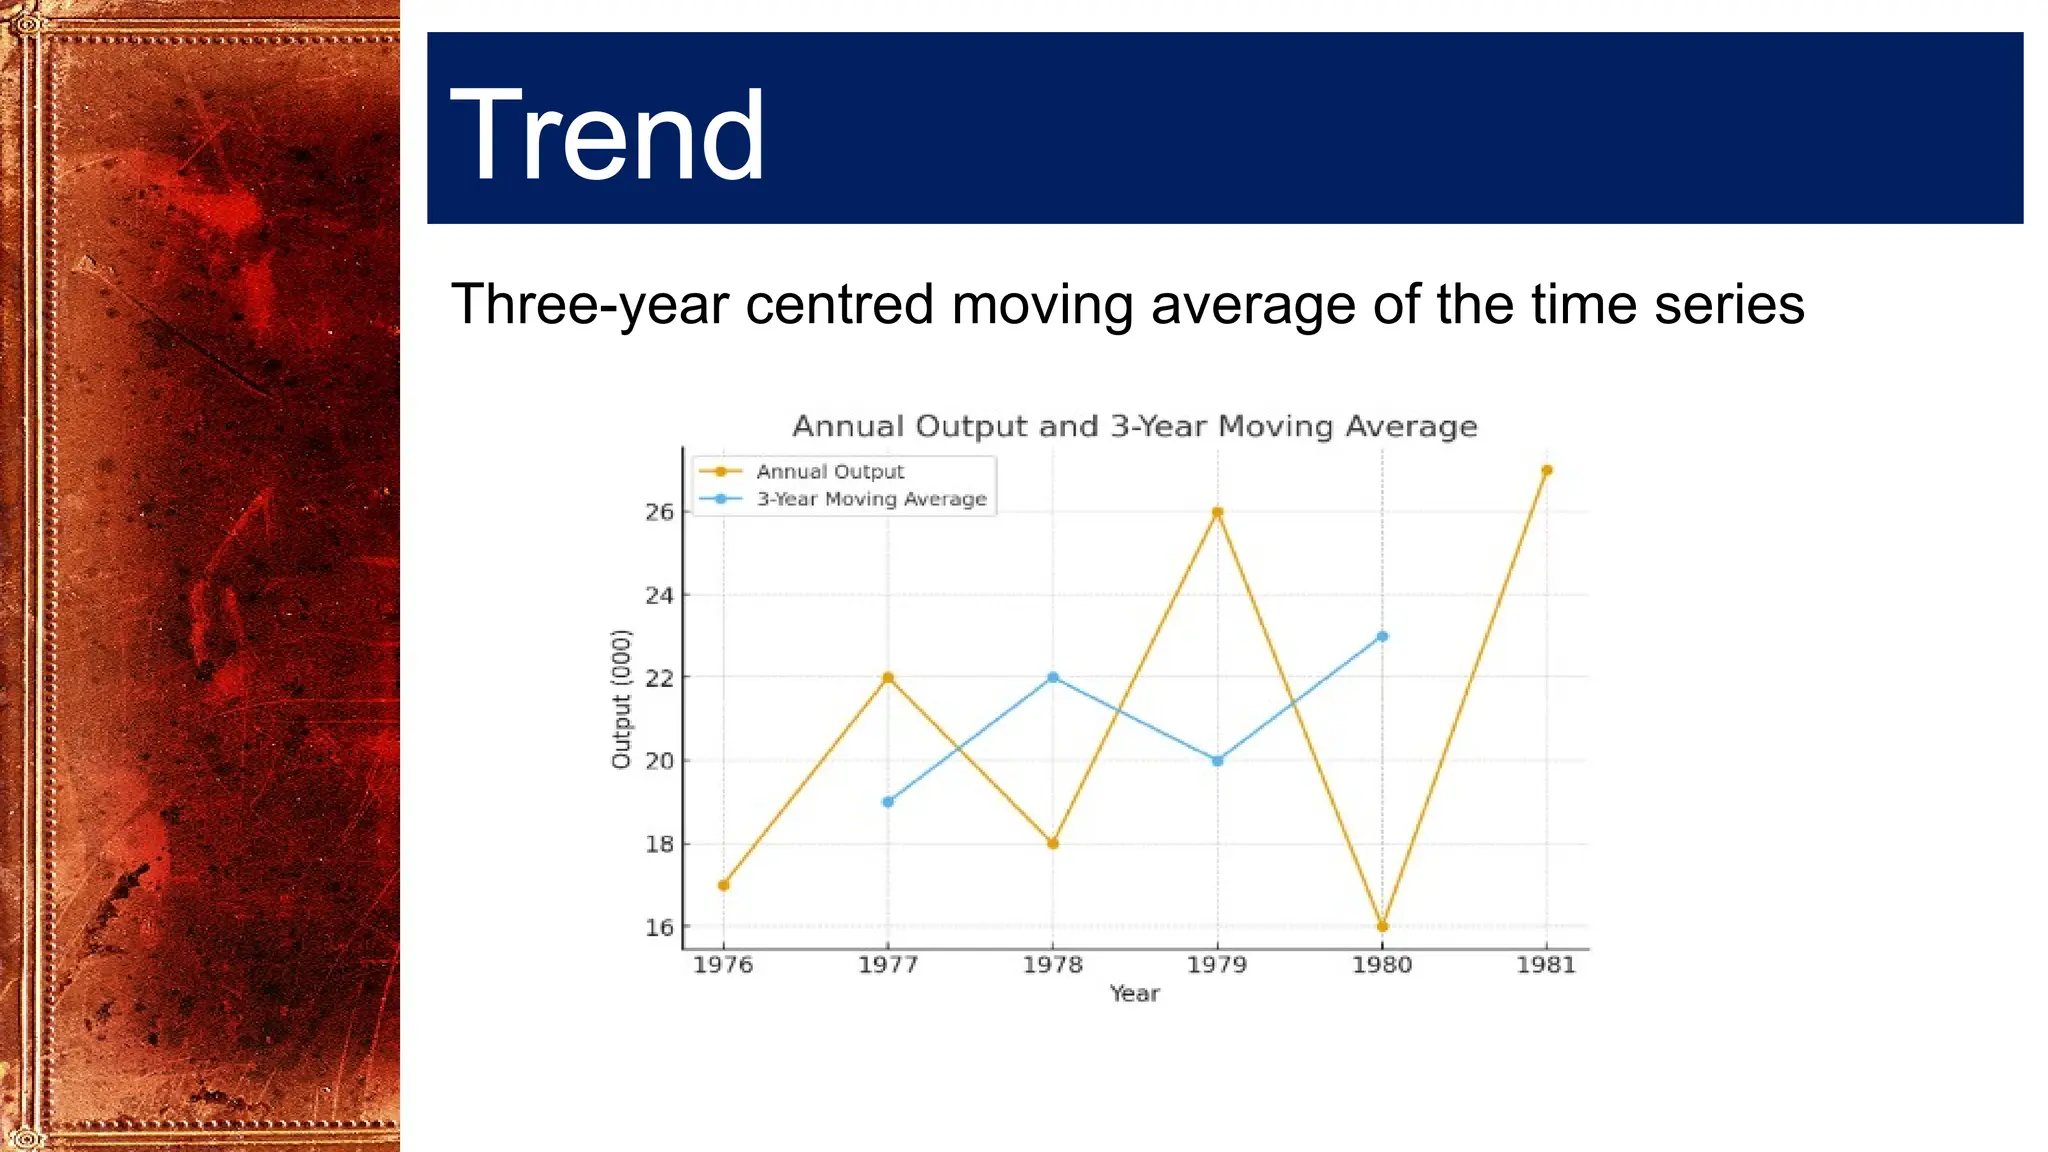
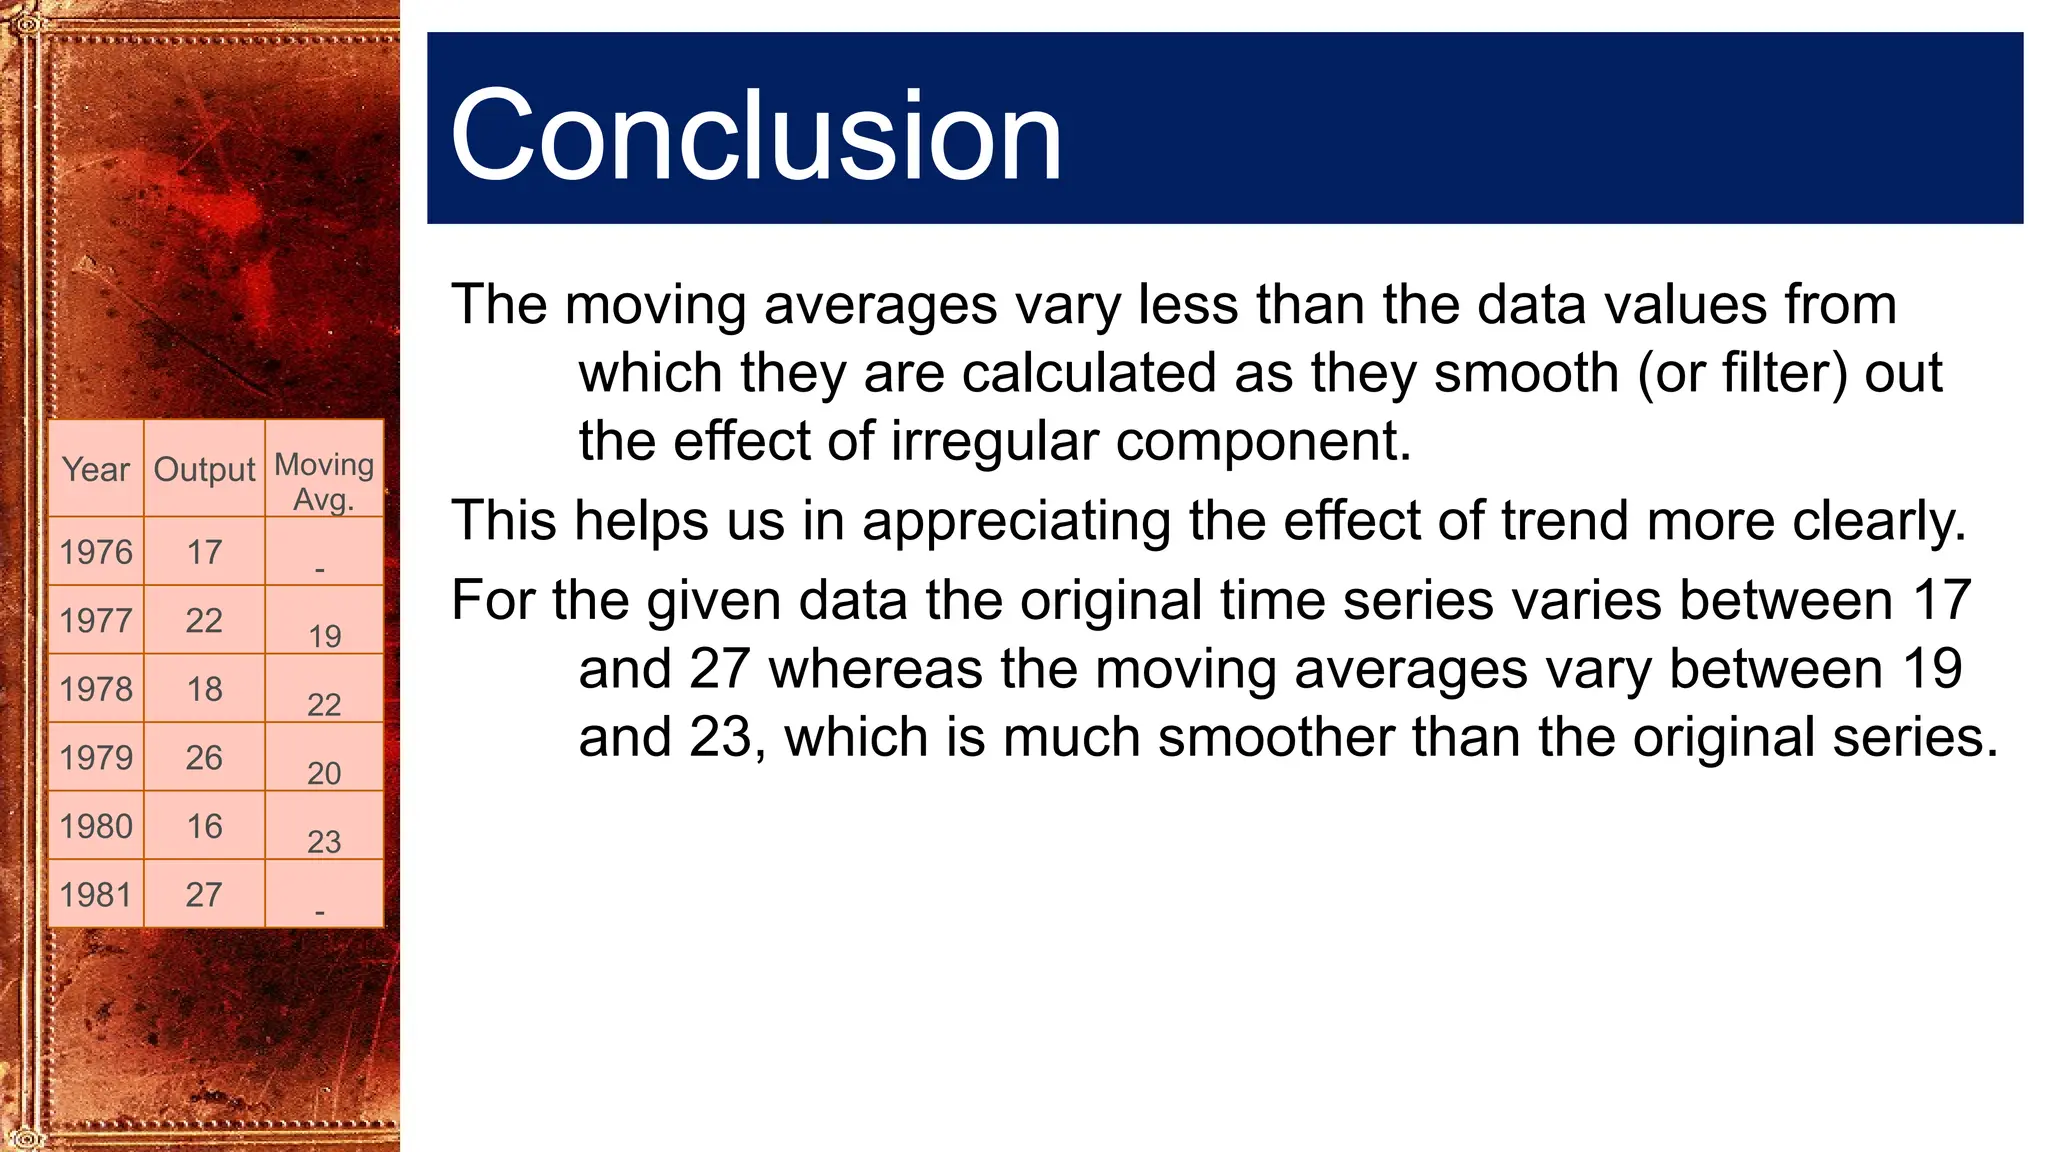
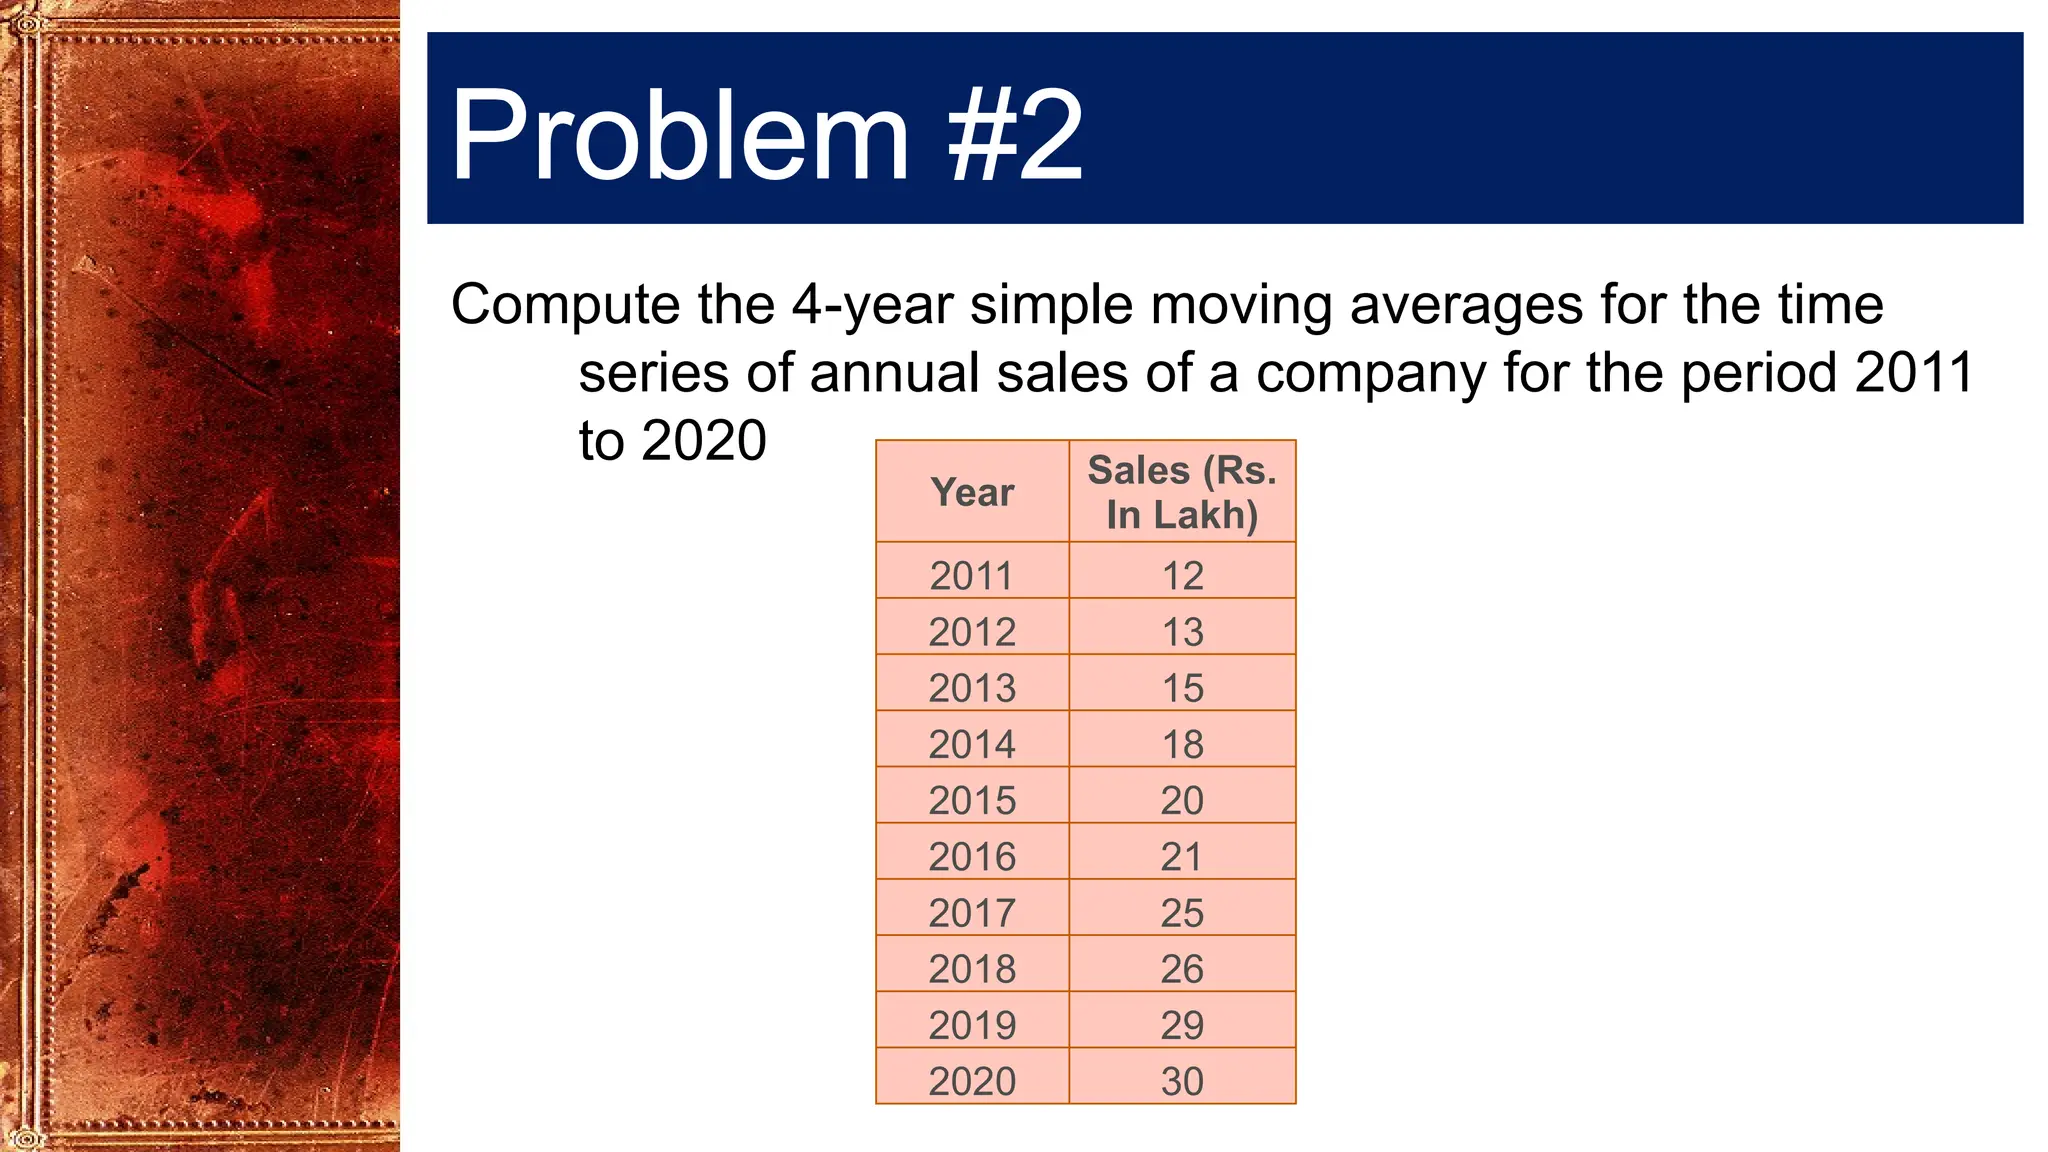
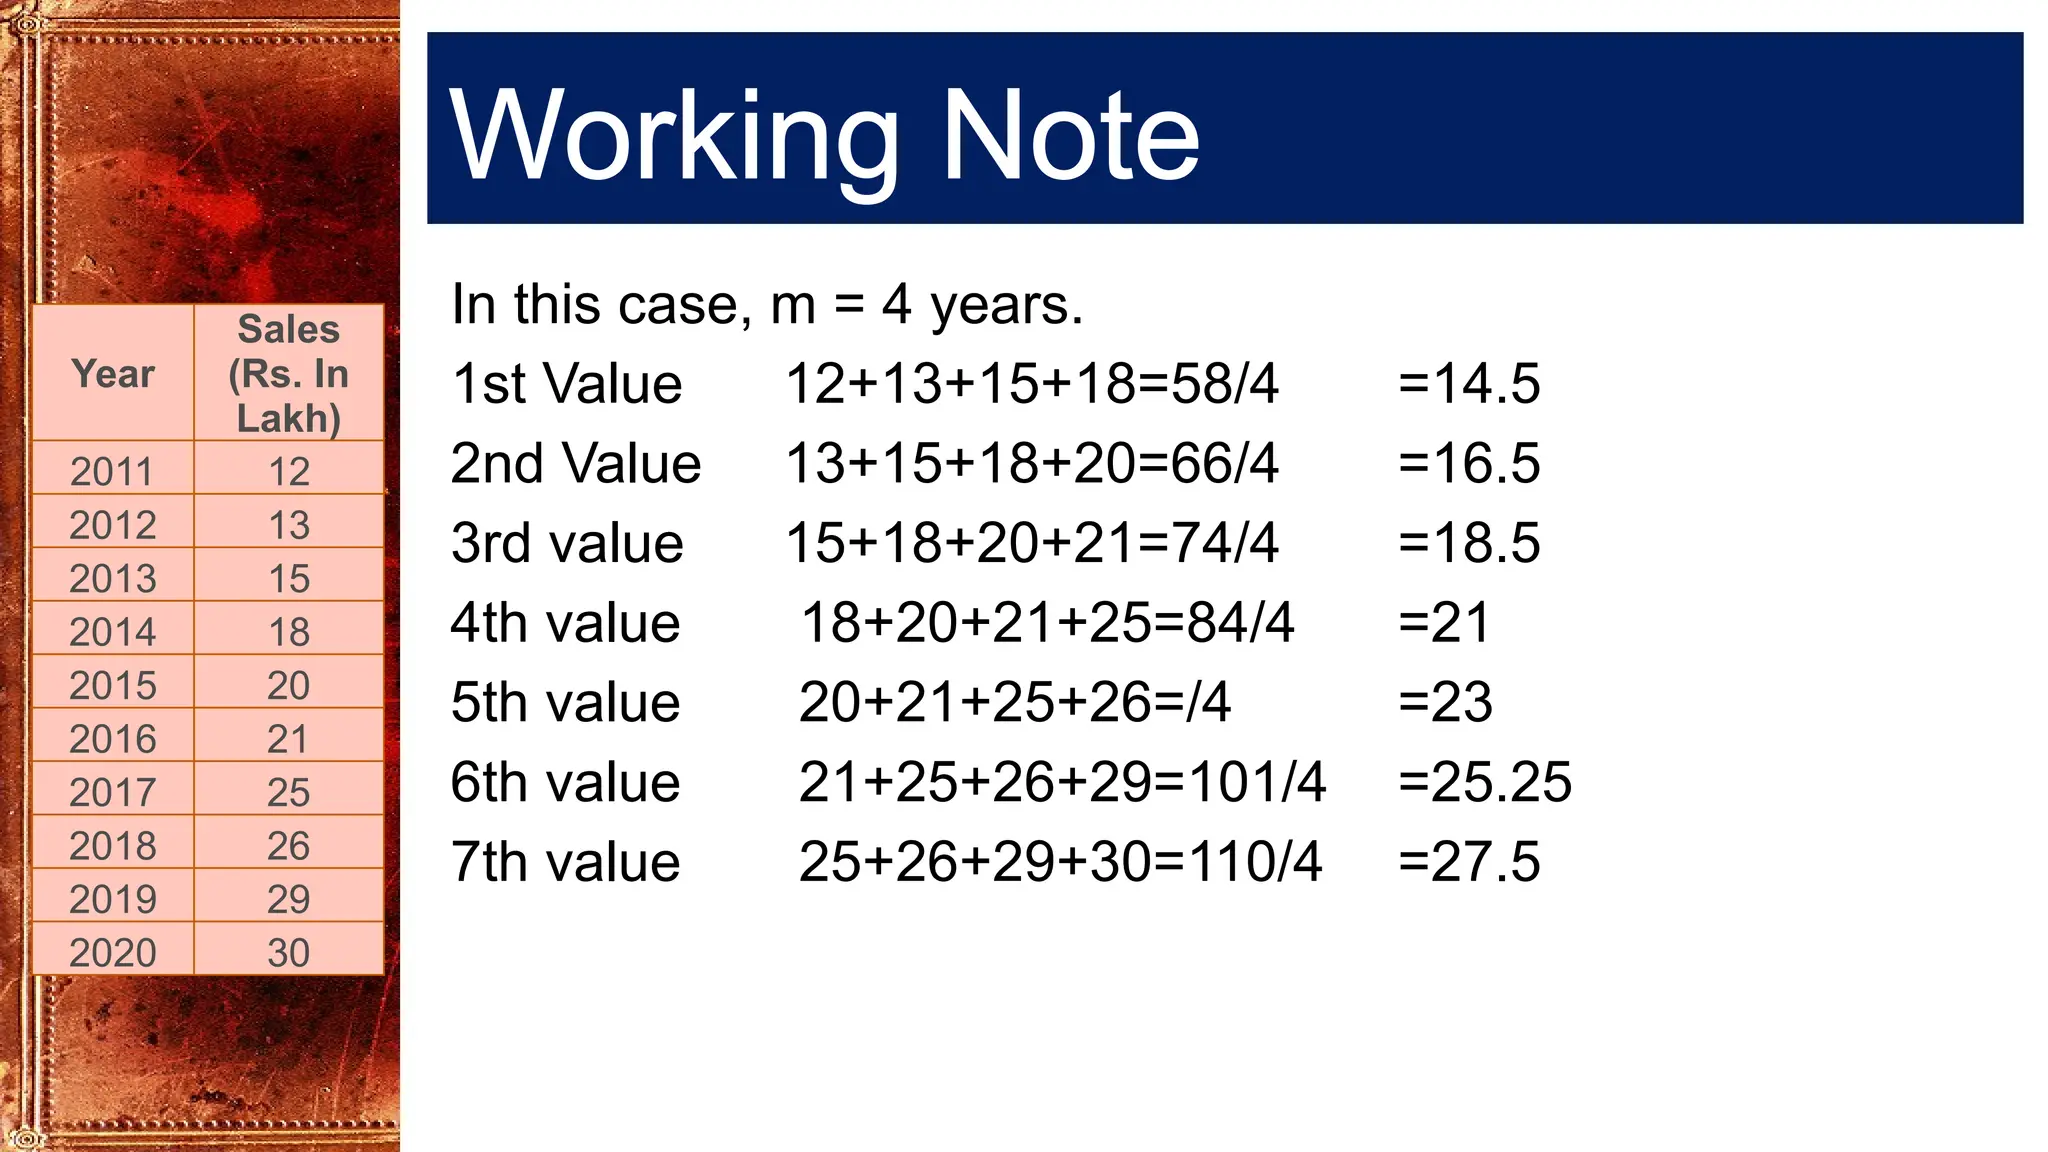
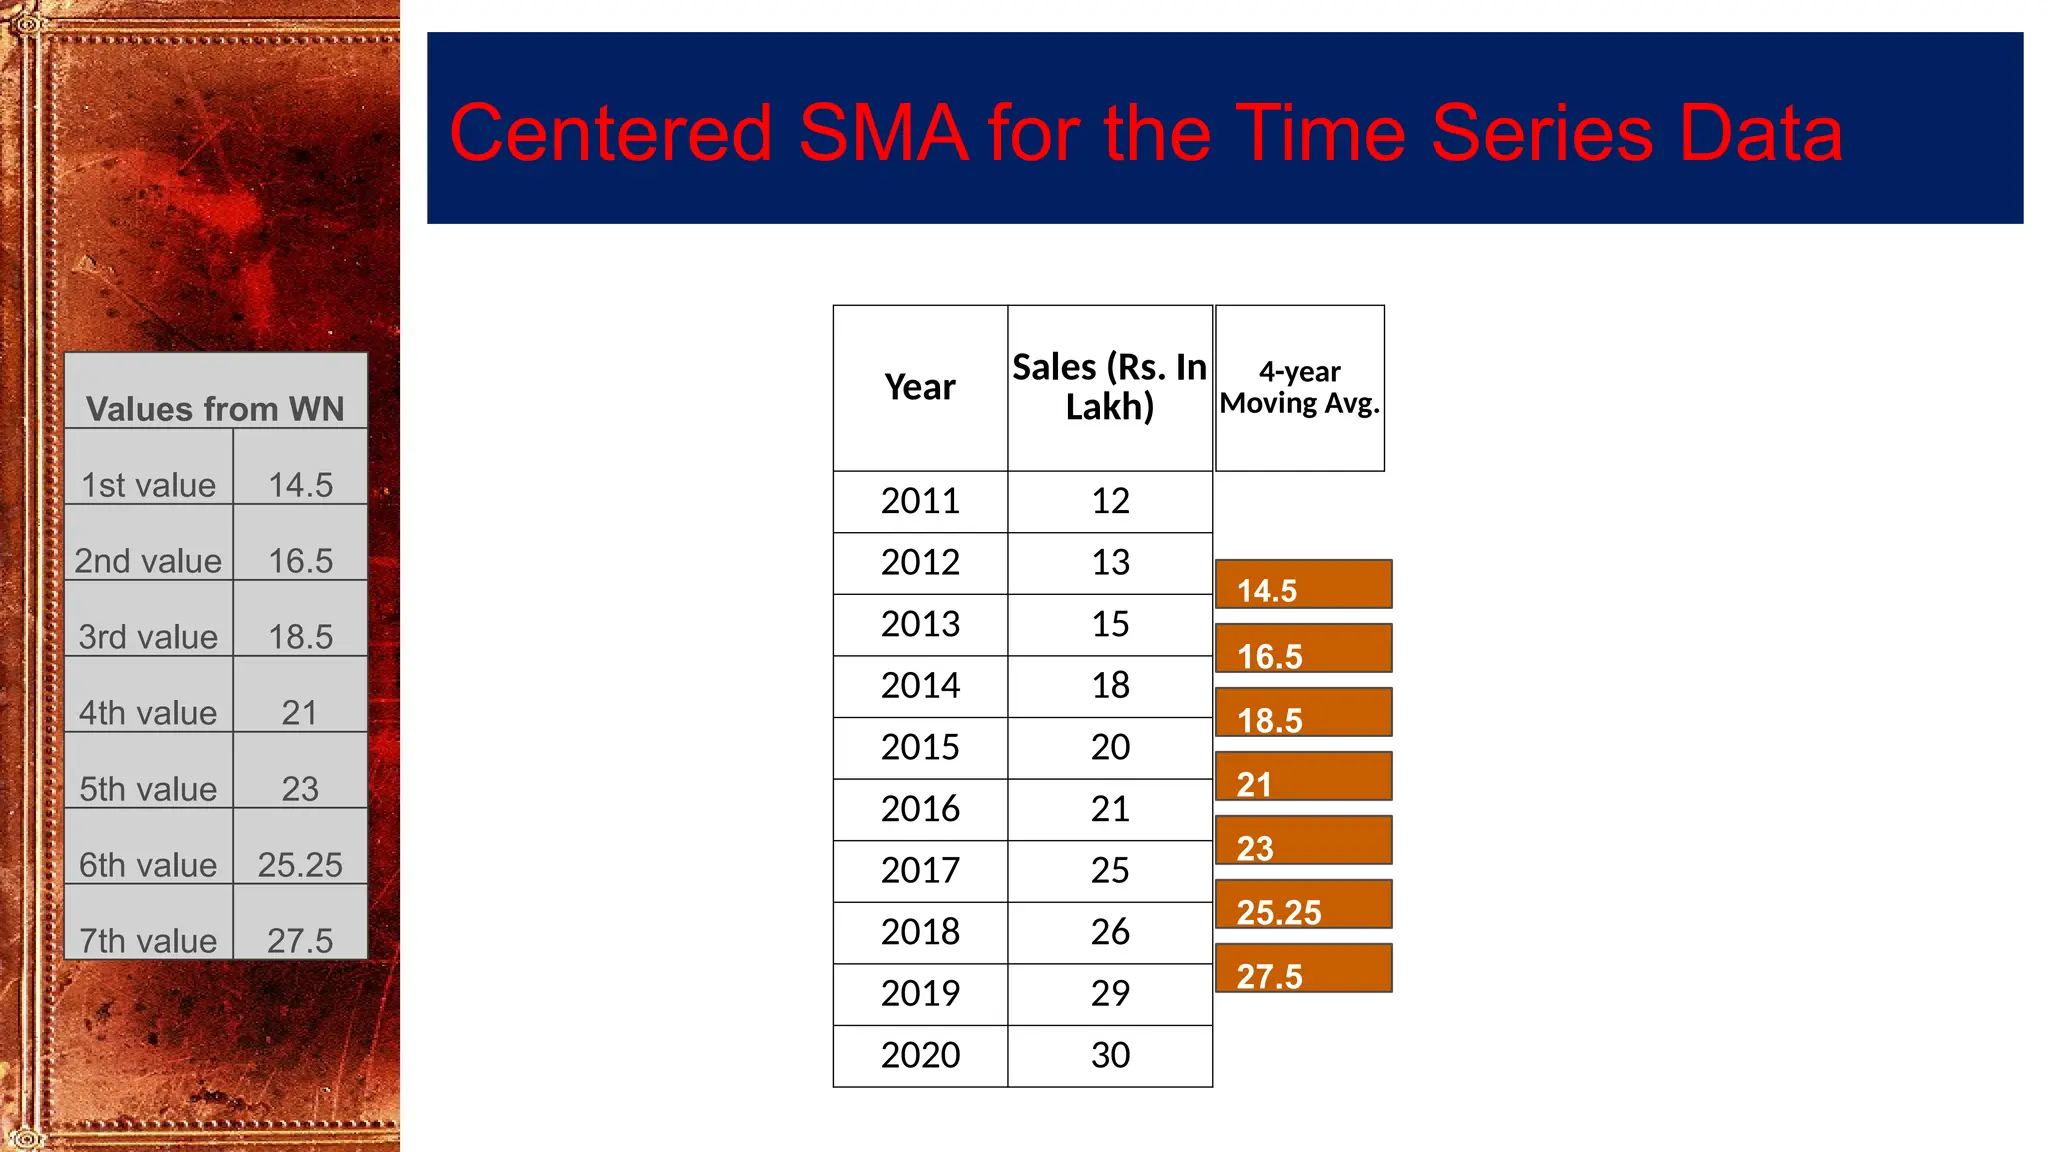
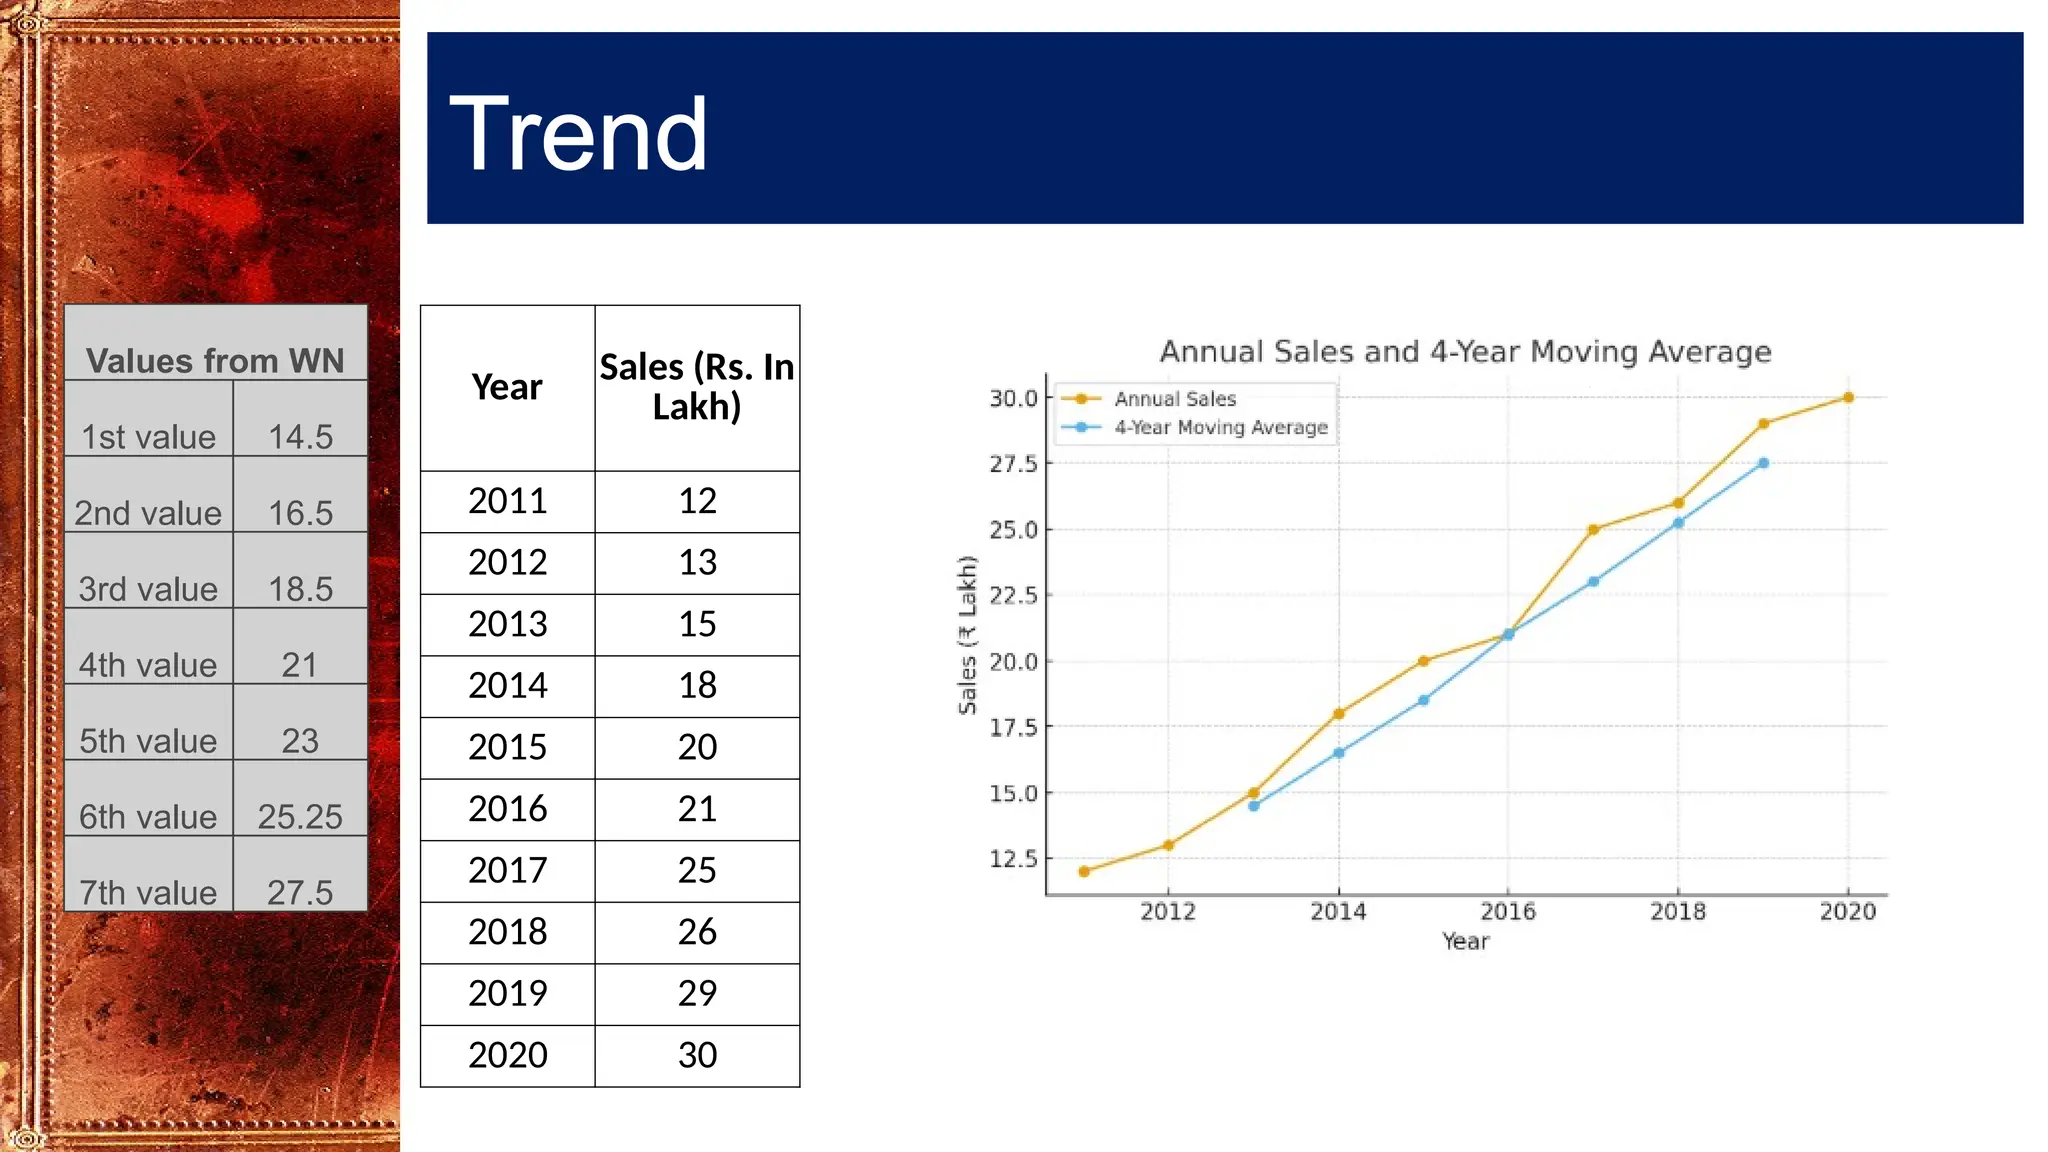

Time Series Analysis using Simple Moving Averages smooths short-term fluctuations to reveal underlying trends. In a 3-year moving average, each value is the average of three consecutive years, shifting forward one year at a time. Similarly, a 4-year moving average uses four consecutive years. These methods help reduce random variations, making long-term patterns clearer. They are widely used in business forecasting, sales analysis, production planning, and economic studies to identify trends and support decision-making.