Download to read offline
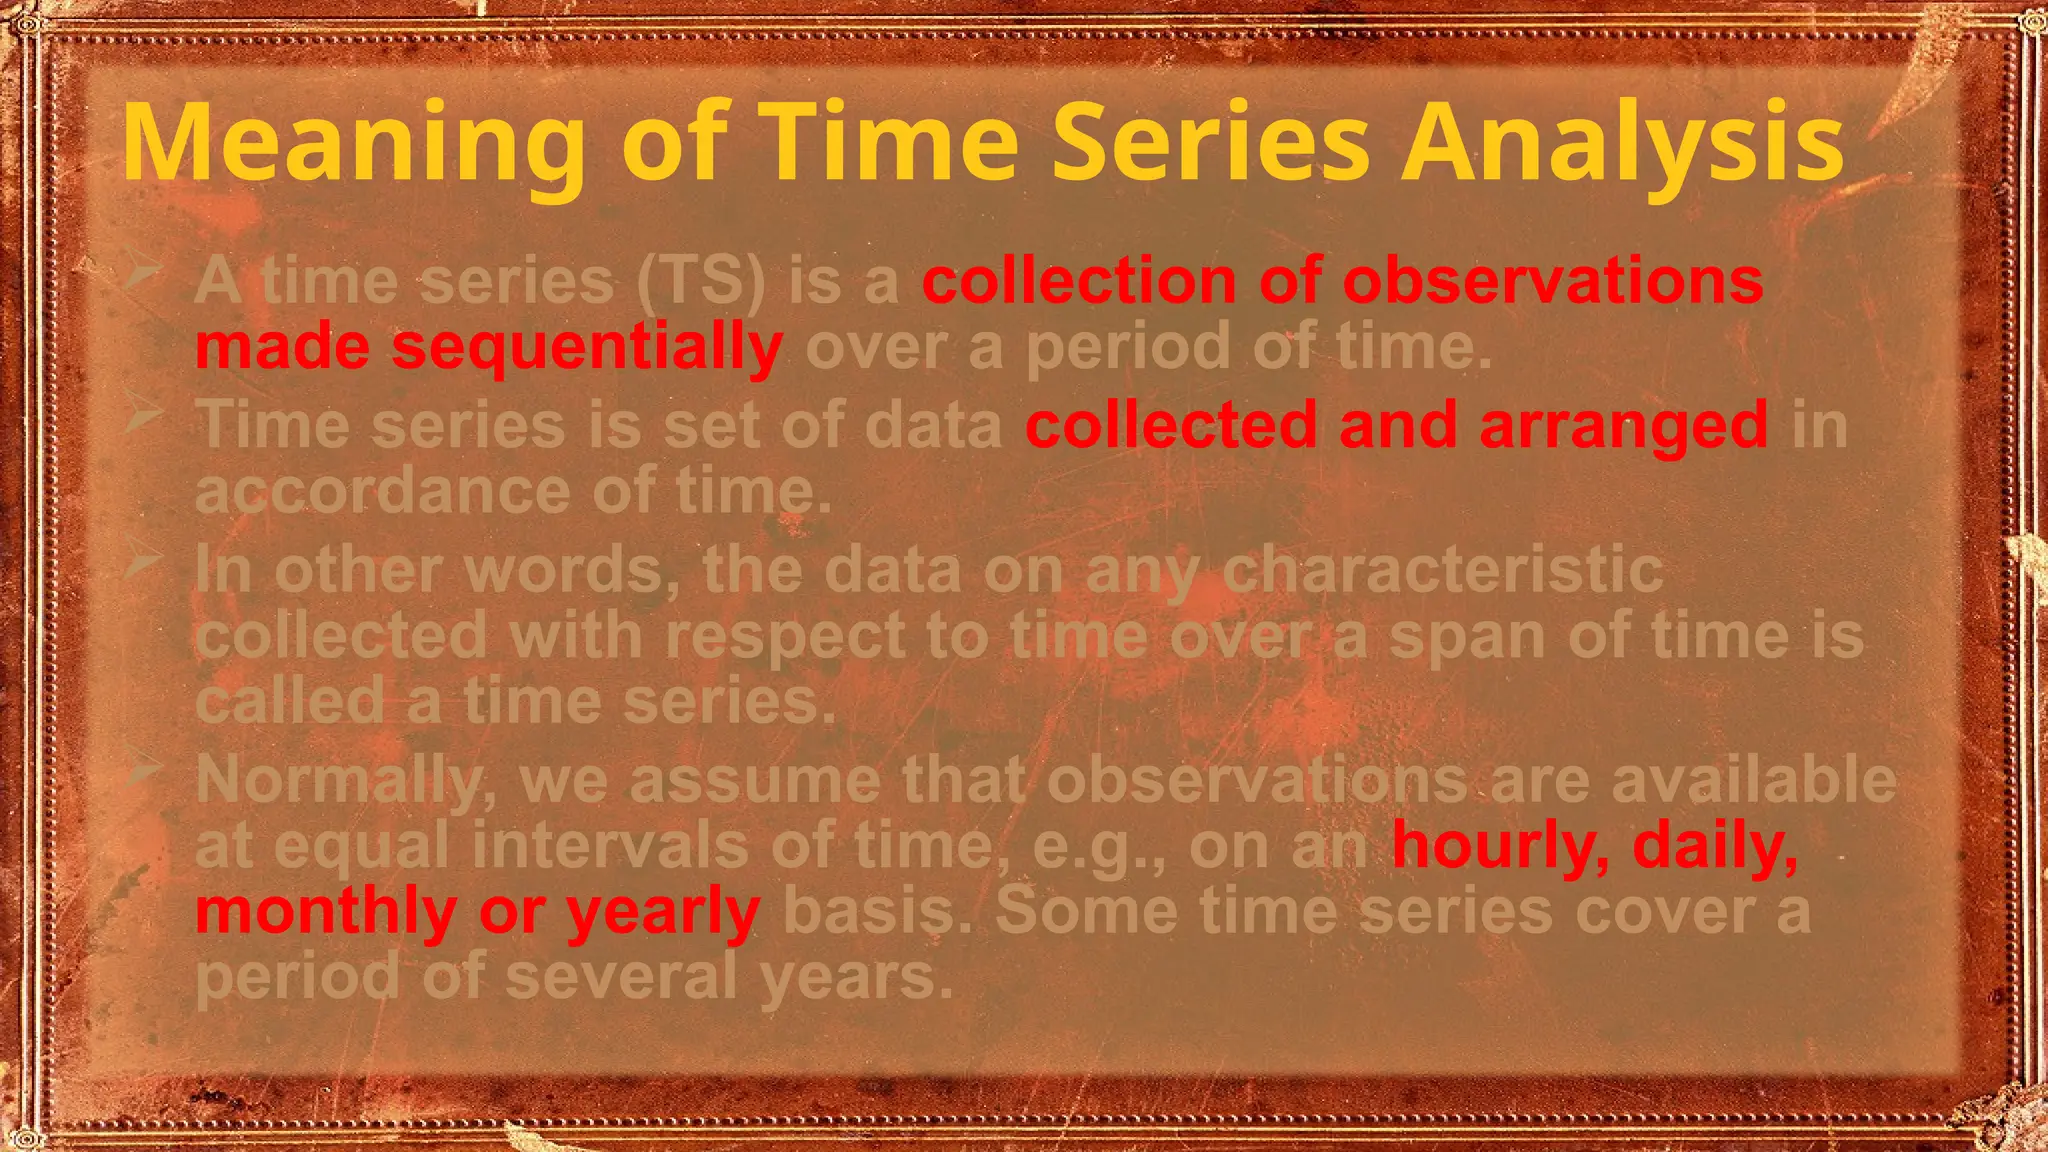
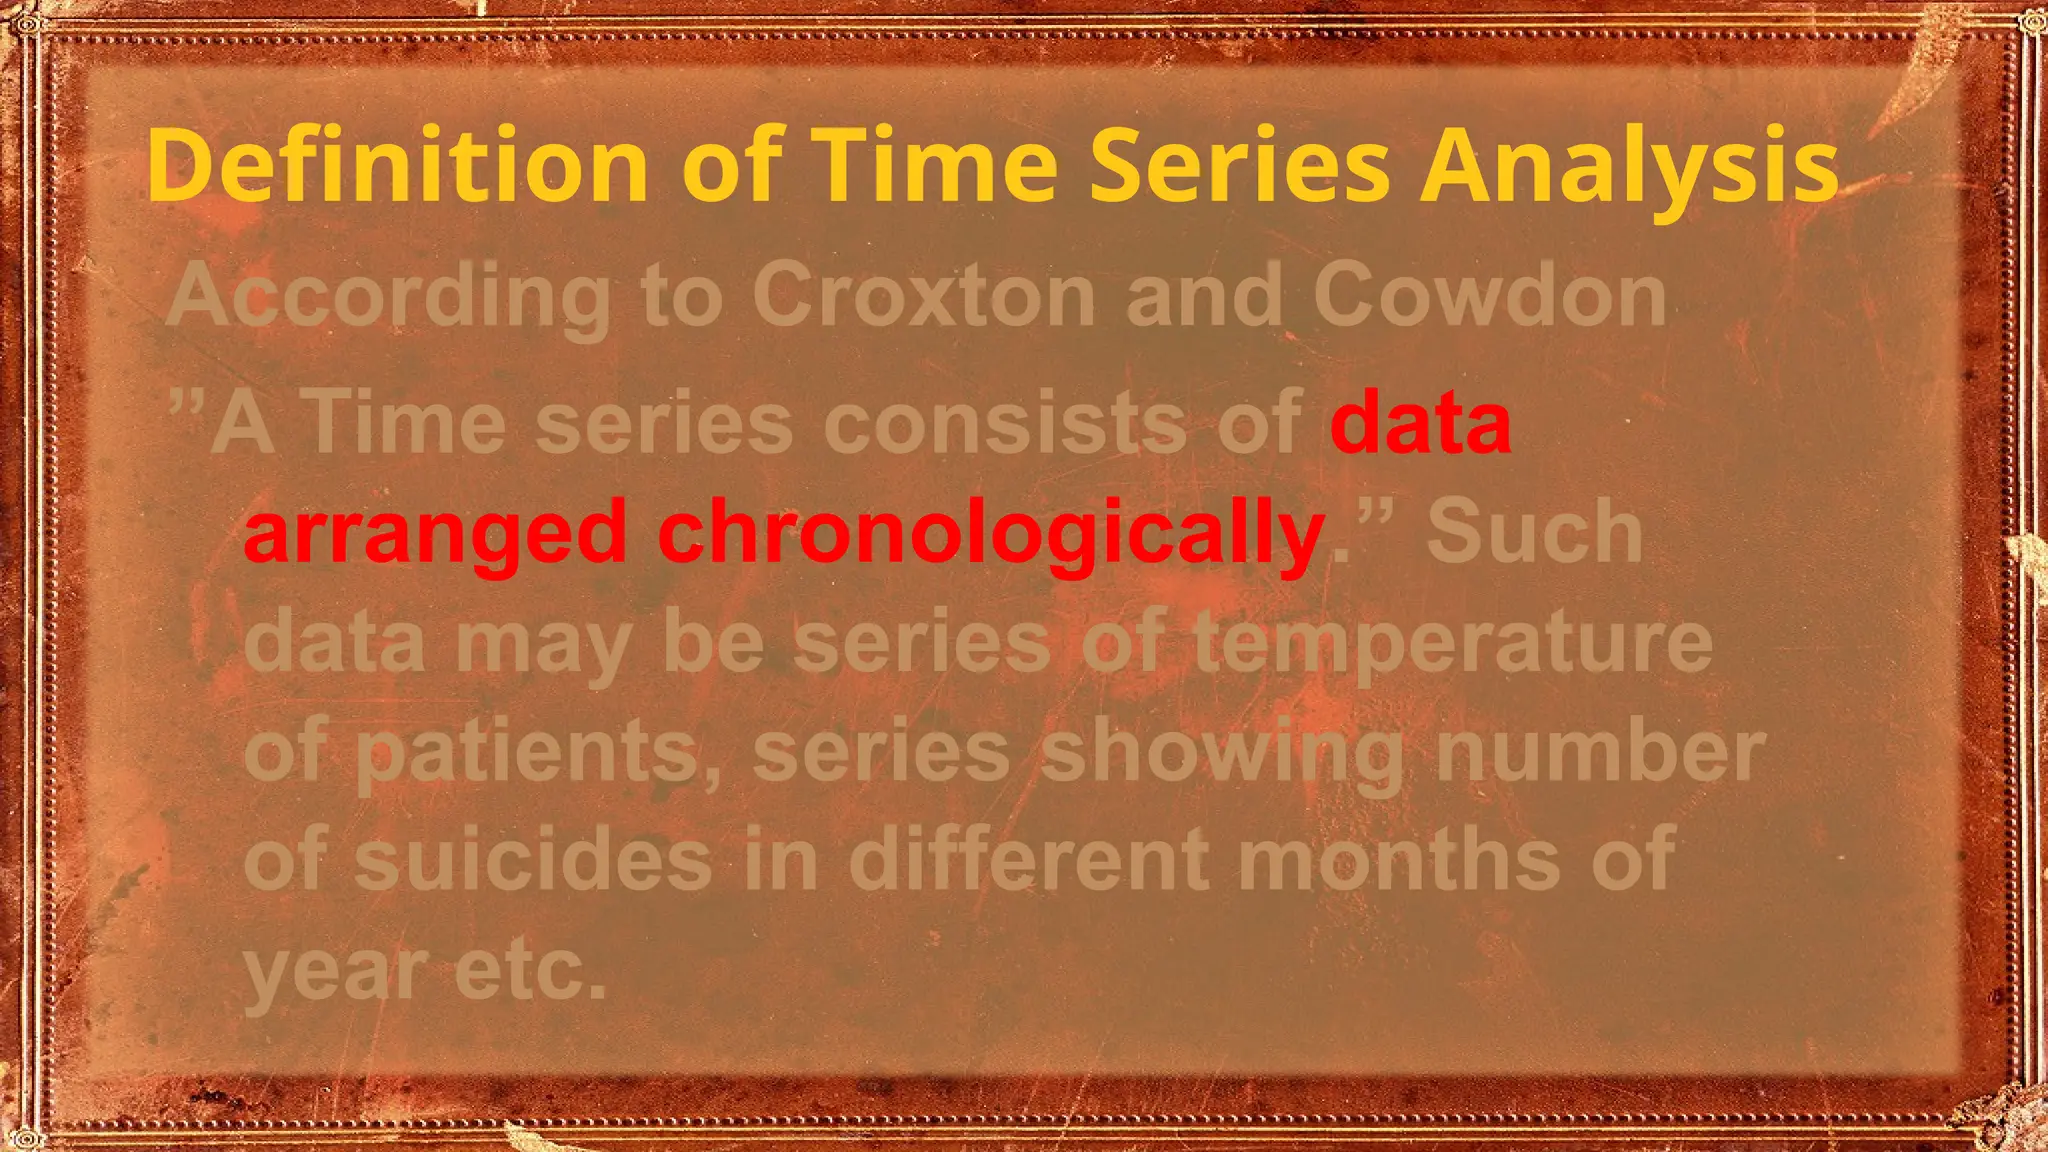
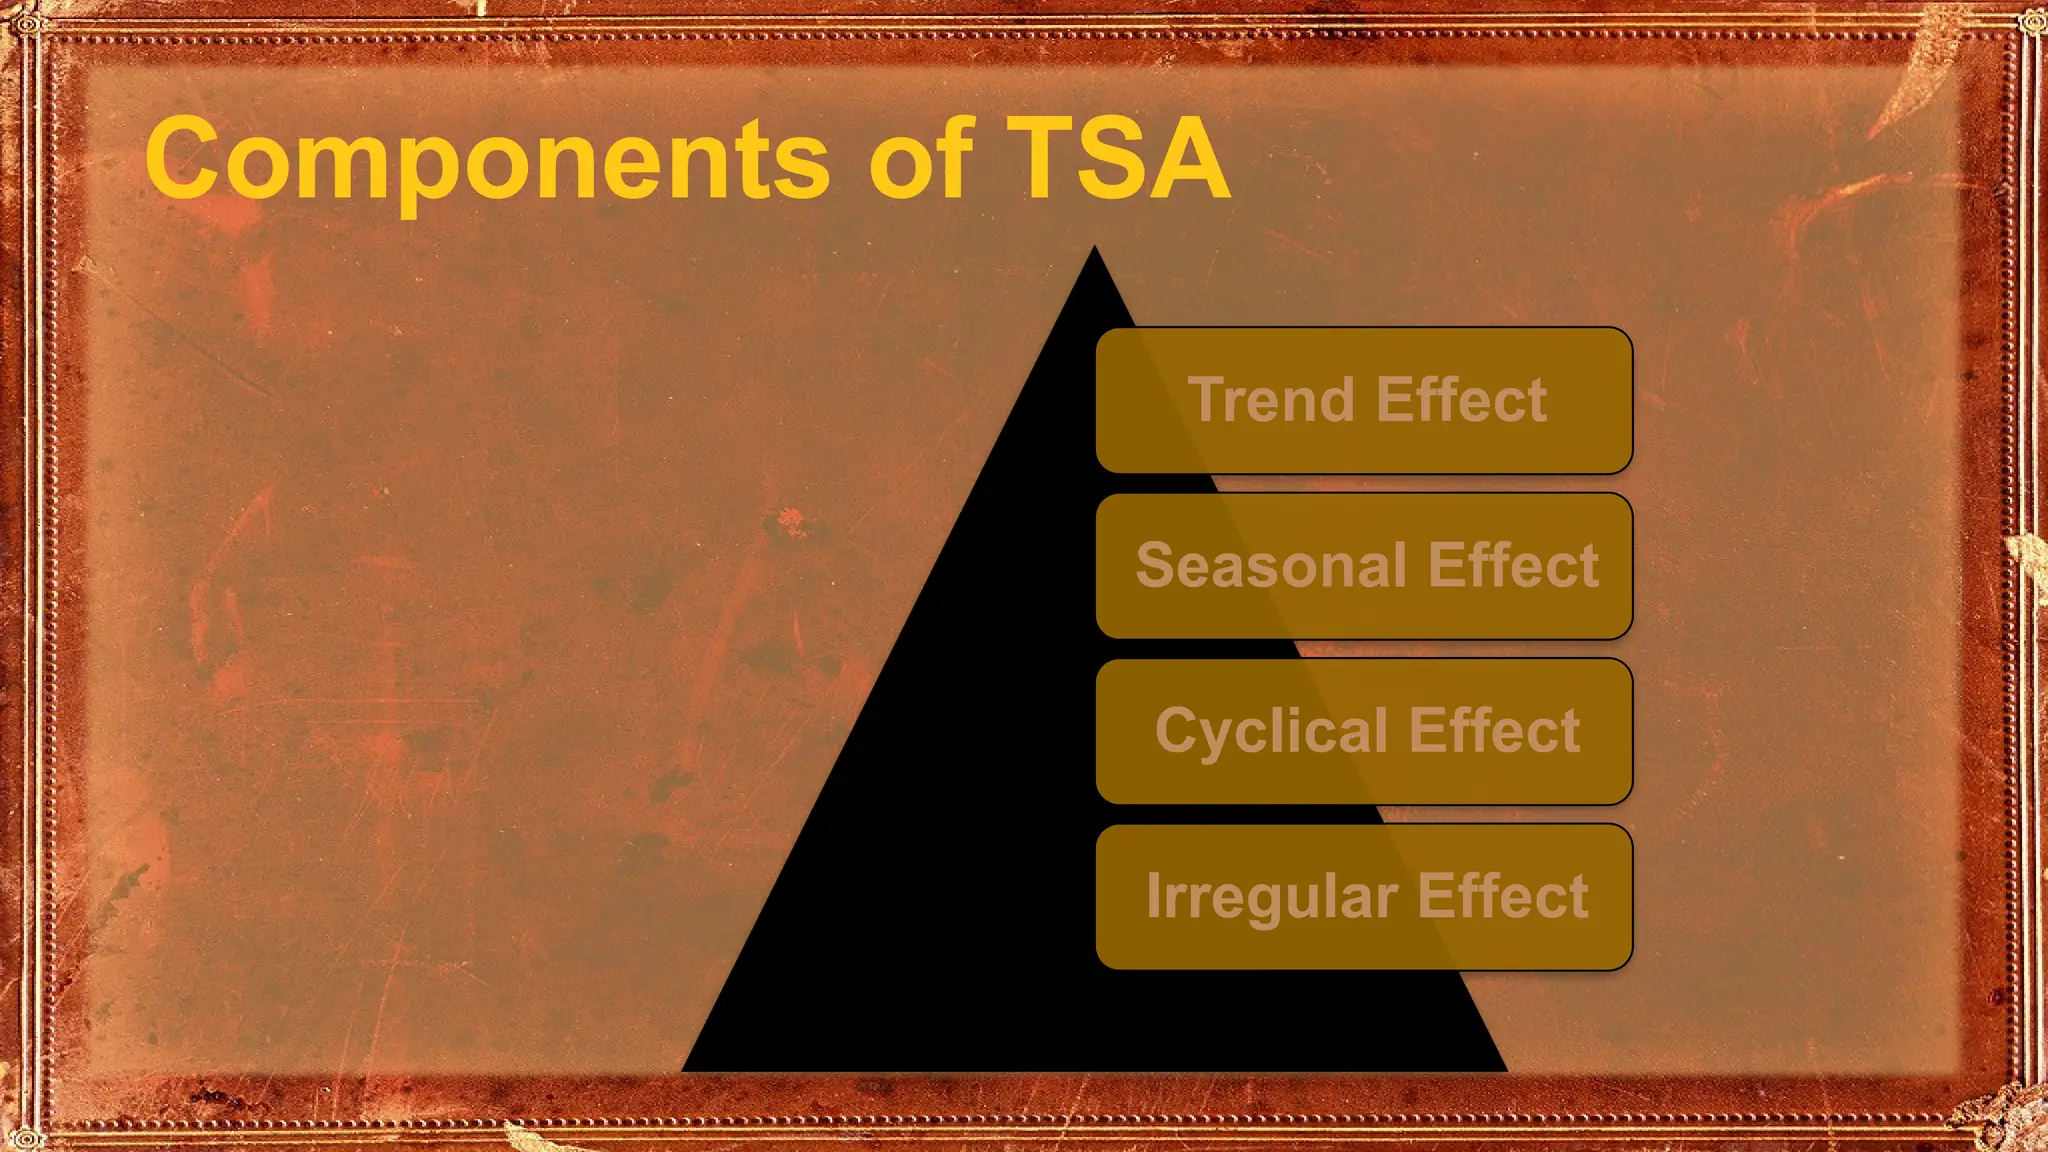
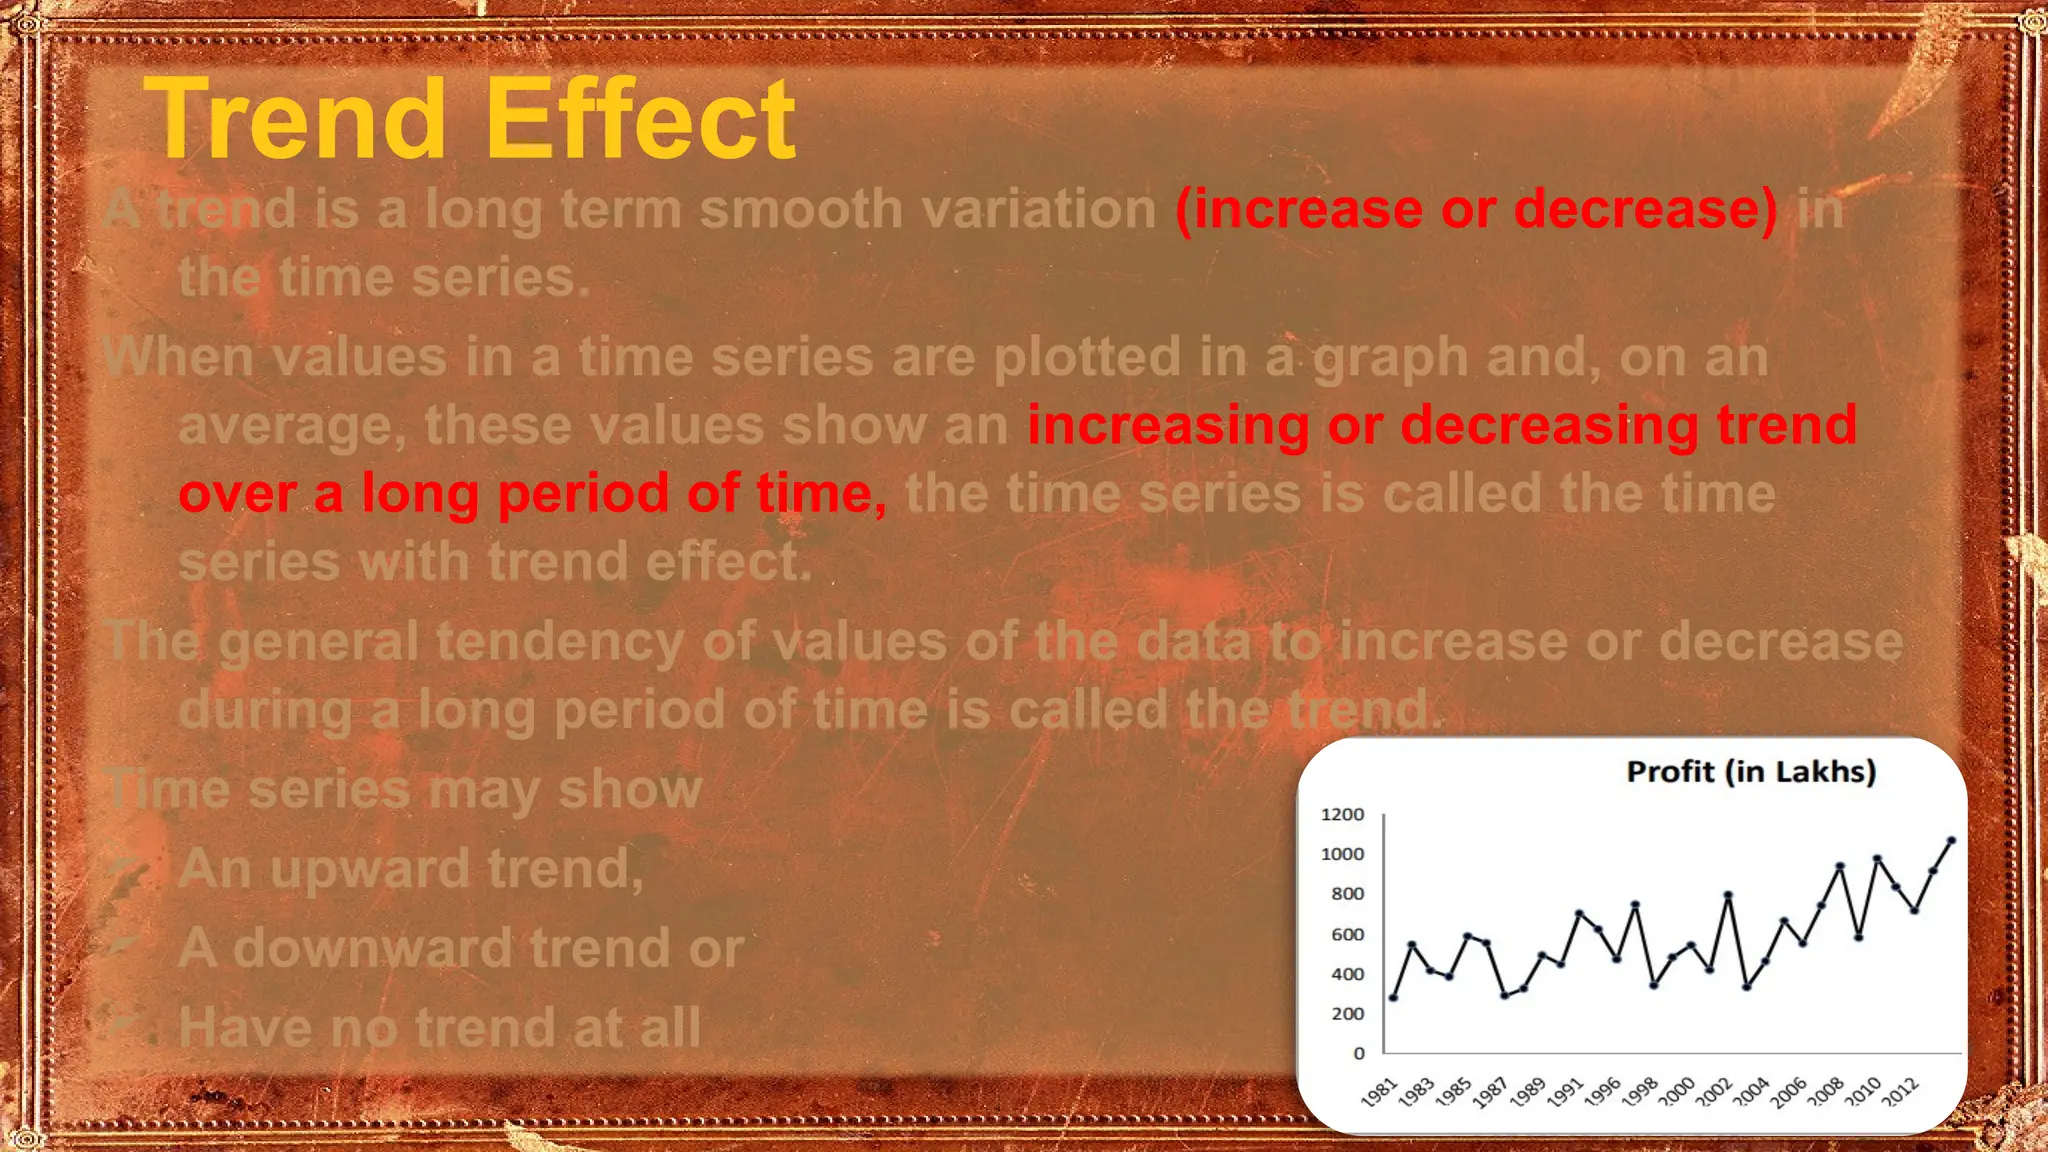
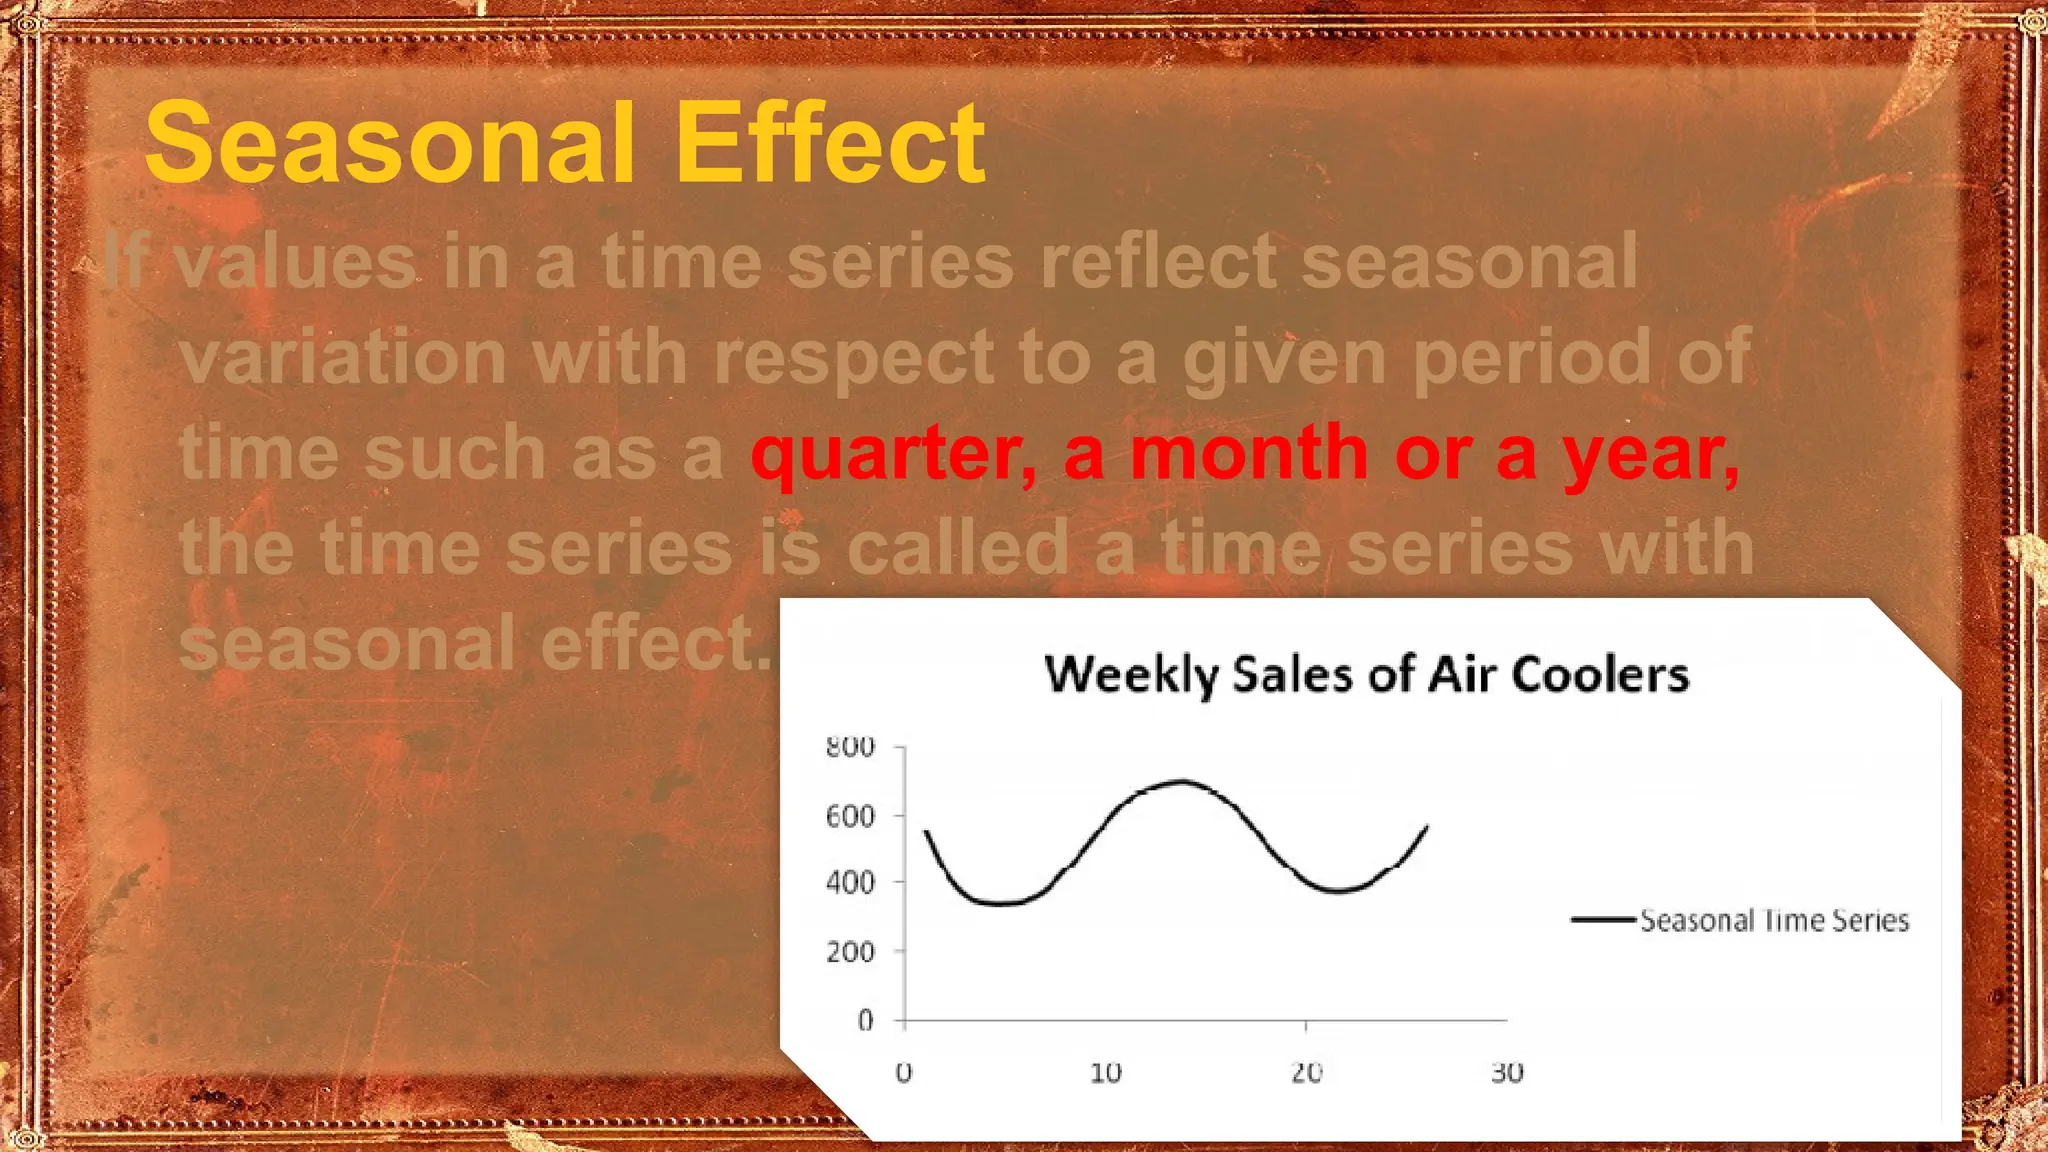
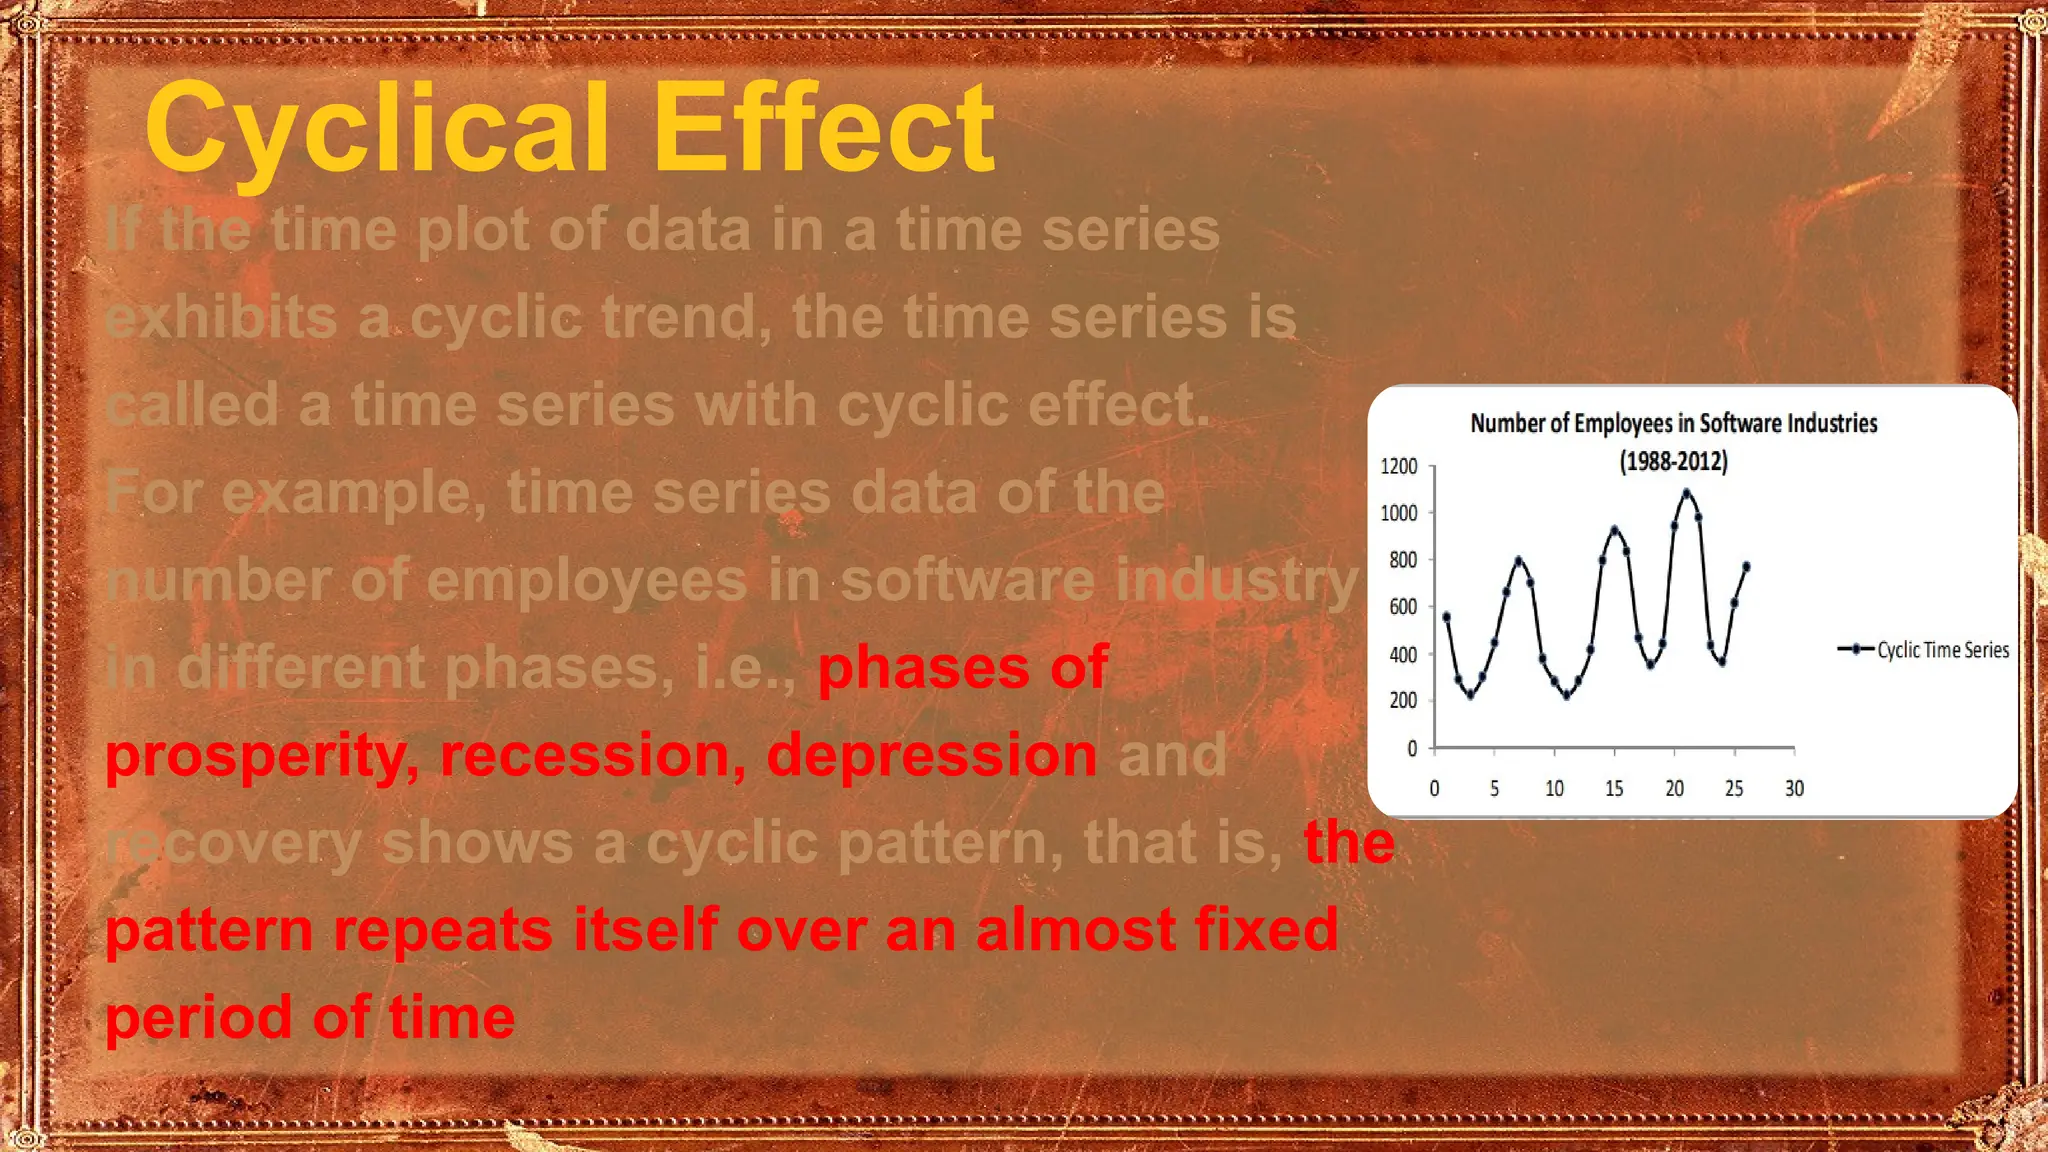
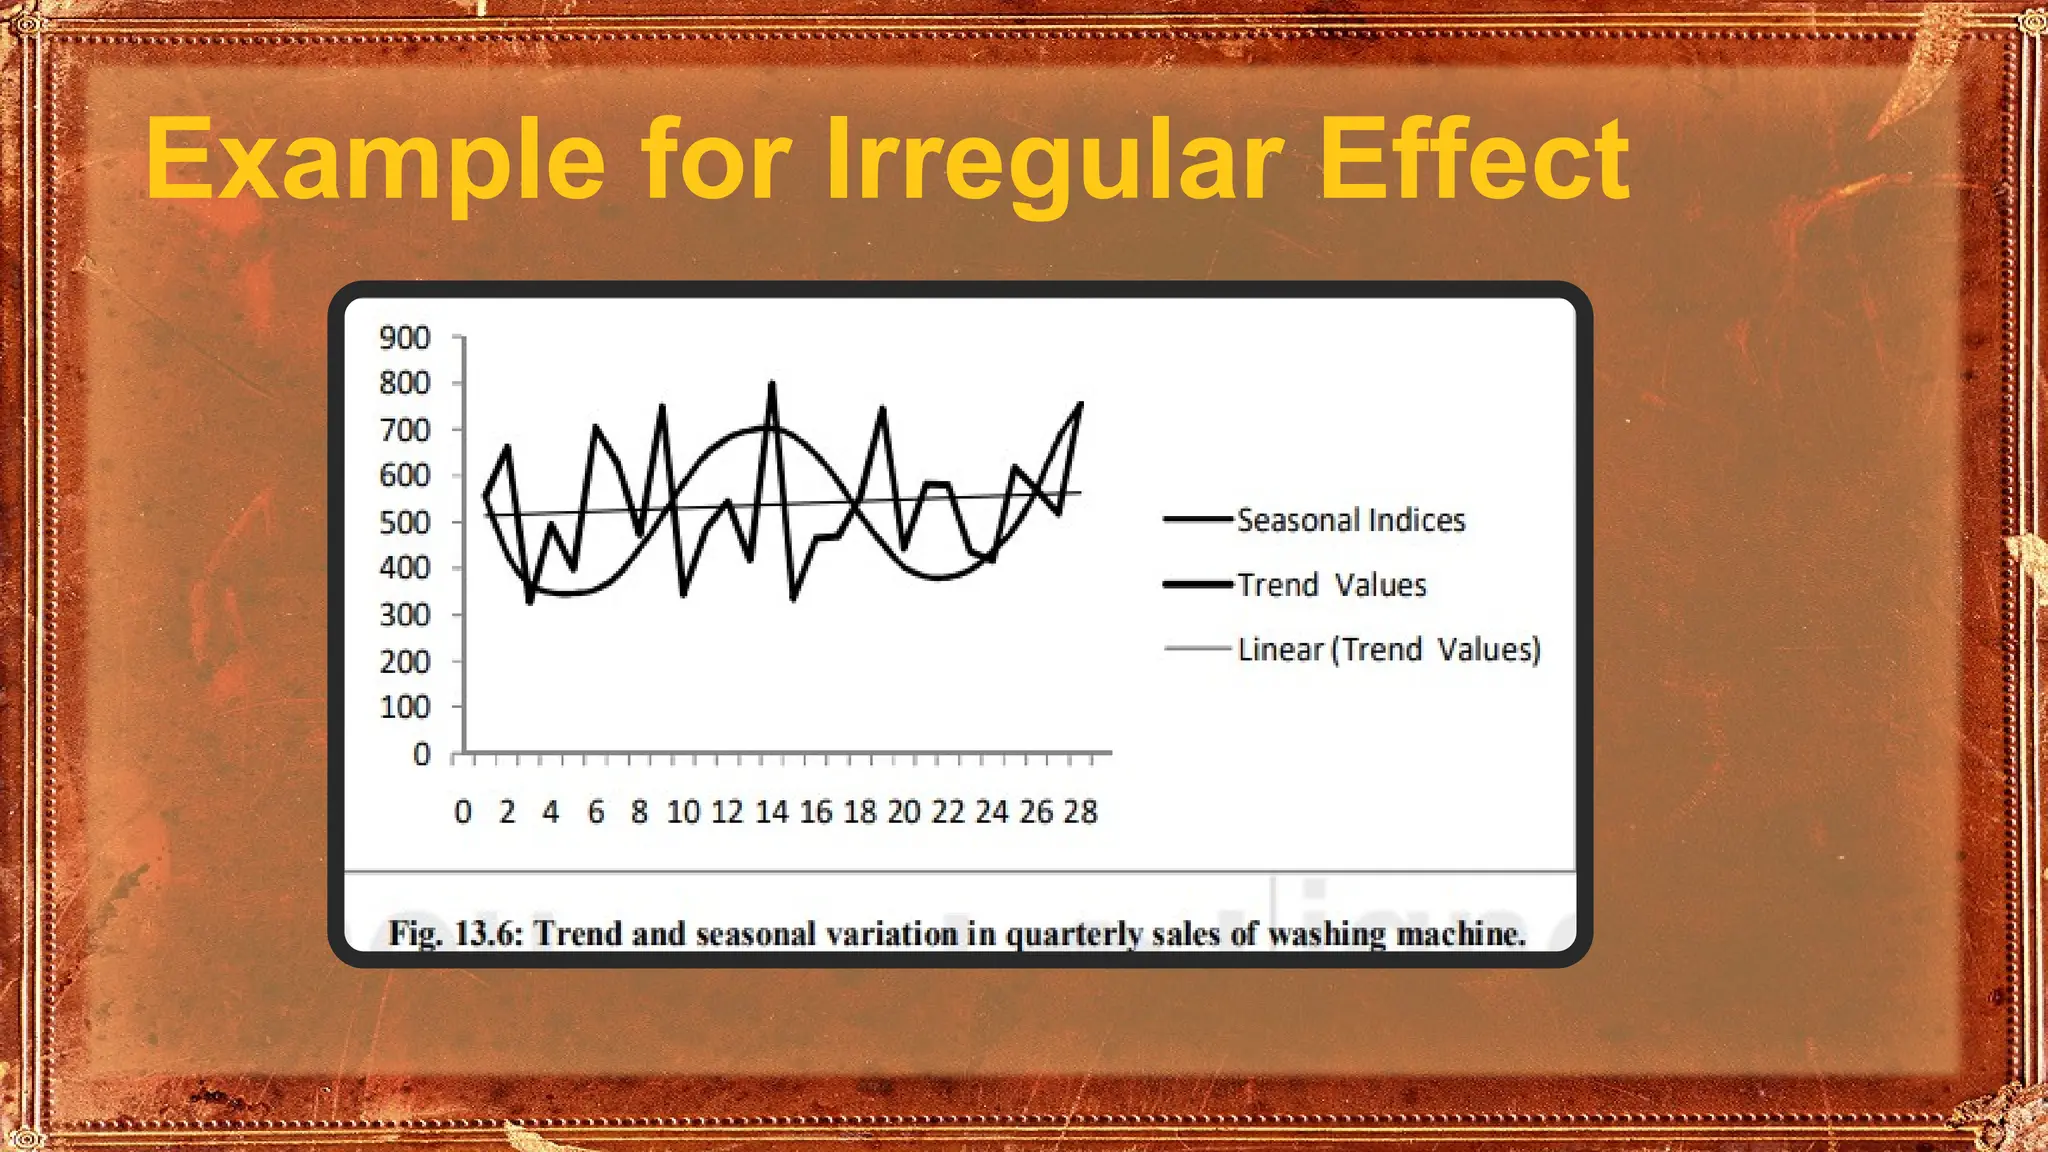

This ppt contains Time Series Analysis Meaning, Definition, Components and Application. Time Series Analysis examines data points collected over time to identify patterns and predict future values. It involves understanding trends, seasonal variations, cyclical movements, and irregular fluctuations. Widely used in economics, finance, weather forecasting, business planning, and quality control, it helps organizations make informed, data-driven decisions.