Quantifying Peace andits Benefits
The Institute for Economics & Peace (IEP) is an independent, non-partisan, non-profit think tank dedicated
to shifting the world’s focus to peace as a positive, achievable, and tangible measure of human well-being
and progress. IEP achieves its goals by developing new conceptual frameworks to define peacefulness;
providing metrics for measuring peace; and uncovering the relationships between business, peace and
prosperity as well as promoting a better understanding of the cultural, economic and political factors that
create peace.
IEP is headquartered in Sydney, with offices in New York, Brussels, The Hague, Mexico City and Nairobi.
It works with a wide range of partners internationally and collaborates with intergovernmental organisations
on measuring and communicating the economic value of peace.
For more information visit www.economicsandpeace.org
Please cite this report as:
Institute for Economics & Peace. Global Peace Index 2025: Identifying and Measuring the Factors that
Drive Peace, Sydney, June 2025. Available from: http://visionofhumanity.org/resources (accessed Date
Month Year).
3.
Contents
Results
Trends
Economic Impact
of Violence
WhyConflicts
Escalate
Positive Peace, Conflict and
Information Flows
Appendices
7
29
43
61
91
99
1 2025 Global Peace Index Rankings 8
Results 10
Regional Overview 13
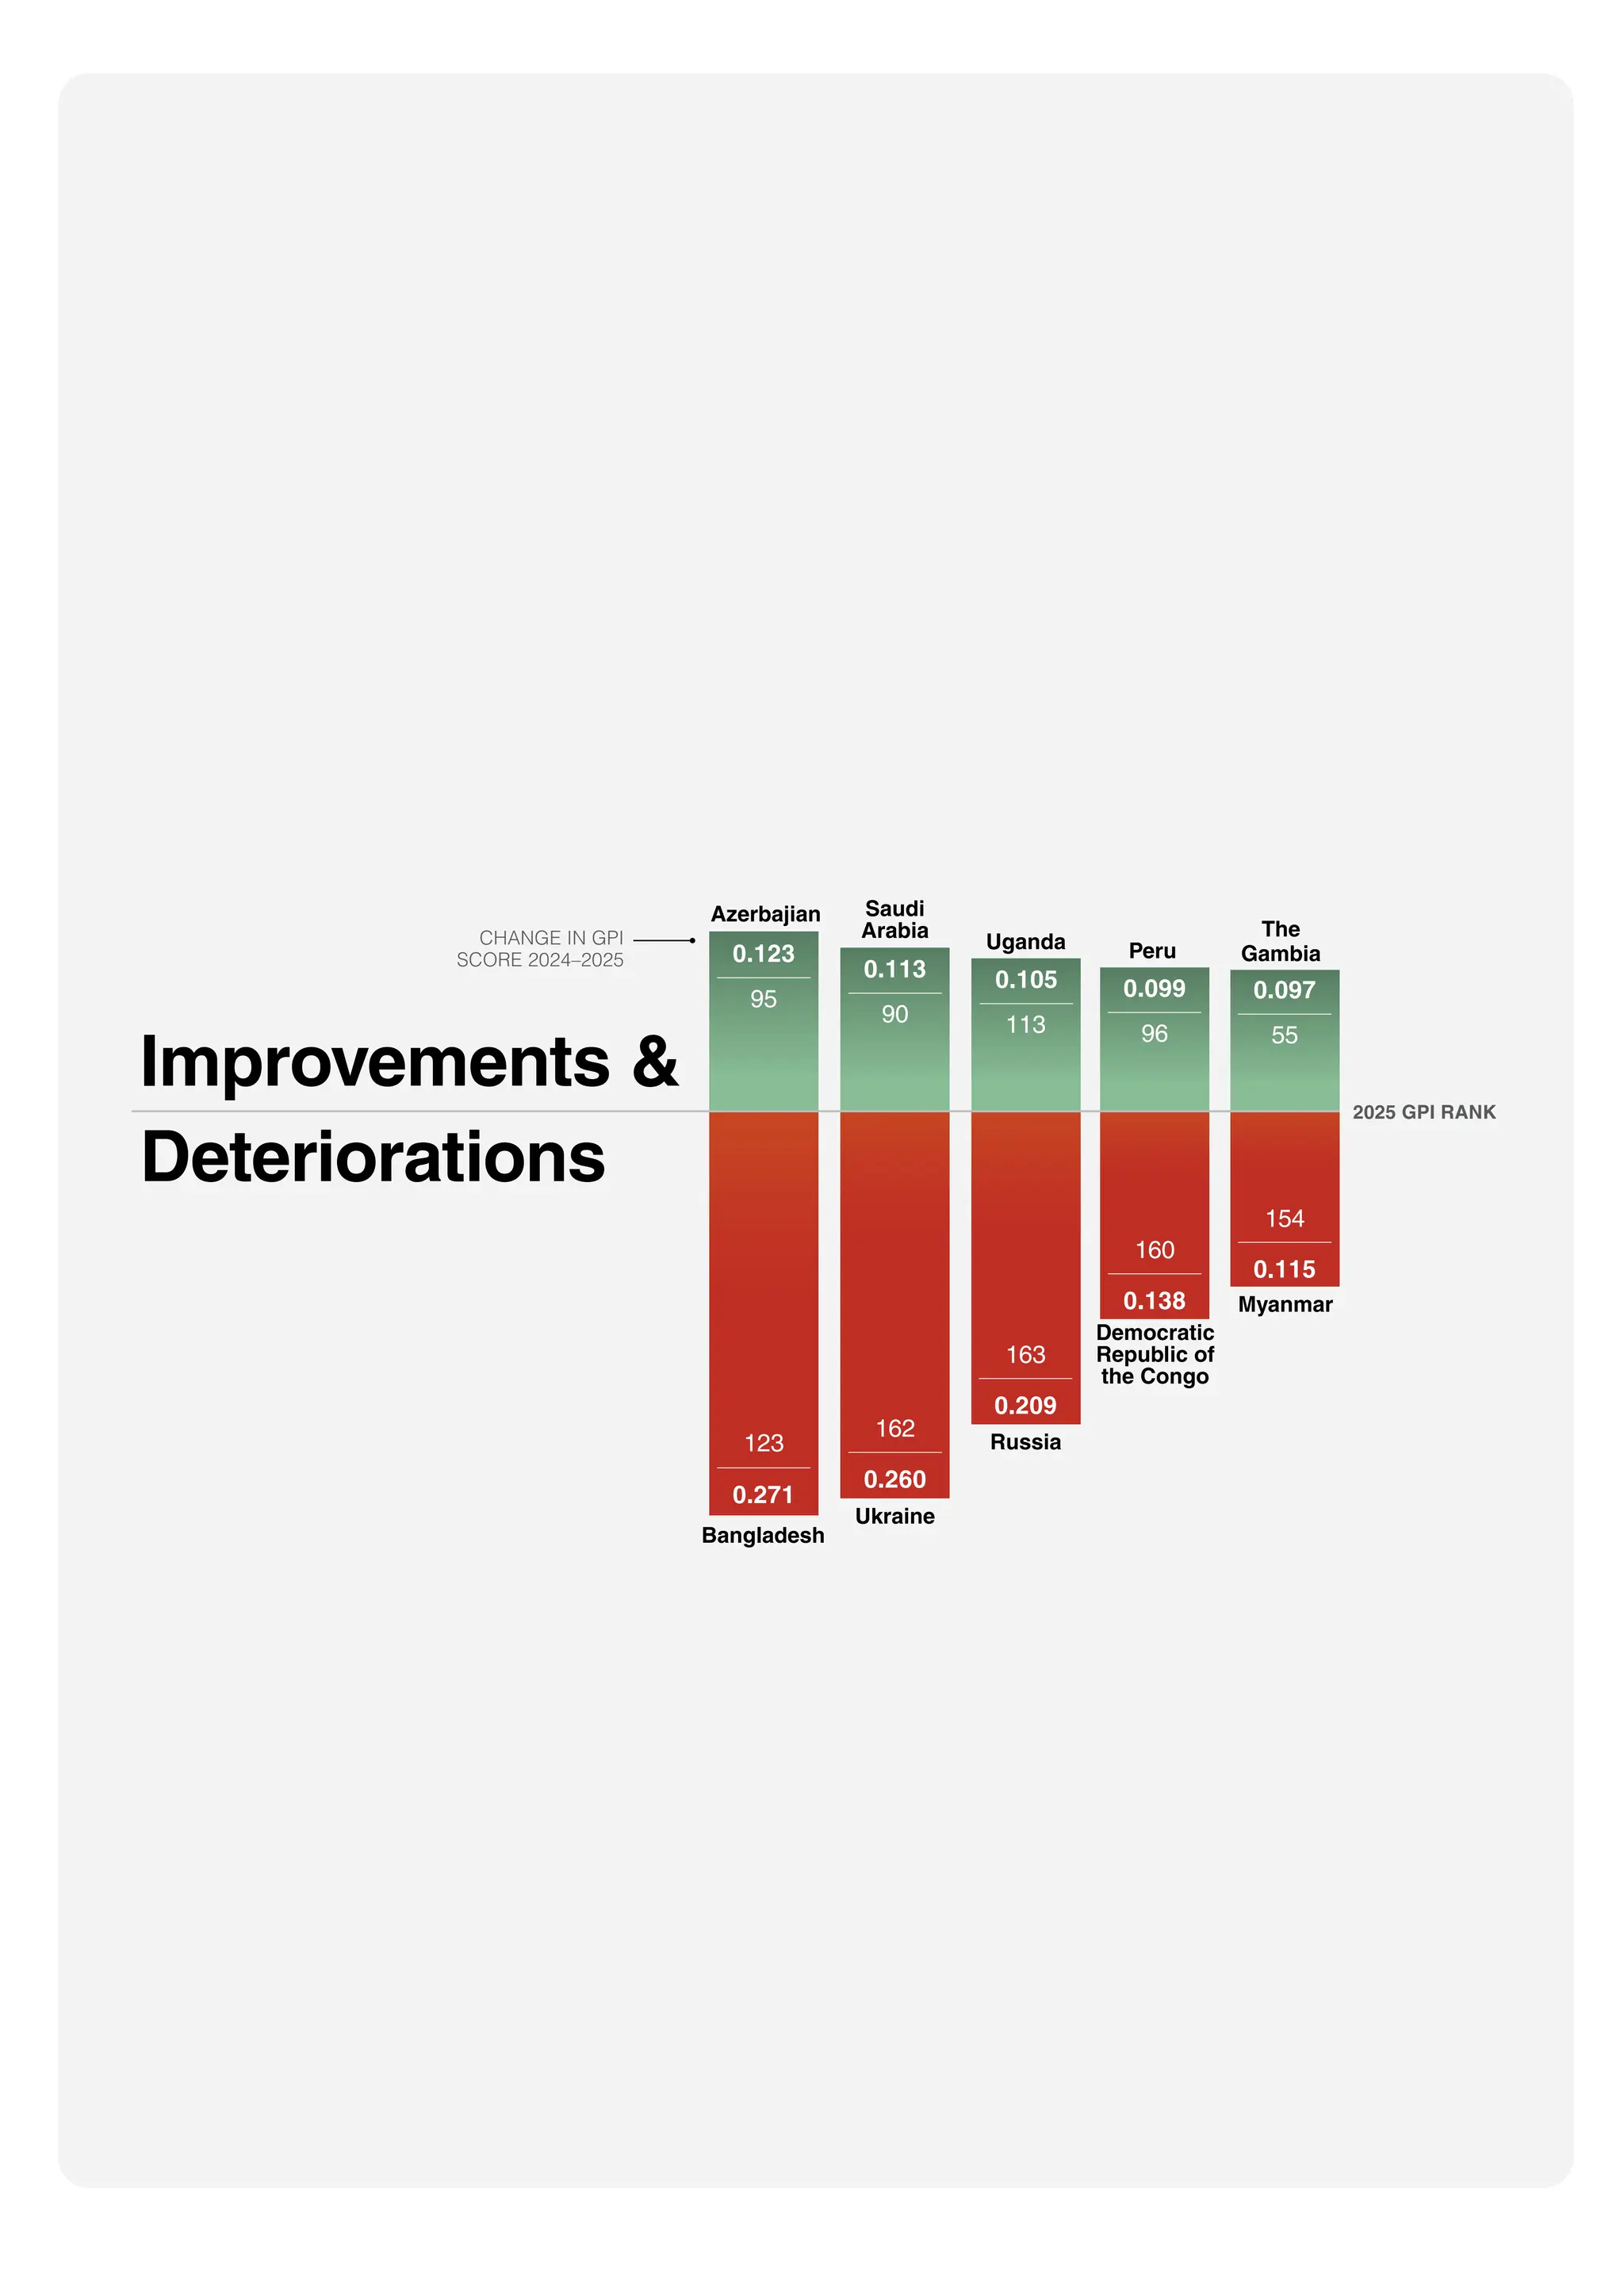
Improvements and Deteriorations 21
2025 Peace and Conflict Spotlight 26
GPI Trends 30
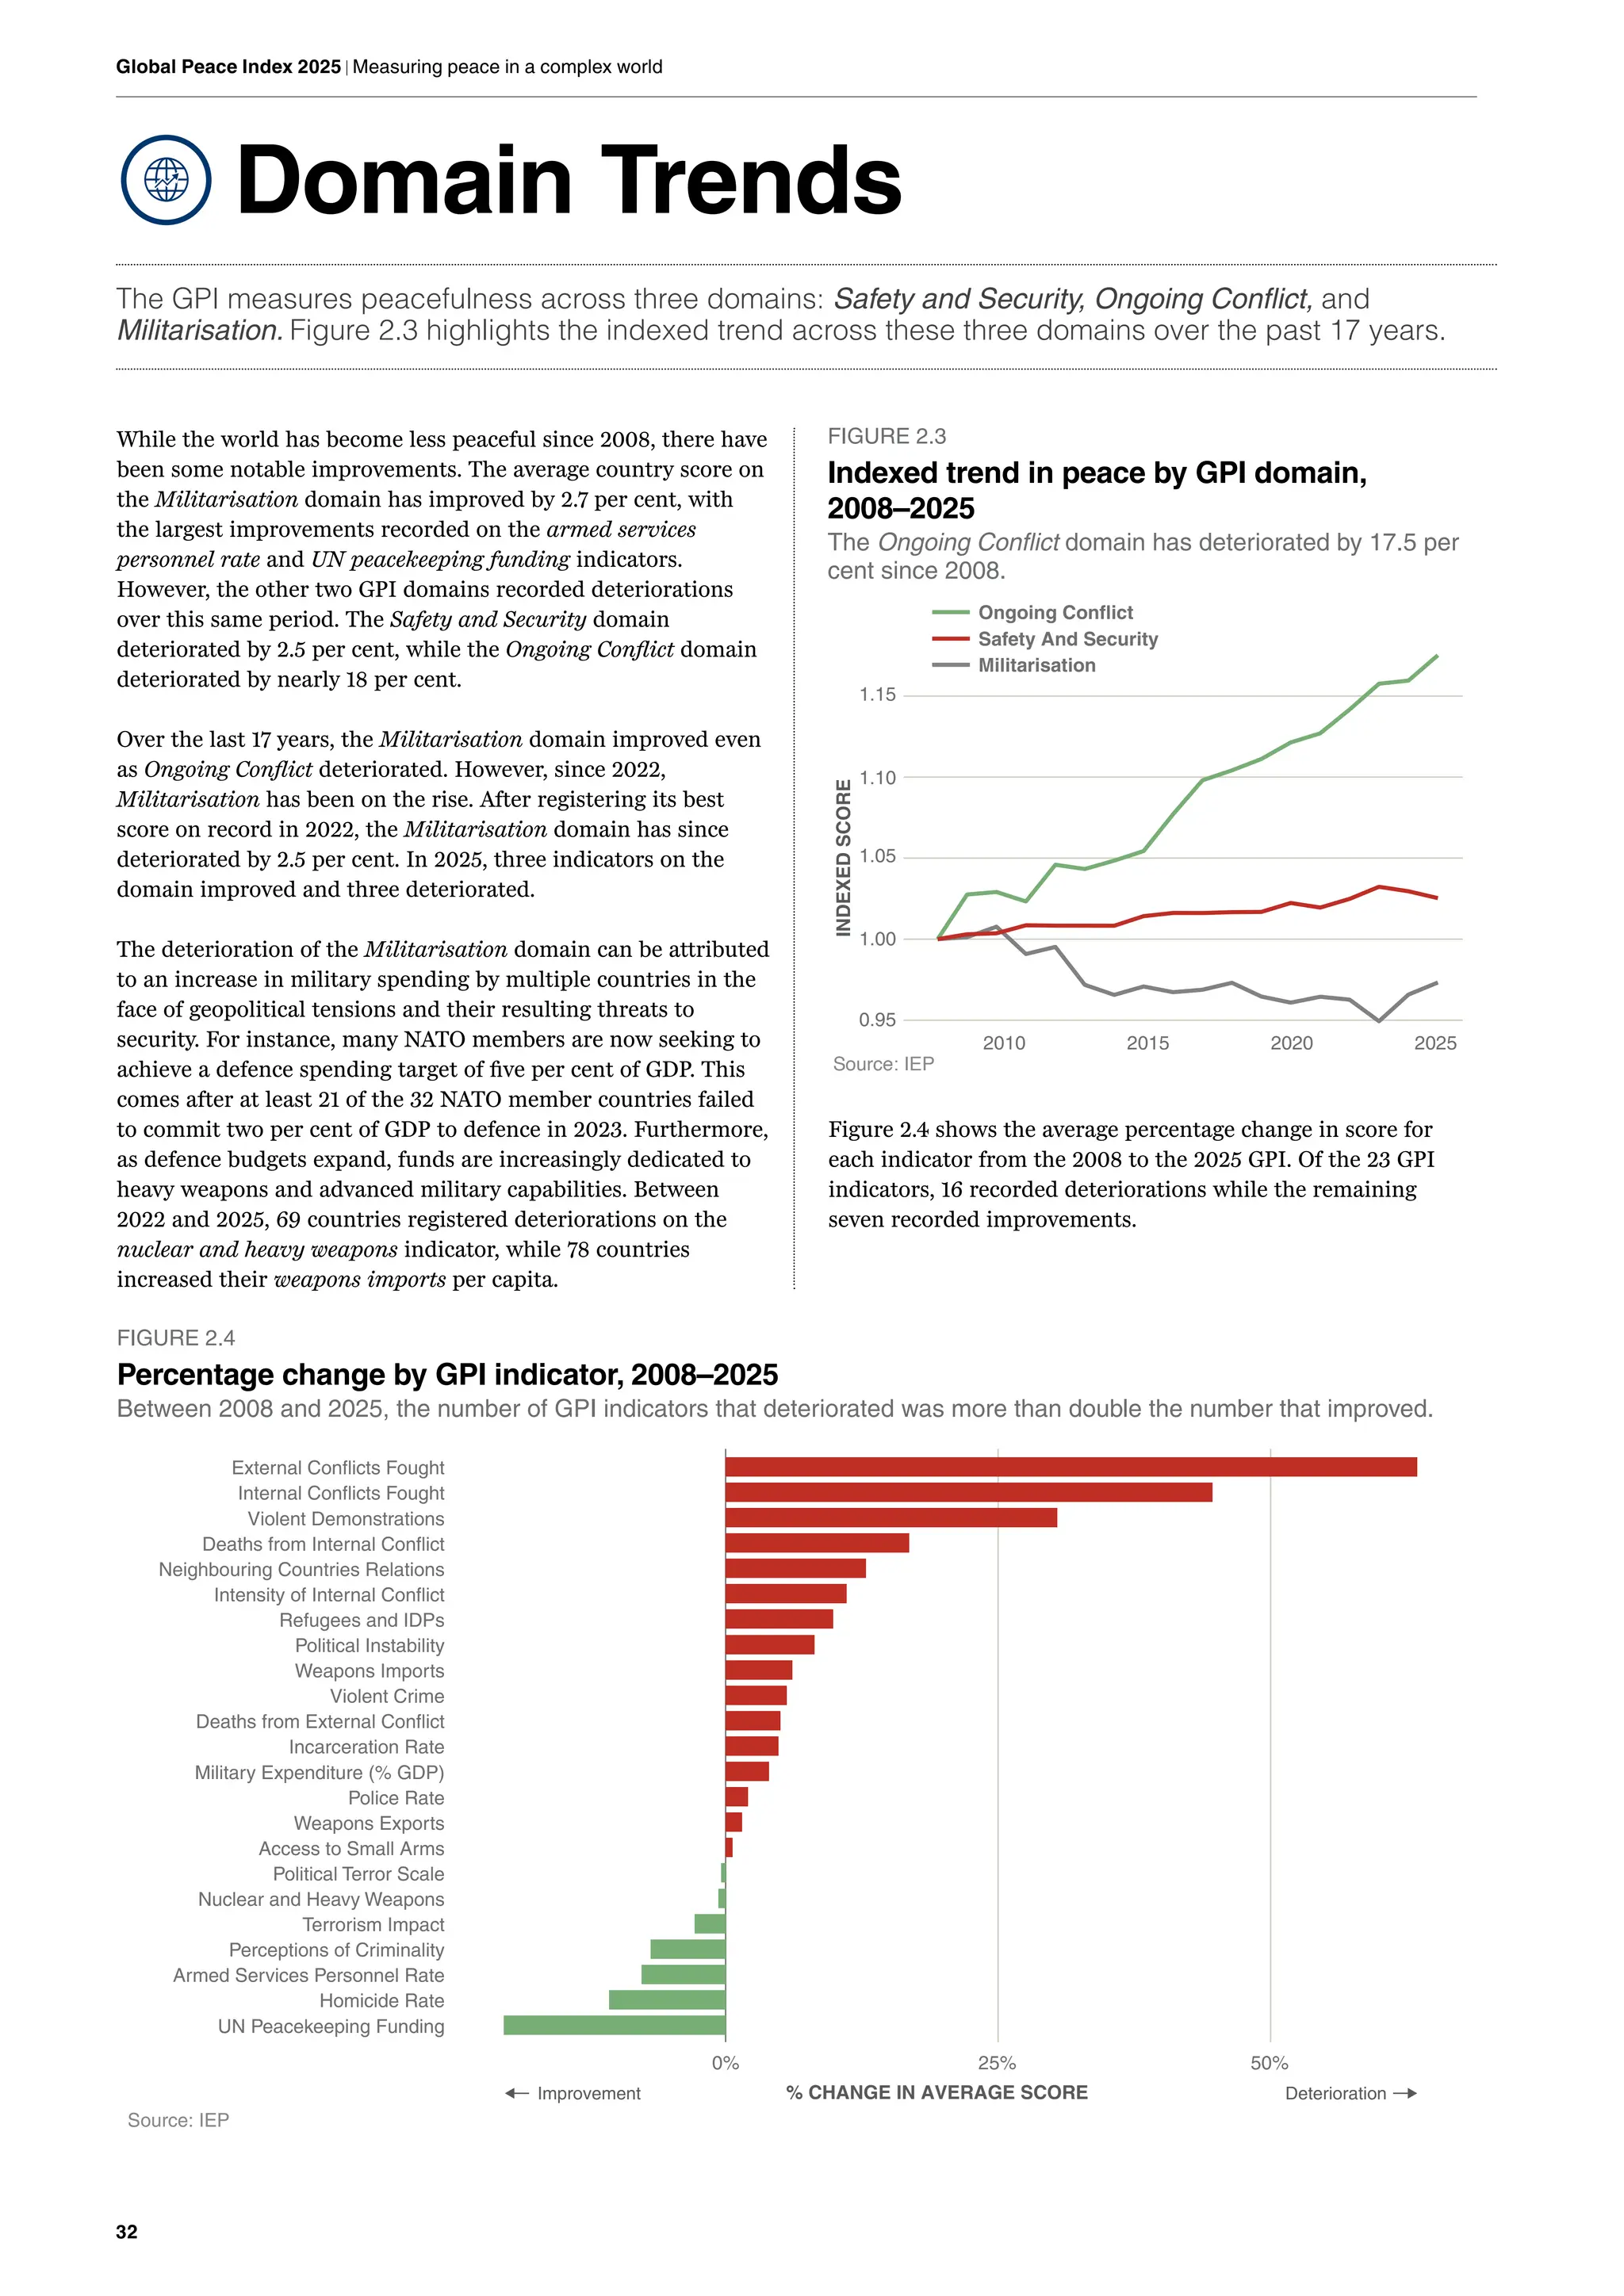
Domain Trends 32
Trends in Geopolitical Relations 37
The Economic Value of Peace 44
Global Economic Conditions and Rising Conflict Risk 52
Methodology at a Glance 58
Overview 62
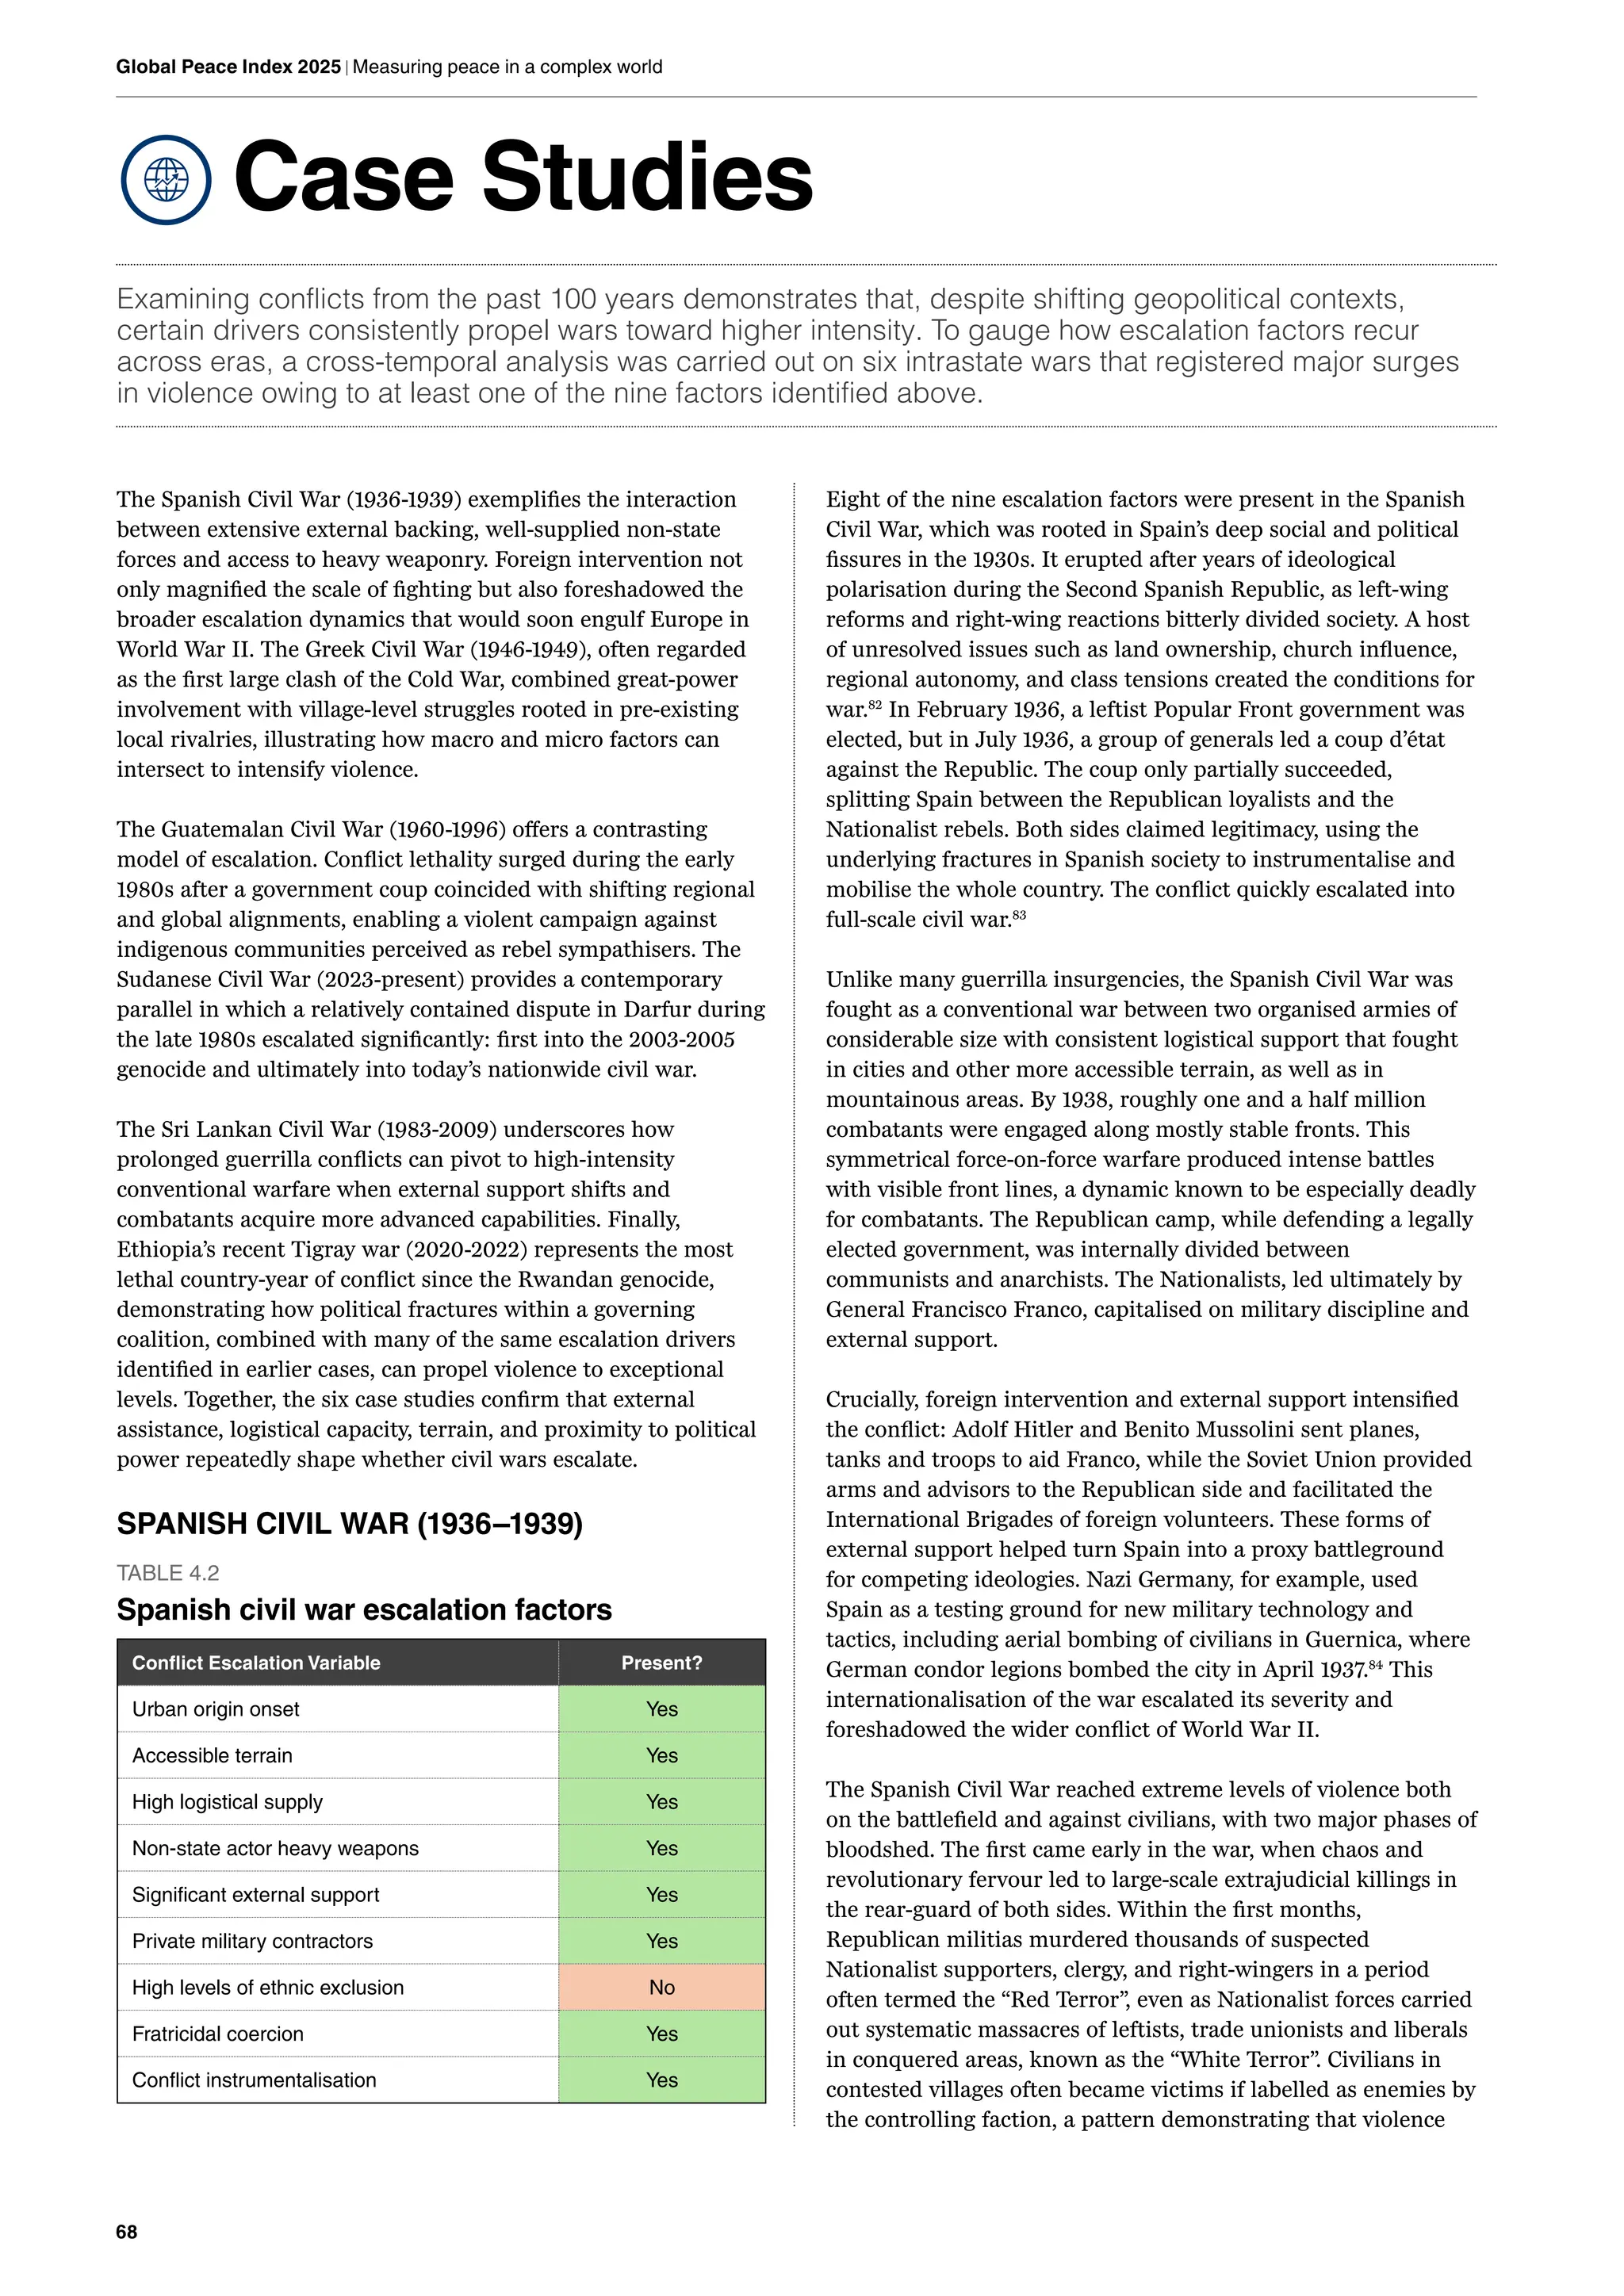
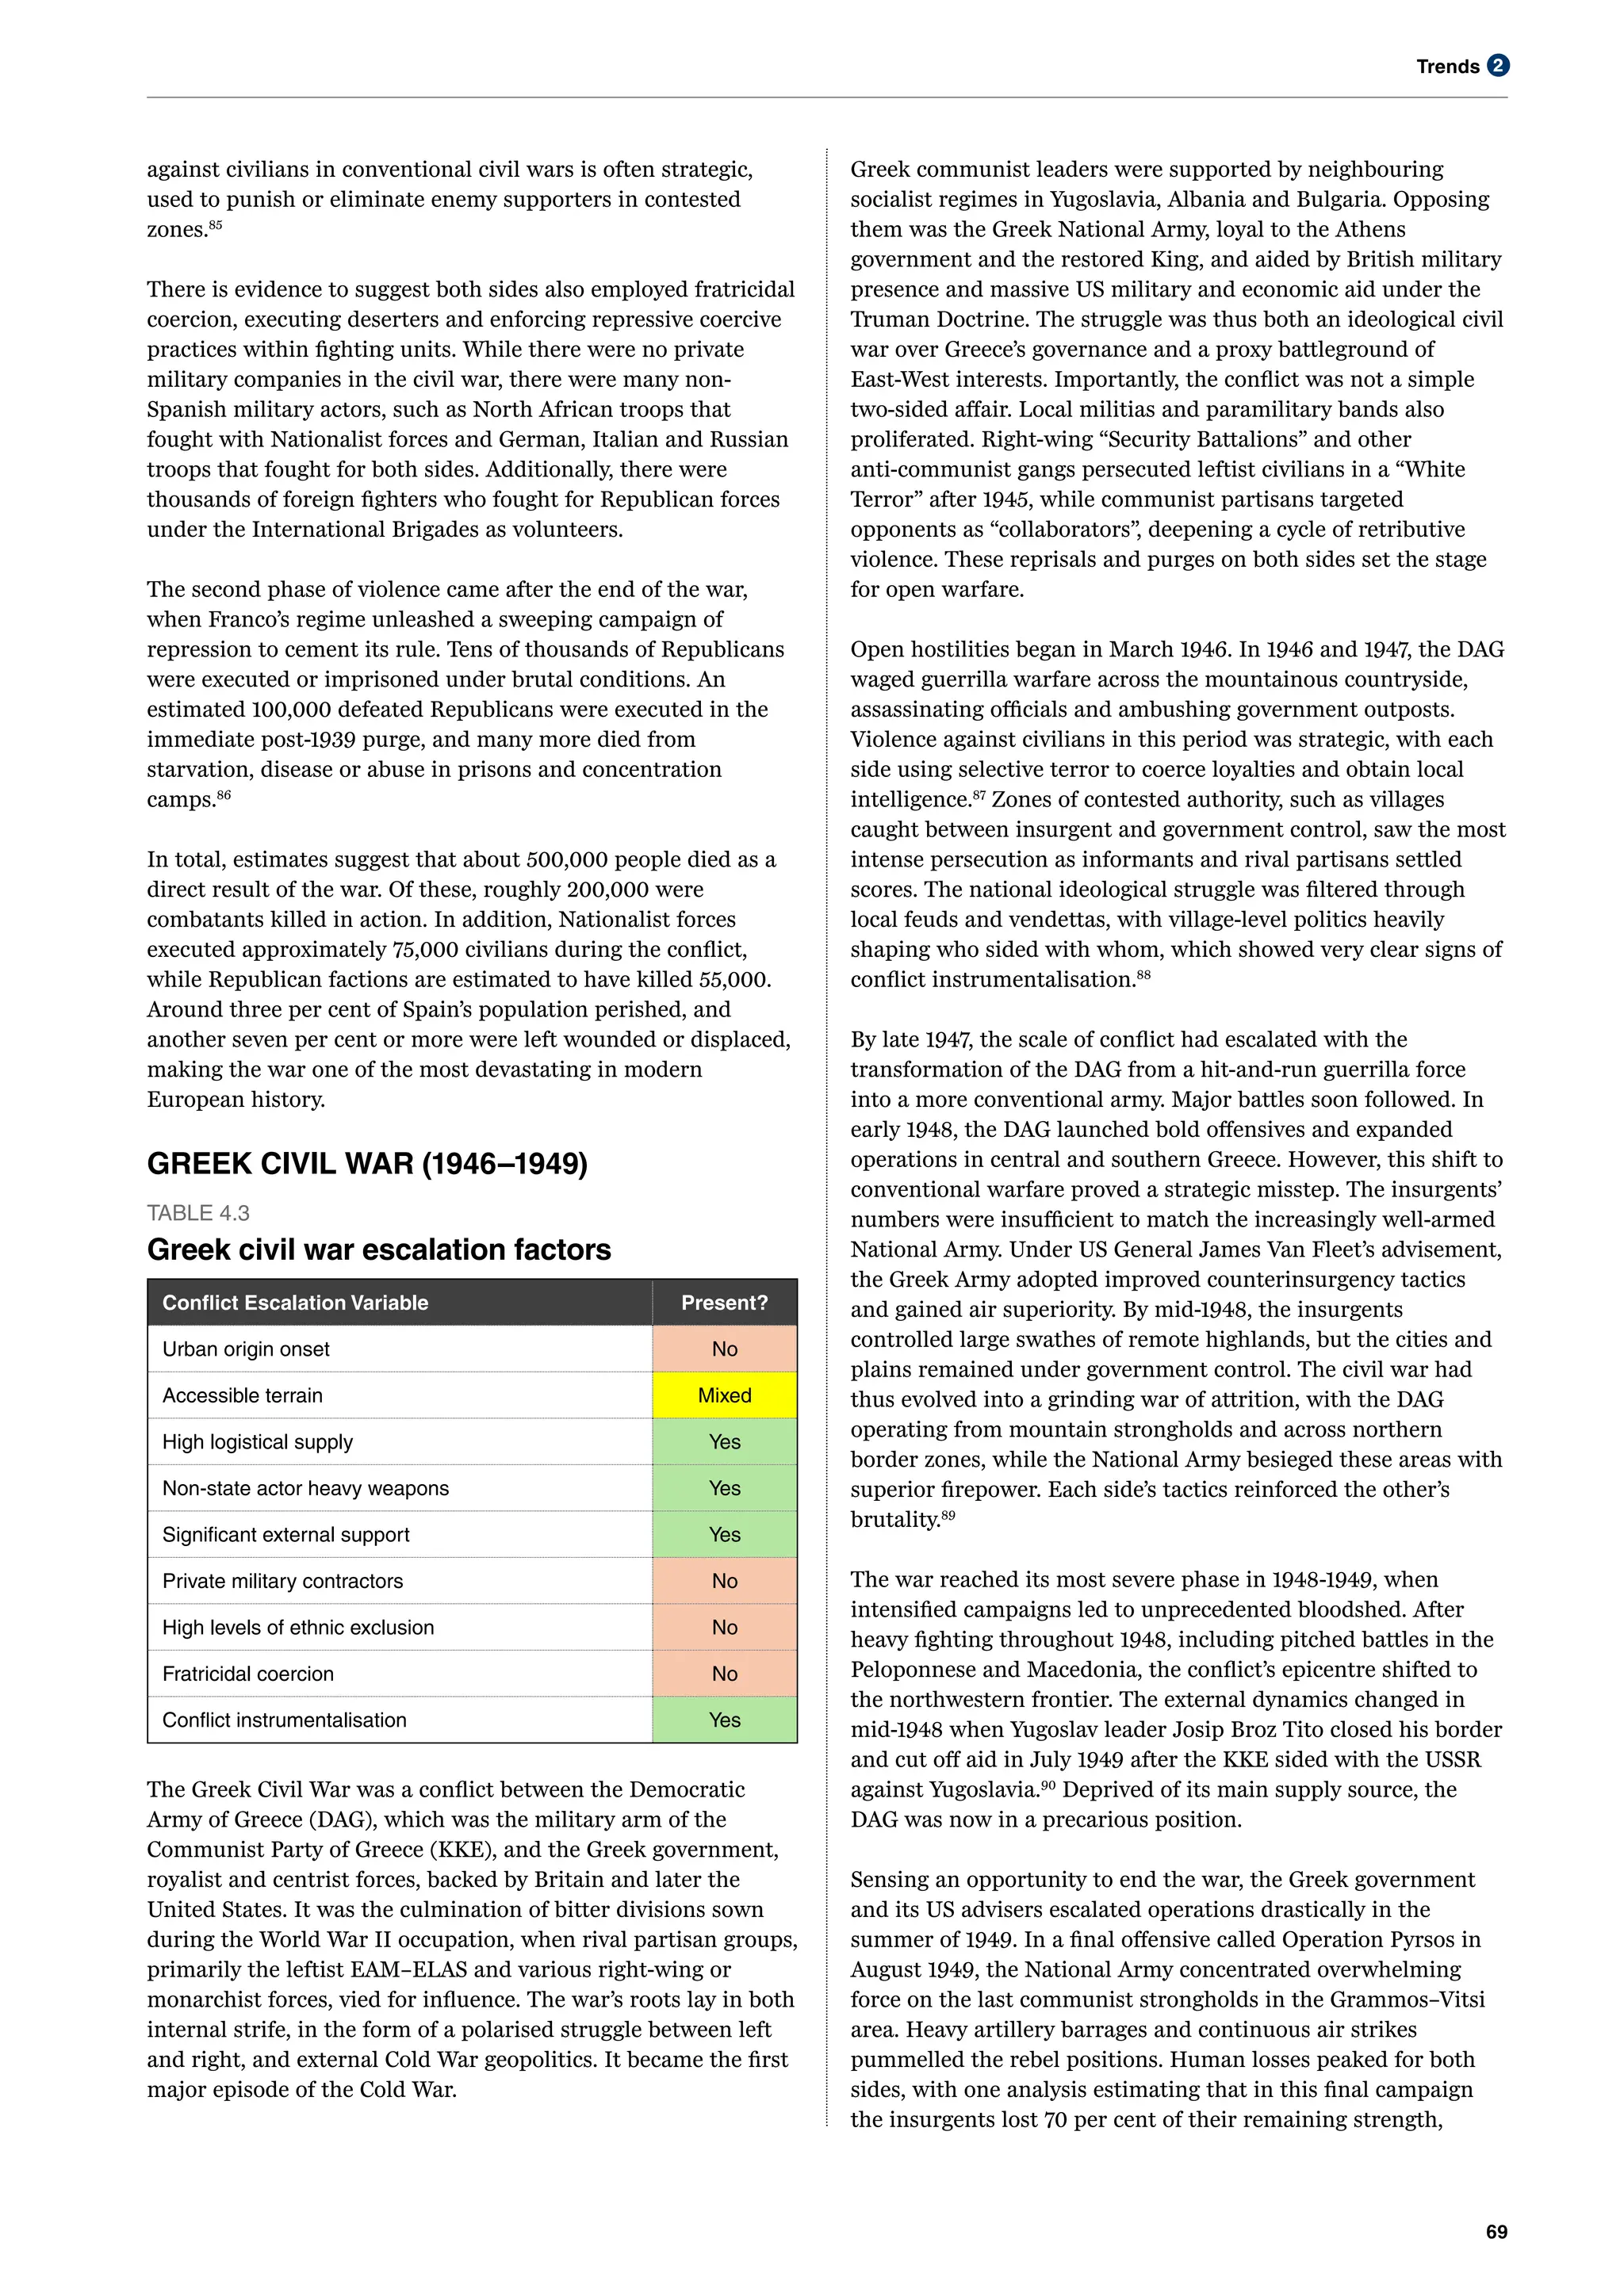
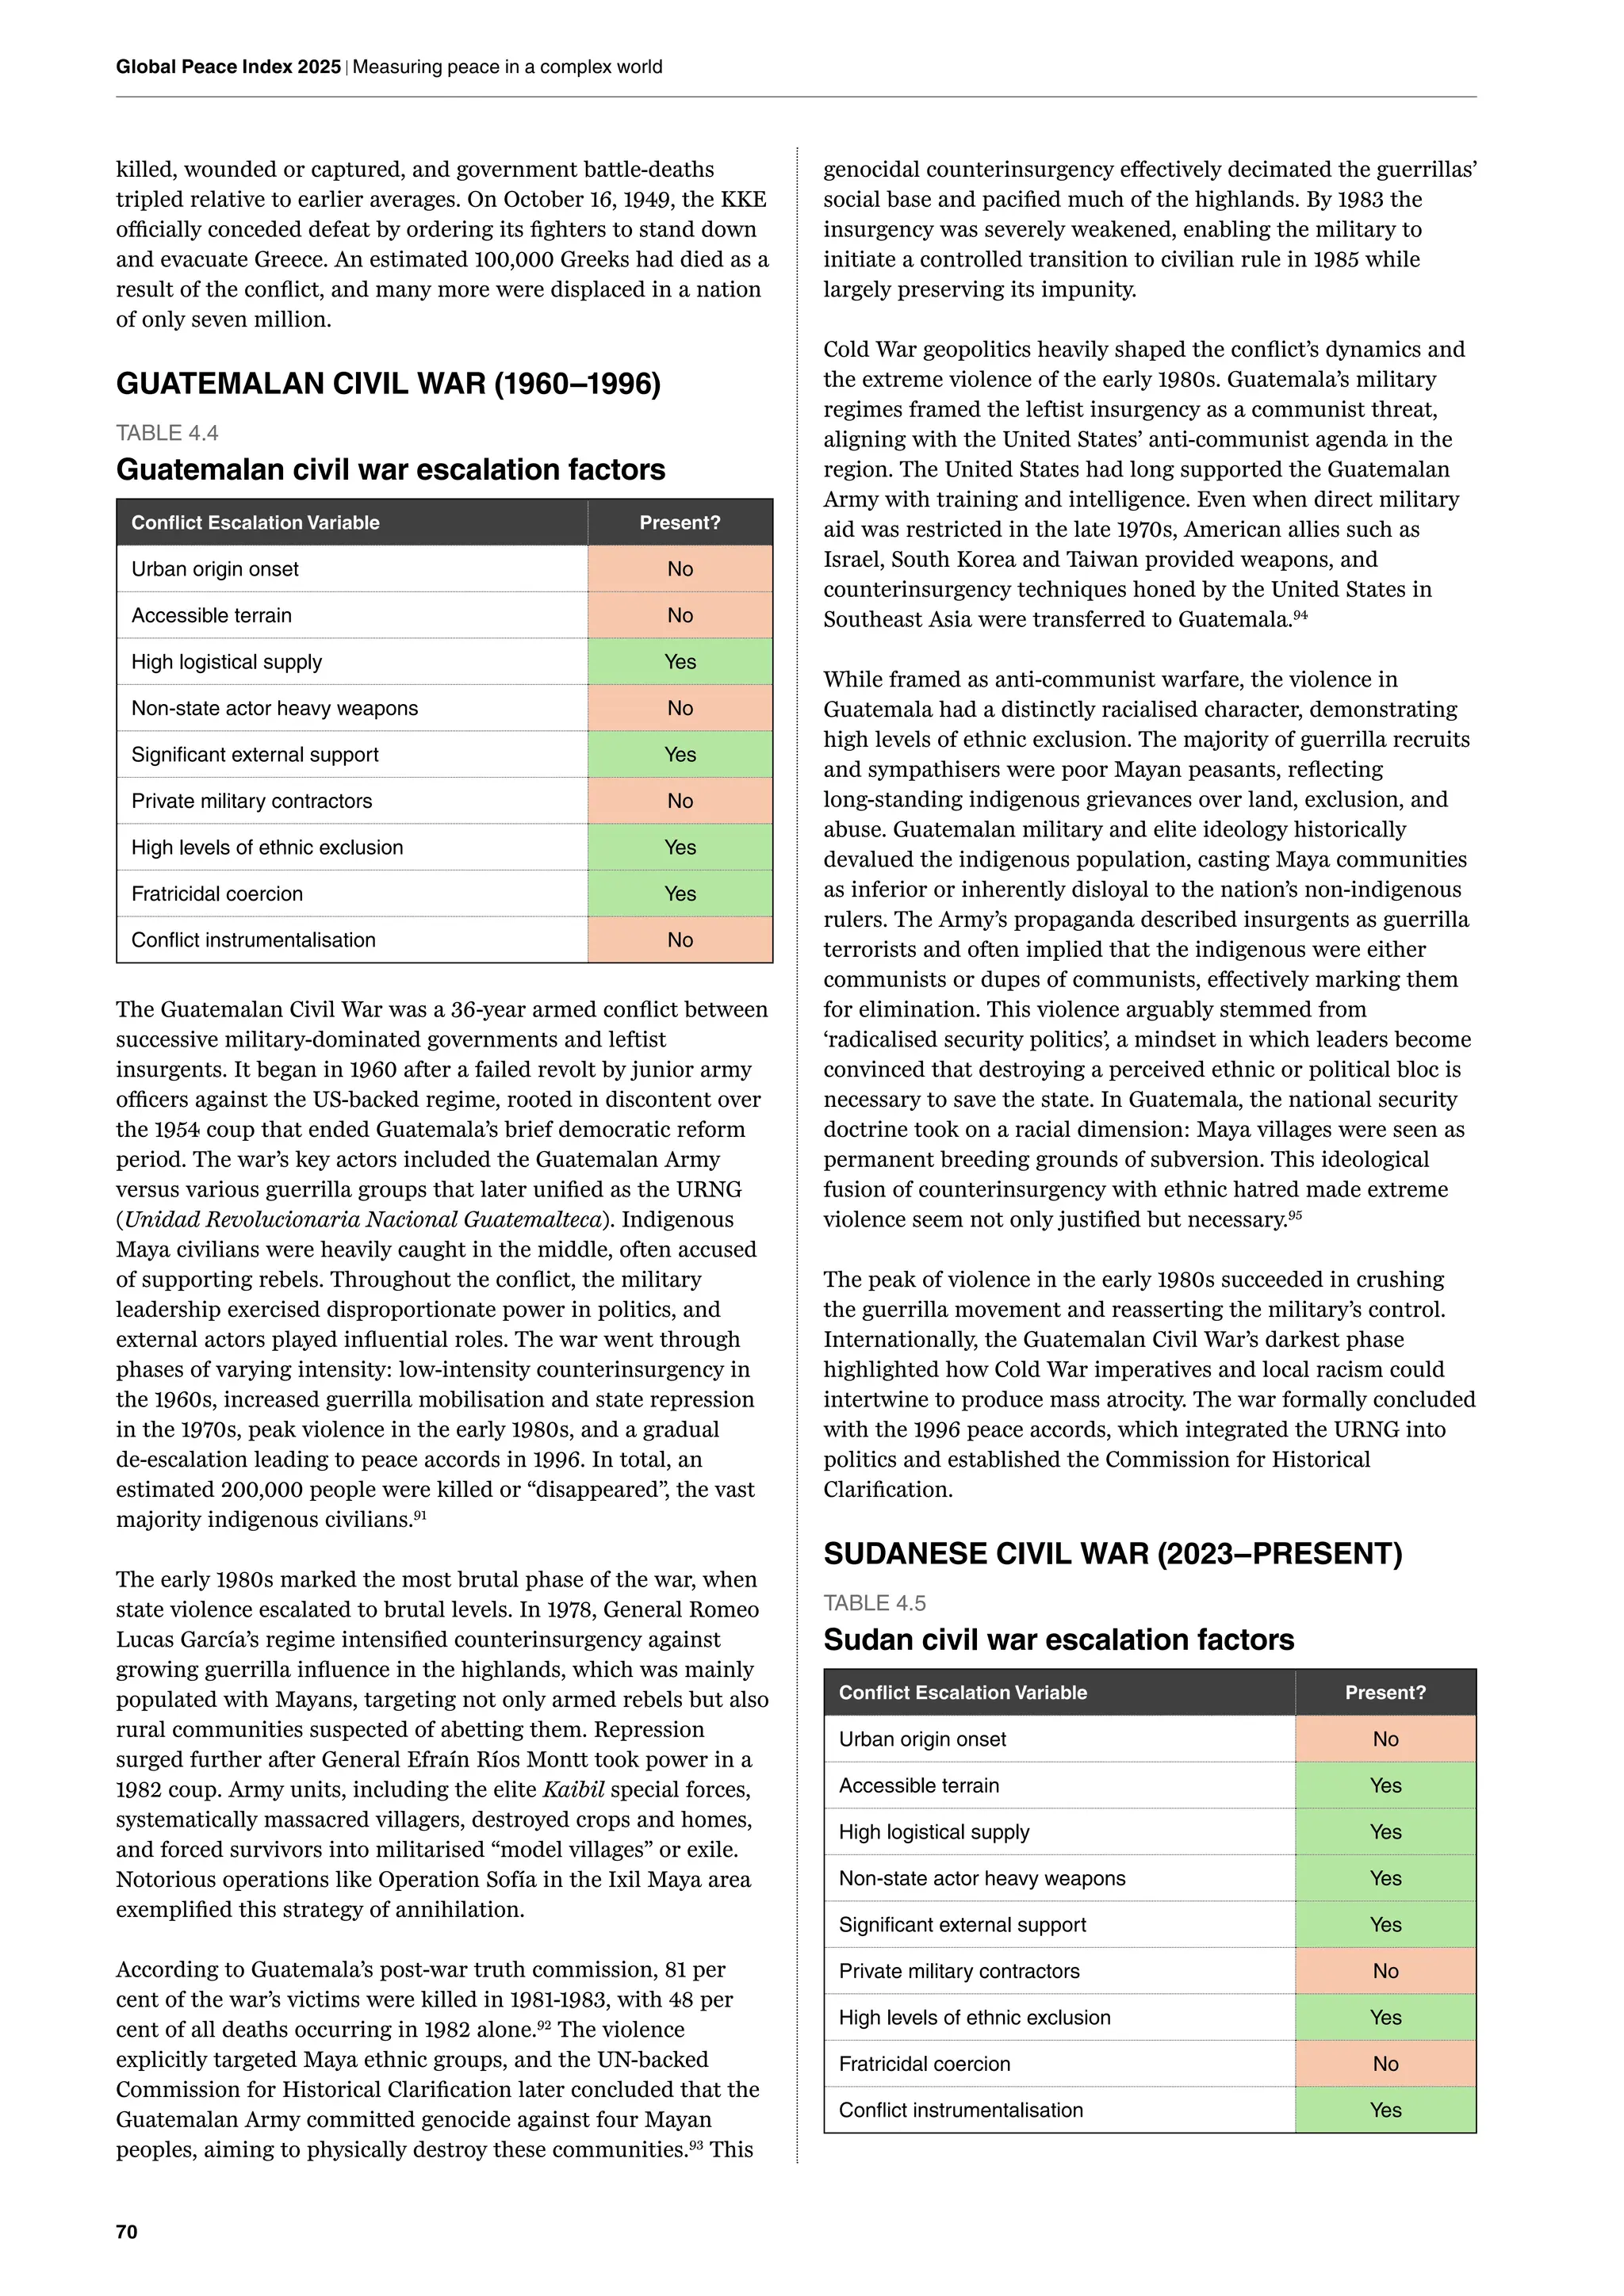
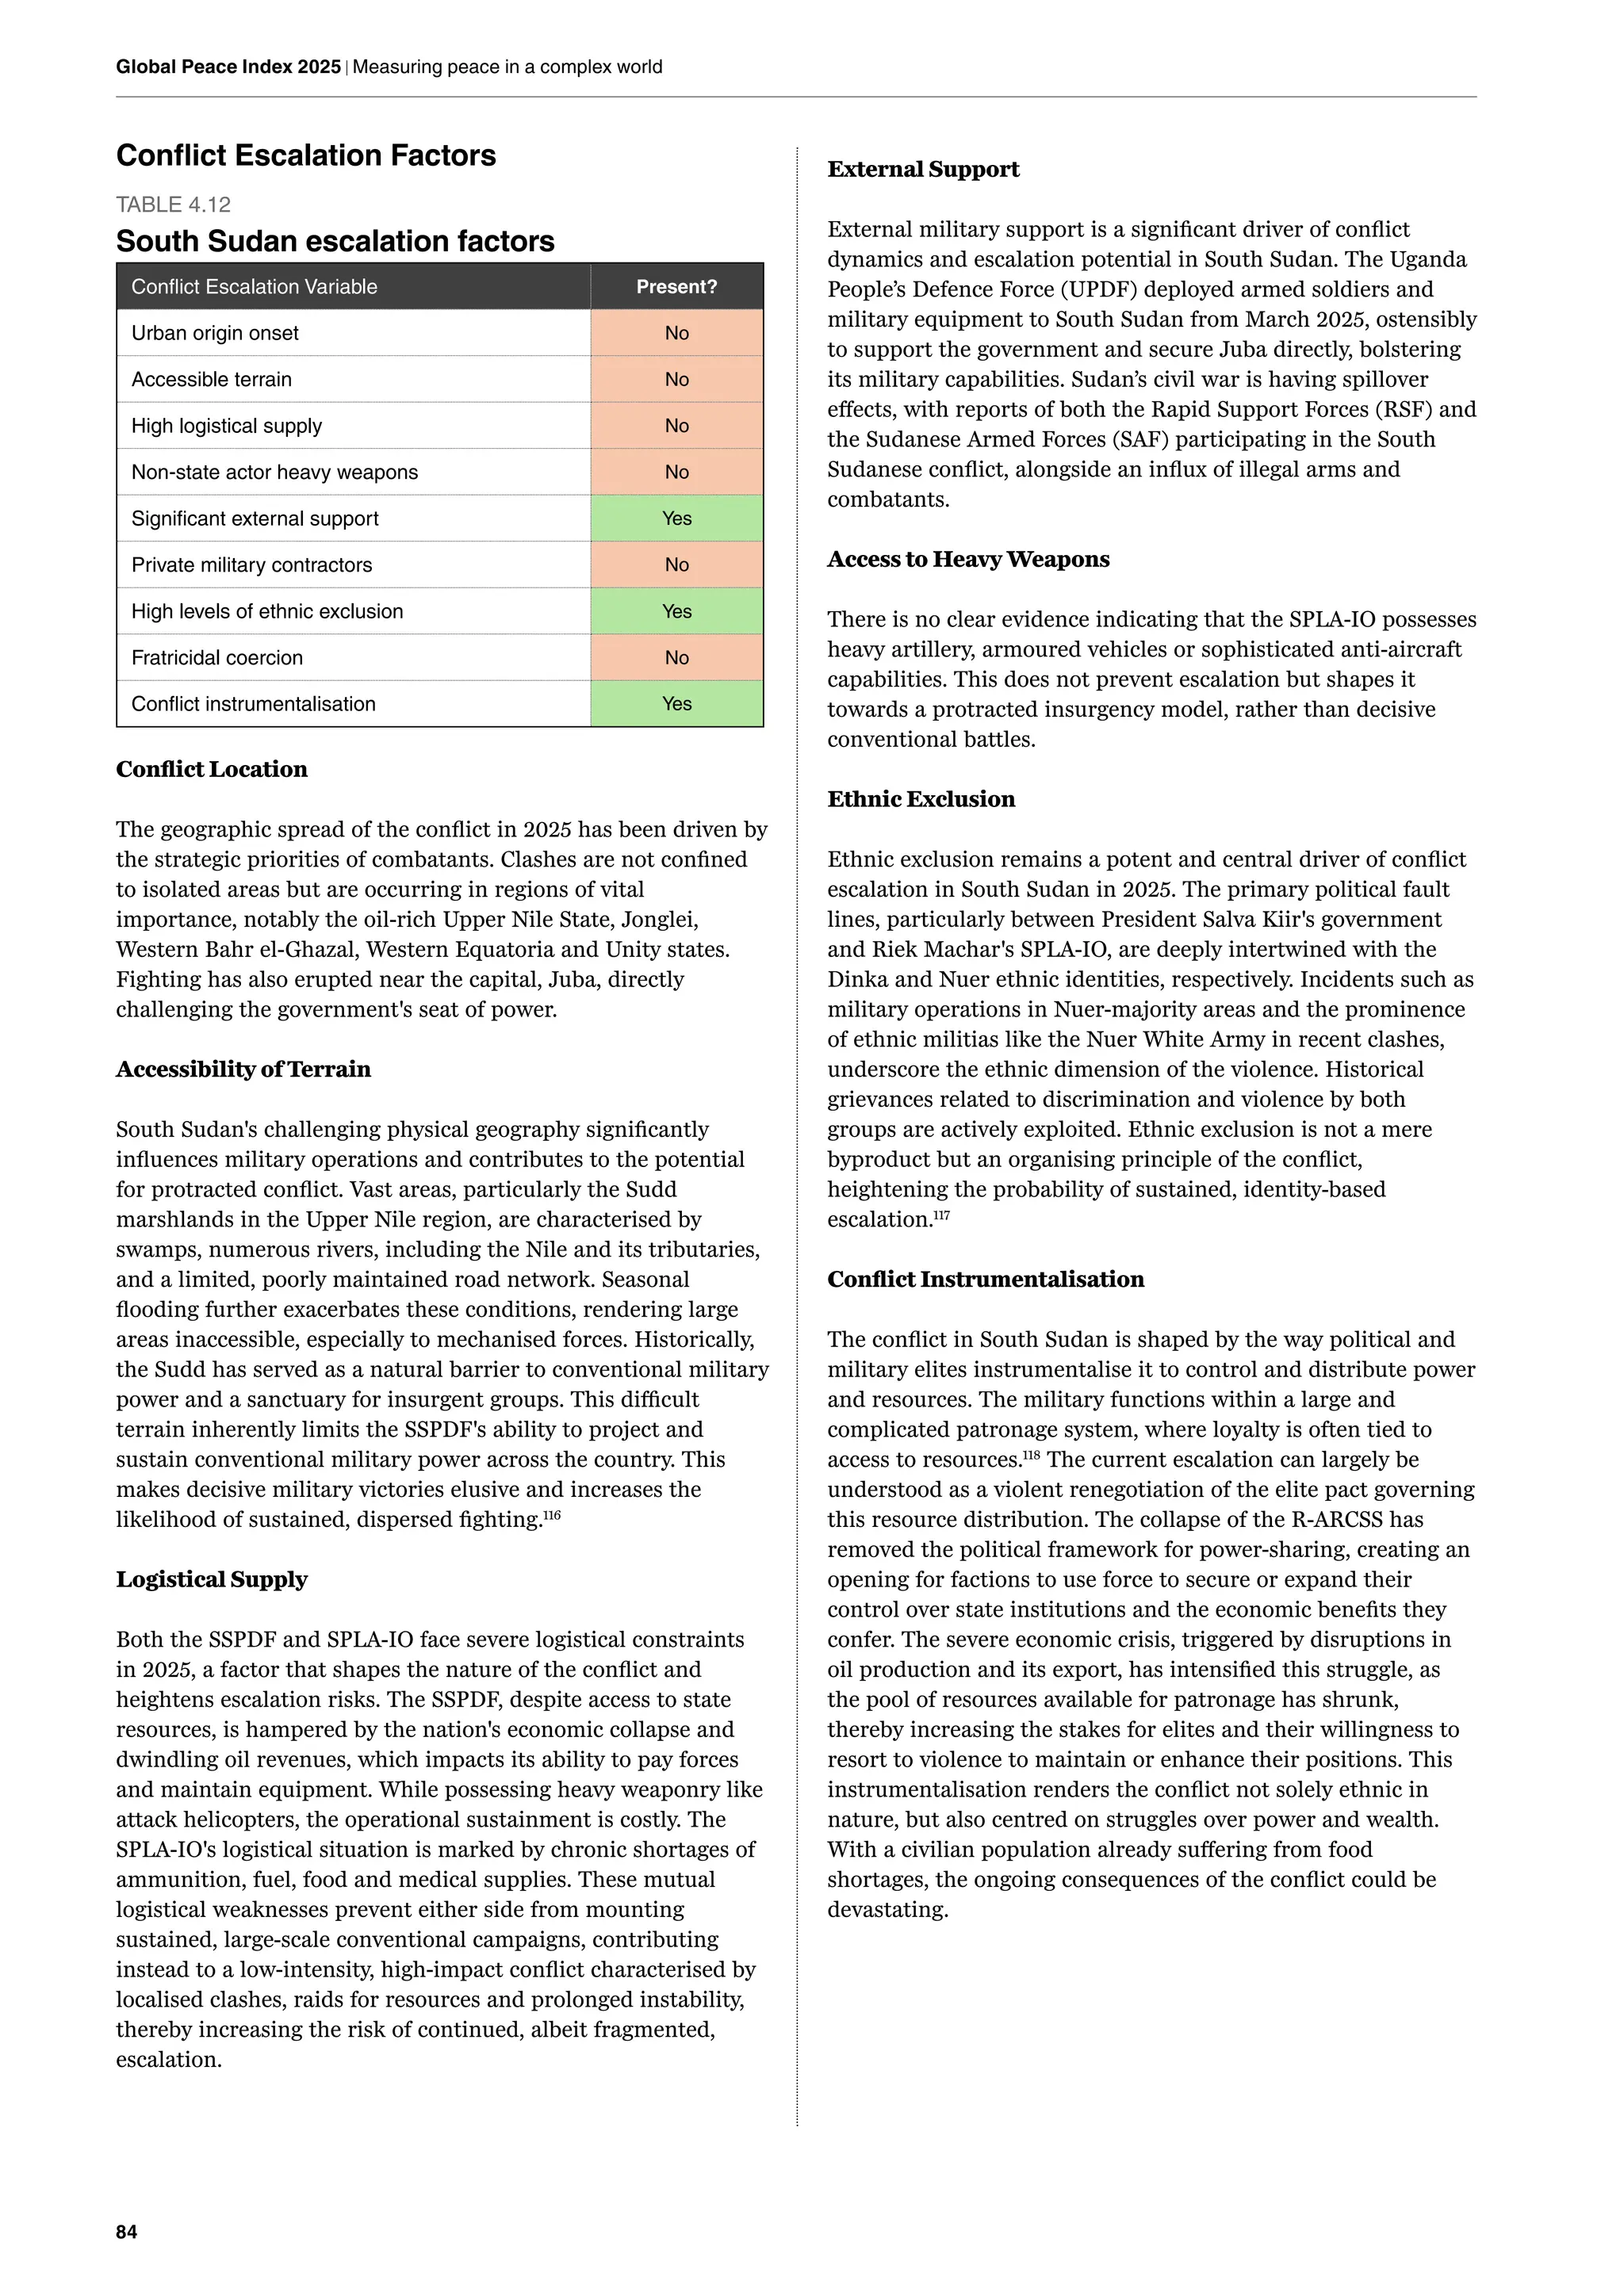
Conflict Escalation Factors 65
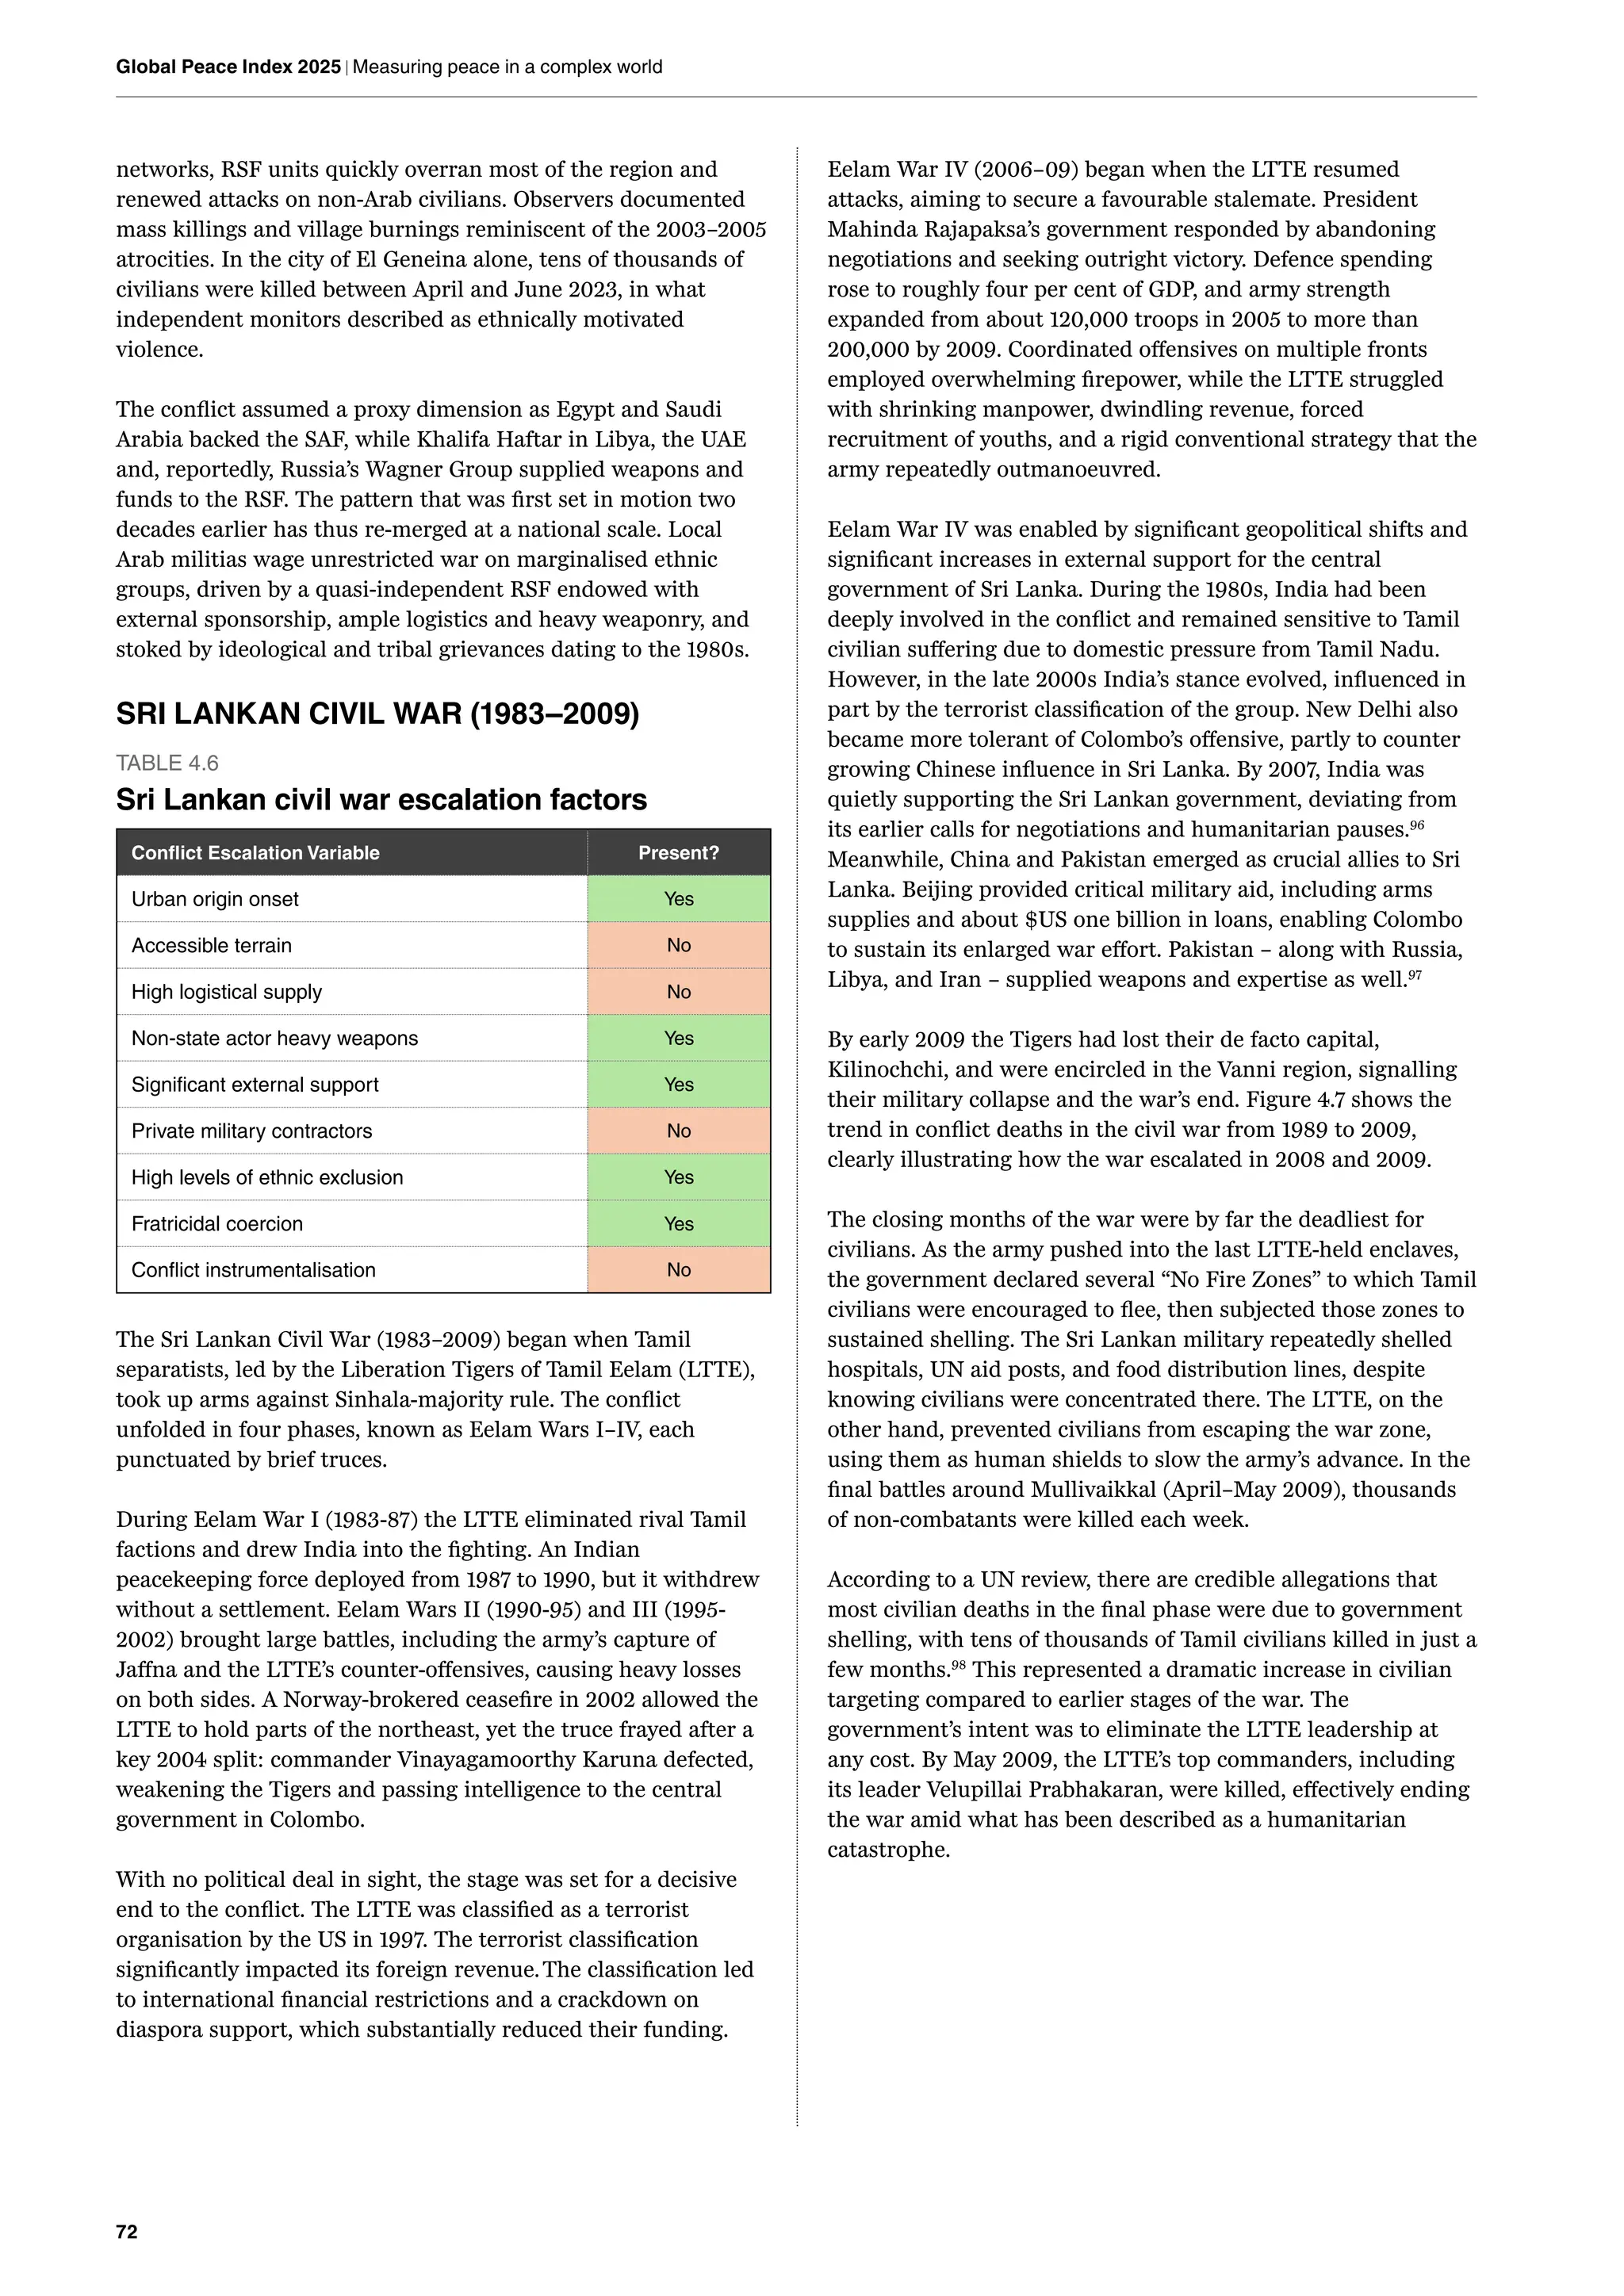
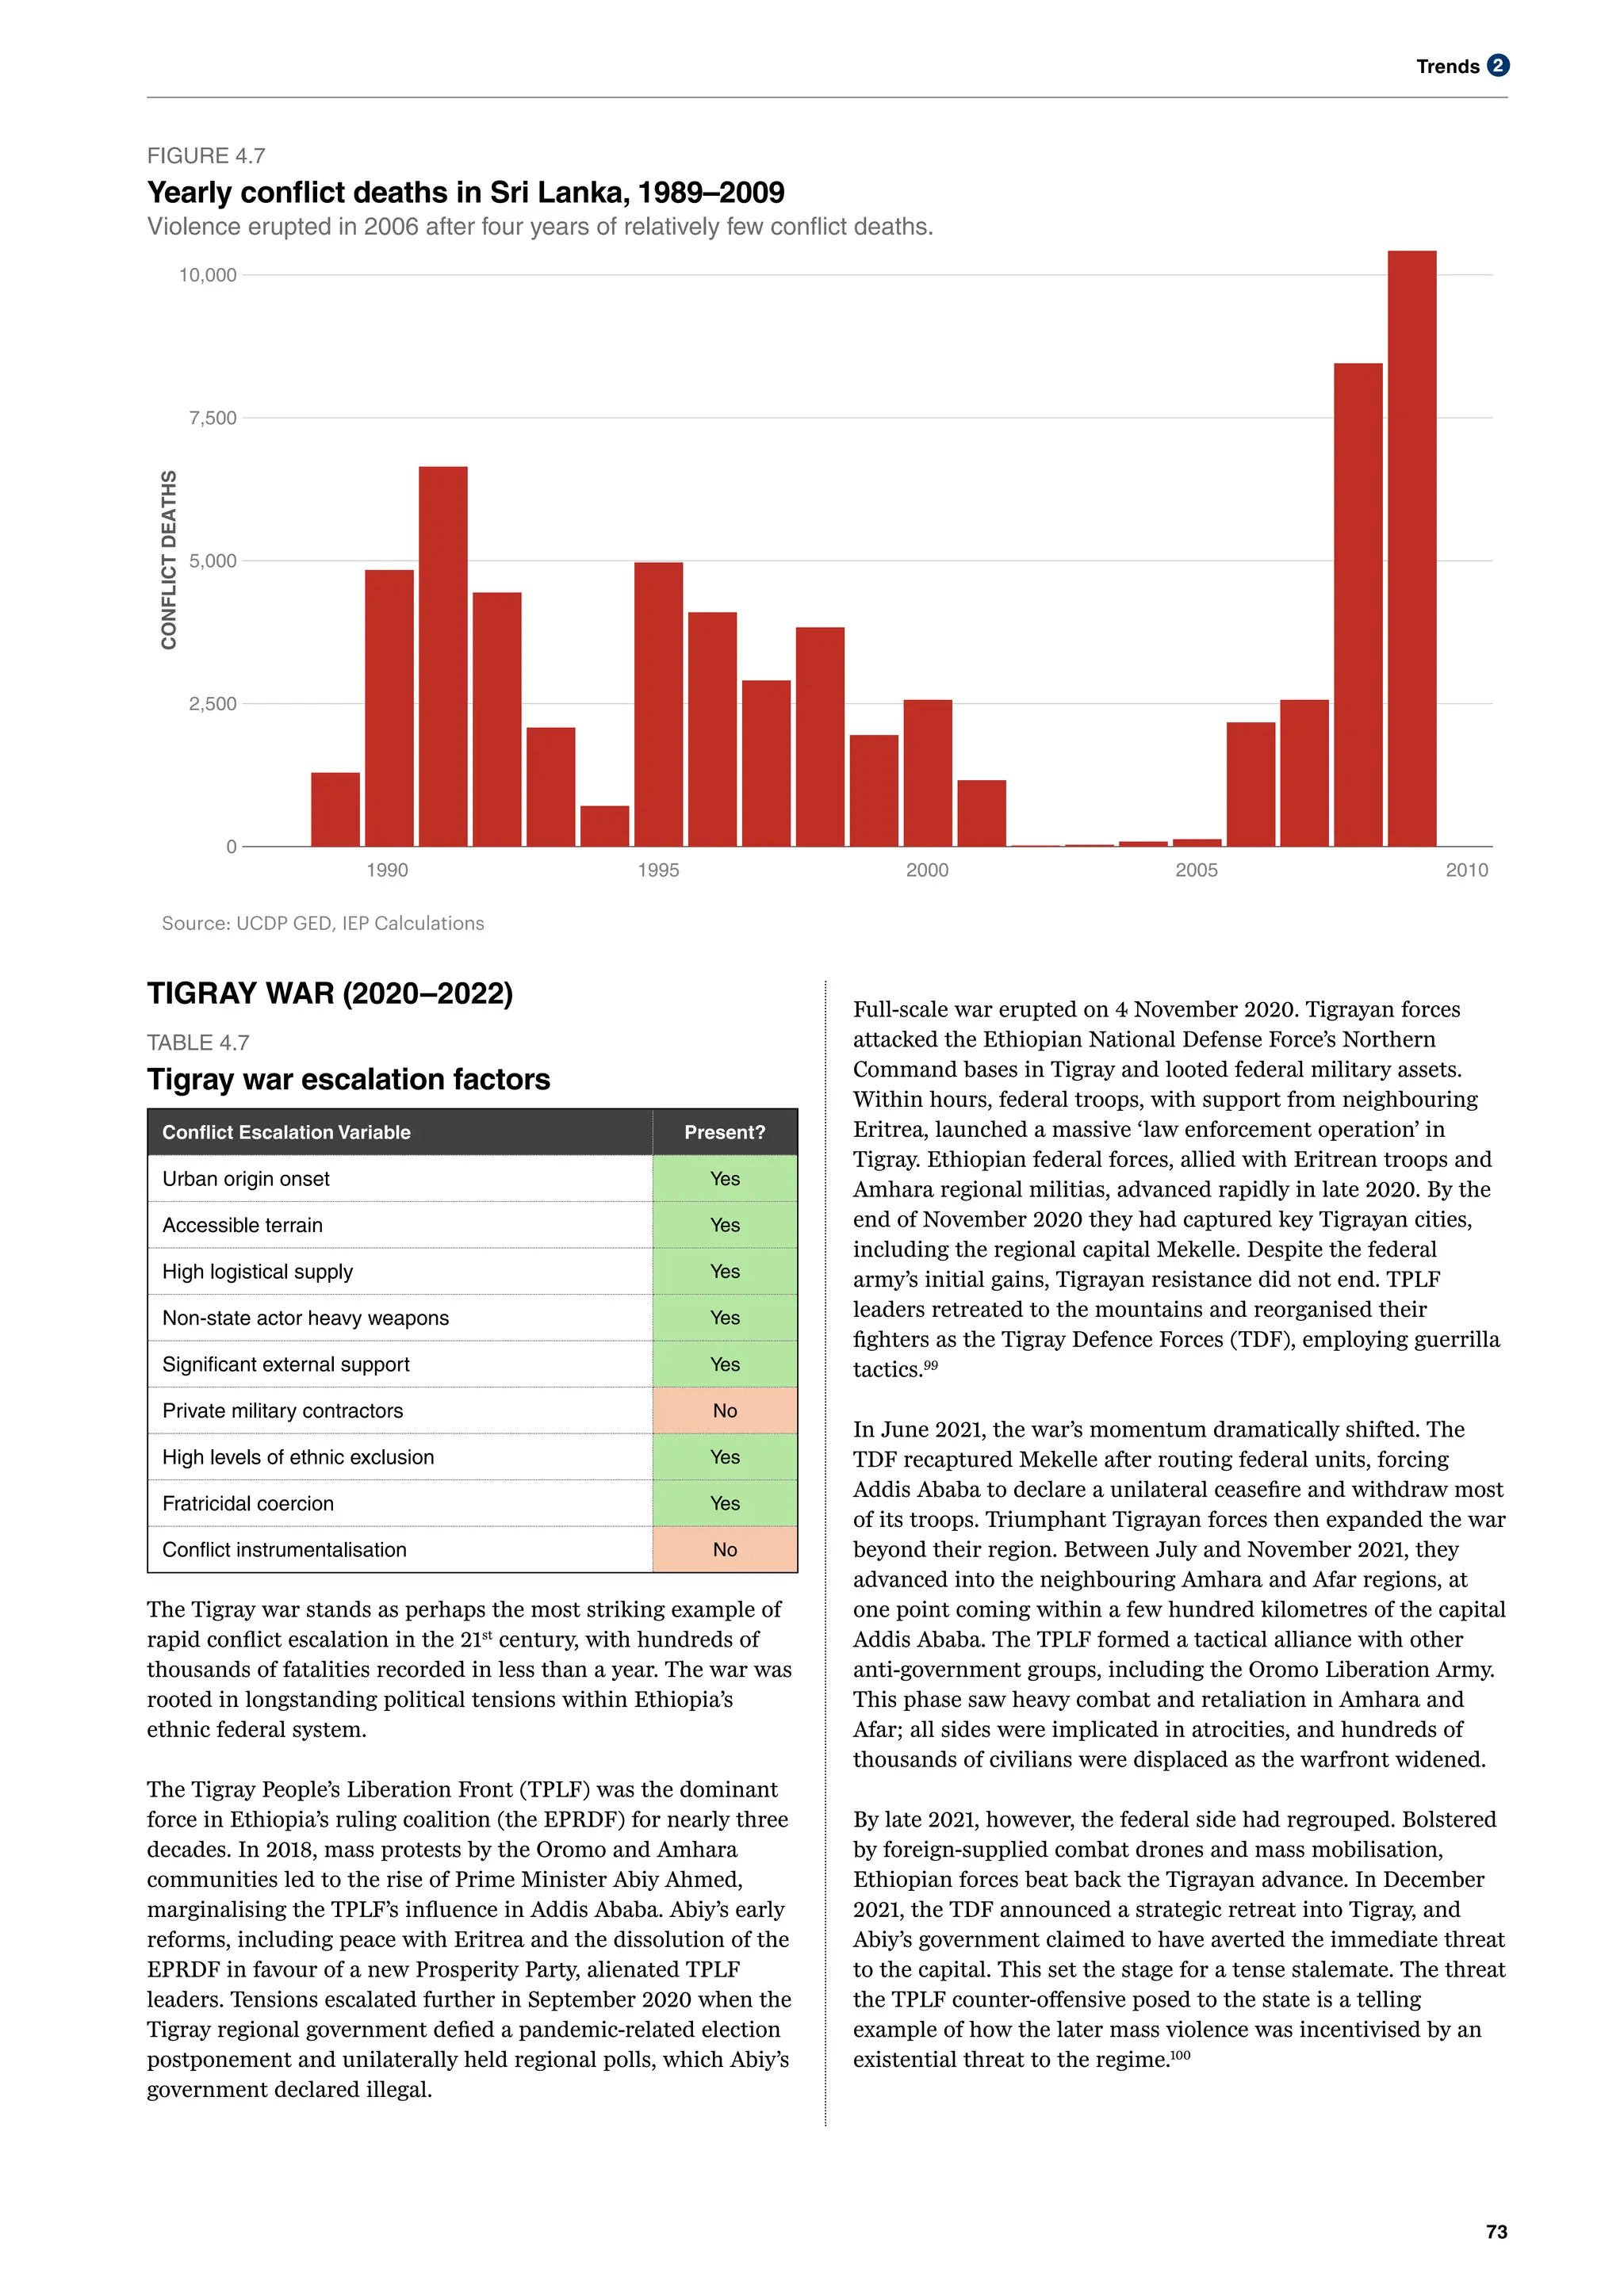
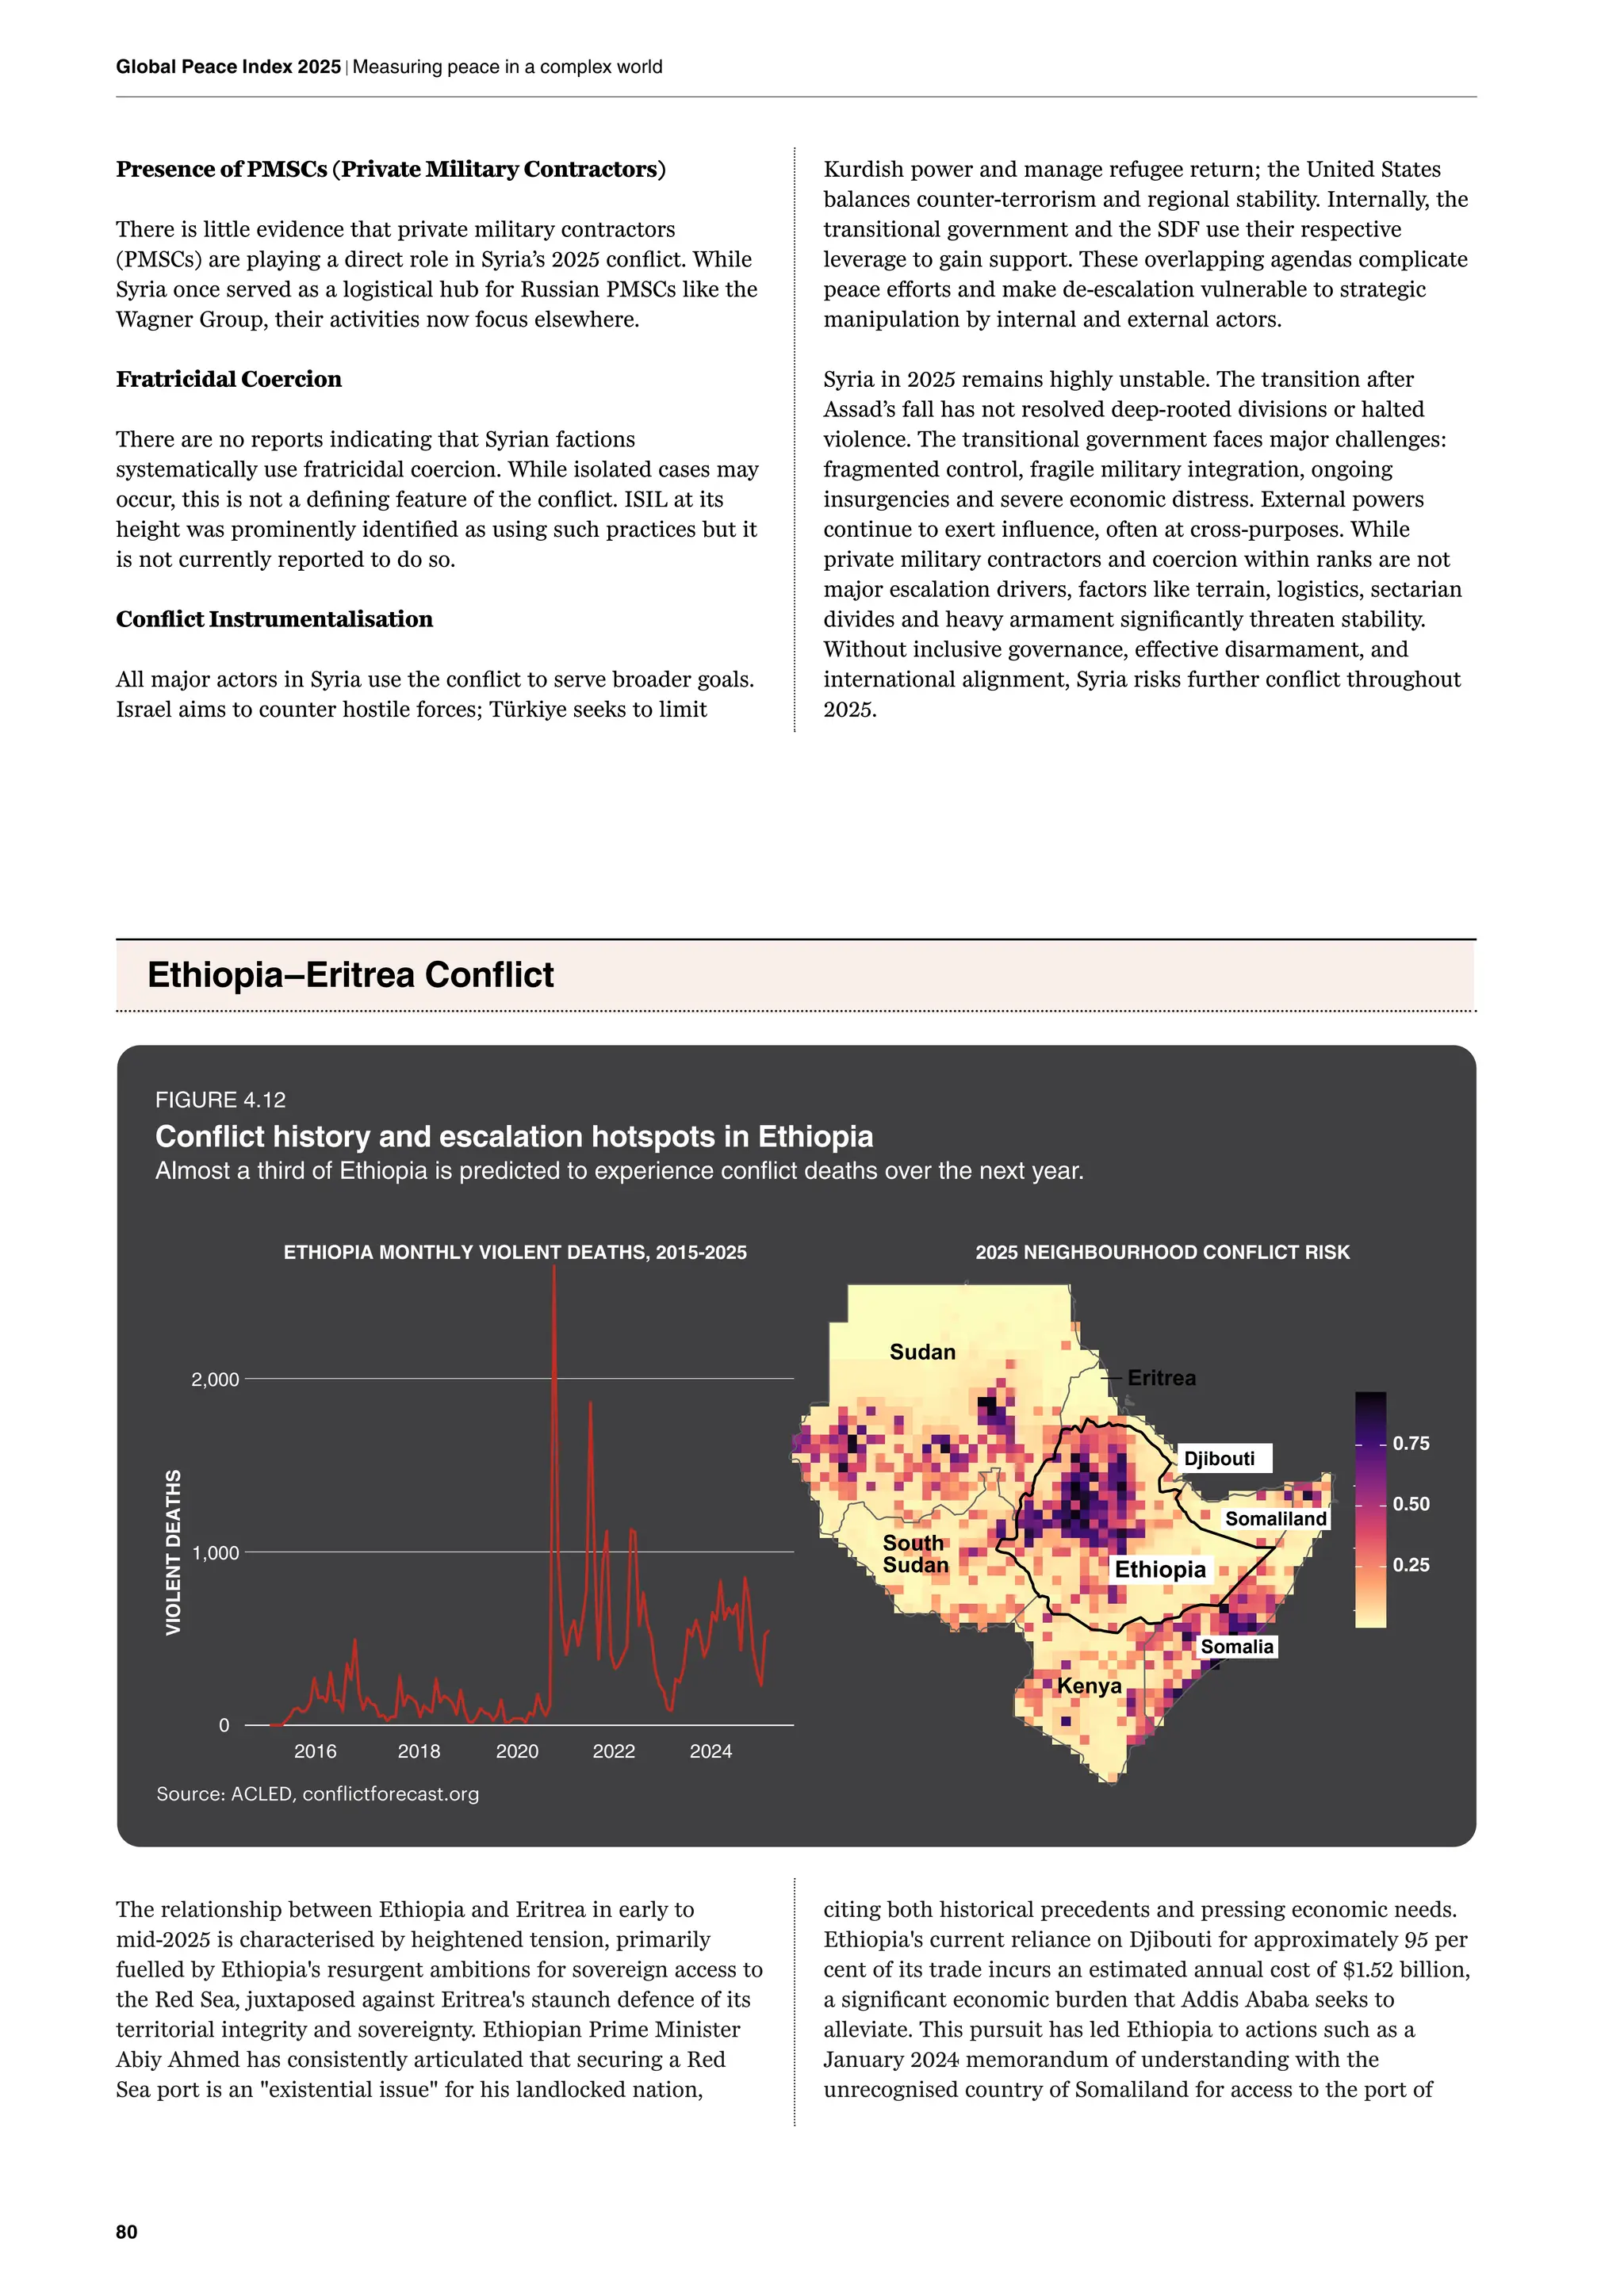
Case Studies 68
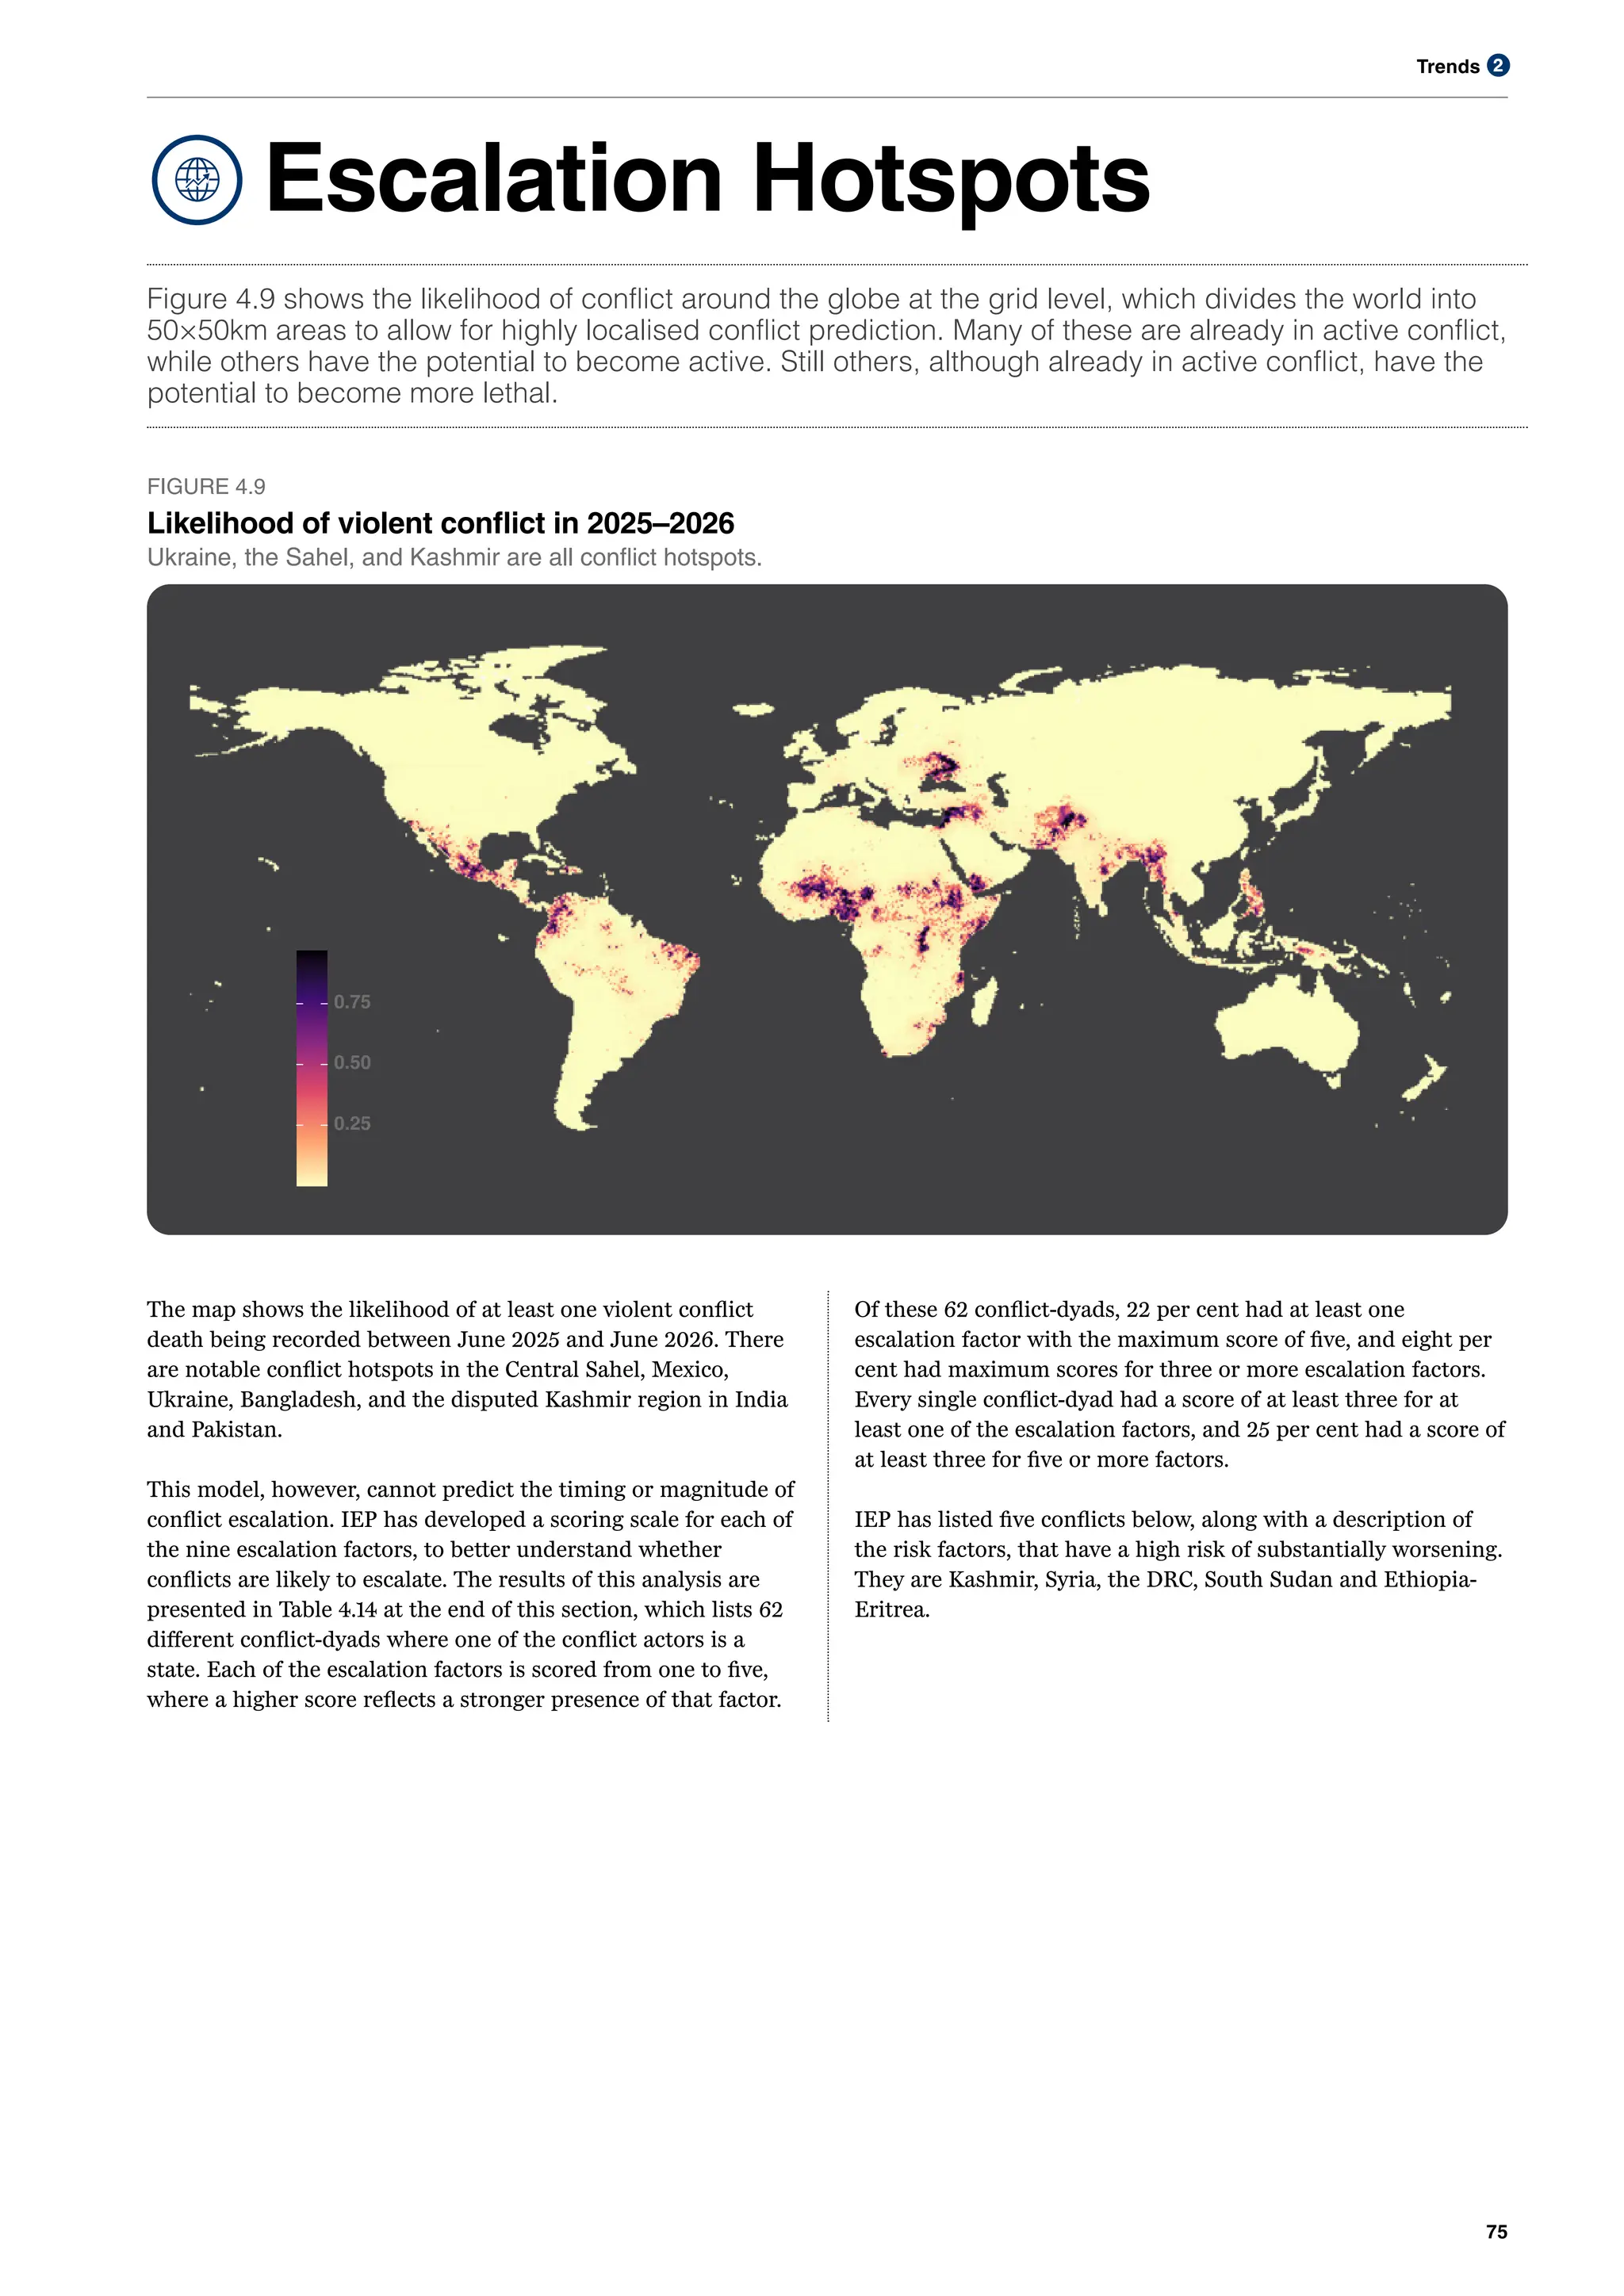
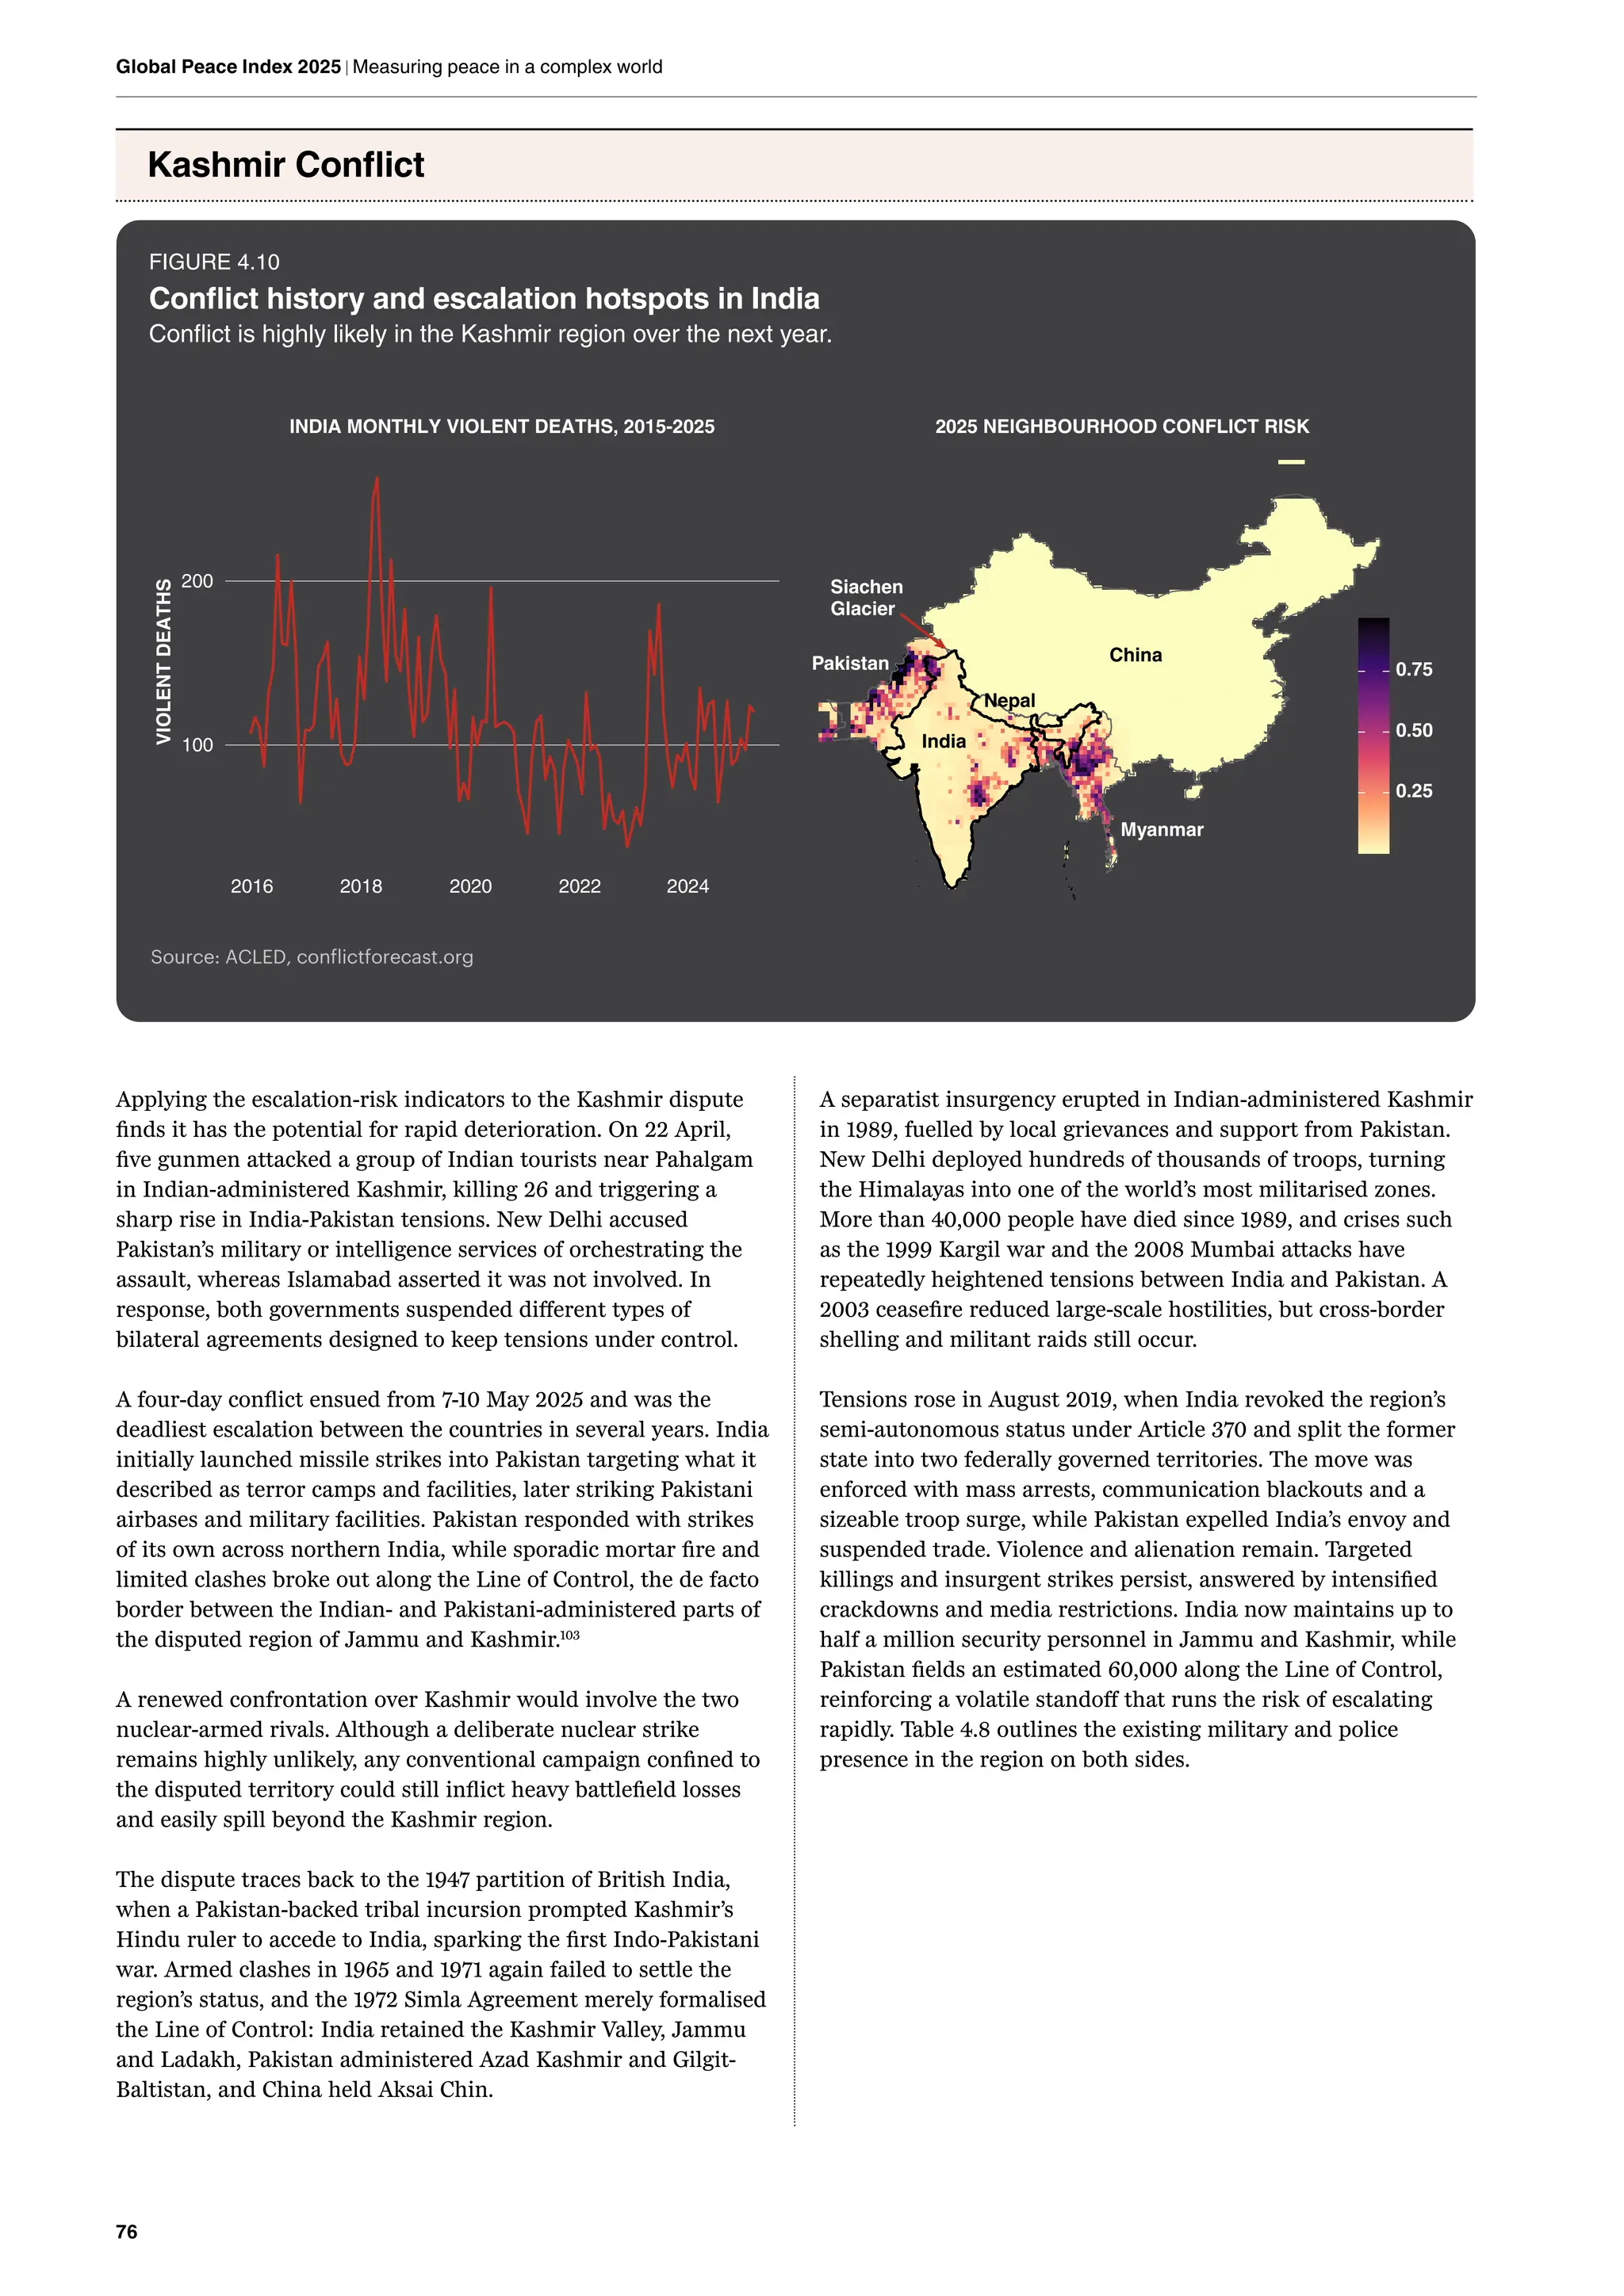
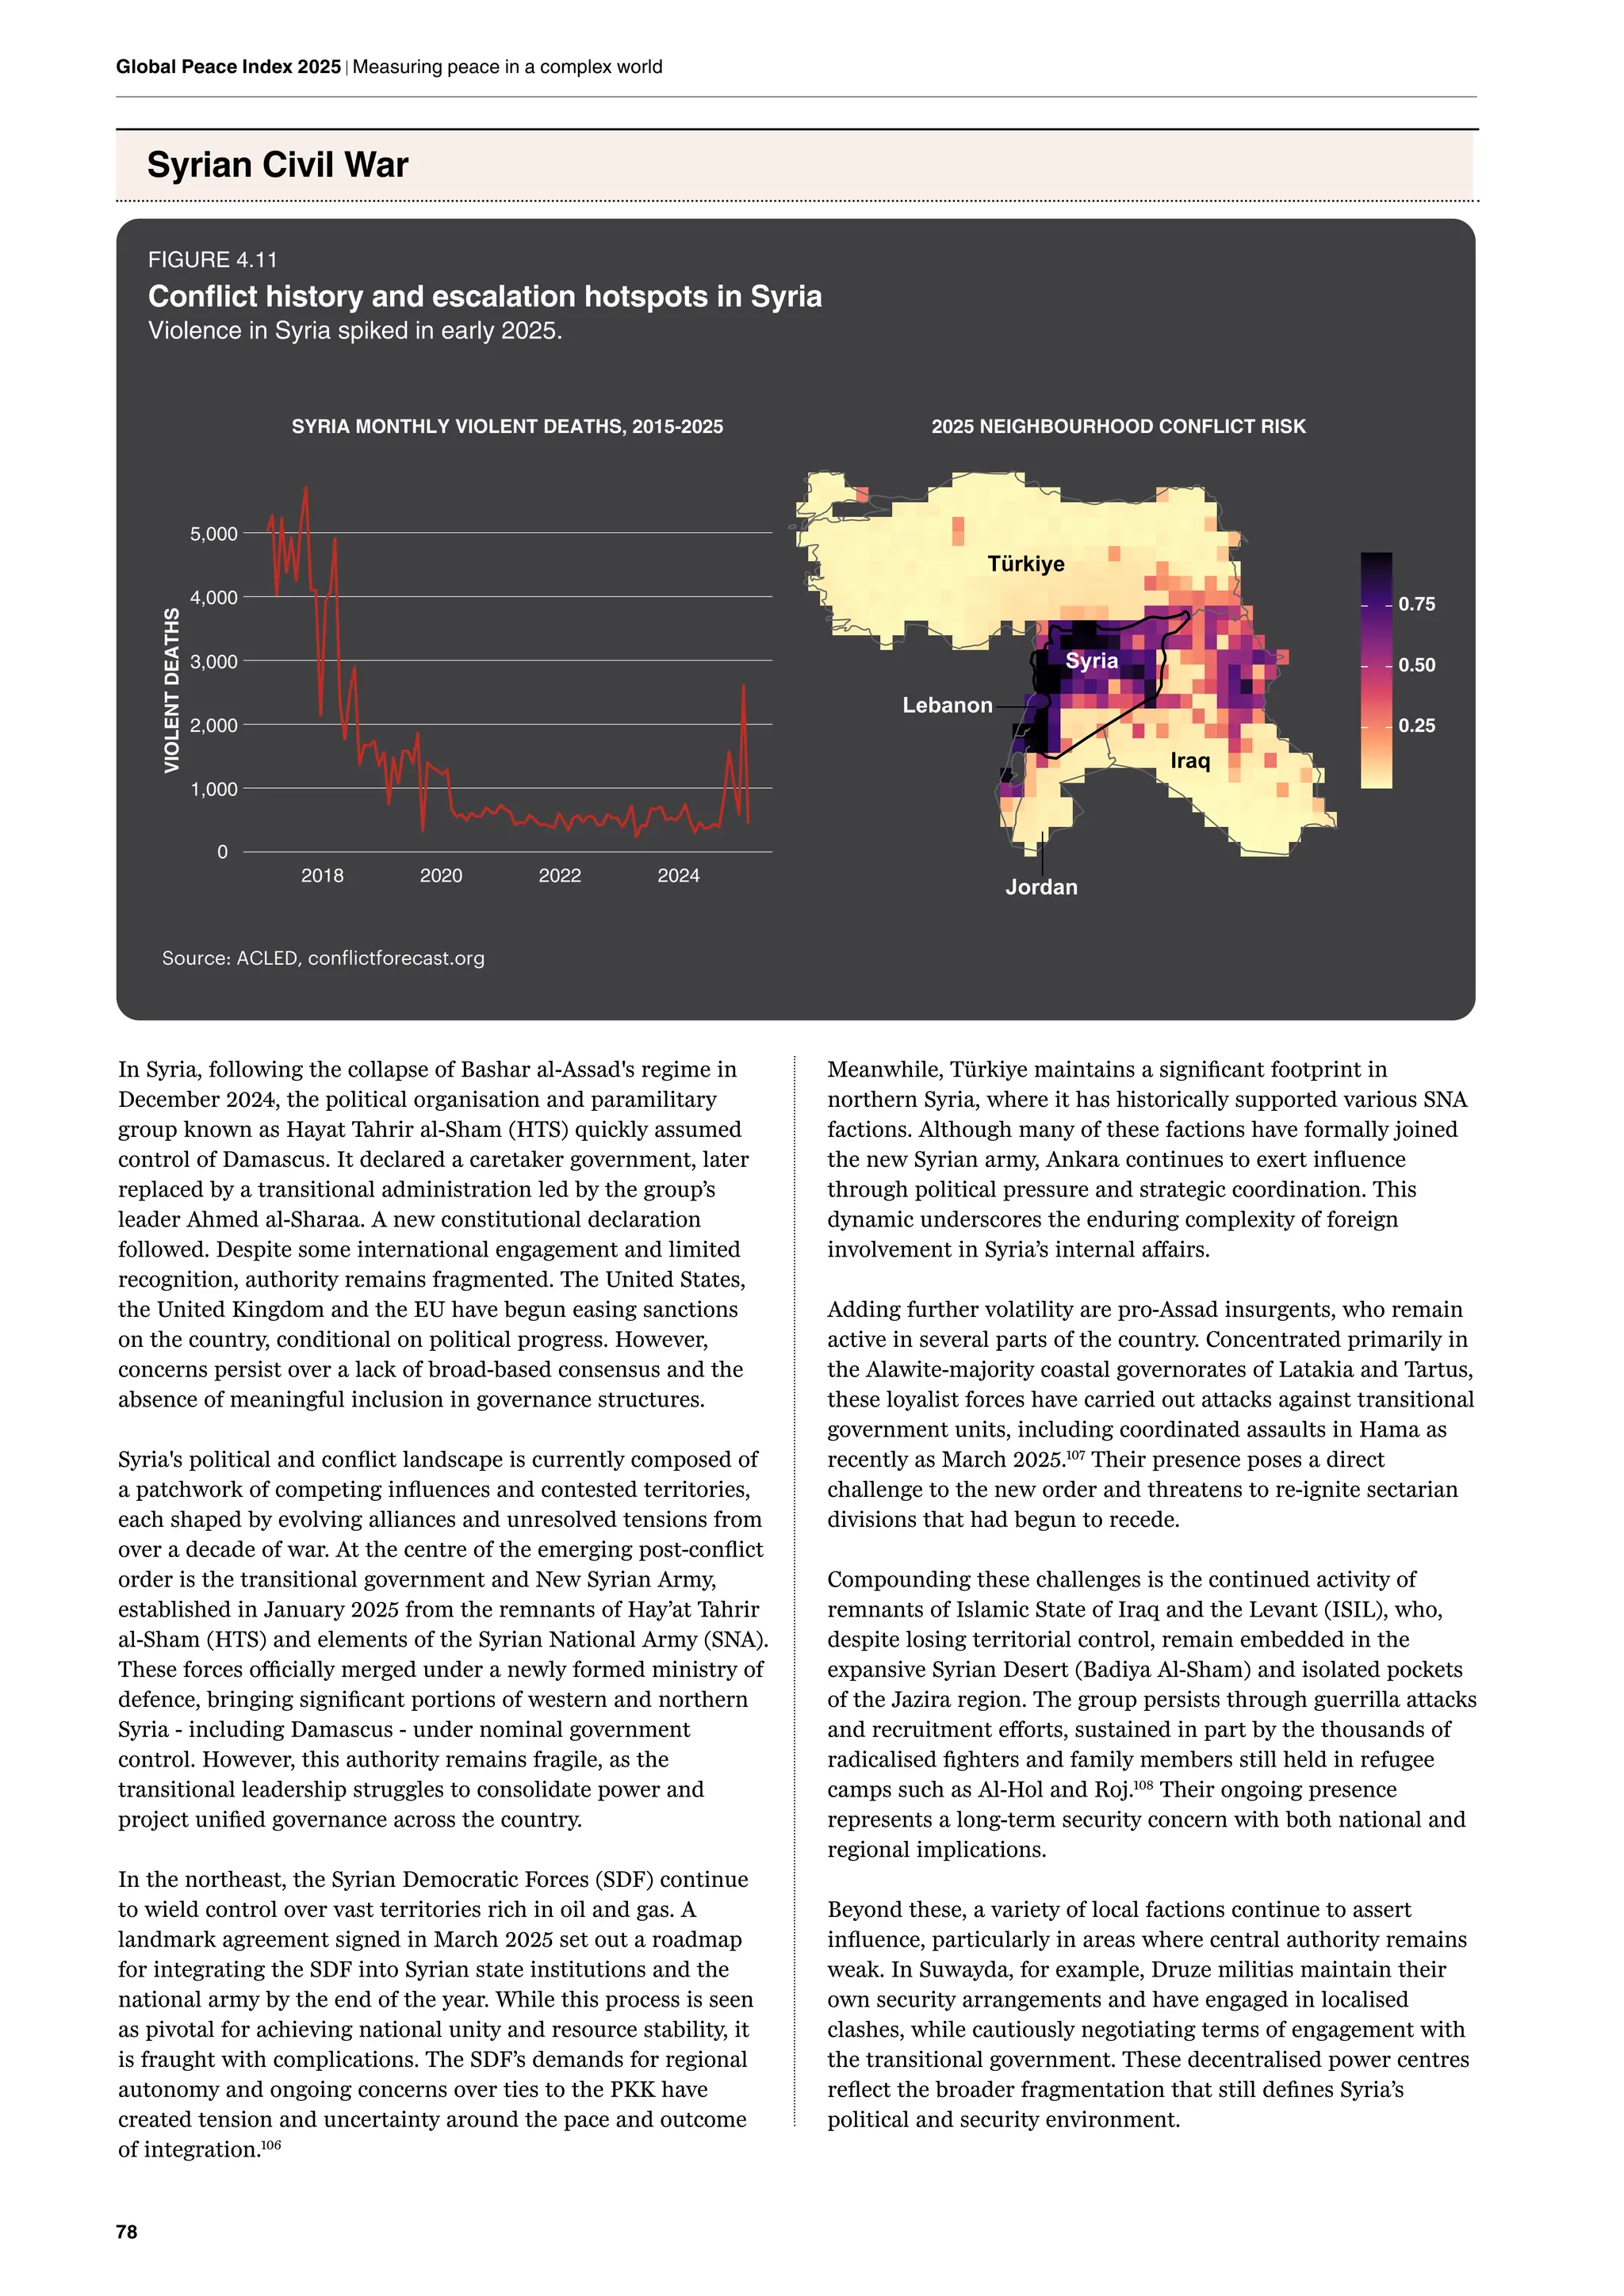
Escalation Hotspots 75
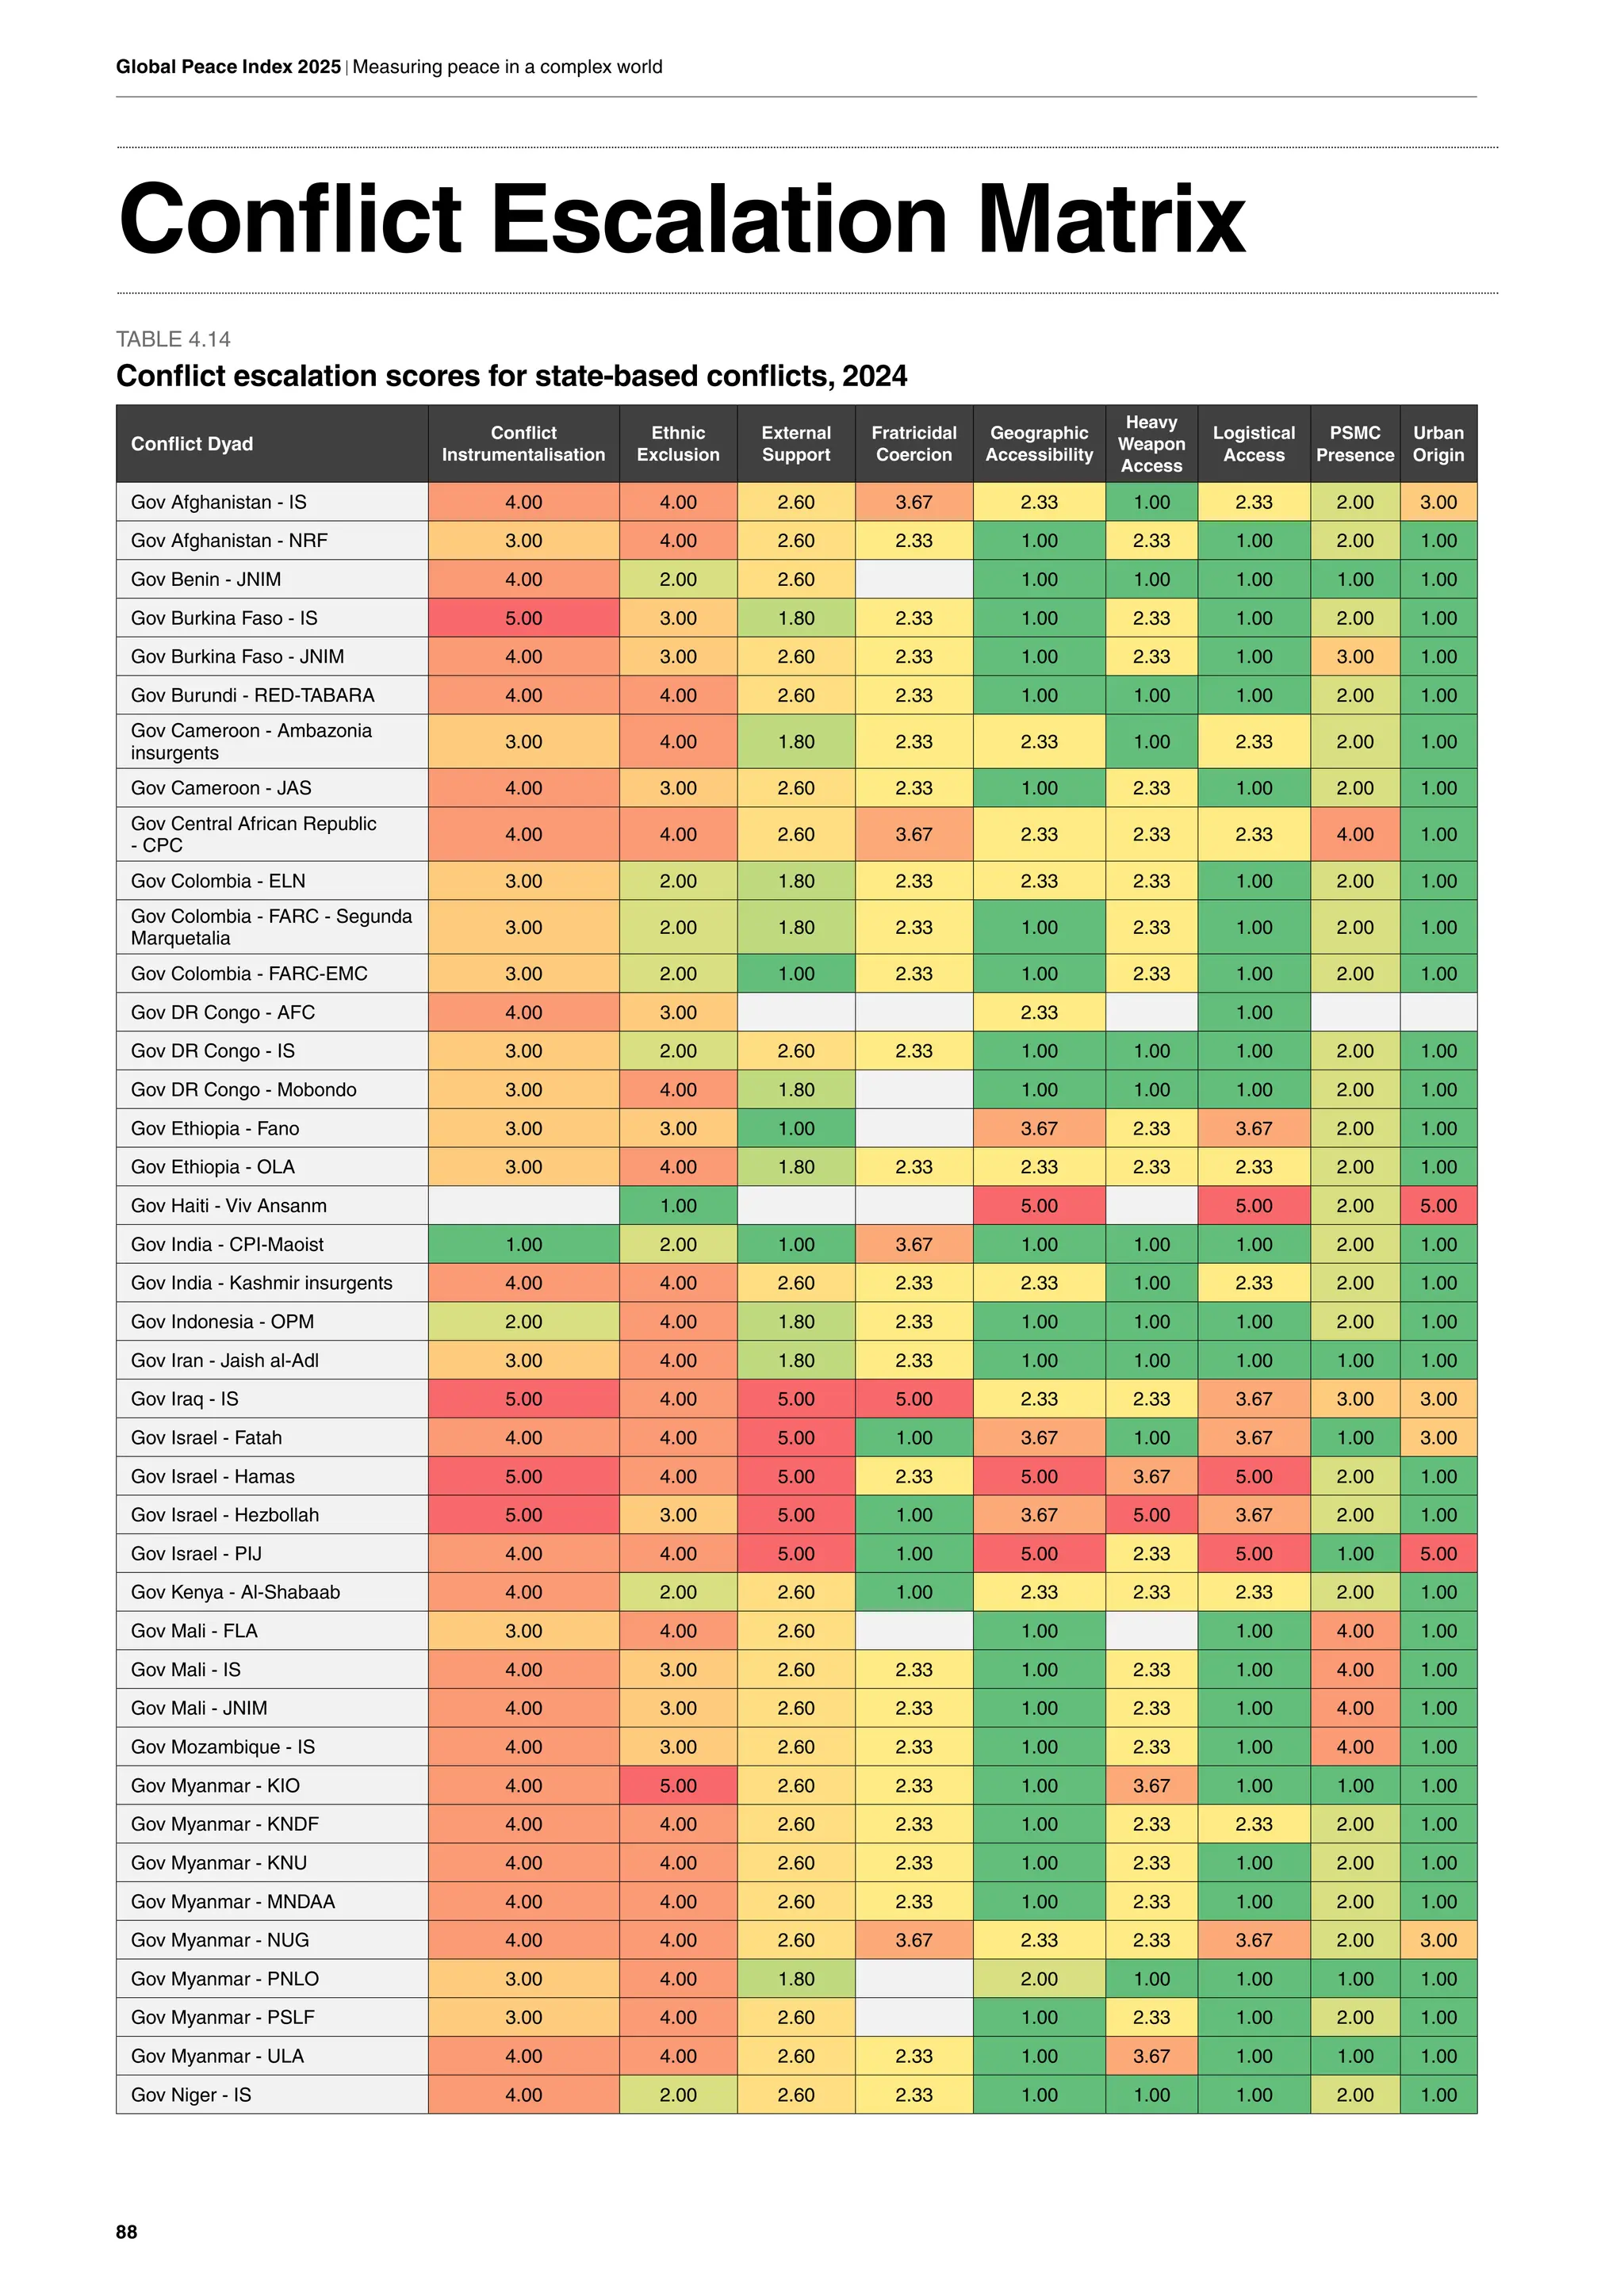
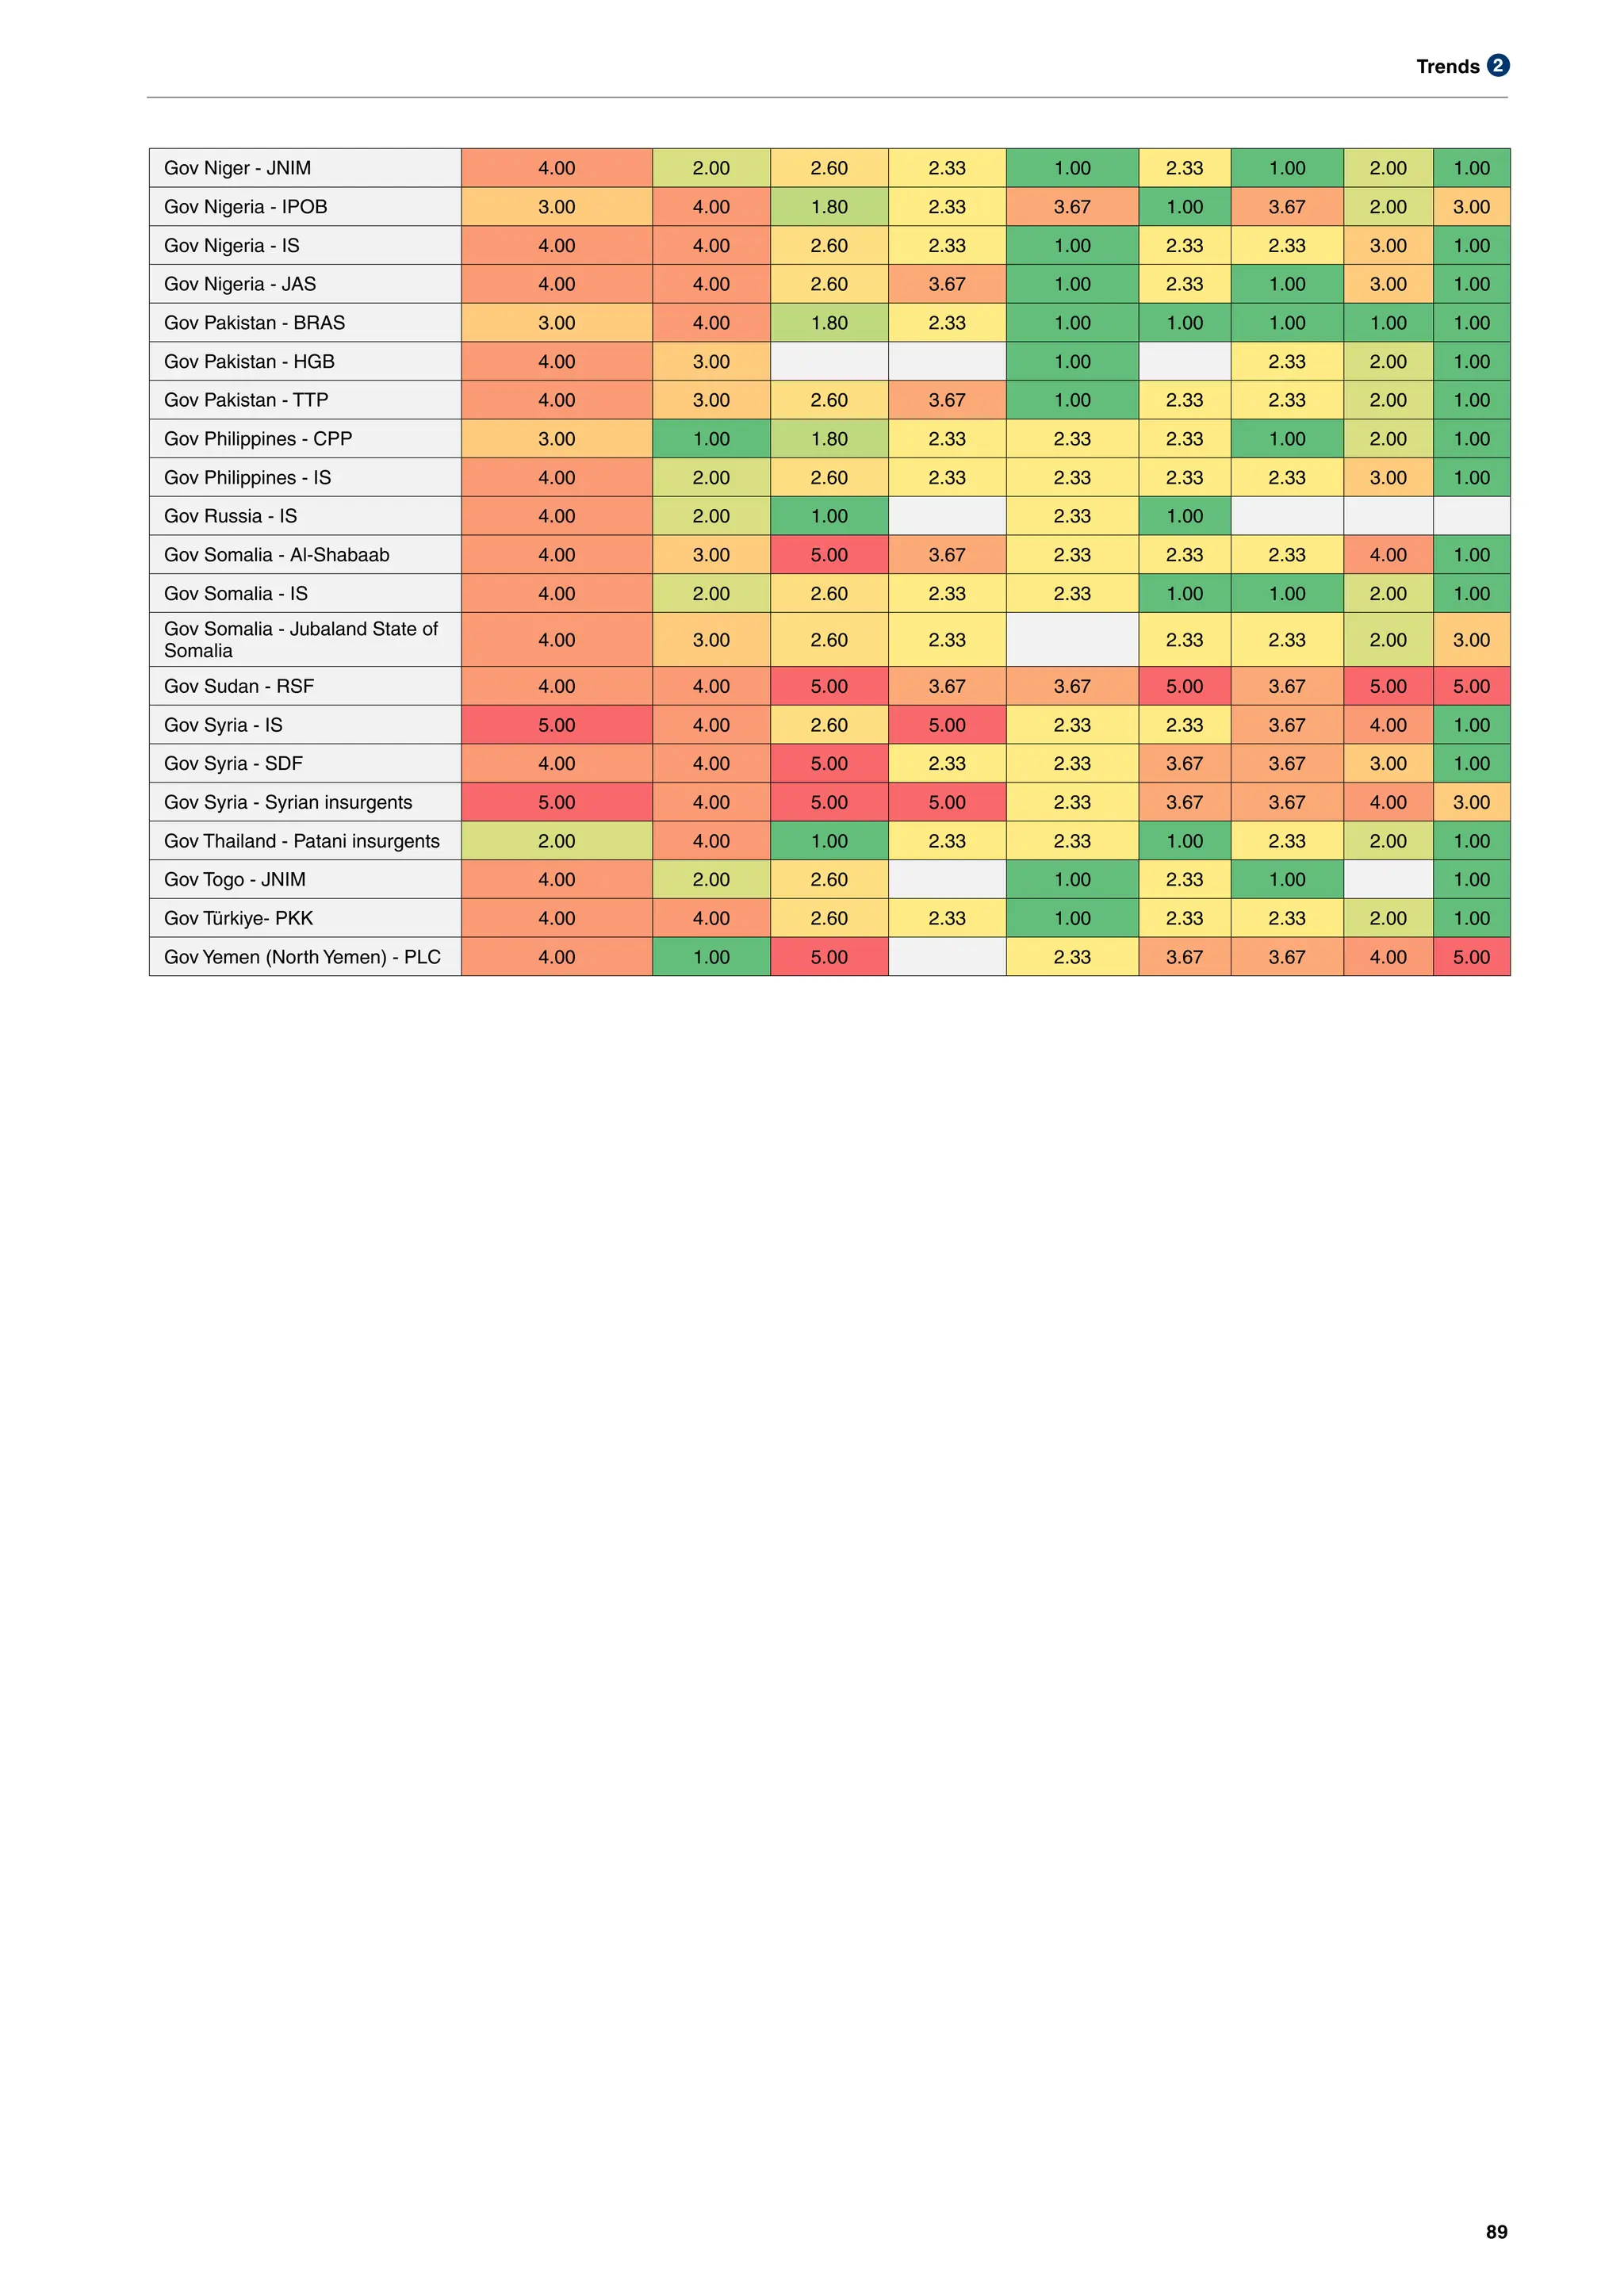
Conflict Escalation Matrix 88
Information Flows: Divergent trends in access and quality 92
Media Reports, Armed Conflict and International Tensions 94
Appendix A: GPI Methodology 100
Appendix B: GPI Indicator Sources, Definitions & Scoring Criteria 104
Appendix C: GPI Domain Scores 111
Endnotes 114
Executive Summary 2
Key Findings 4
2
3
4
5
6
4.
2
Global Peace Index2025 | Measuring peace in a complex world
Executive
Summary
This is the 19th
edition of the Global Peace Index (GPI),
which ranks 163 independent states and territories
according to their level of peacefulness, covering 99.7 per
cent of the world’s population. Produced by the Institute for
Economics & Peace (IEP), the GPI is the world’s leading
measure of global peacefulness.
This report presents the most comprehensive data-driven
analysis to date on trends in peace, its economic value, and
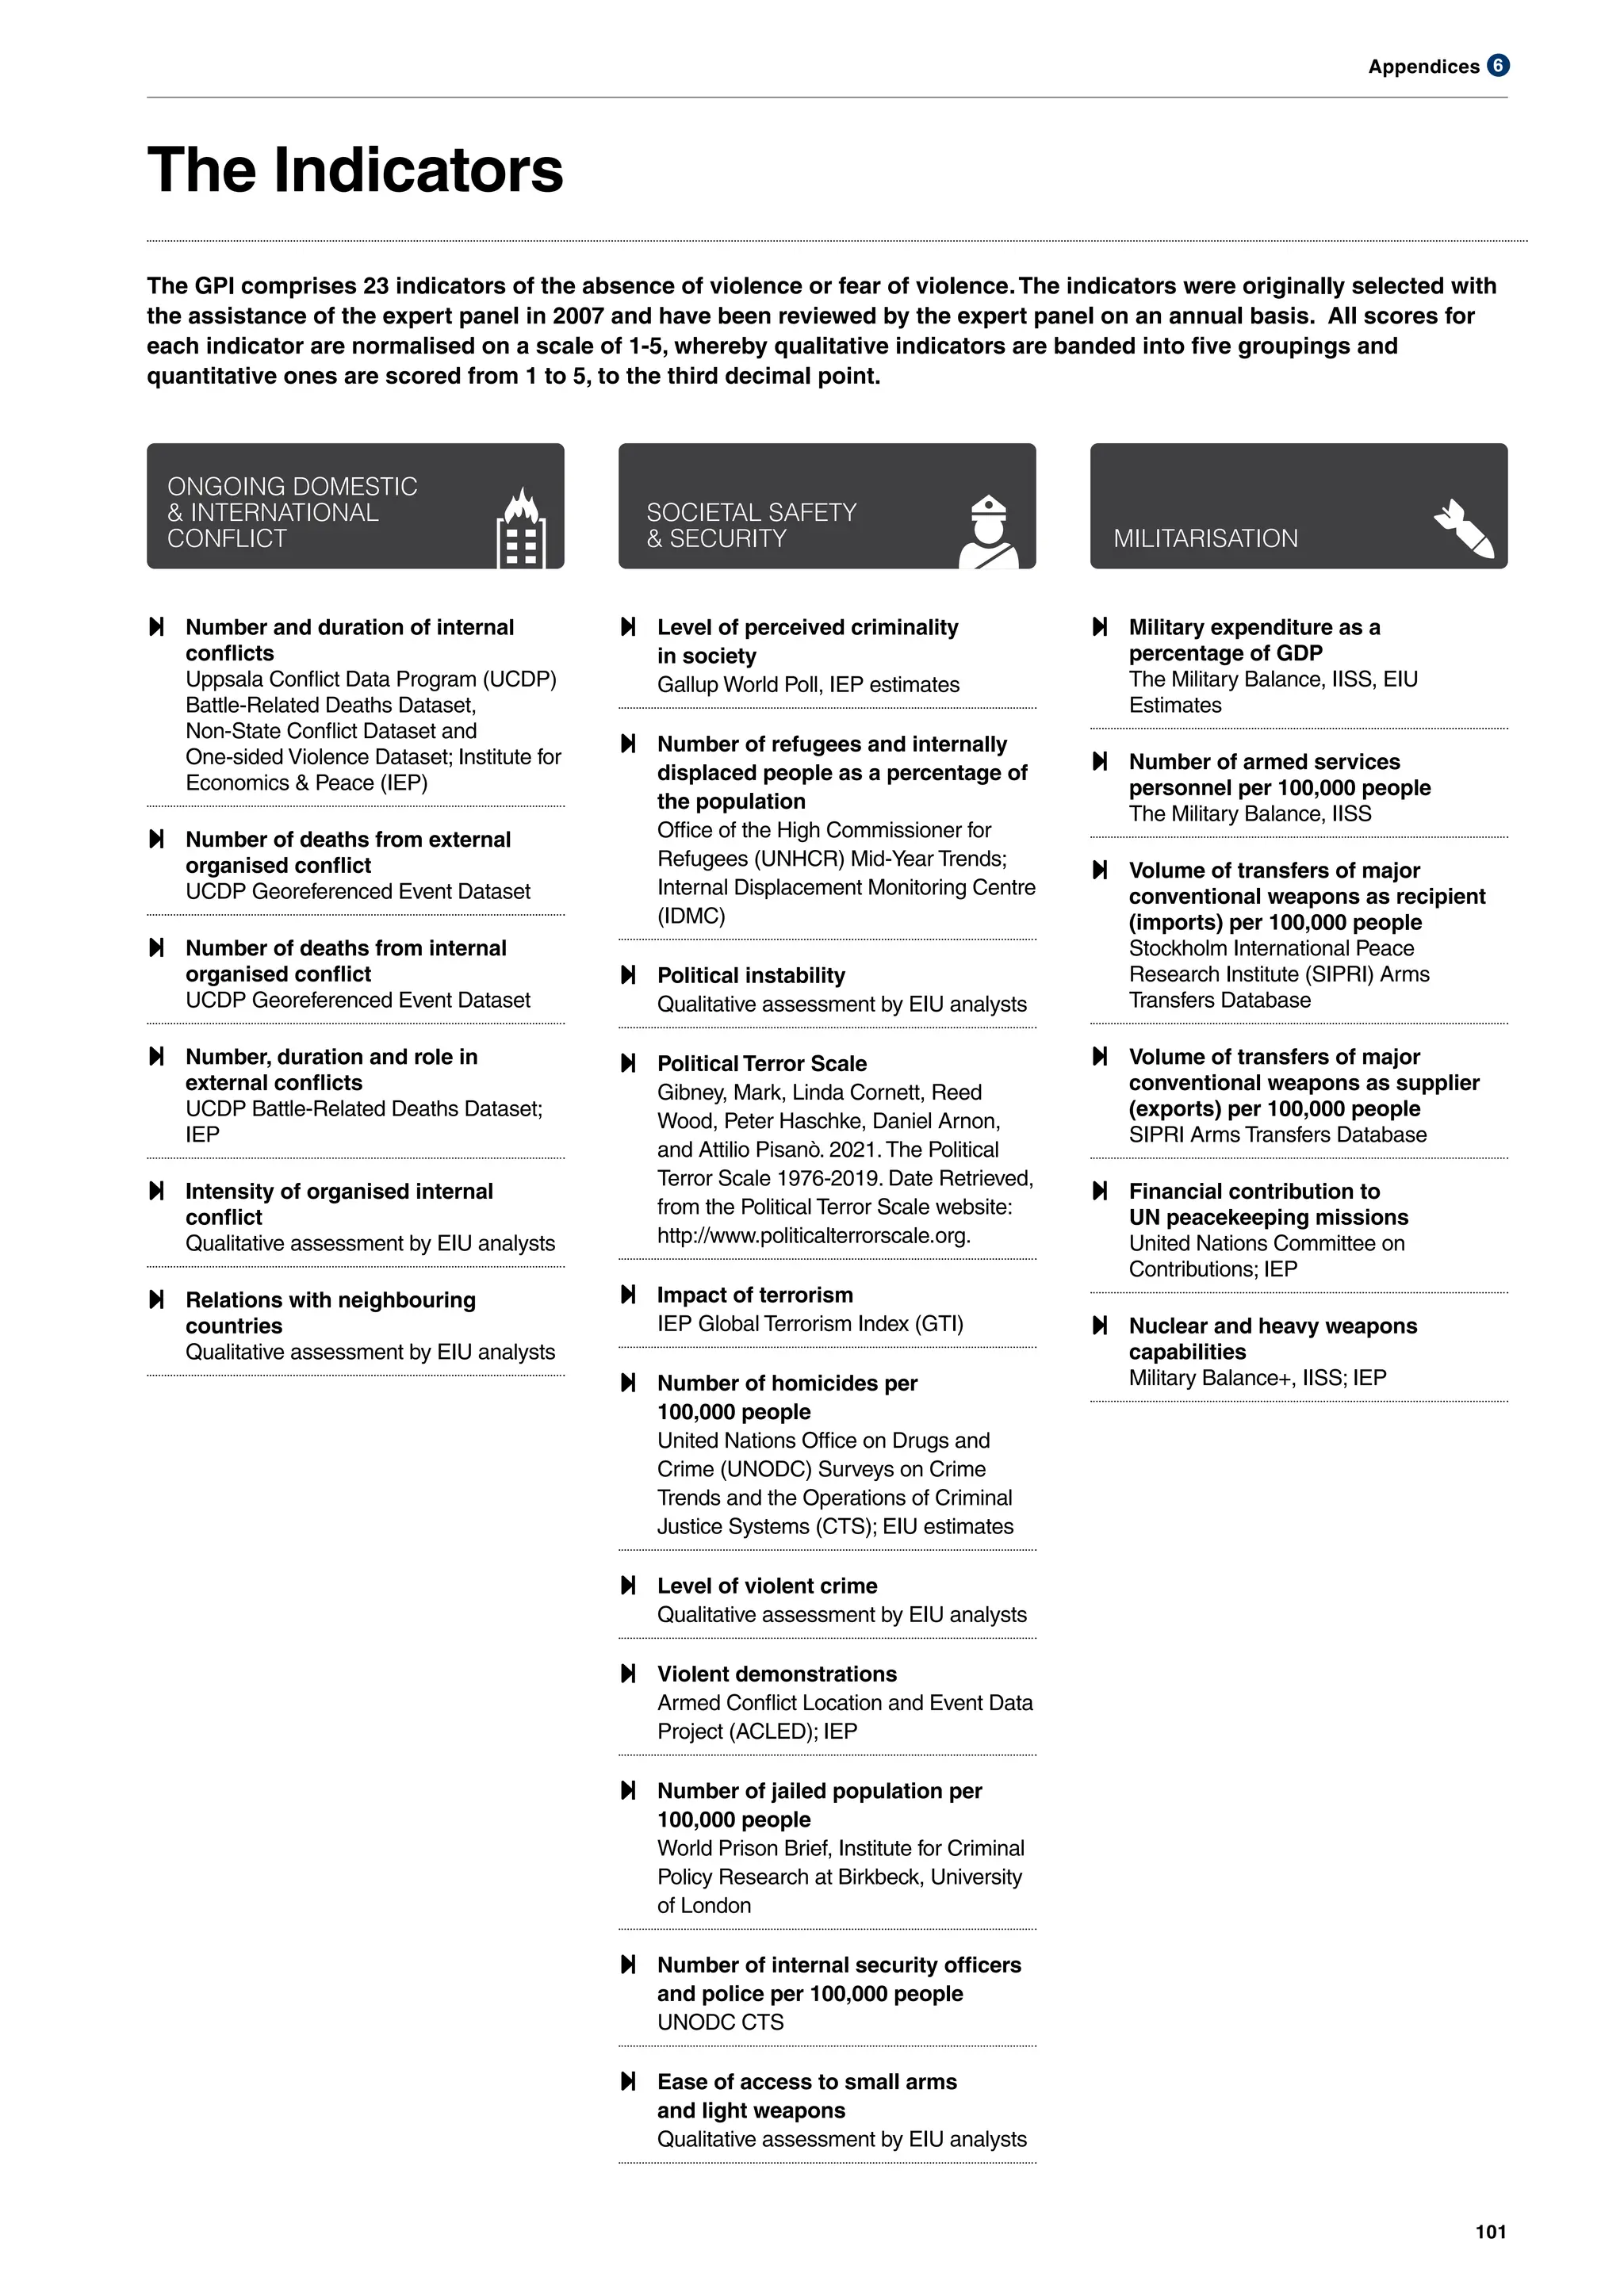
how to develop peaceful societies. It uses 23 qualitative and
quantitative indicators to measure the state of peace across
three domains: the level of Societal Safety and Security; the
extent of Ongoing Domestic and International Conflict; and
the degree of Militarisation.
The 2025 GPI finds that global peacefulness continues to
decline and that many of the leading factors that precede
major conflicts are higher than they have been since the
end of WWII. More countries are increasing their levels of
militarisation against the backdrop of rising geopolitical
tensions, increasing conflict, the breakup of traditional
alliances and rising economic uncertainty.
There are currently 59 active state-based conflicts, the most
since the end of WWII and three more than the prior year.
Last year, 17 countries recorded over 1,000 conflict deaths.
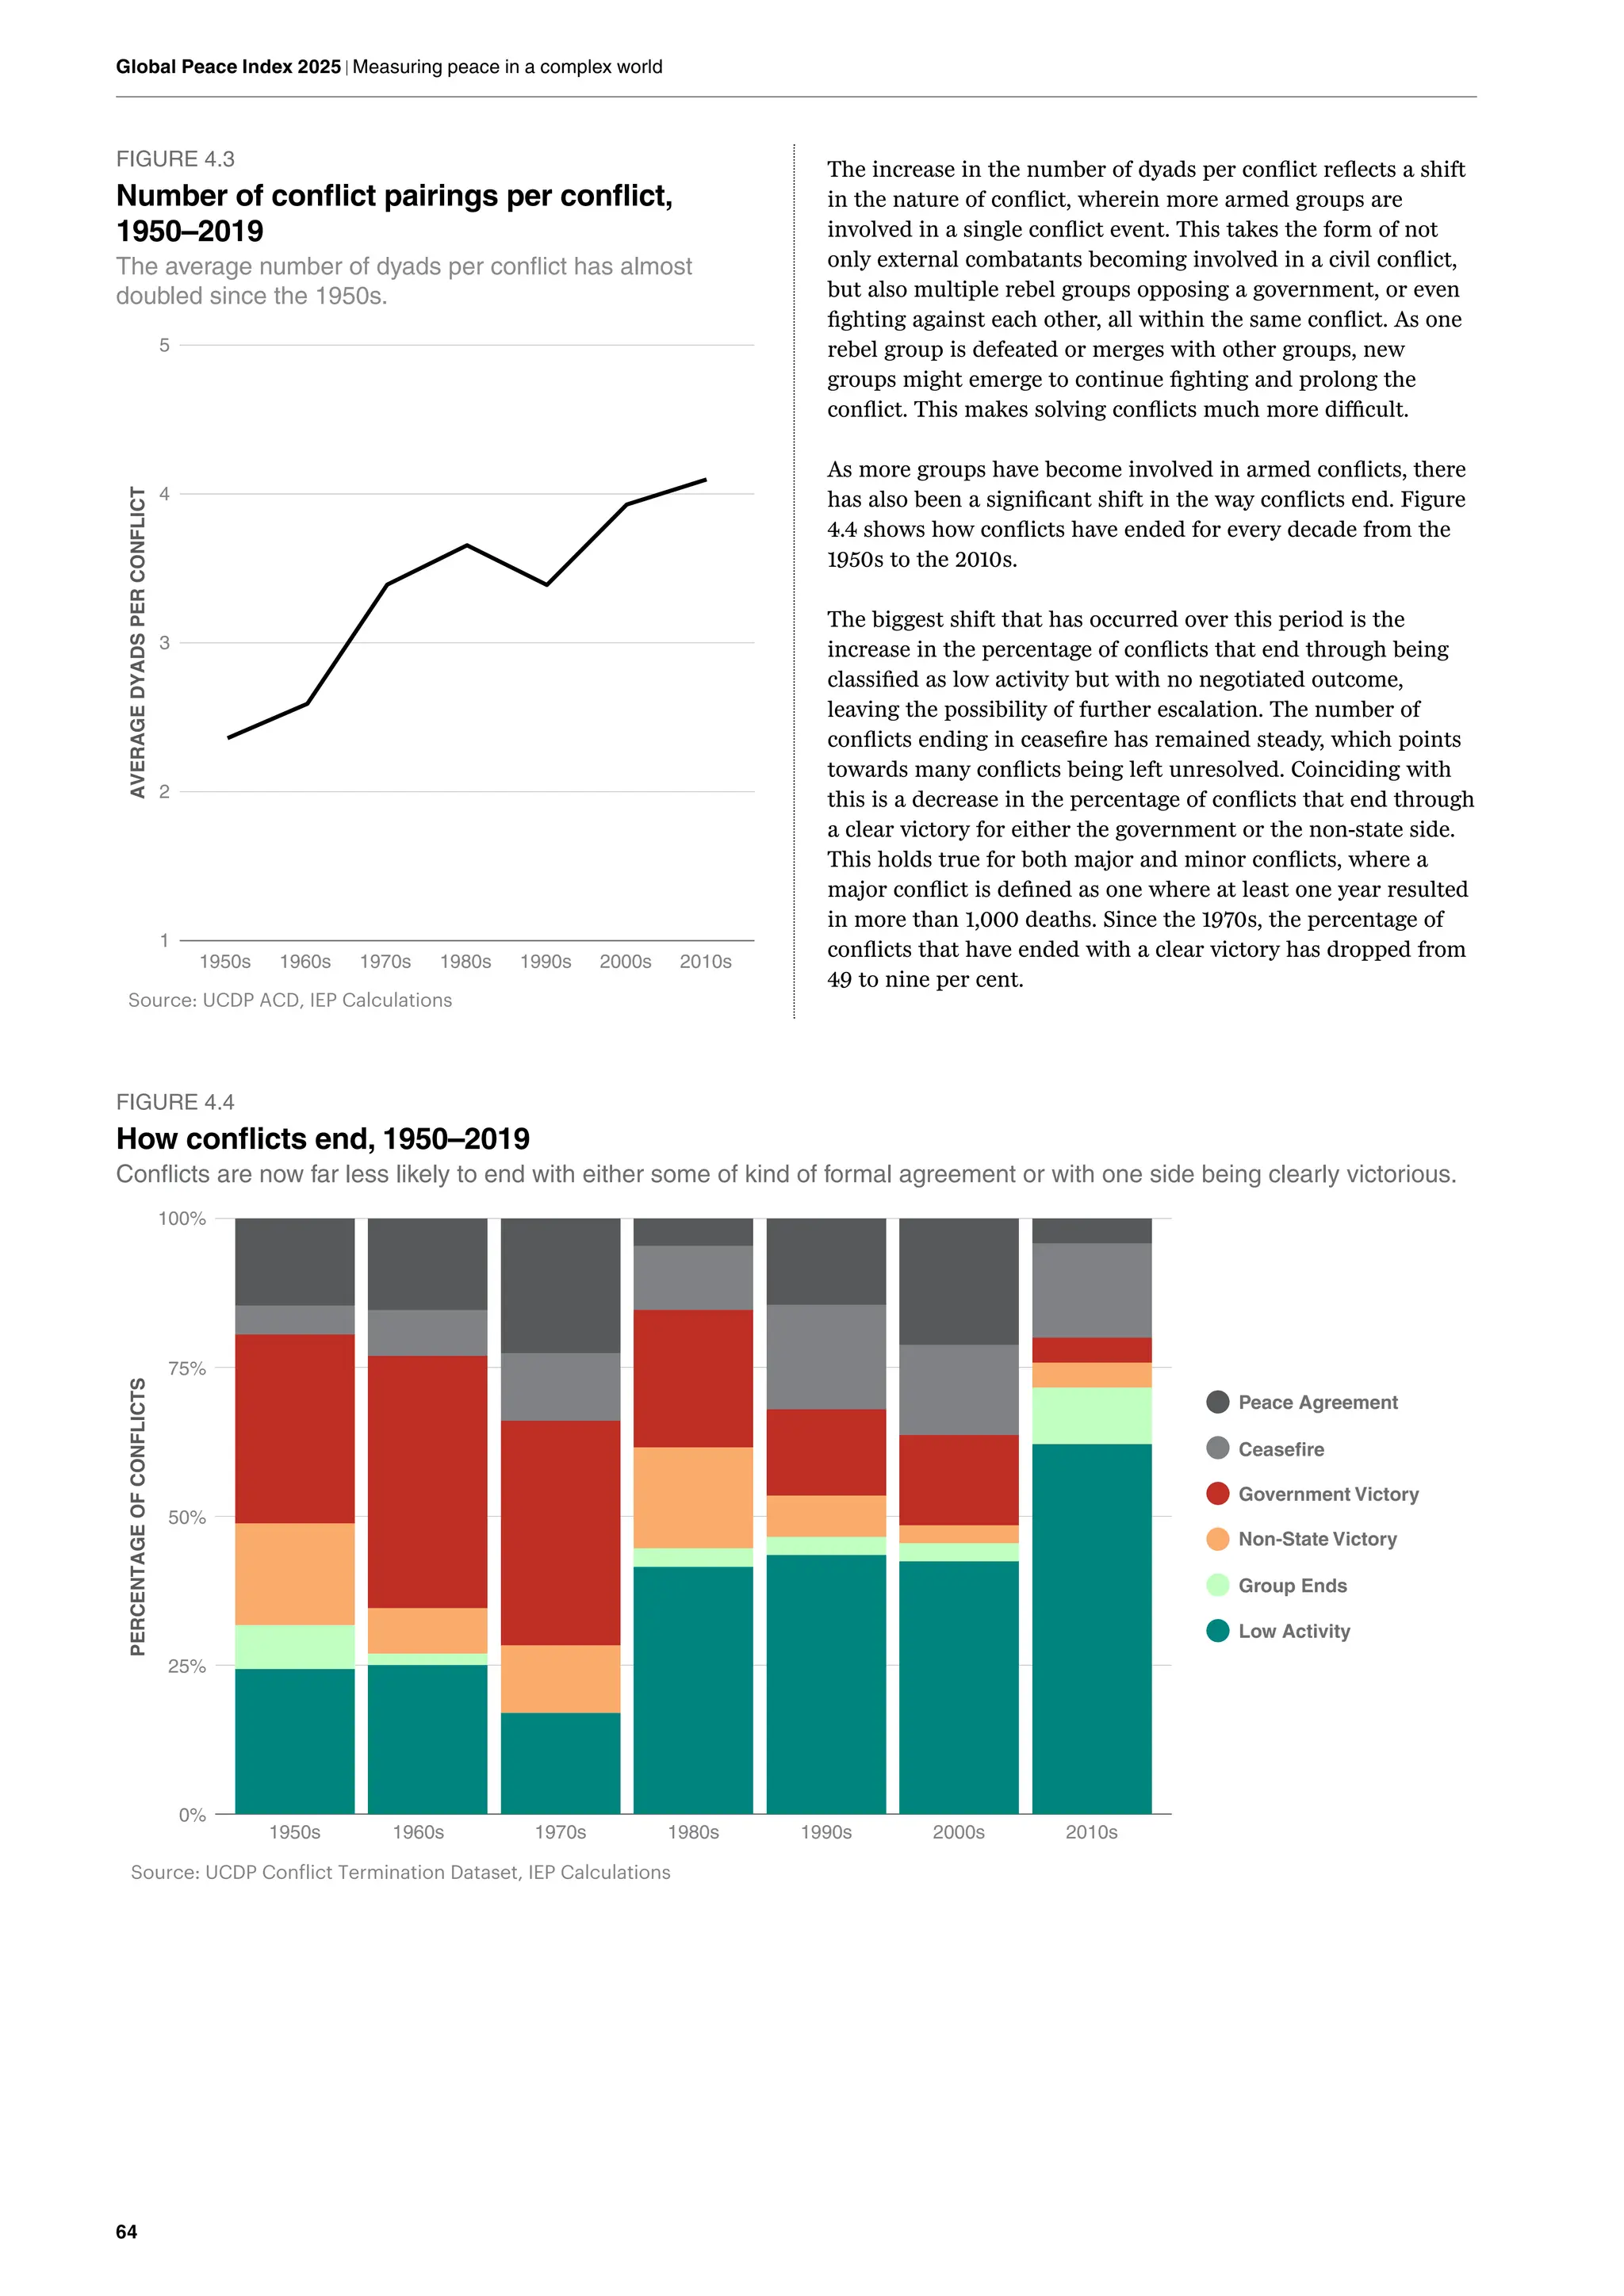
Additionally, the successful resolution of conflicts is lower
than at any point in the last 50 years. Conflicts that ended in
a decisive victory fell from 49 per cent in the 1970s to nine
per cent in the 2010s, while conflicts that ended through
peace agreements fell from 23 per cent to four per cent
over the same period.
Conflicts are also becoming more internationalised, making
solutions more difficult; 78 countries are engaged in a
conflict beyond their borders. This increased involvement
is driven by geopolitical fragmentation, increasing major
power competition, and the rise in influence of middle level
powers, who are becoming more active within their regions.
The almost two-decade long trend of falling militarisation
has also reversed, with 106 countries having deteriorated
on the Militarisation domain in the past two years.
This year’s results found that the average level of global
peacefulness deteriorated by 0.36 per cent. This is the 13th
deterioration in peacefulness in the last 17 years, with 74
countries improving and 87 deteriorating in peacefulness.
Iceland remains the most peaceful country in the world, a
position it has held since 2008. It is joined at the top of the
index by Ireland, Austria, New Zealand and Switzerland.
All of these countries, other than Switzerland, were also
ranked among the ten most peaceful countries in the first
year of the index. These countries have high Positive Peace
ratings, underscoring the resilience created by high levels
of Positive Peace.
Russia, for the first time, is the least peaceful country in
the world on the 2025 GPI, followed by Ukraine, Sudan,
Democratic Republic of the Congo and Yemen.
Western and Central Europe is the most peaceful region in
the world, home to eight of the ten most peaceful countries,
although its peacefulness has been falling over the last four
years. The Middle East and North Africa (MENA) region
remains the world’s least peaceful region.
South Asia, the second least peaceful region globally,
experienced the largest regional decline in peacefulness.
This deterioration was driven primarily by repressive
measures in Bangladesh under the Hasina government,
and by heightened civil unrest and escalating internal and
cross-border tensions in Pakistan.
South America was the only region in the world to record
an improvement in peacefulness last year. Seven of the
11 countries in the region improved, with the largest
improvements occurring in Peru and Argentina. Both
countries recorded changes in government in 2022 and
2023, respectively.
Of the 23 indicators in the GPI, eight recorded
improvements, 13 deteriorated, and two recorded no
change. The Militarisation and Ongoing Conflict domains
both deteriorated, while the Safety and Security domain
recorded a slight improvement.
The largest year-on-year deteriorations occurred on the
external conflicts fought, deaths from internal conflict,
and military expenditure (% of GDP) indicators. The
deterioration on the military expenditure (% of GDP)
indicator reflects the deterioration on the Militarisation
domain more broadly.
Despite the overall deterioration in peacefulness globally,
some indicators recorded noticeable improvement. The
perceptions of criminality and homicide rate indicators both
continued their long running trend of improvement. The
violent demonstrations indicator also improved, although
it has deteriorated for 12 of the past 17 years. There were
substantial improvements for many Safety and Security
indicators, including violent demonstrations, terrorism
impact and the homicide rate. Several countries in the
Central and North America region recorded significant
reductions in the number of homicides, although the region
still has the highest average homicide rate of any region.
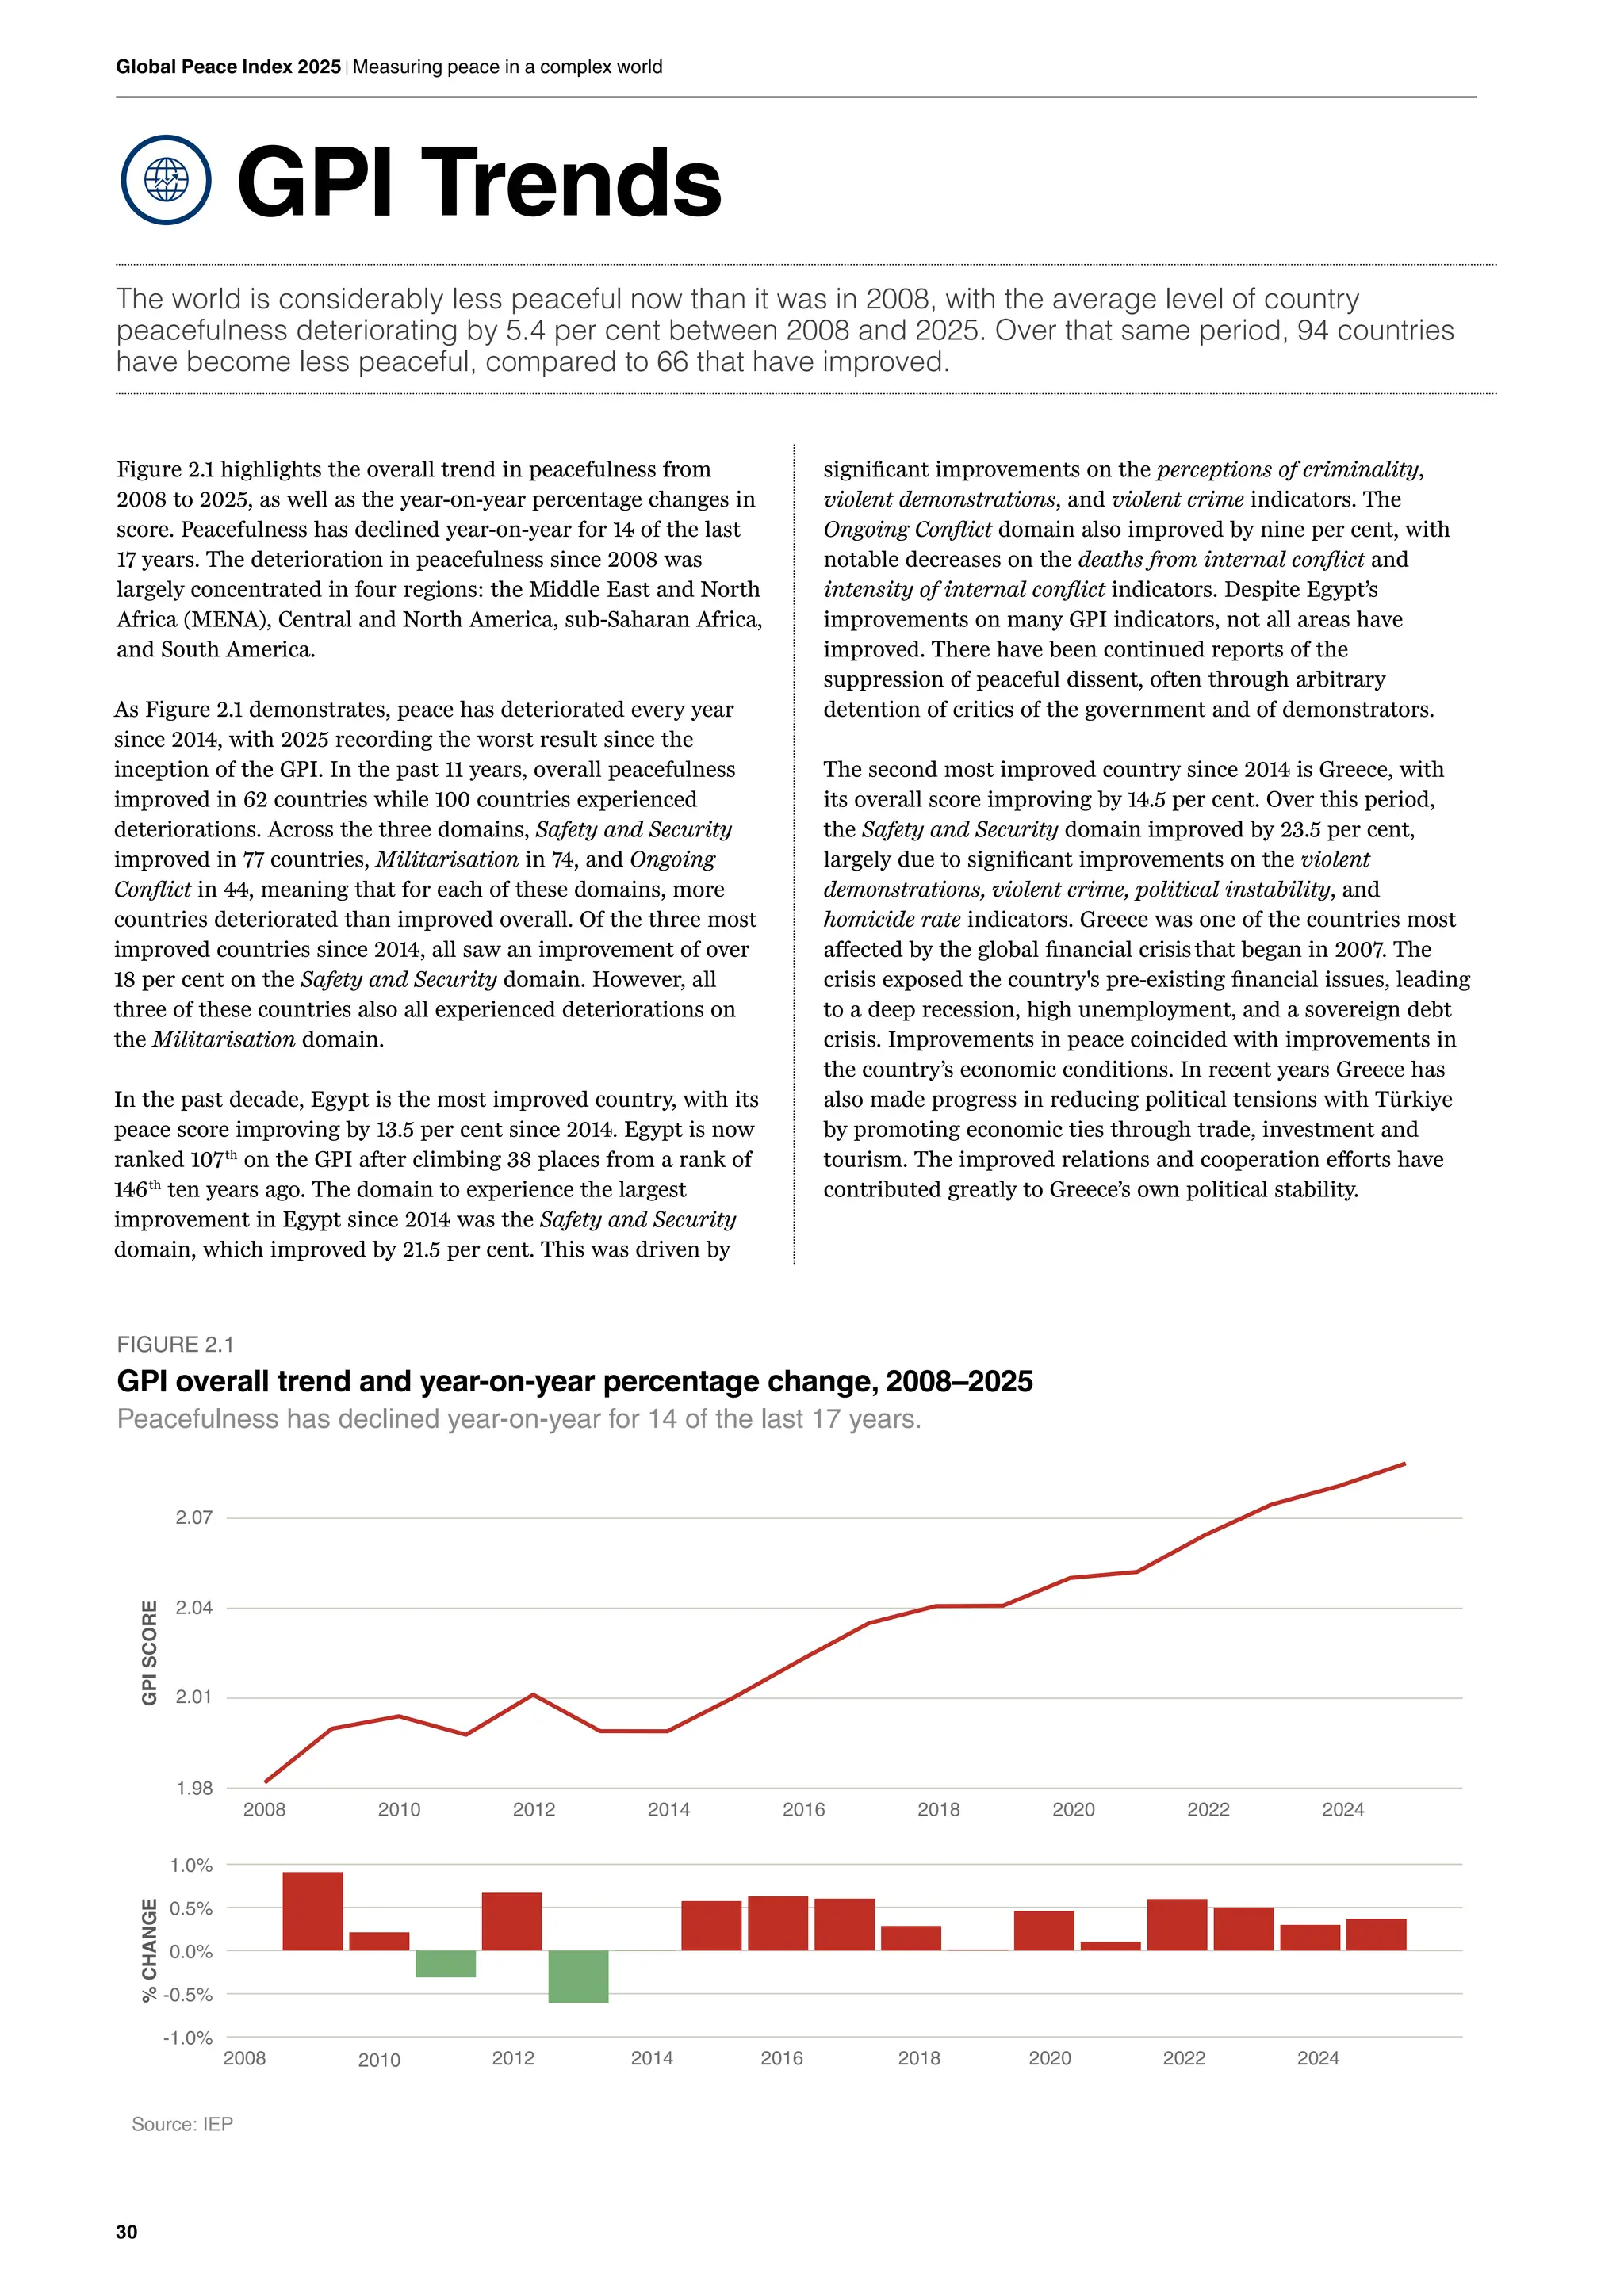
The world has become less peaceful over the past 17
years, with the average country score deteriorating by 5.4
per cent since the index’s inception in 2008. Of the 163
countries in the GPI, 94 recorded deteriorations, while
66 recorded improvements and one recorded no change.
Seventeen of the 23 GPI indicators deteriorated between
2008 and 2023, while seven improved.
5.
Executive Summary
3
There arenow 34
countries who are
considered to have
substantial influence
in another country, up
from six in the 1970s.
The world is moving
into the age of ‘global
power fragmentation’.
Two of the three GPI domains deteriorated since 2008, with
Ongoing Conflict deteriorating by 17.5 per cent and Safety
and Security deteriorating by 2.5 per cent. Militarisation
was the only domain to improve, although this trend has
reversed over the past four years. Some of the largest
indicator deteriorations were for external conflicts fought,
internal conflicts fought, and the number of refugees and
IDPs.
The past year has seen some major shifts in international
affairs. The 2025 GPI report looks at these structural trends
to provide a better insight into contemporary factors that
affect conflict:
• Geopolitical fragmentation has substantially increased.
This is most noticeable on the relations between
neighbouring states indicator, which has substantially
deteriorated since 2008, with 59 countries recording
poorer ties with neighbours while only 19 improved.
• There have been notable reductions in global
integration for economics, trade, diplomacy and military
cooperation. They have been steadily falling since the
2008 Global Financial Crisis.
• The rising wealth of many countries
means that they have the economic
power for expanded international
influence, especially within their local
regions.
• Global trade as a share of global GDP
has flatlined for the last decade at
roughly 60 per cent, while restrictive
trade practices rose to more than 3,000
in 2023, nearly triple the 2019 figure.
• Developing countries spend an average
of 42 per cent of government revenue
on servicing debt. The largest creditor
is China.
• Expenditure on peacebuilding and peacekeeping was
just 0.52 per cent of total military spending in 2024,
compared to 0.83 per cent ten years ago. The number
of deployed peacekeeping troops has also fallen by
42 per cent over the past decade, while the number of
conflicts has risen steadily.
• Every nuclear-armed state has held or expanded its
arsenal since 2022, and great-power rivalry is fuelling
an arms race in advanced technologies, from AI-
enabled drones to counter-space systems.
• Internationalised intrastate conflicts, in which foreign
troops fight inside another state, have increased 175
per cent since 2010, drawing 78 countries into wars
beyond their borders.
There are now 34 countries who are considered to have
substantial influence in another country, up from six in the
1970s. Combined with the US and China having reached
or being near the limits of their influence, the world is
moving into the age of ‘global power fragmentation’.
China’s gross debt, estimated at approximately 300 per
cent of GDP, alongside signs of a significant asset bubble,
draws parallels with Japan’s economic conditions in the
late1980s. More power will shift to rising middle economies,
while most western powers struggle economically. How this
power dynamic unfolds, and its effect on conflict, remains to
be seen.
To better understand why violent conflicts can intensify
rapidly, IEP identified nine conflict escalation factors,
ranging from external military support and logistics, to
ethnic exclusion and conflict instrumentalisation. These
drivers were decisive in historic escalations. Based on
the presence of these factors, current conflicts that have
the potential to substantially escalate are South Sudan,
Ethiopia/Eritrea, the Democratic Republic of the Congo, and
Syria.
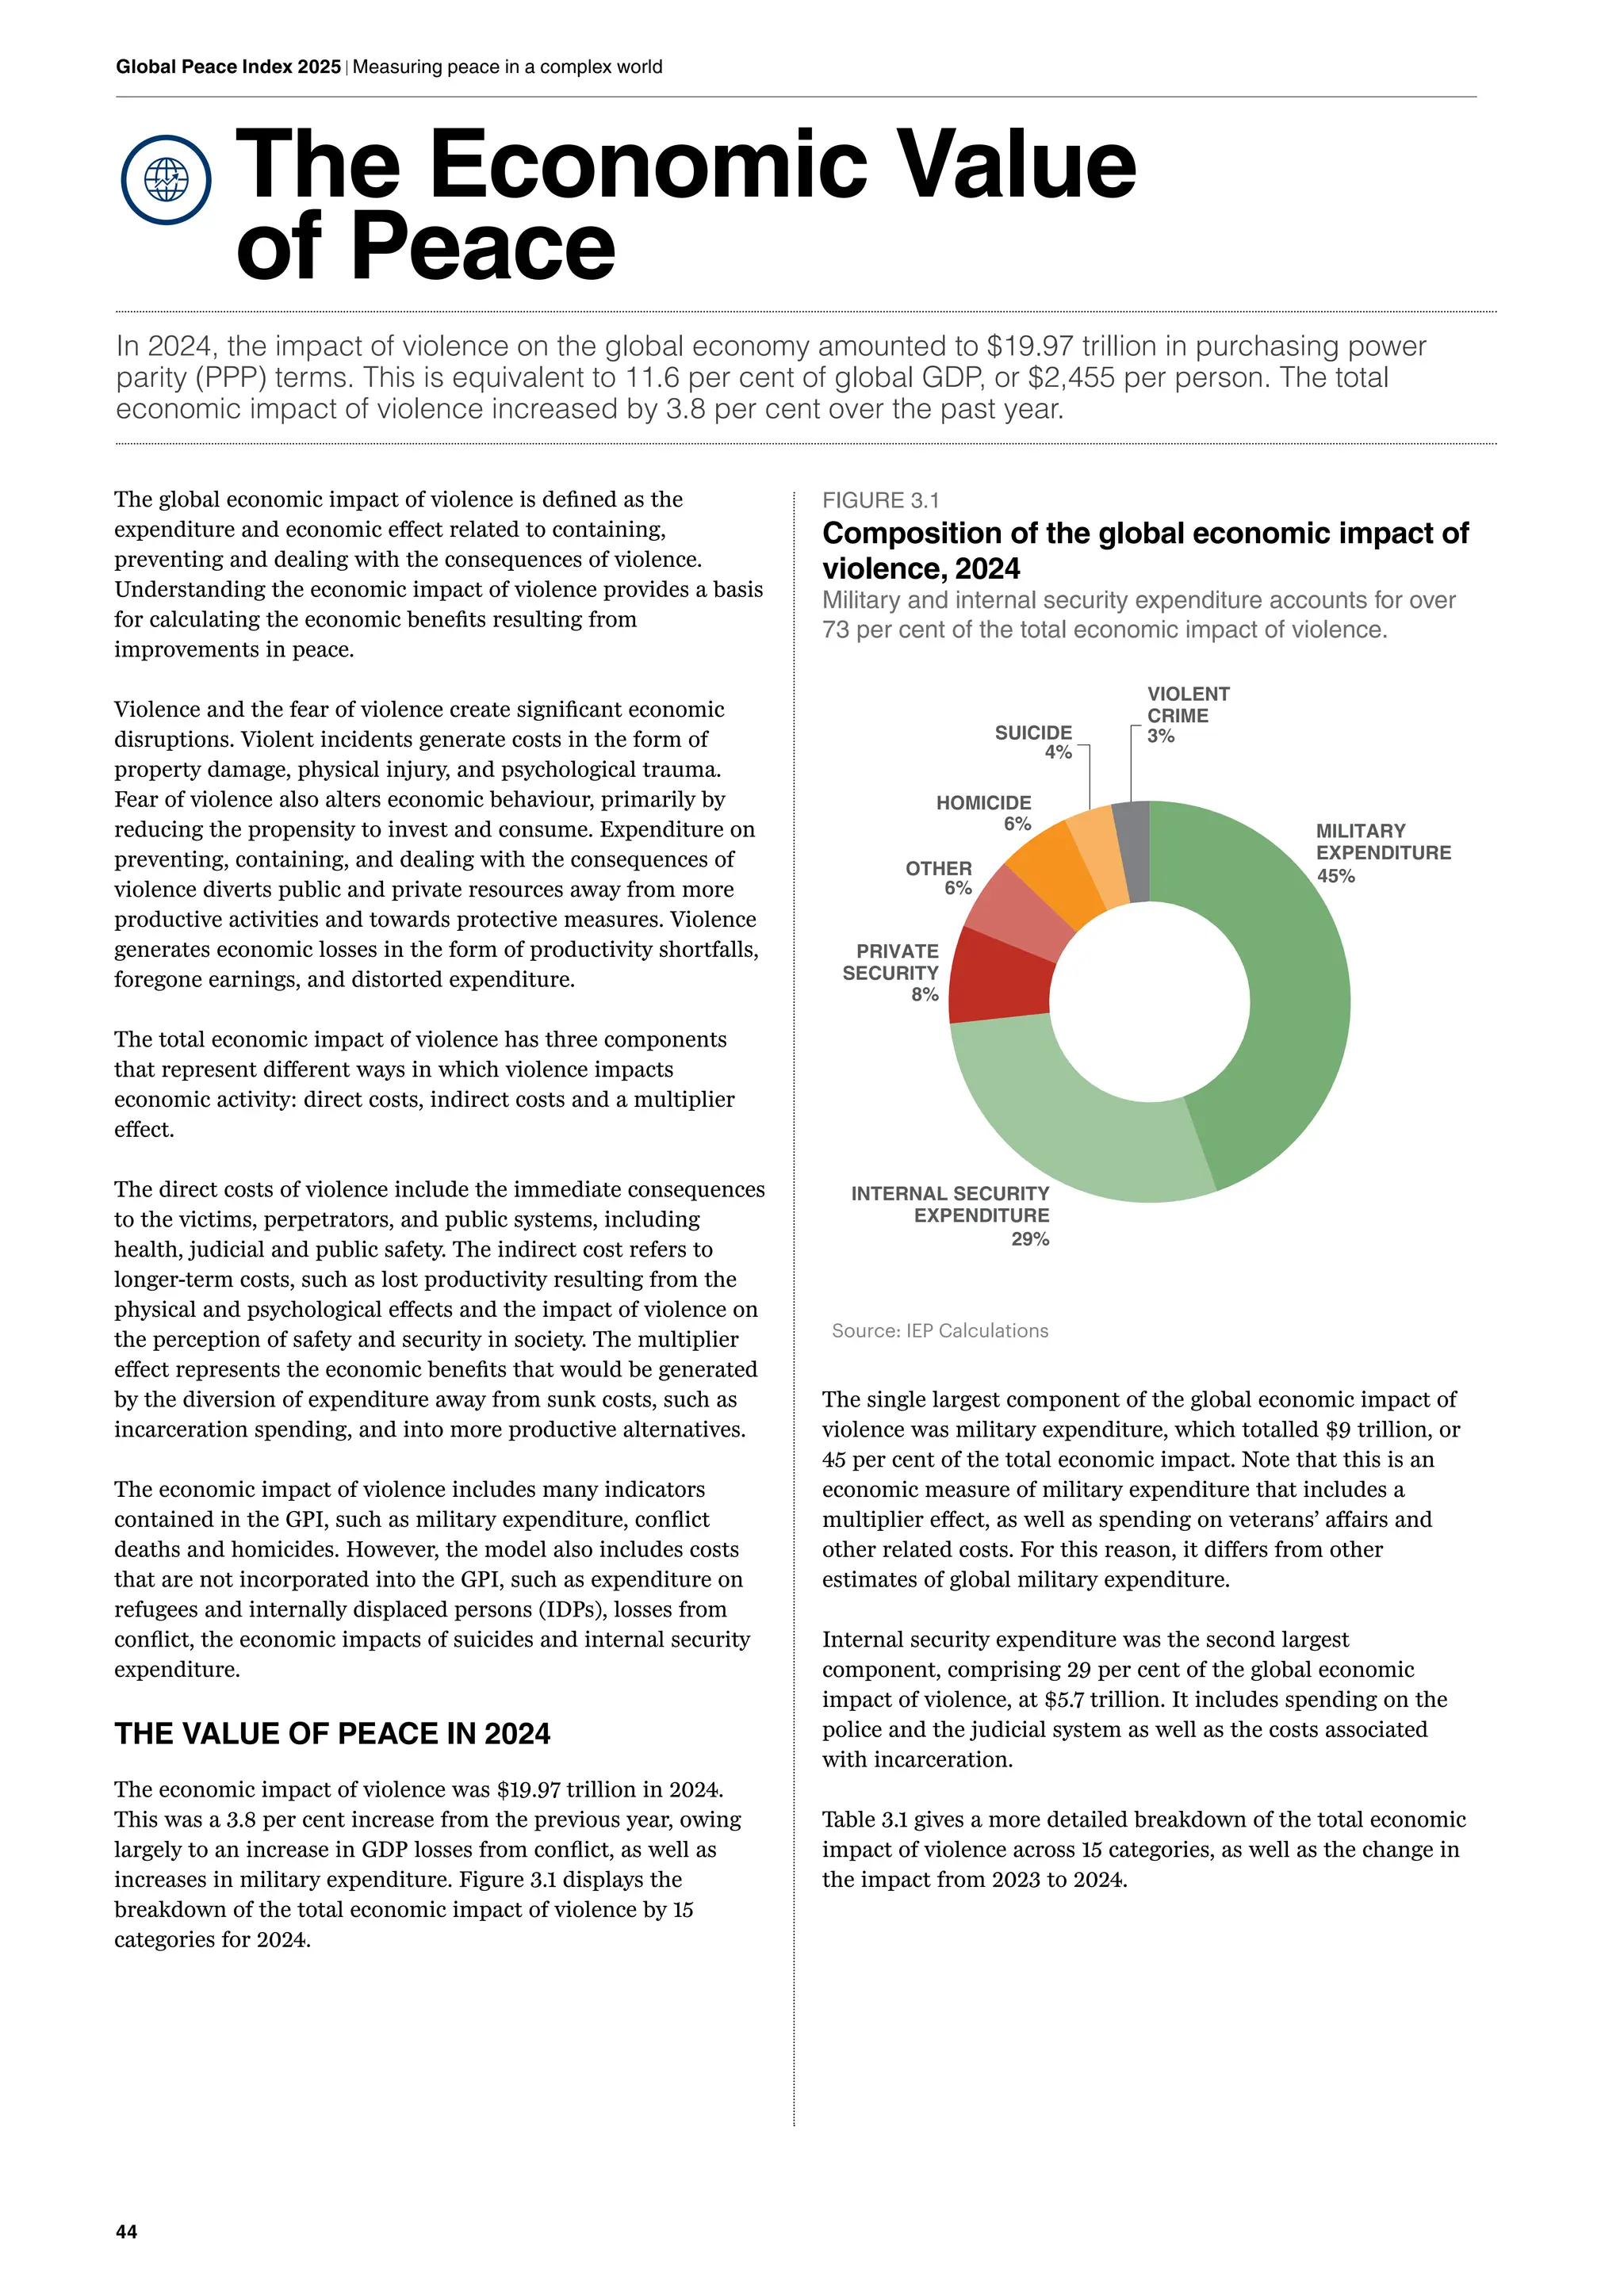
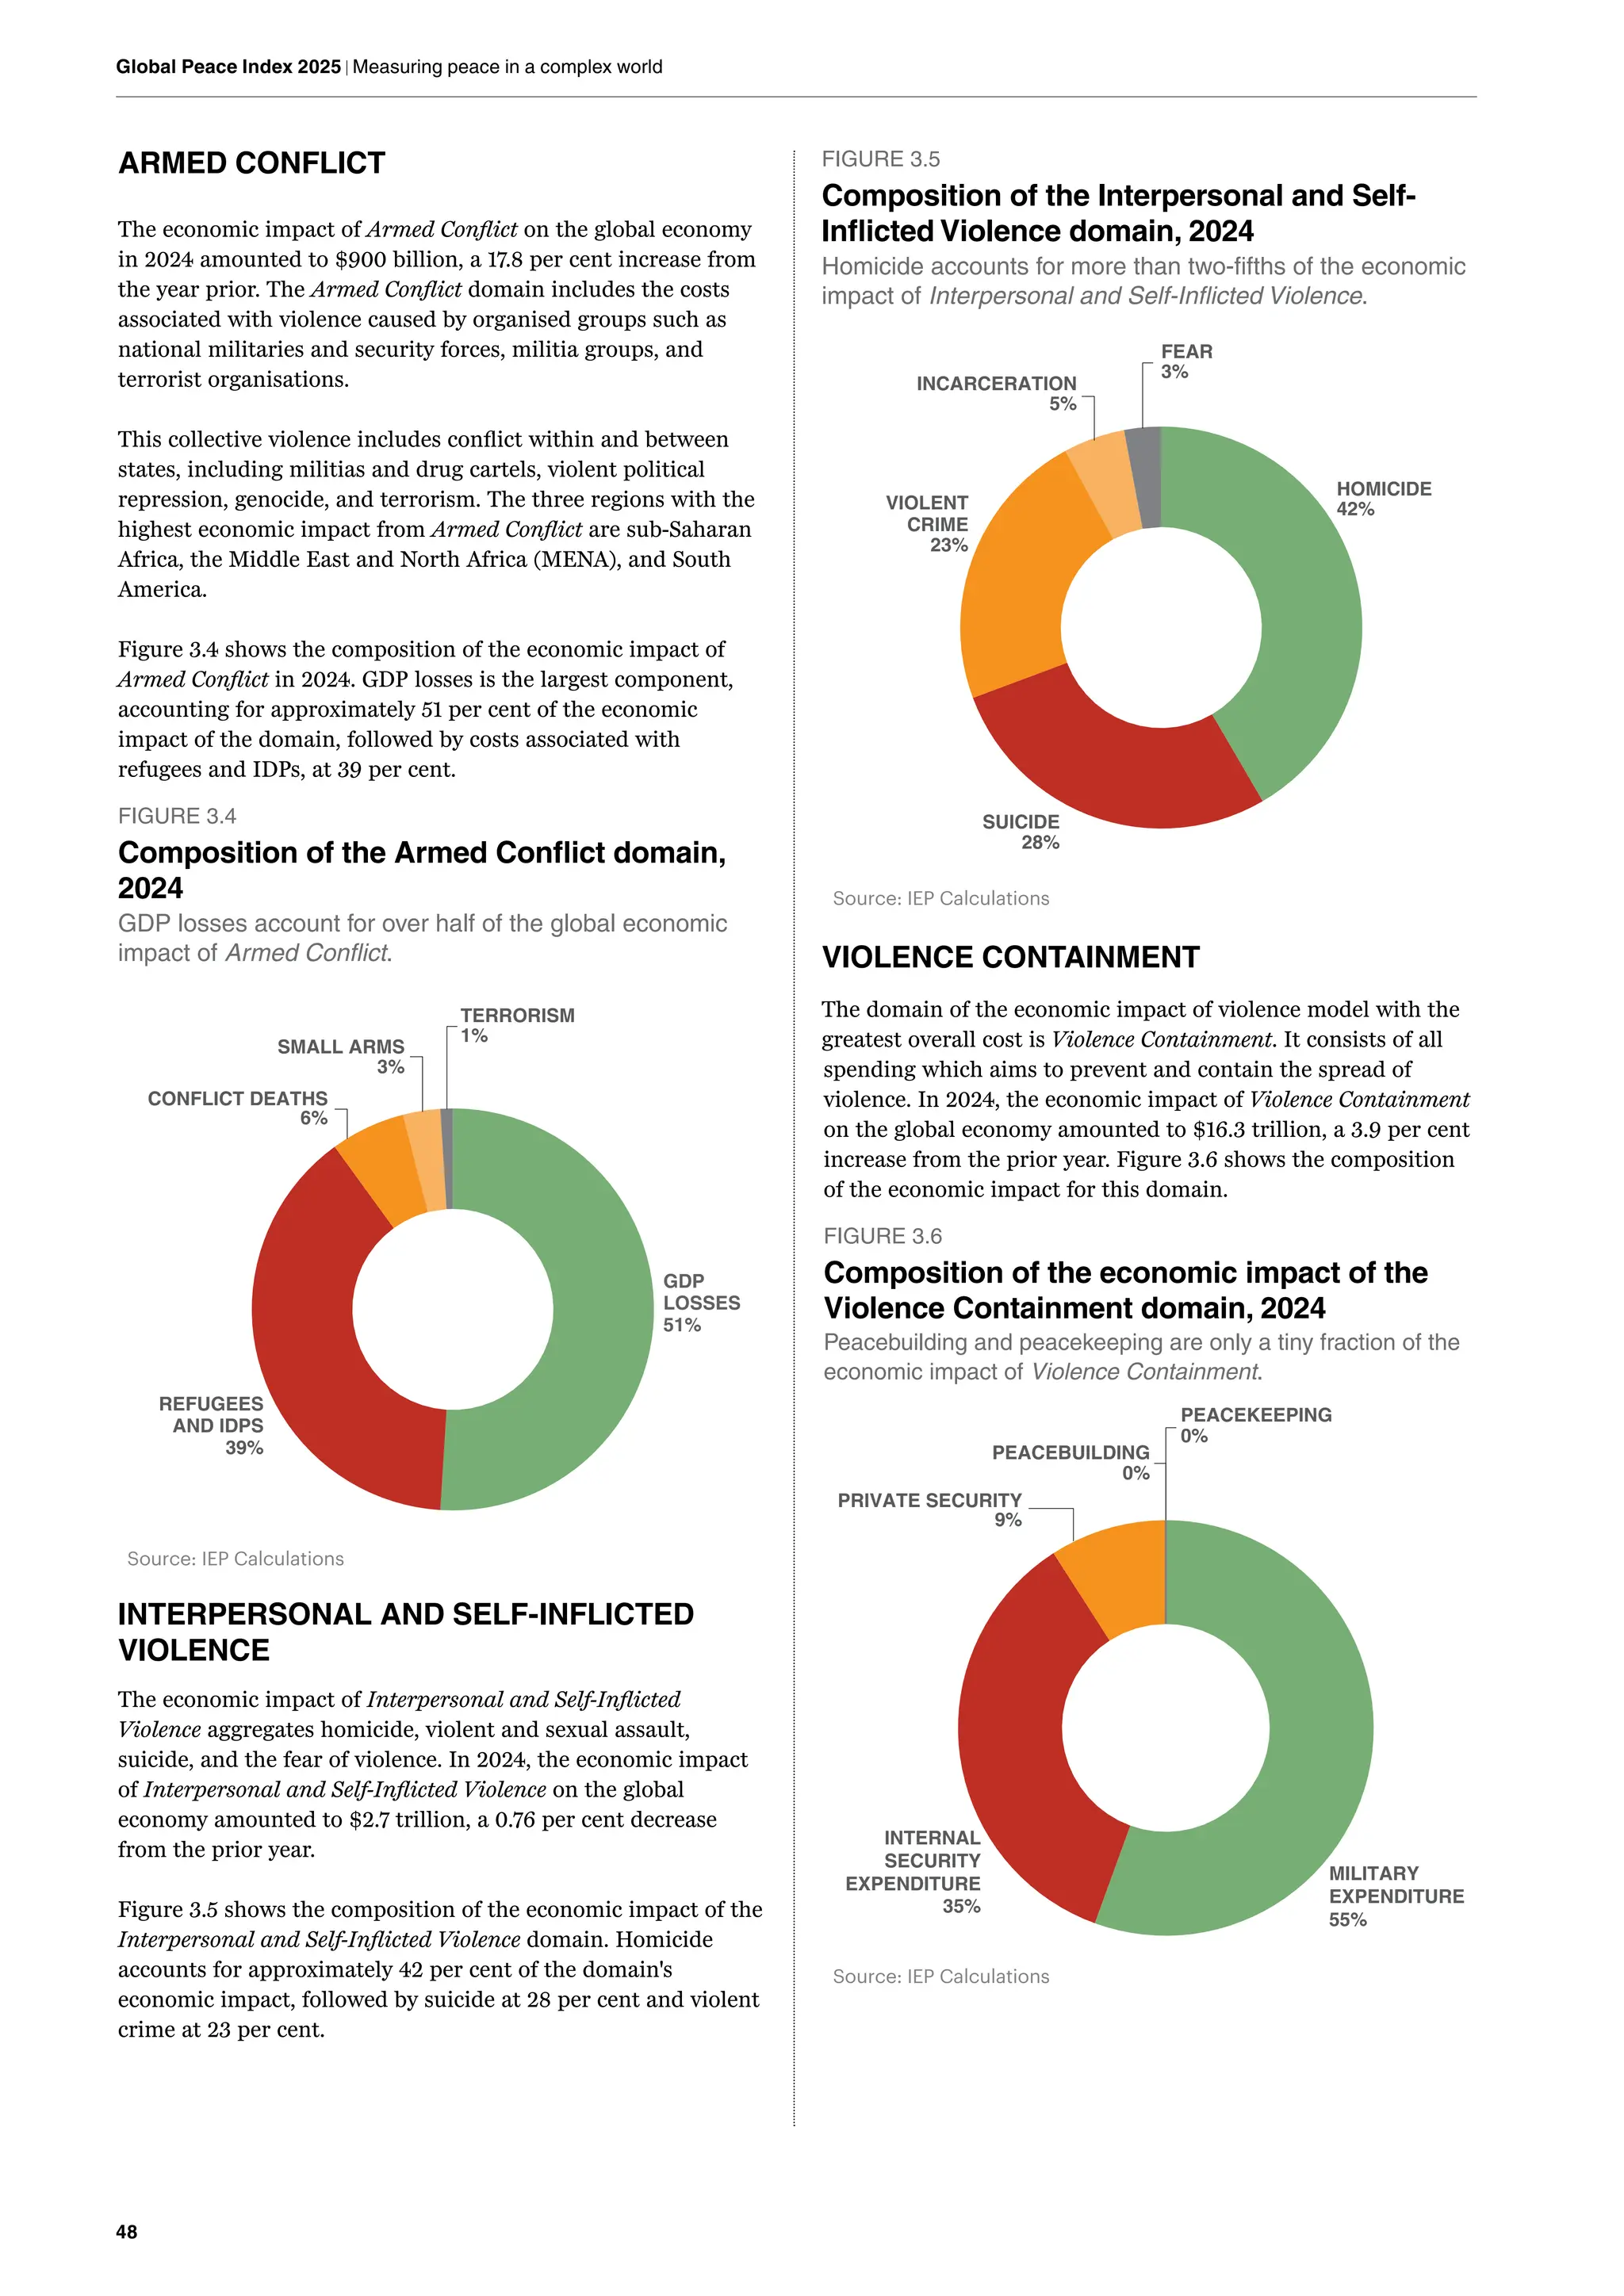
The economic impact of violence on the global economy
in 2024 was $19.97 trillion in purchasing power parity
(PPP) terms. This figure is equivalent to 11.6 per cent of the
world’s economic activity (gross world product), or $2,446
per person. Military and internal security expenditure
accounts for over 74 per cent of the figure, with the impact
of military spending alone accounting for $9 trillion in PPP
terms the past year.
In Europe, adequate military expenditure
is essential to meet emerging threats.
However, Europe’s major challenge
is not increasing military expenditure.
It must also increase the efficiency,
integration and cohesiveness of its
military efforts. European NATO states
outspend Moscow by a wide margin, yet
their combined military capability only
modestly exceeds Russia’s. More raw
military expenditure will not solve this.
Additionally, many European countries
are experiencing increasing polarisation,
and military expenditure crowds out
investment in other productive areas including education,
health and business development. Items that underpin
social cohesion. Given the size of the budget outlays the
societal trade-offs need to be carefully considered.
In summary, the international order is approaching a tipping
point where rising economic fragmentation, accelerating re-
armament and multiple competing spheres of influence are
creating the conditions for the onset of large-scale conflict,
and the associated economic destruction. Underscoring
this is the sheer volume and geographic spread of currently
active conflicts, alongside reductions in proactive conflict
prevention initiatives, including reductions in funding for
peacebuilding and development aid.
The key to building peacefulness in times of conflict
and uncertainty is Positive Peace: the attitudes,
institutions and structures that create and sustain peaceful
societies. Positive Peace is strongly correlated with higher
GDP growth, lower interest rates, societal wellbeing and
more resilience to shocks. Although levels of Positive
Peace improved for over a decade up to 2019, they have
since been in decline, including in both North America and
Europe. Without adequate investment, further deterioration
in peacefulness appears likely.
6.
4
Global Peace Index2025 | Measuring peace in a complex world
Key Findings
Section 1 – Results
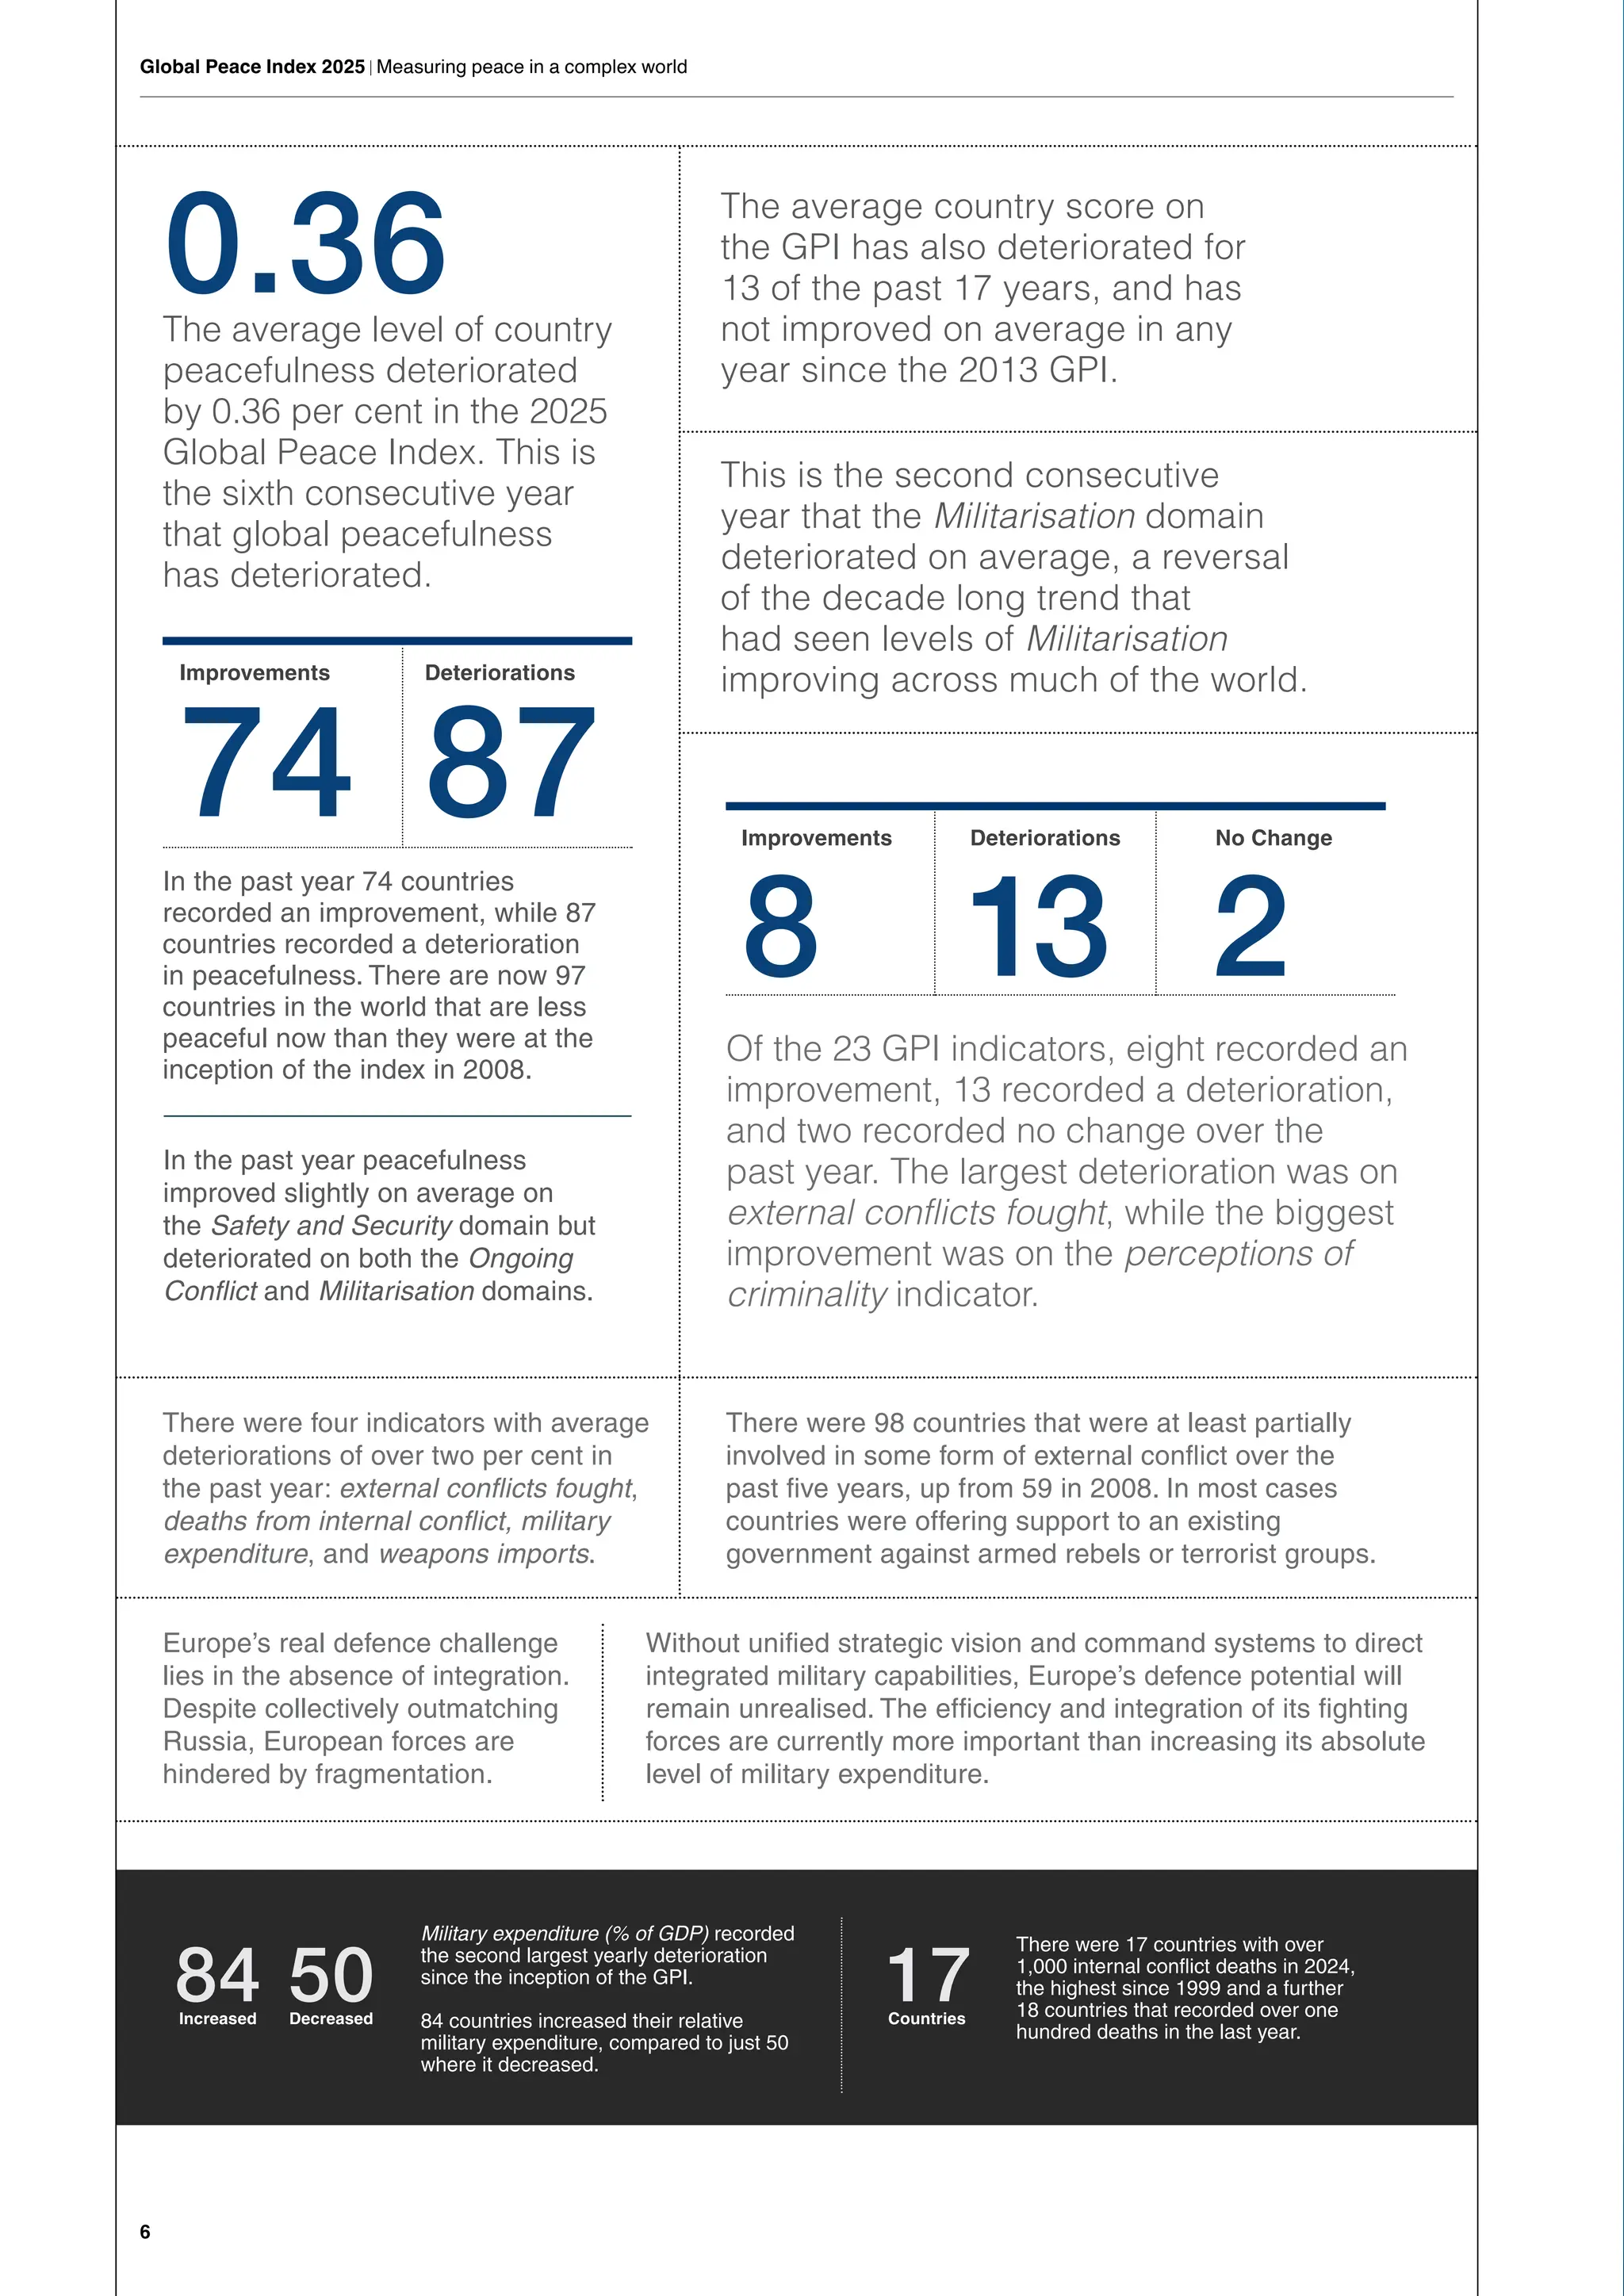
• The average level of country peacefulness deteriorated by 0.36 per
cent in the 2025 Global Peace Index. This is the sixth consecutive
year that global peacefulness has deteriorated.
• The average country score on the GPI has also deteriorated for 13
of the past 17 years, and has not improved on average in any year
since the 2013 GPI.
• In the past year, 74 countries recorded an improvement, while 87
countries recorded a deterioration in peacefulness. There are now
97 countries in the world that are less peaceful now than they were
at the inception of the index in 2008.
• In the past year, peacefulness improved slightly on average on the
Safety and Security domain but deteriorated on both the Ongoing
Conflict and Militarisation domains.
• This is the second consecutive year that the Militarisation domain
deteriorated on average, a reversal of the decade long trend that
had seen levels of Militarisation improving across much of the world.
• Of the 23 GPI indicators, eight recorded an improvement, 13
recorded a deterioration, and two recorded no change over the past
year. The largest deterioration was on external conflicts fought, while
the biggest improvement was on the perceptions of criminality
indicator.
• There were four indicators with average deteriorations of over two
per cent in the past year: external conflicts fought, deaths from
internal conflict, military expenditure, and weapons imports.
• There were 98 countries that were at least partially involved in some
form of external conflict over the past five years, up from 59 in 2008.
In most cases countries were offering support to an existing
government against armed rebels or terrorist groups.
• Military expenditure (% of GDP) recorded the second largest yearly
deterioration since the inception of the GPI. Eighty-four countries
increased their relative military expenditure, compared to just 50
where it decreased.
• There were 17 countries with over 1,000 internal conflict deaths in
2024, the highest since 1999, and a further 18 countries that
recorded over one hundred deaths in the last year.
• Many European countries are increasing their military expenditure
as a result of the war in Ukraine. However, raw military expenditure
is not the most pressing issue.
• Europe is experiencing increasing social tensions and declining
public trust in its institutions. The reallocation of public funds from
employment, healthcare and education towards defence heightens
the risk of further exacerbating these tensions.
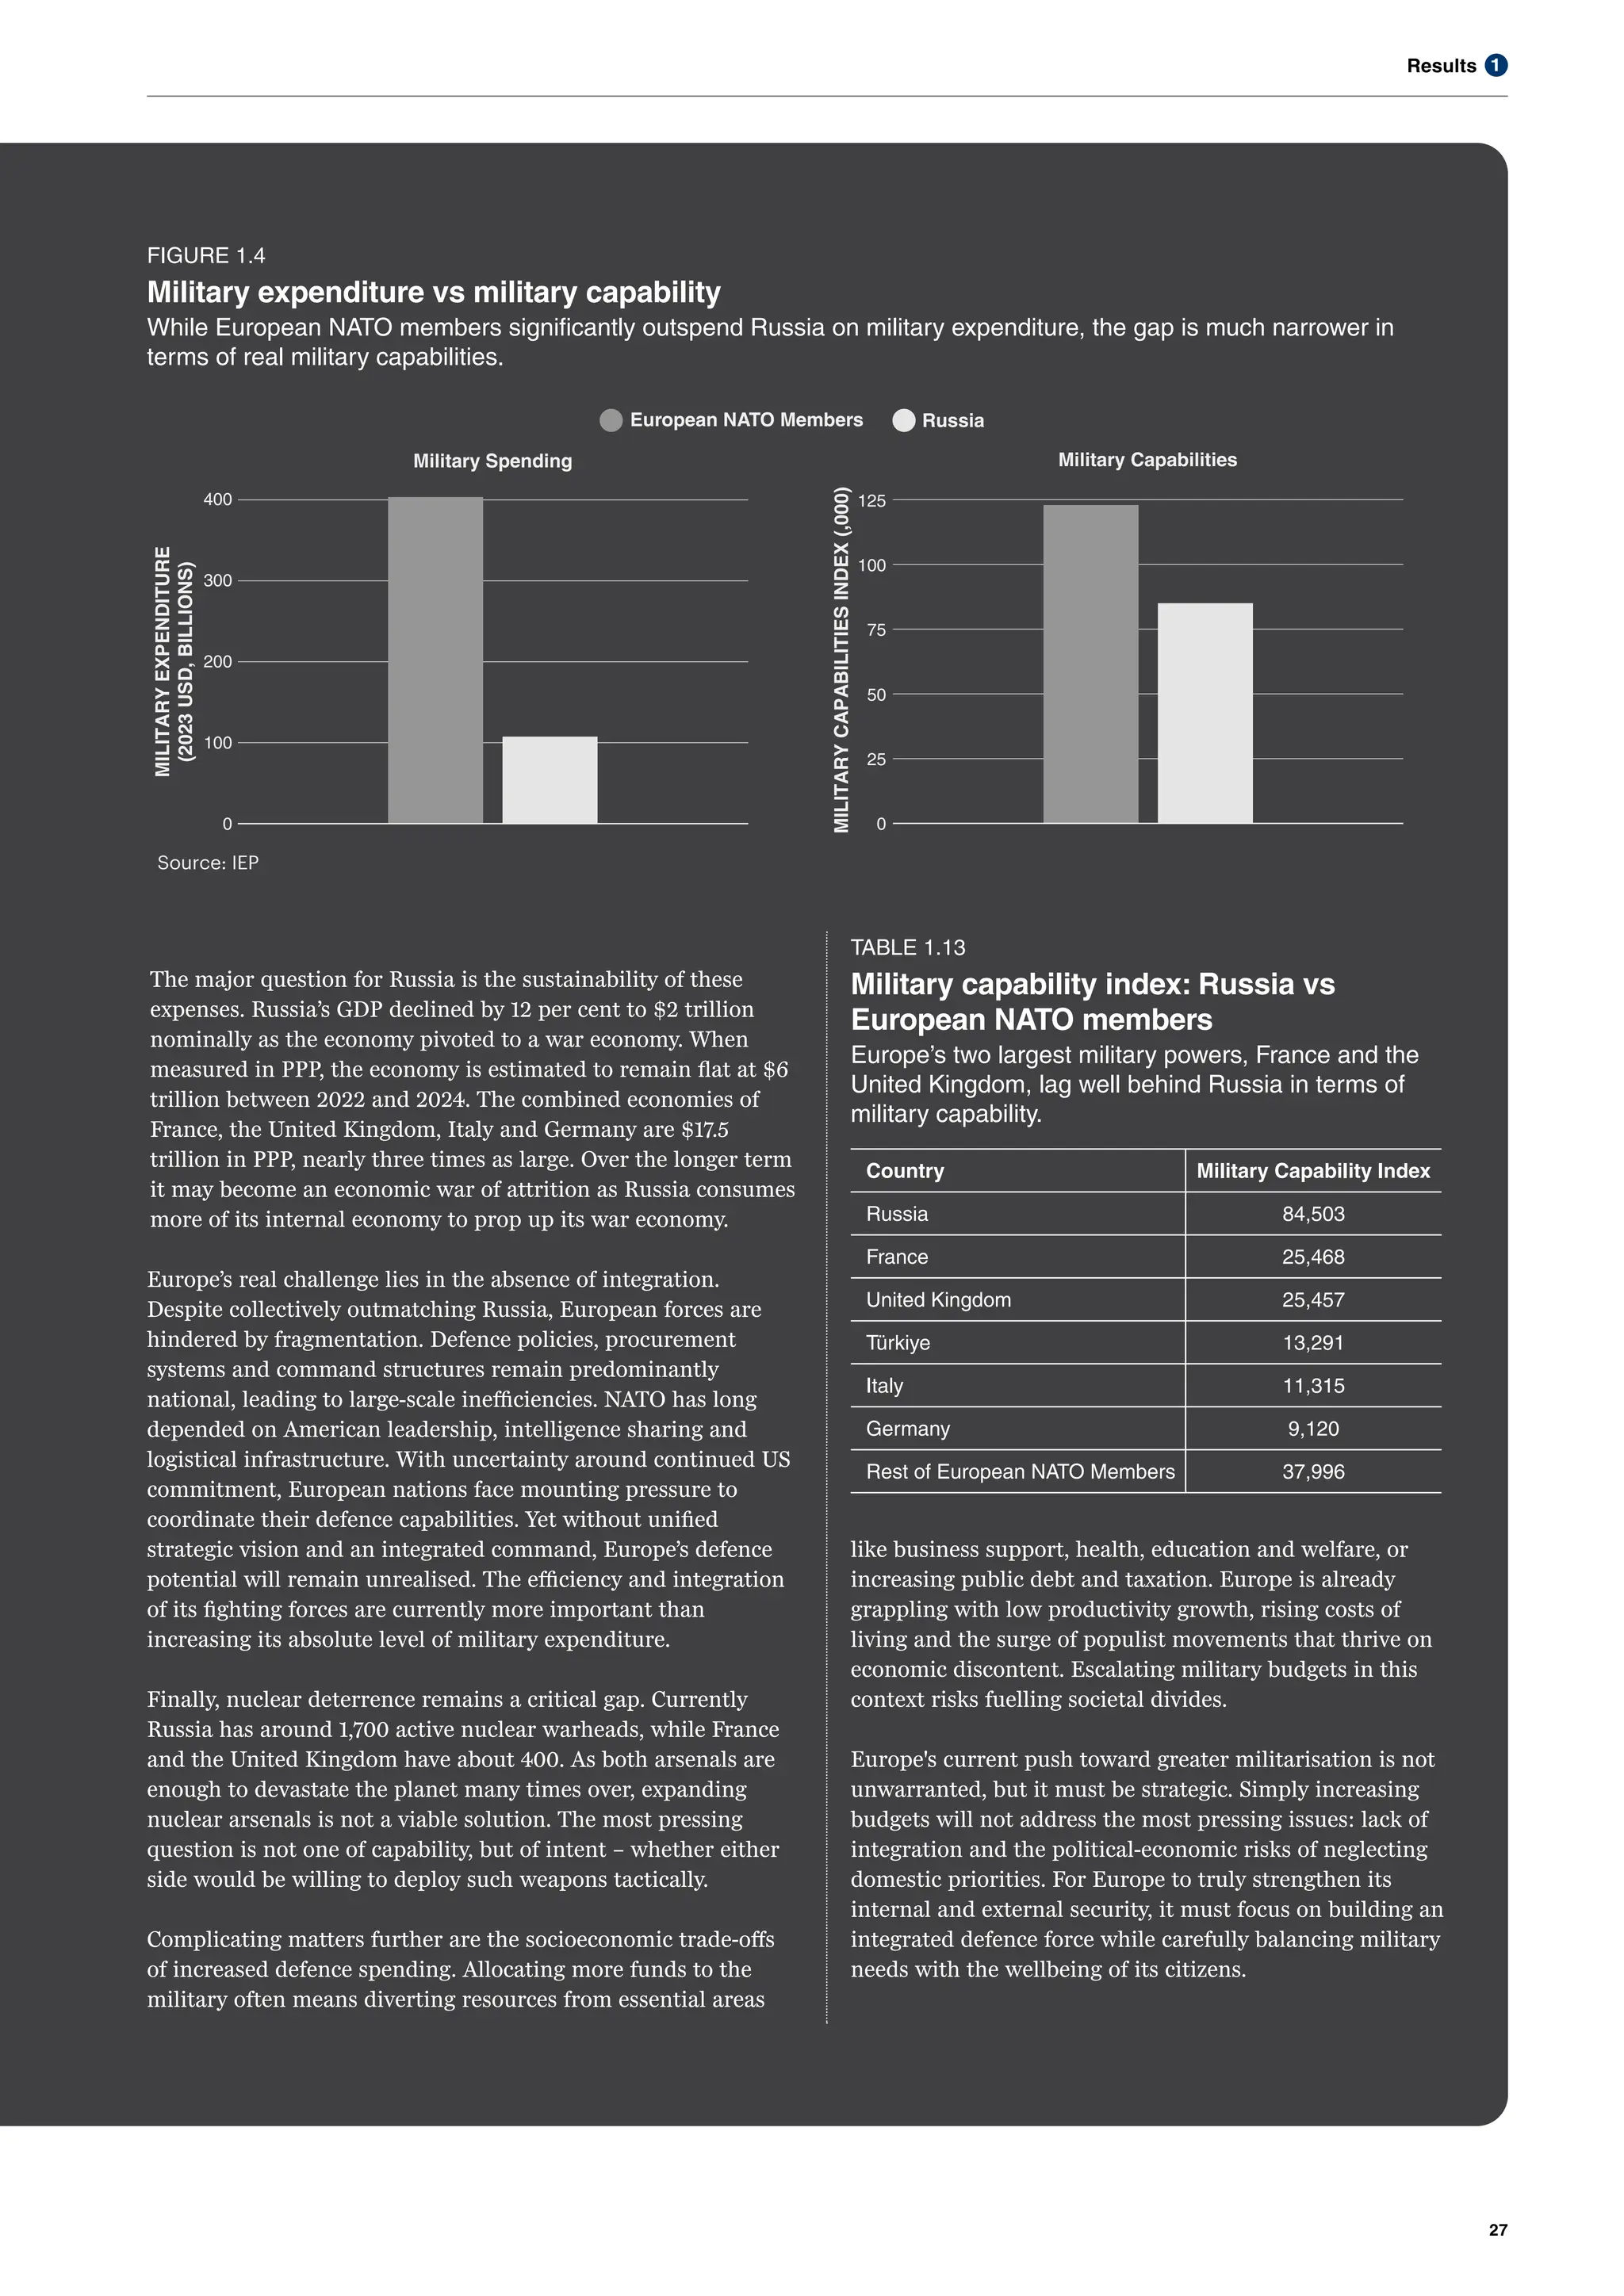
• Europe’s real defence challenge lies in the absence of integration.
Despite collectively outmatching Russia, European forces are
hindered by fragmentation.
• Europe’s current military expenditure is almost four times that of
Russia, but its combined military capacity is only one third higher.
• Without unified strategic vision and command systems to direct
integrated military capabilities, Europe’s defence potential will
remain unrealised. The efficiency and integration of its fighting
forces are currently more important than increasing its absolute level
of military expenditure.
Section 2 – Trends
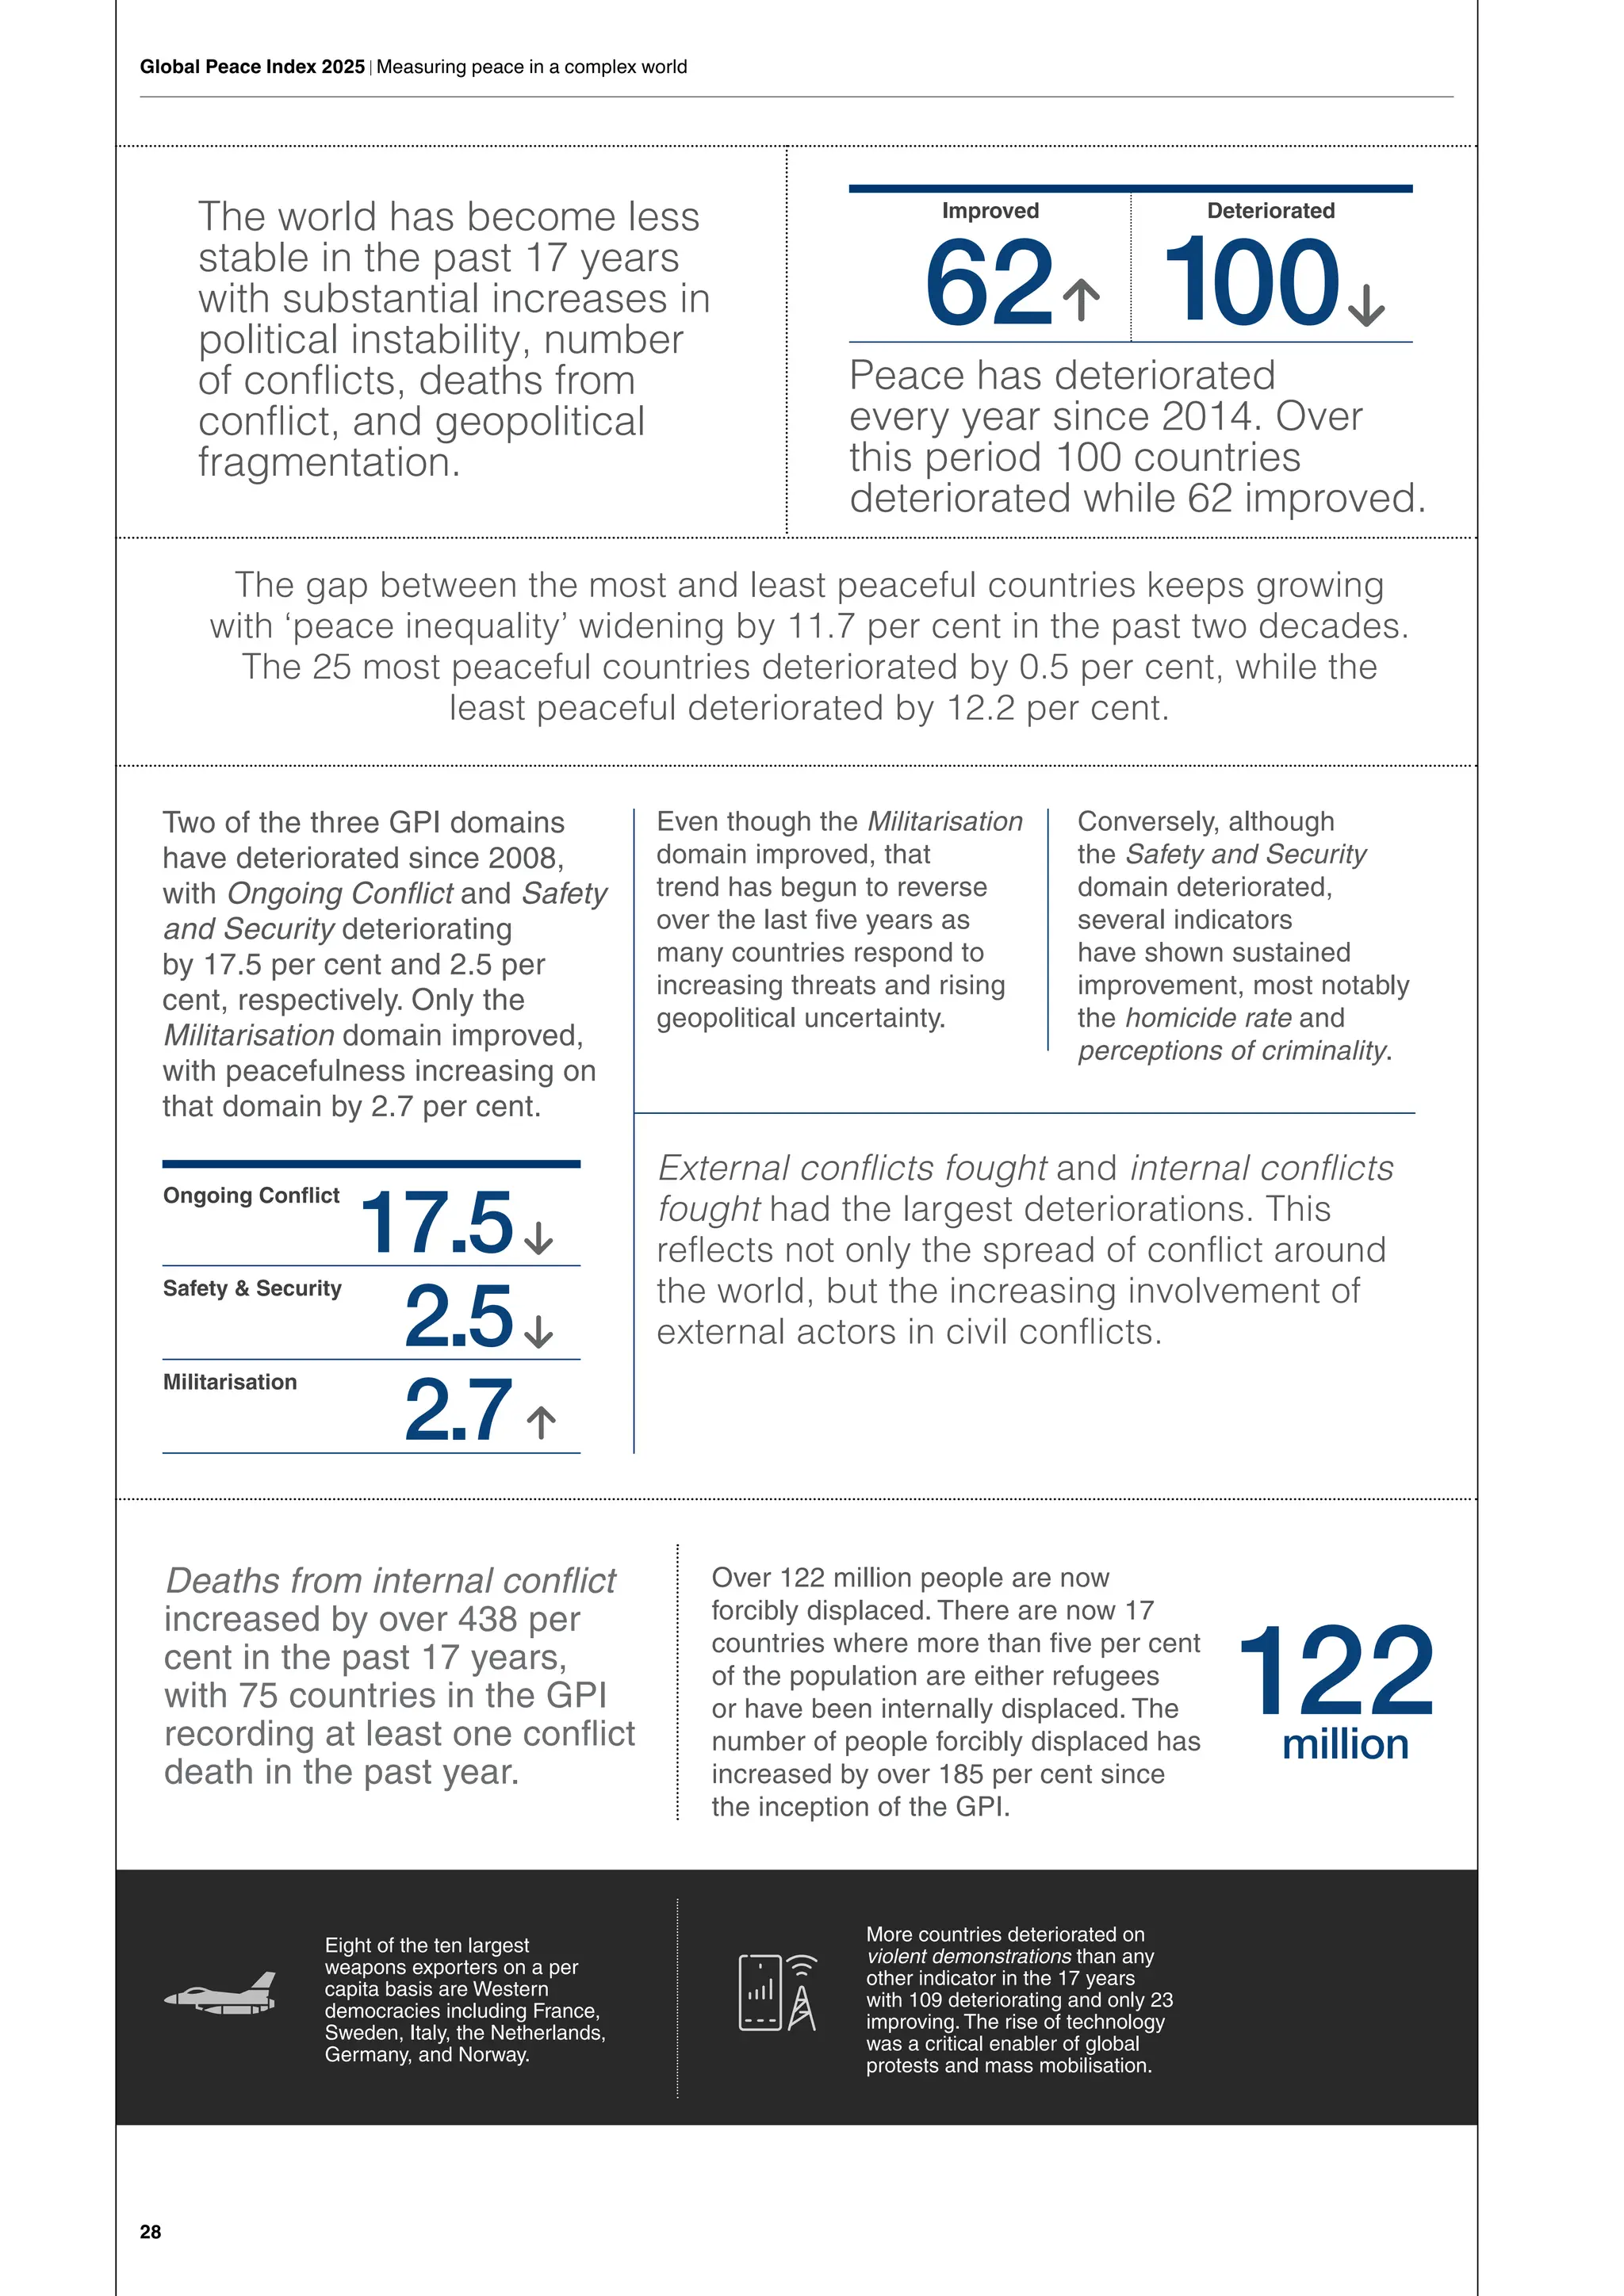
• Global stability has deteriorated over the past 17 years, marked by
substantial increases in political instability, the number and intensity
of conflicts, deaths from conflict, and increasing geopolitical
fragmentation.
• Peace has deteriorated every year since 2014. Over this period, 100
countries deteriorated and only 62 improved.
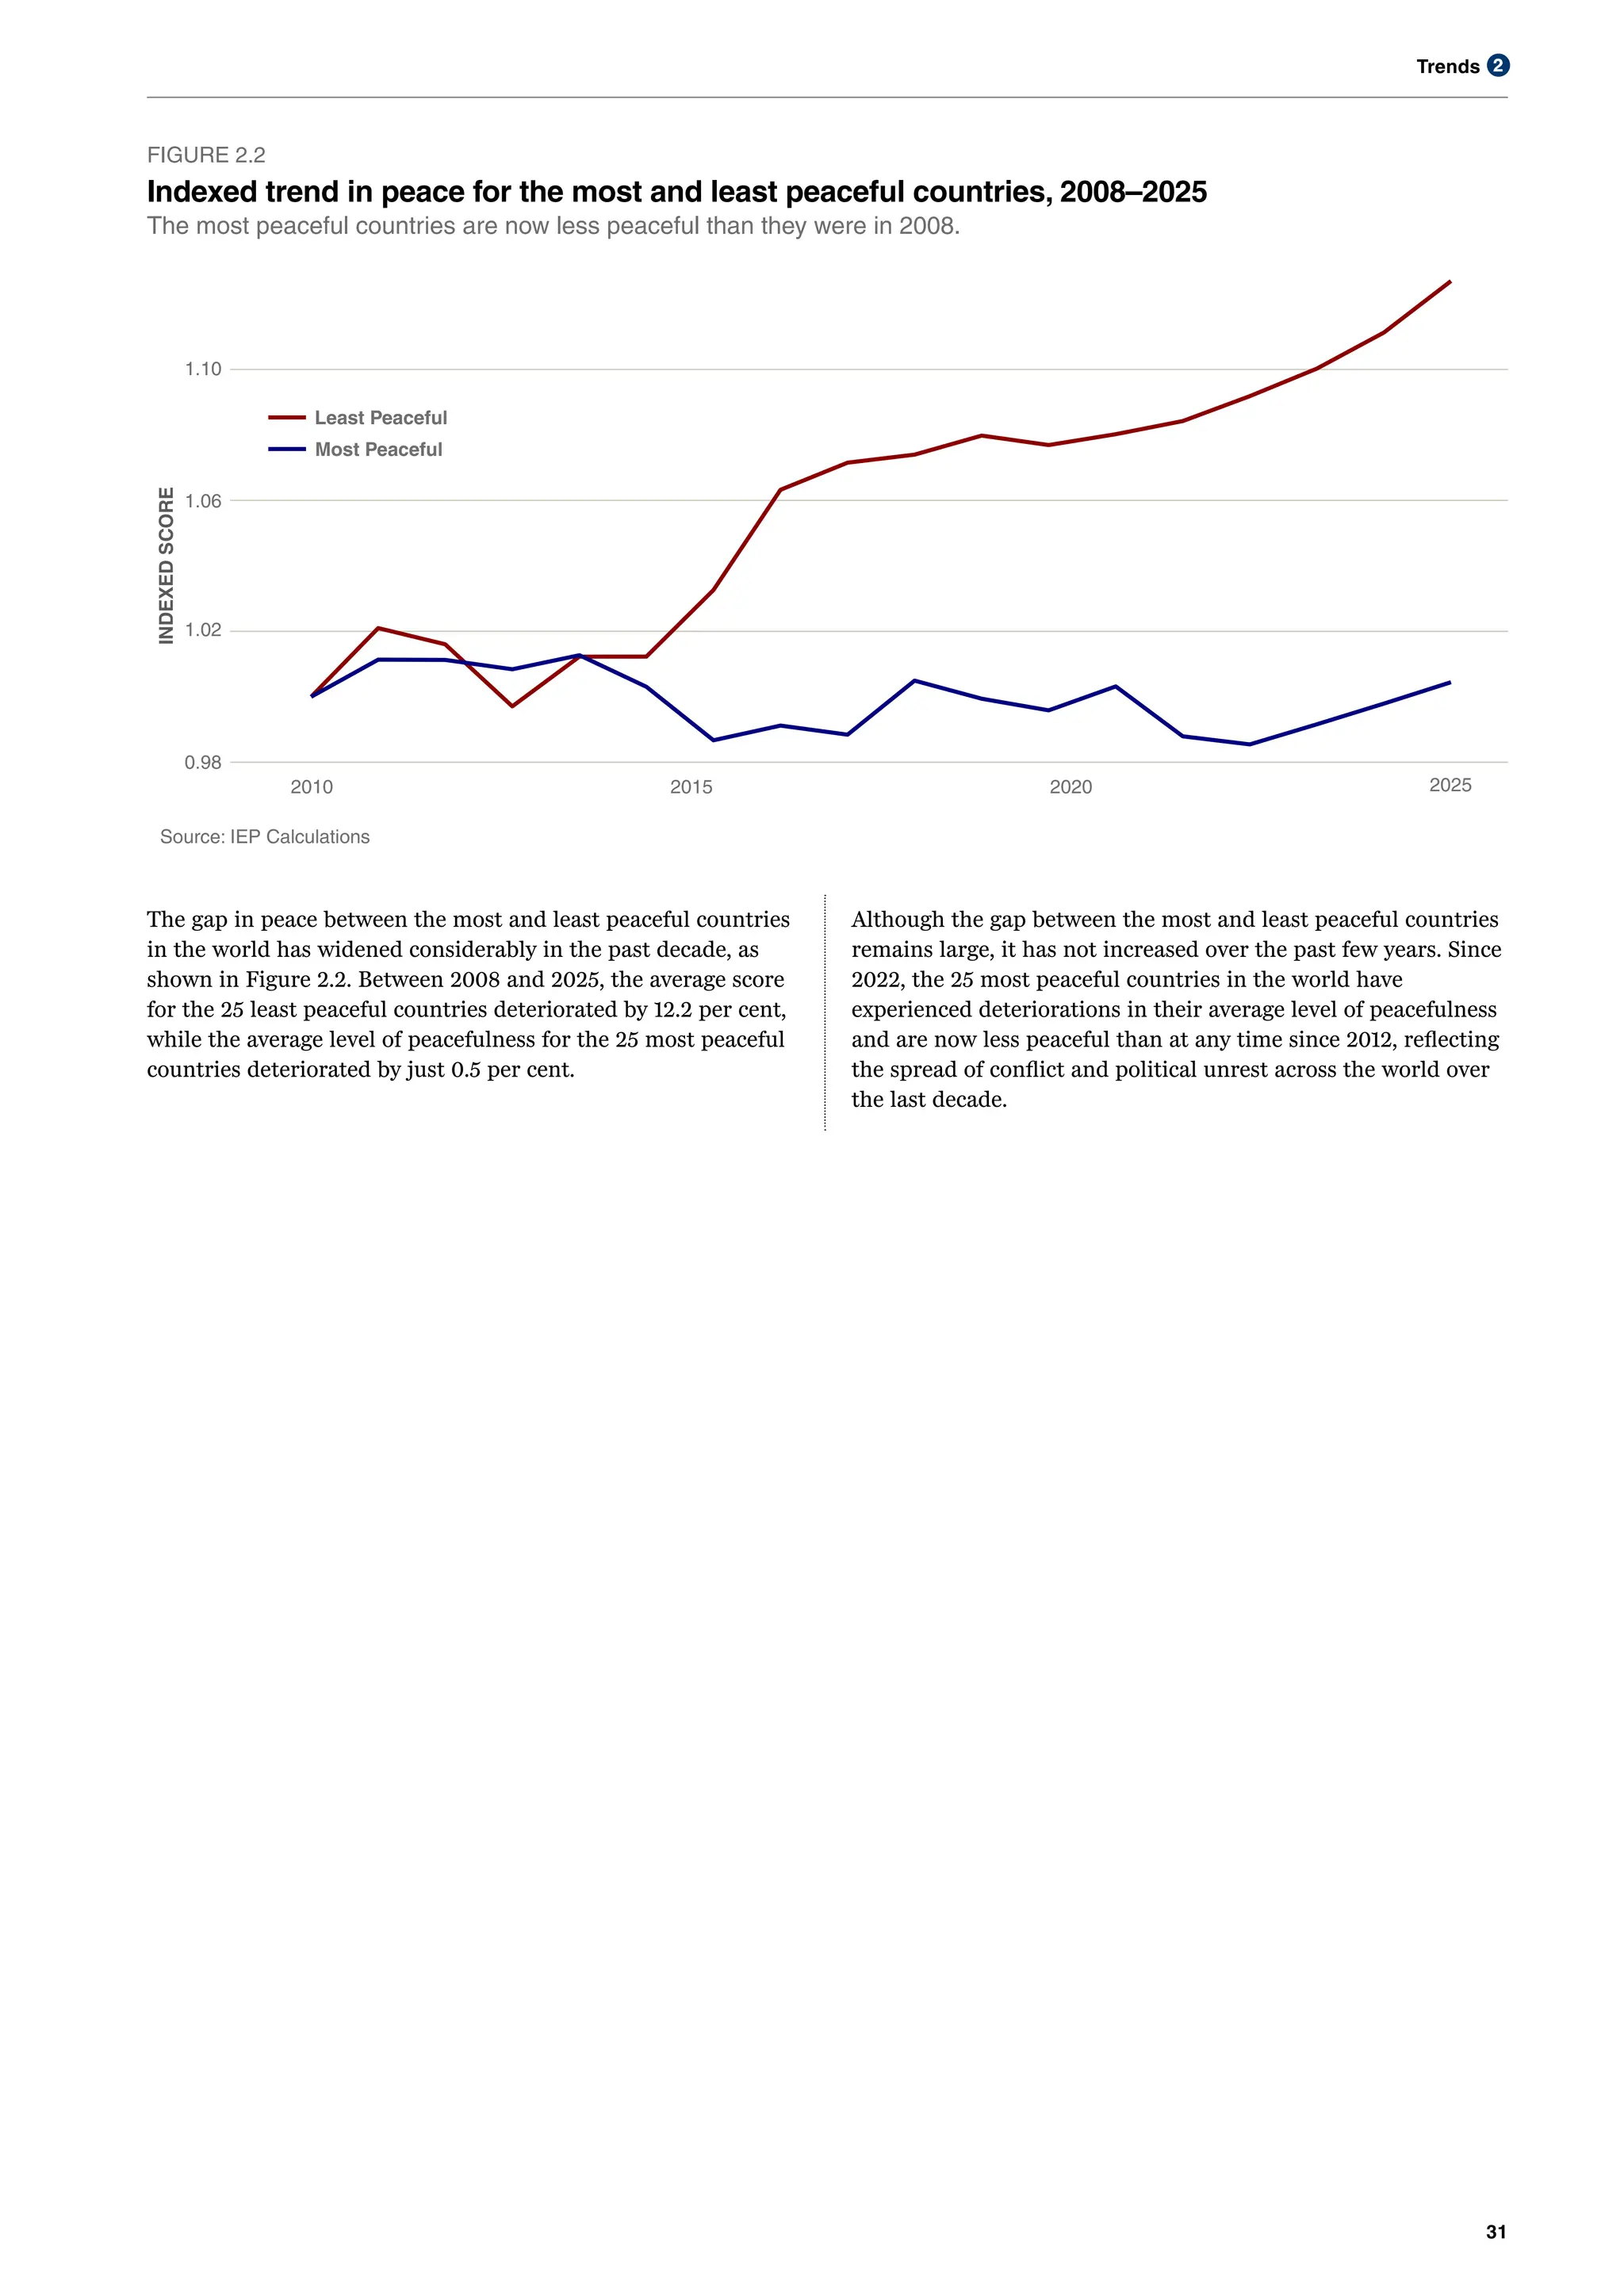
• The gap between the most and least peaceful countries continues
to grow, with ‘peace inequality’ widening by 11.7 per cent in the past
two decades. The 25 most peaceful countries deteriorated by 0.5
per cent, while the least peaceful deteriorated by 12.2 per cent.
• Two of the three GPI domains have deteriorated since 2008, with
Ongoing Conflict and Safety and Security deteriorating by 17.5 per
cent and 2.5 per cent, respectively. Only the Militarisation domain
improved, with peacefulness increasing on that domain by 2.7 per
cent.
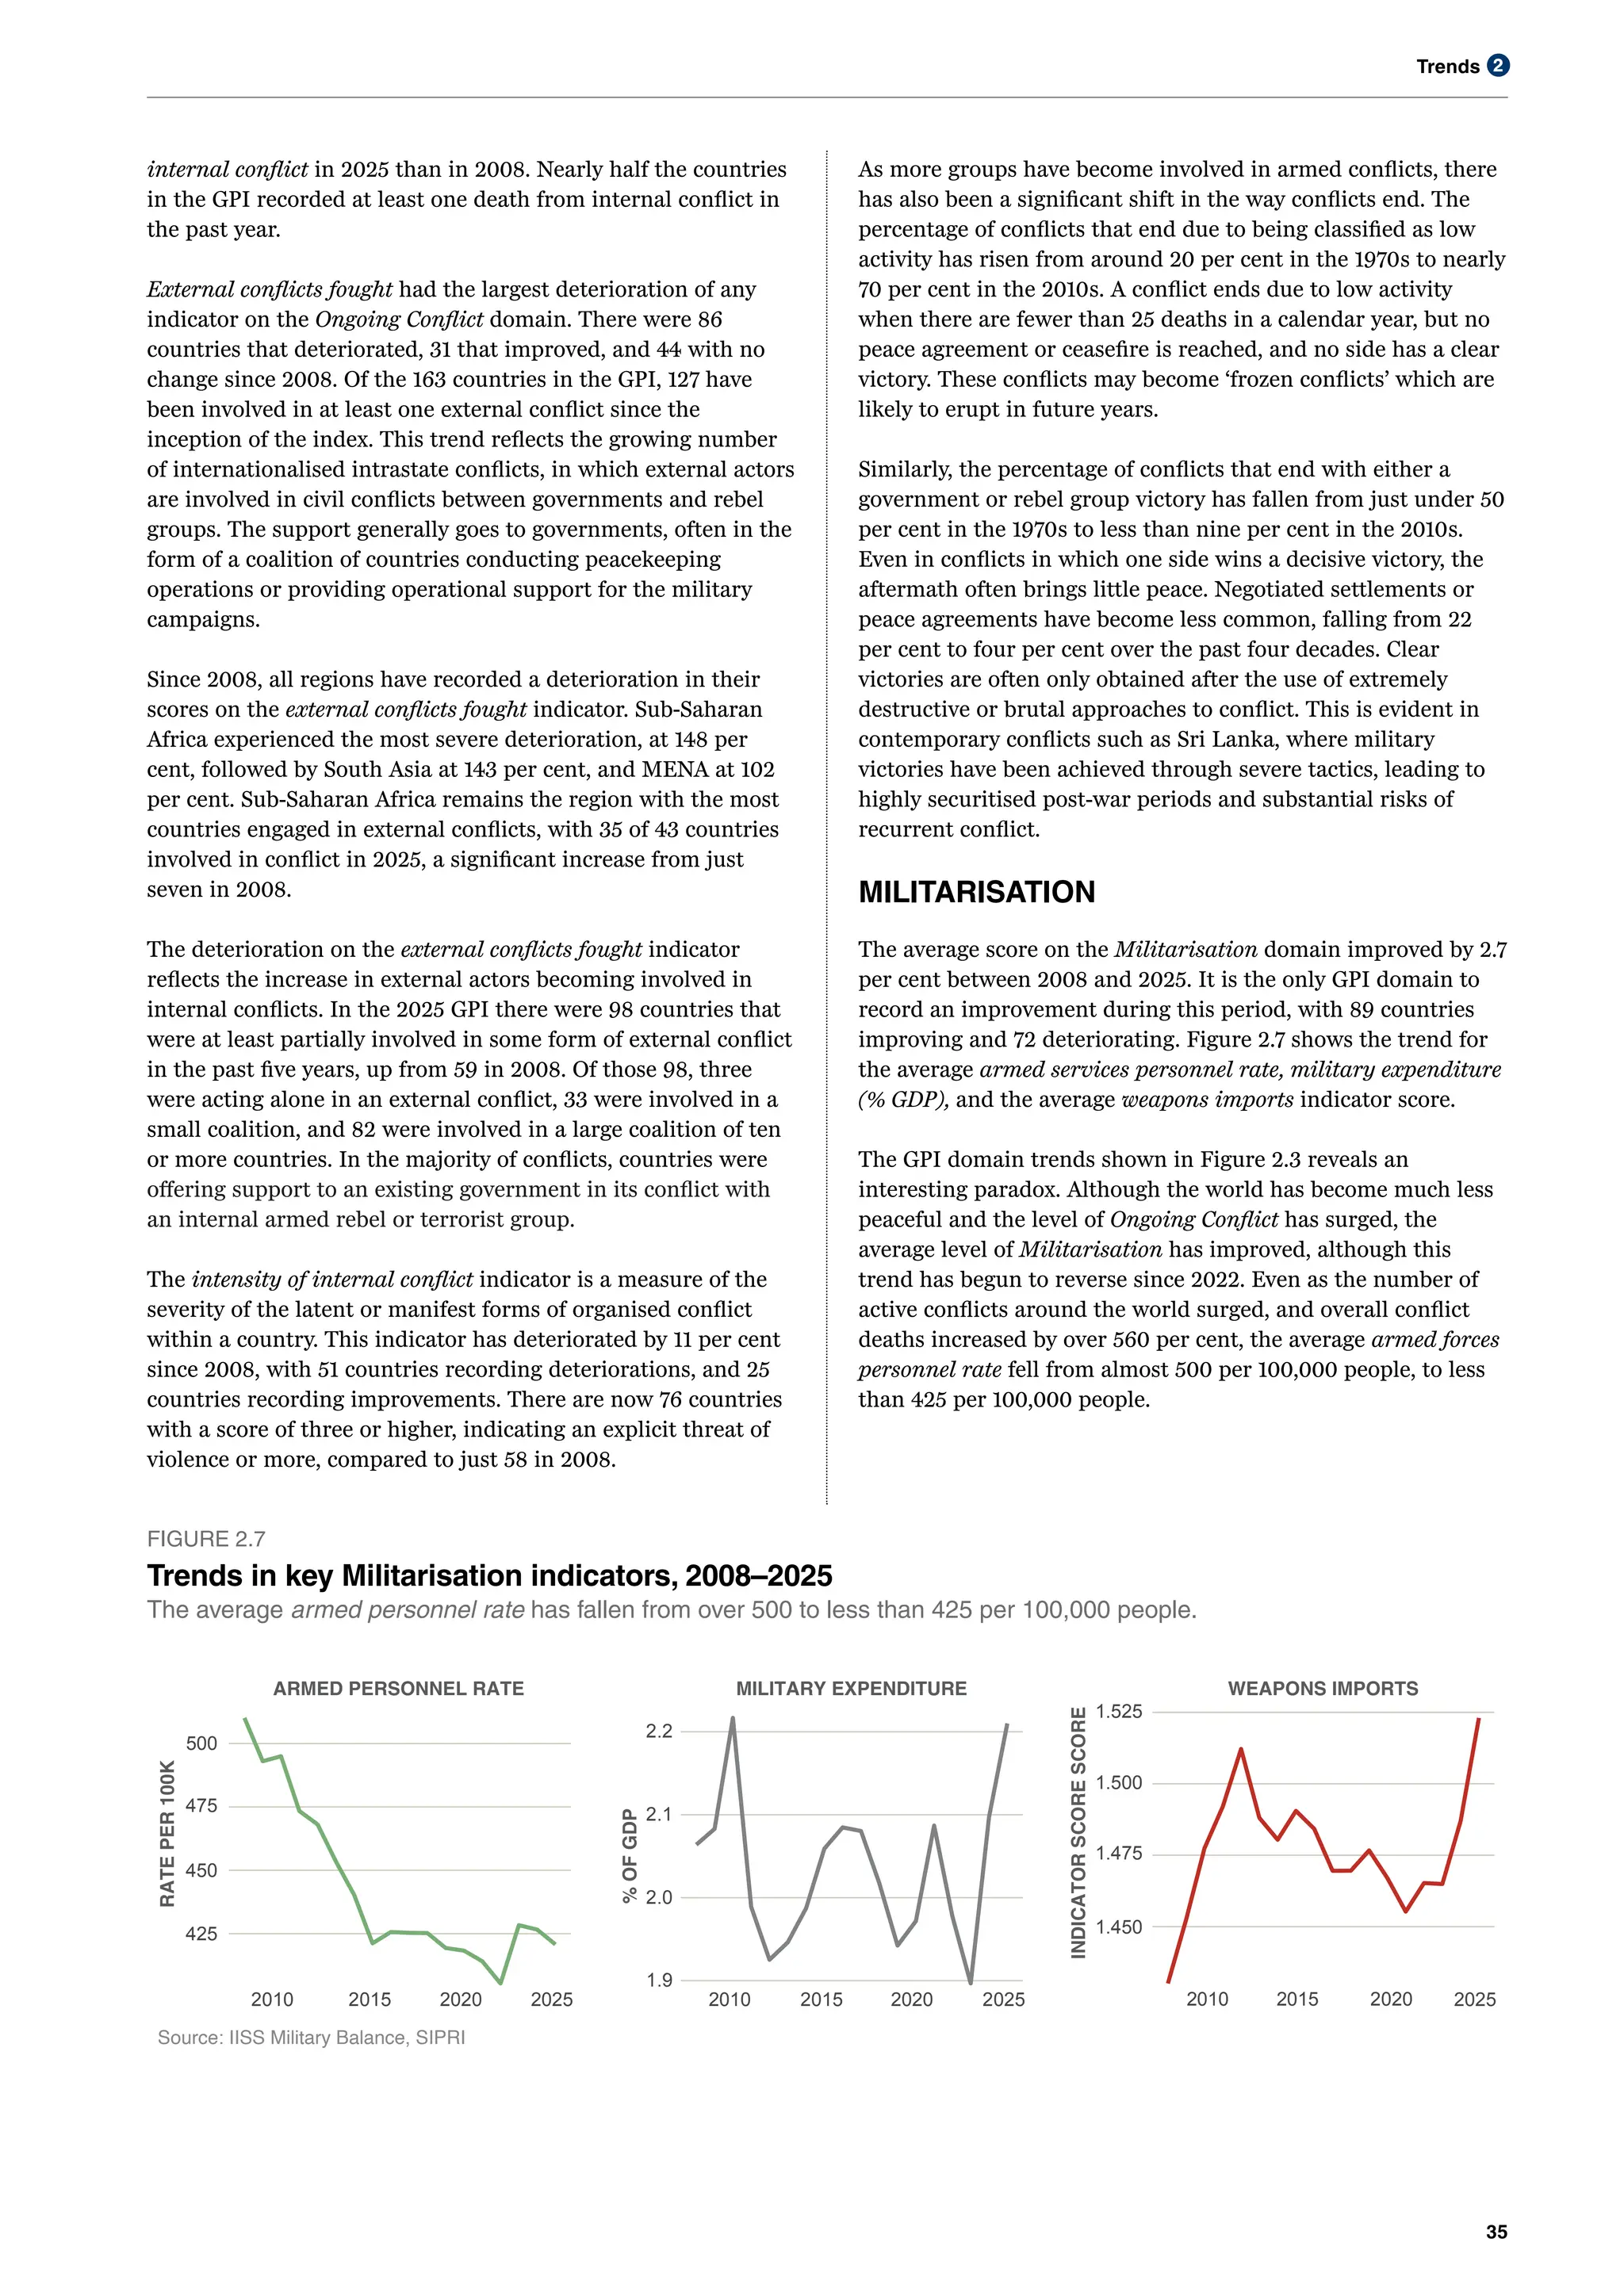
• Though the Militarisation domain improved since 2008, that trend
has begun to reverse over the last five years as many countries
respond to an increasing number of threats and rising geopolitical
uncertainty.
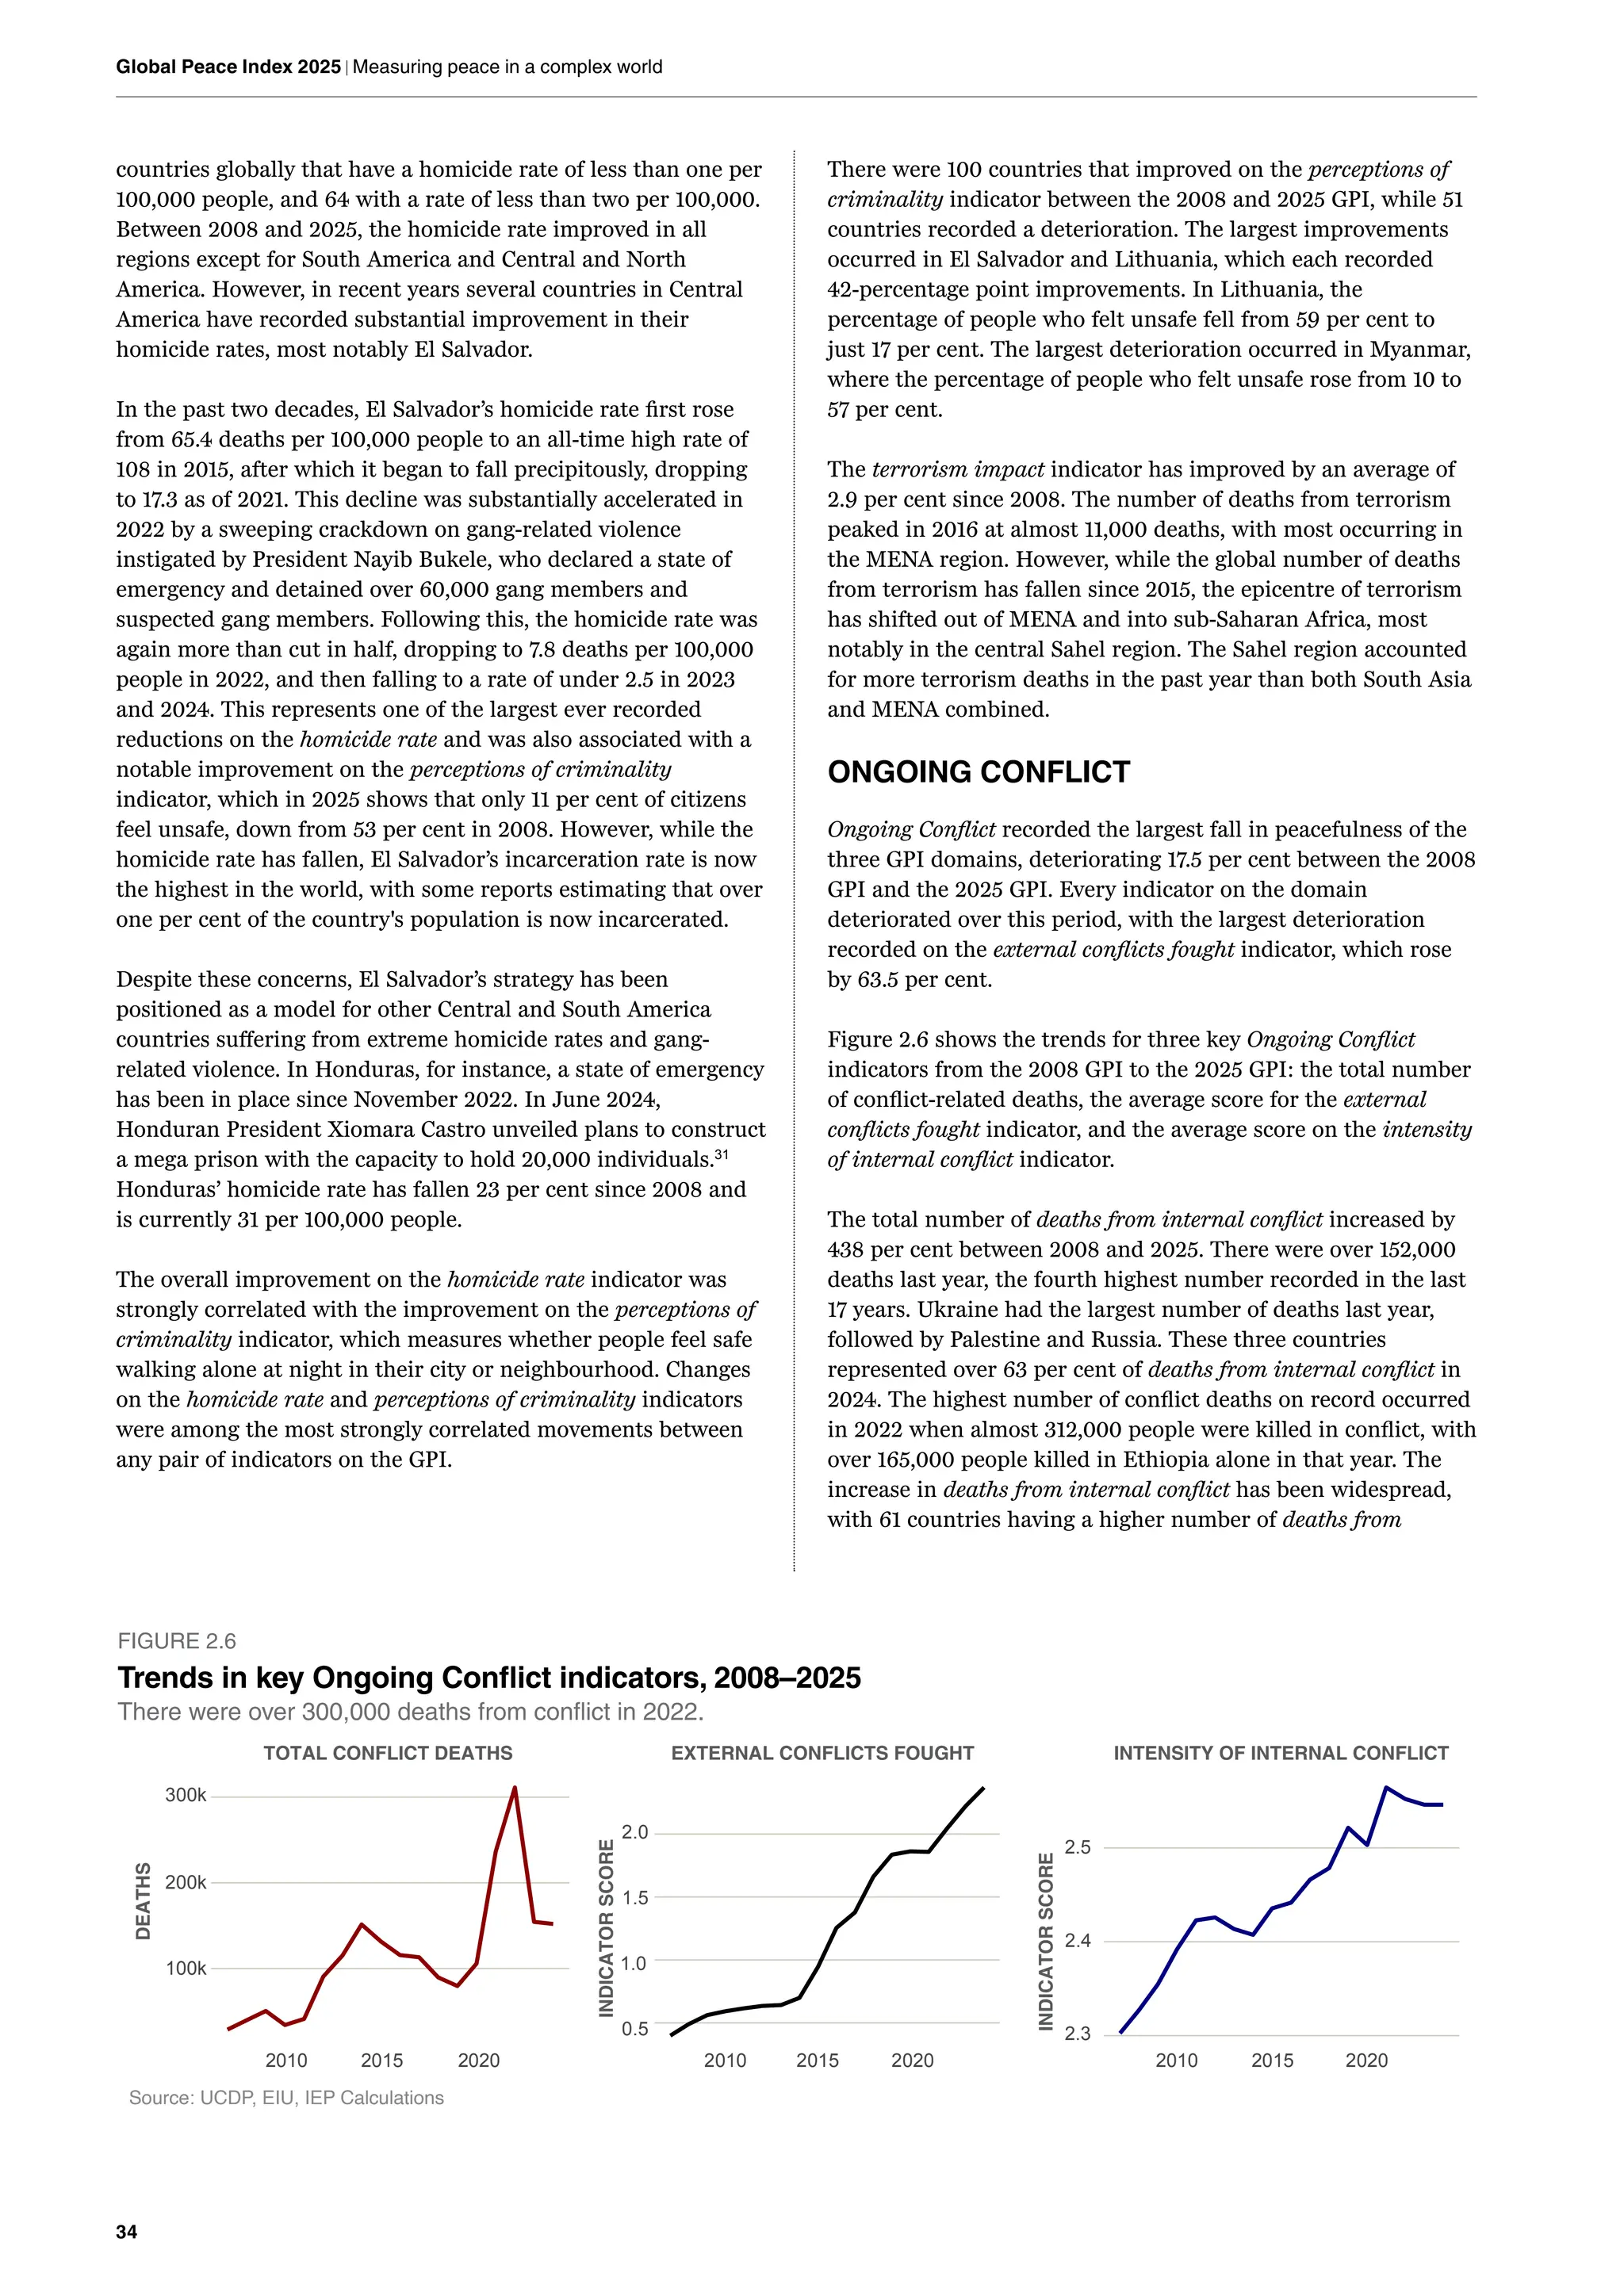
• Conversely, although the Safety and Security domain deteriorated,
several indicators have shown sustained improvement, most notably
the homicide rate and perceptions of criminality indicators.
• Across the 23 GPI indicators, external conflicts fought and internal
conflicts fought had the largest deteriorations. This reflects not only
the spread of conflict around the world, but the increasing
involvement of external actors in civil conflicts.
• Deaths from internal conflict increased by over 438 per cent in the
past 17 years, with 75 countries recording at least one conflict death
in the past year.
• Around the world, there are now over 122 million people that have
been forcibly displaced. There are now 17 countries where more
than five per cent of the population are either refugees or have been
internally displaced. The number of people forcibly displaced has
increased by over 185 per cent since the inception of the GPI.
• Eight of the ten largest weapons exporters on a per capita basis are
Western democracies, including France, Sweden, Italy, the
Netherlands, Germany and Norway.
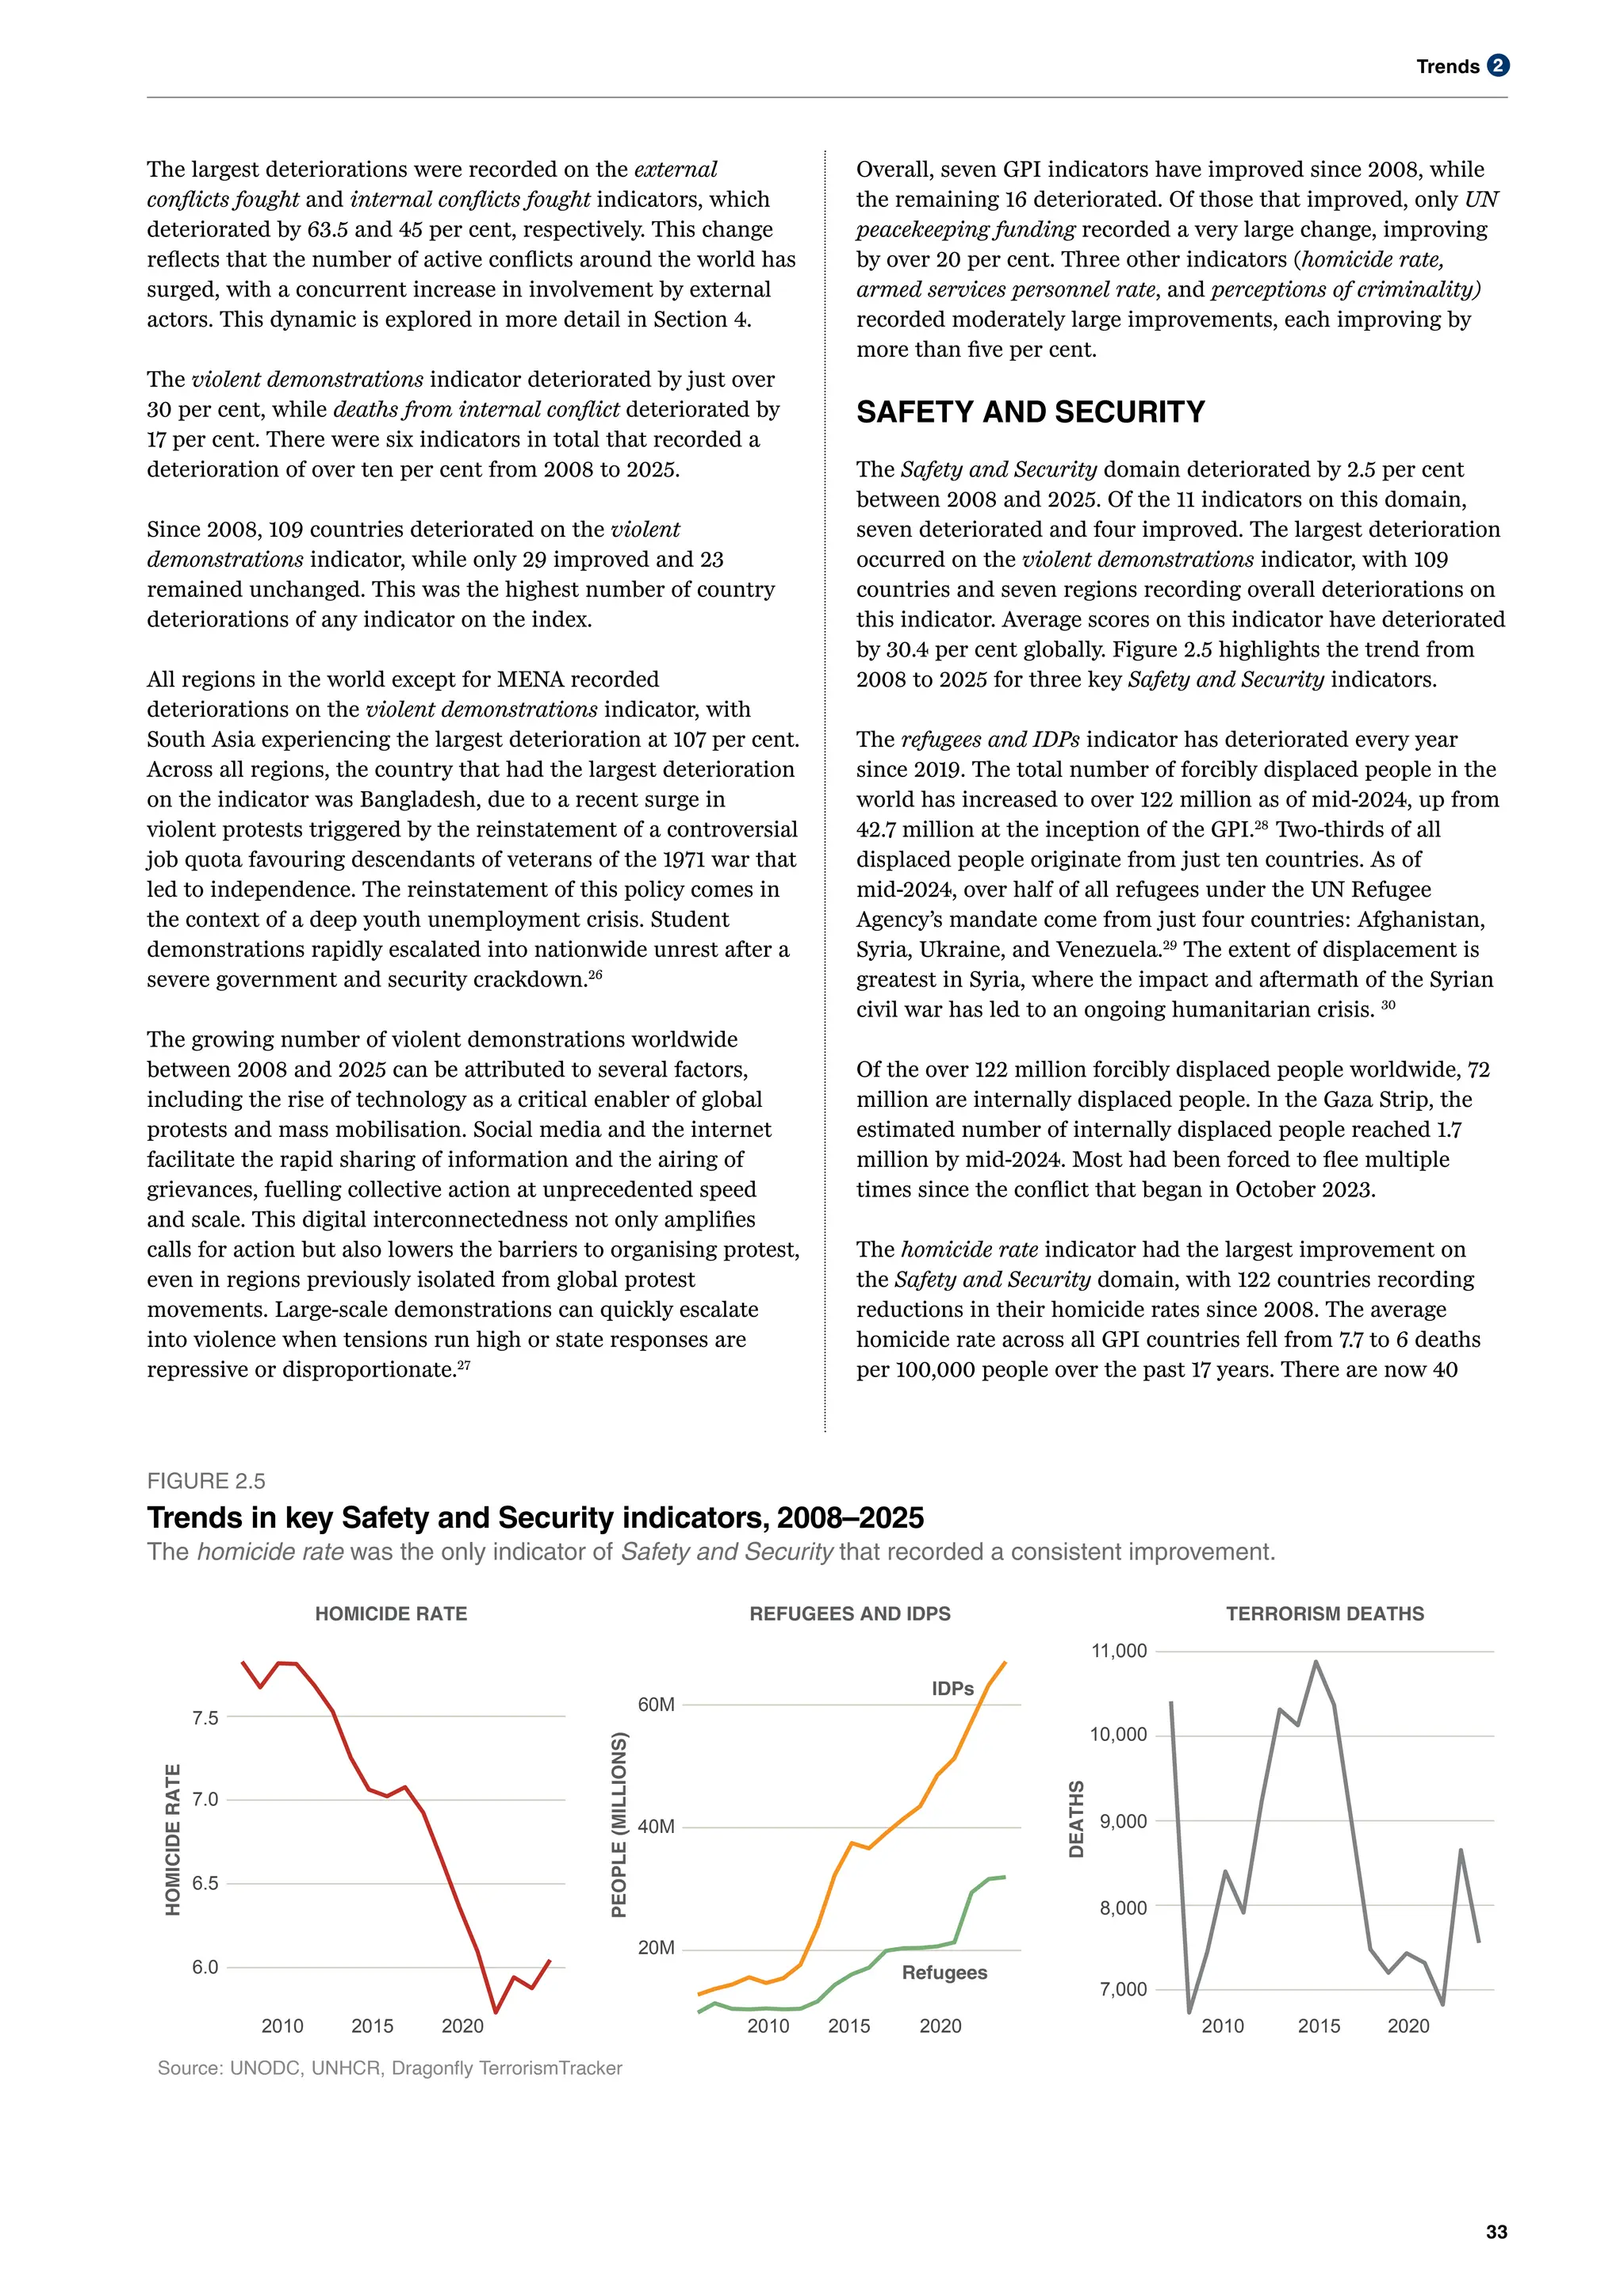
• In the past 17 years, more countries deteriorated on violent
demonstrations than any other indicator, with 109 deteriorating and
only 23 improving. The rise of technology was a critical enabler of
global protests and mass mobilisation.
• Global economic stagnation, increasing debt, and the
weaponisation of economic interdependence via trade wars, are key
factors shaping the economic landscape of geopolitics in the 21st
century.
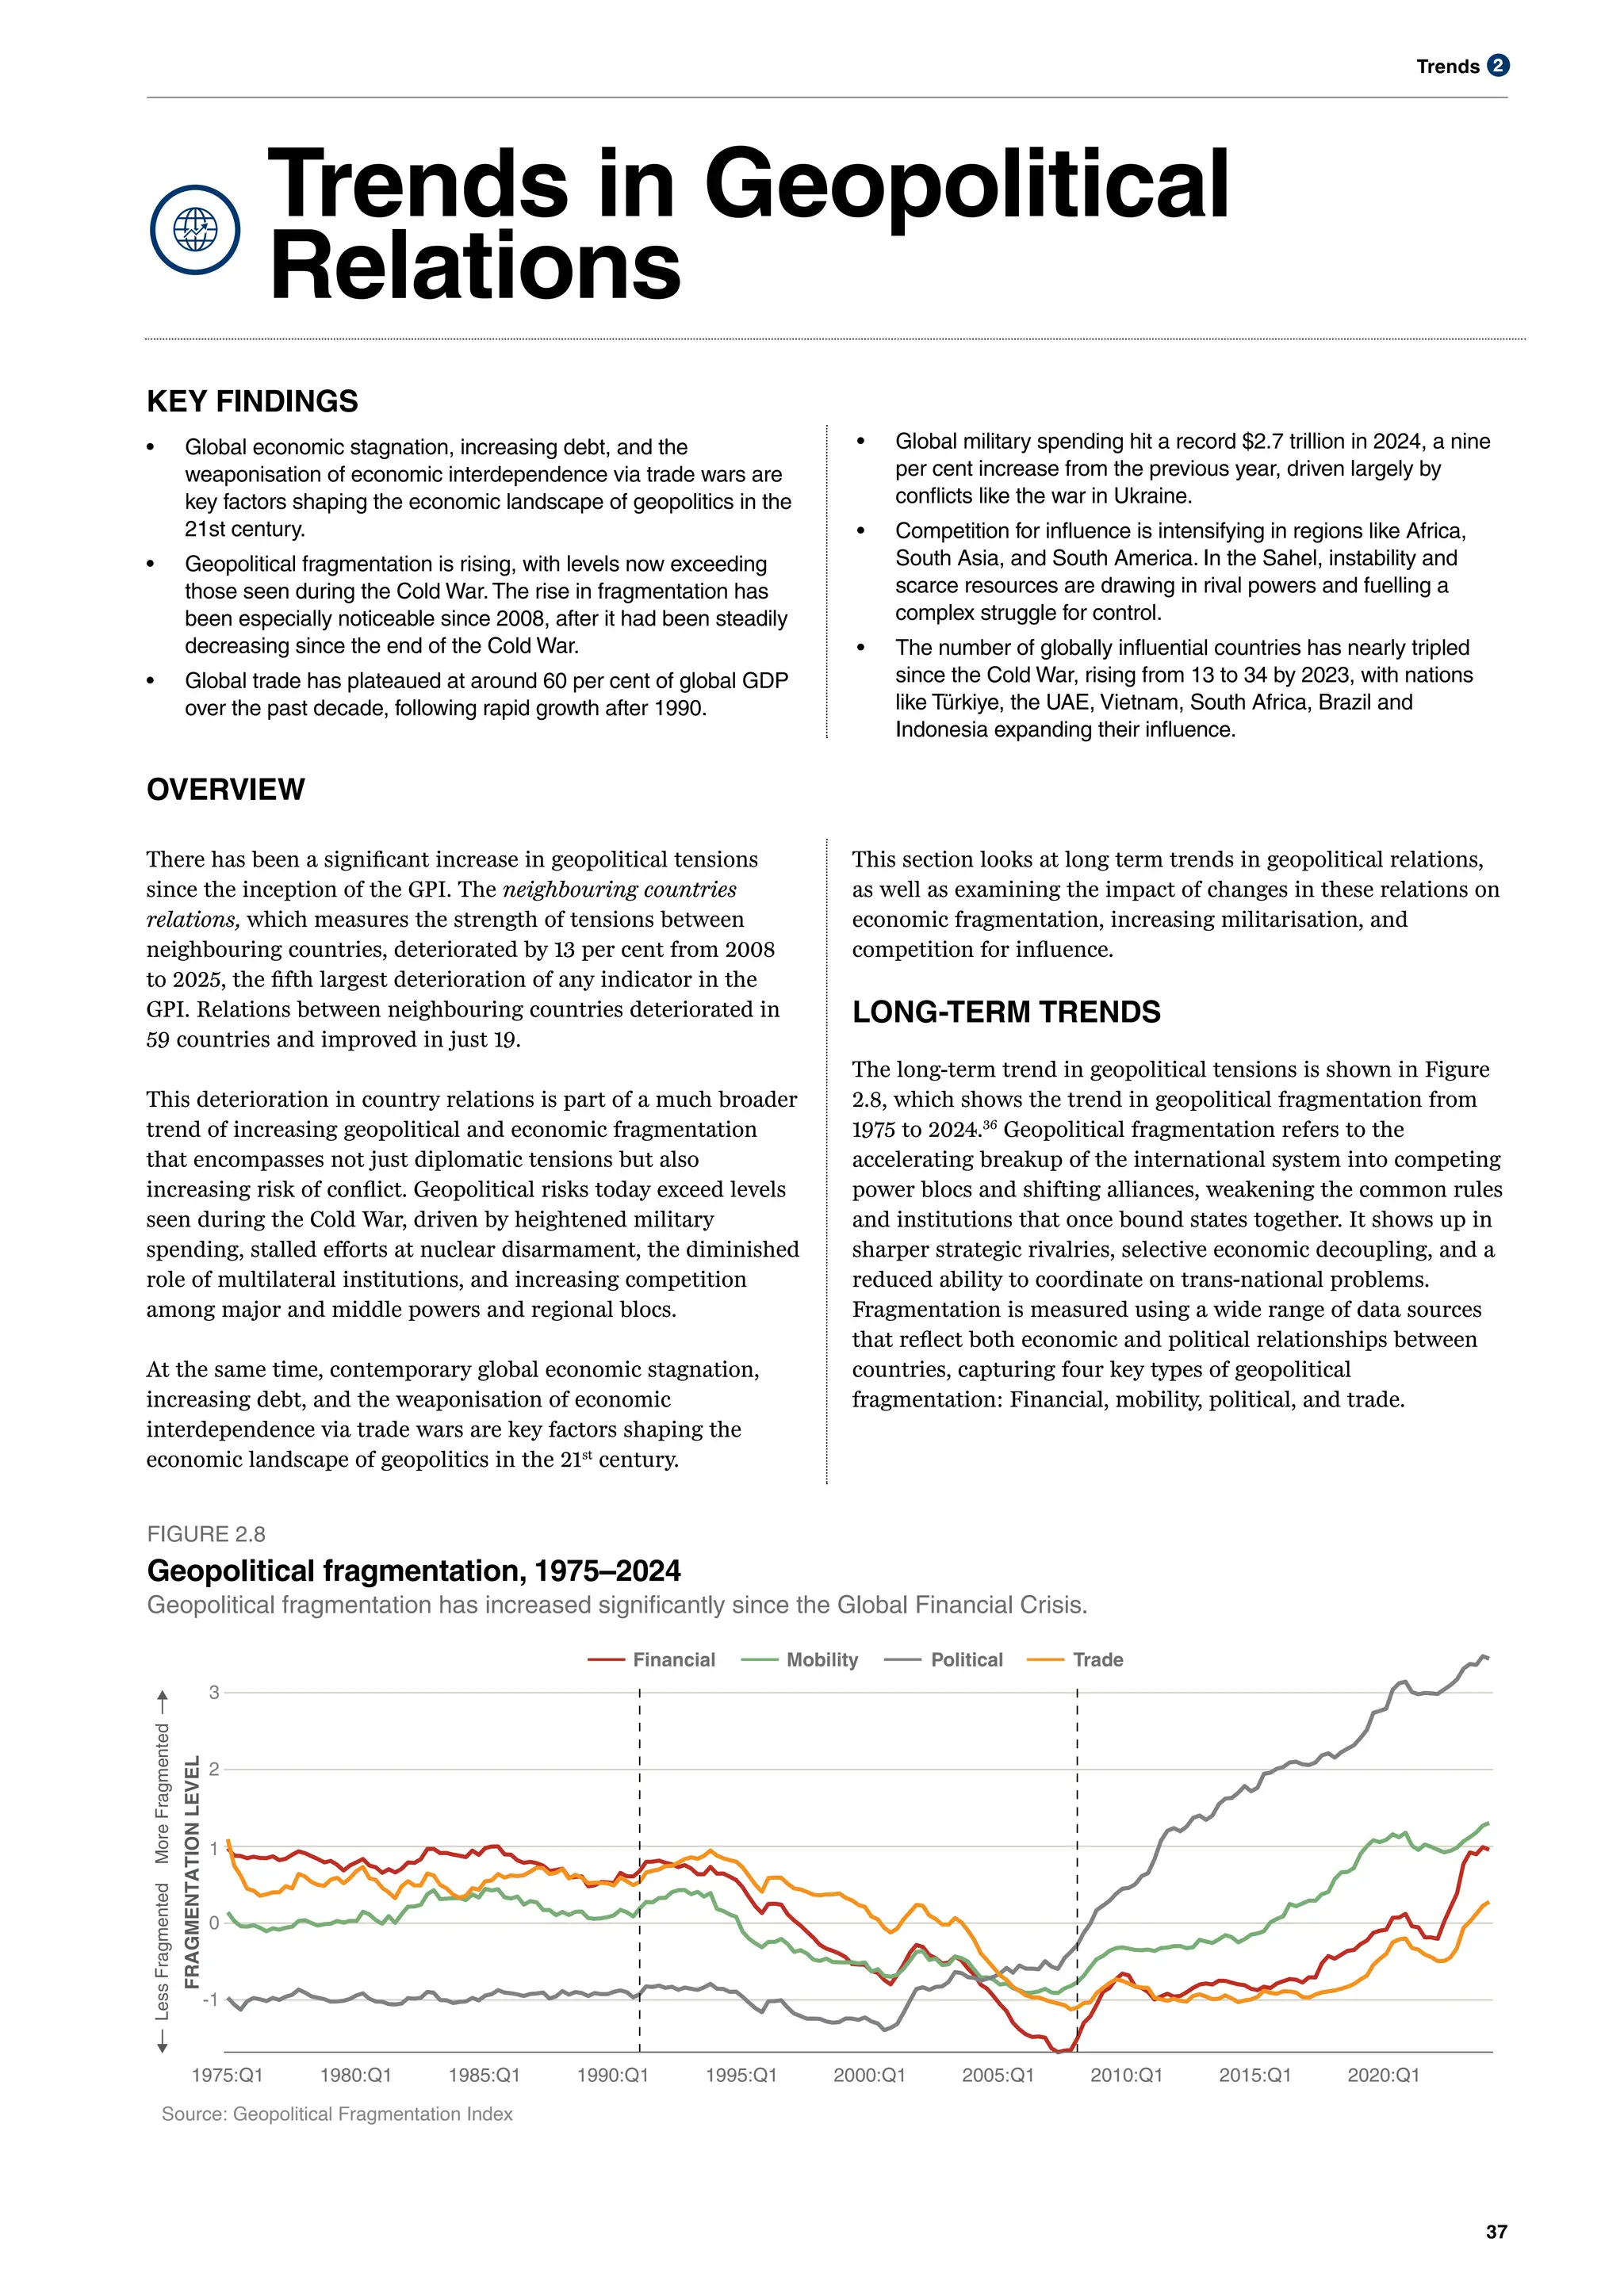
• Geopolitical fragmentation is rising, with levels now exceeding those
seen during the Cold War. The rise in fragmentation has been
especially noticeable since 2008, after it had been steadily
decreasing since the end of the Cold War.
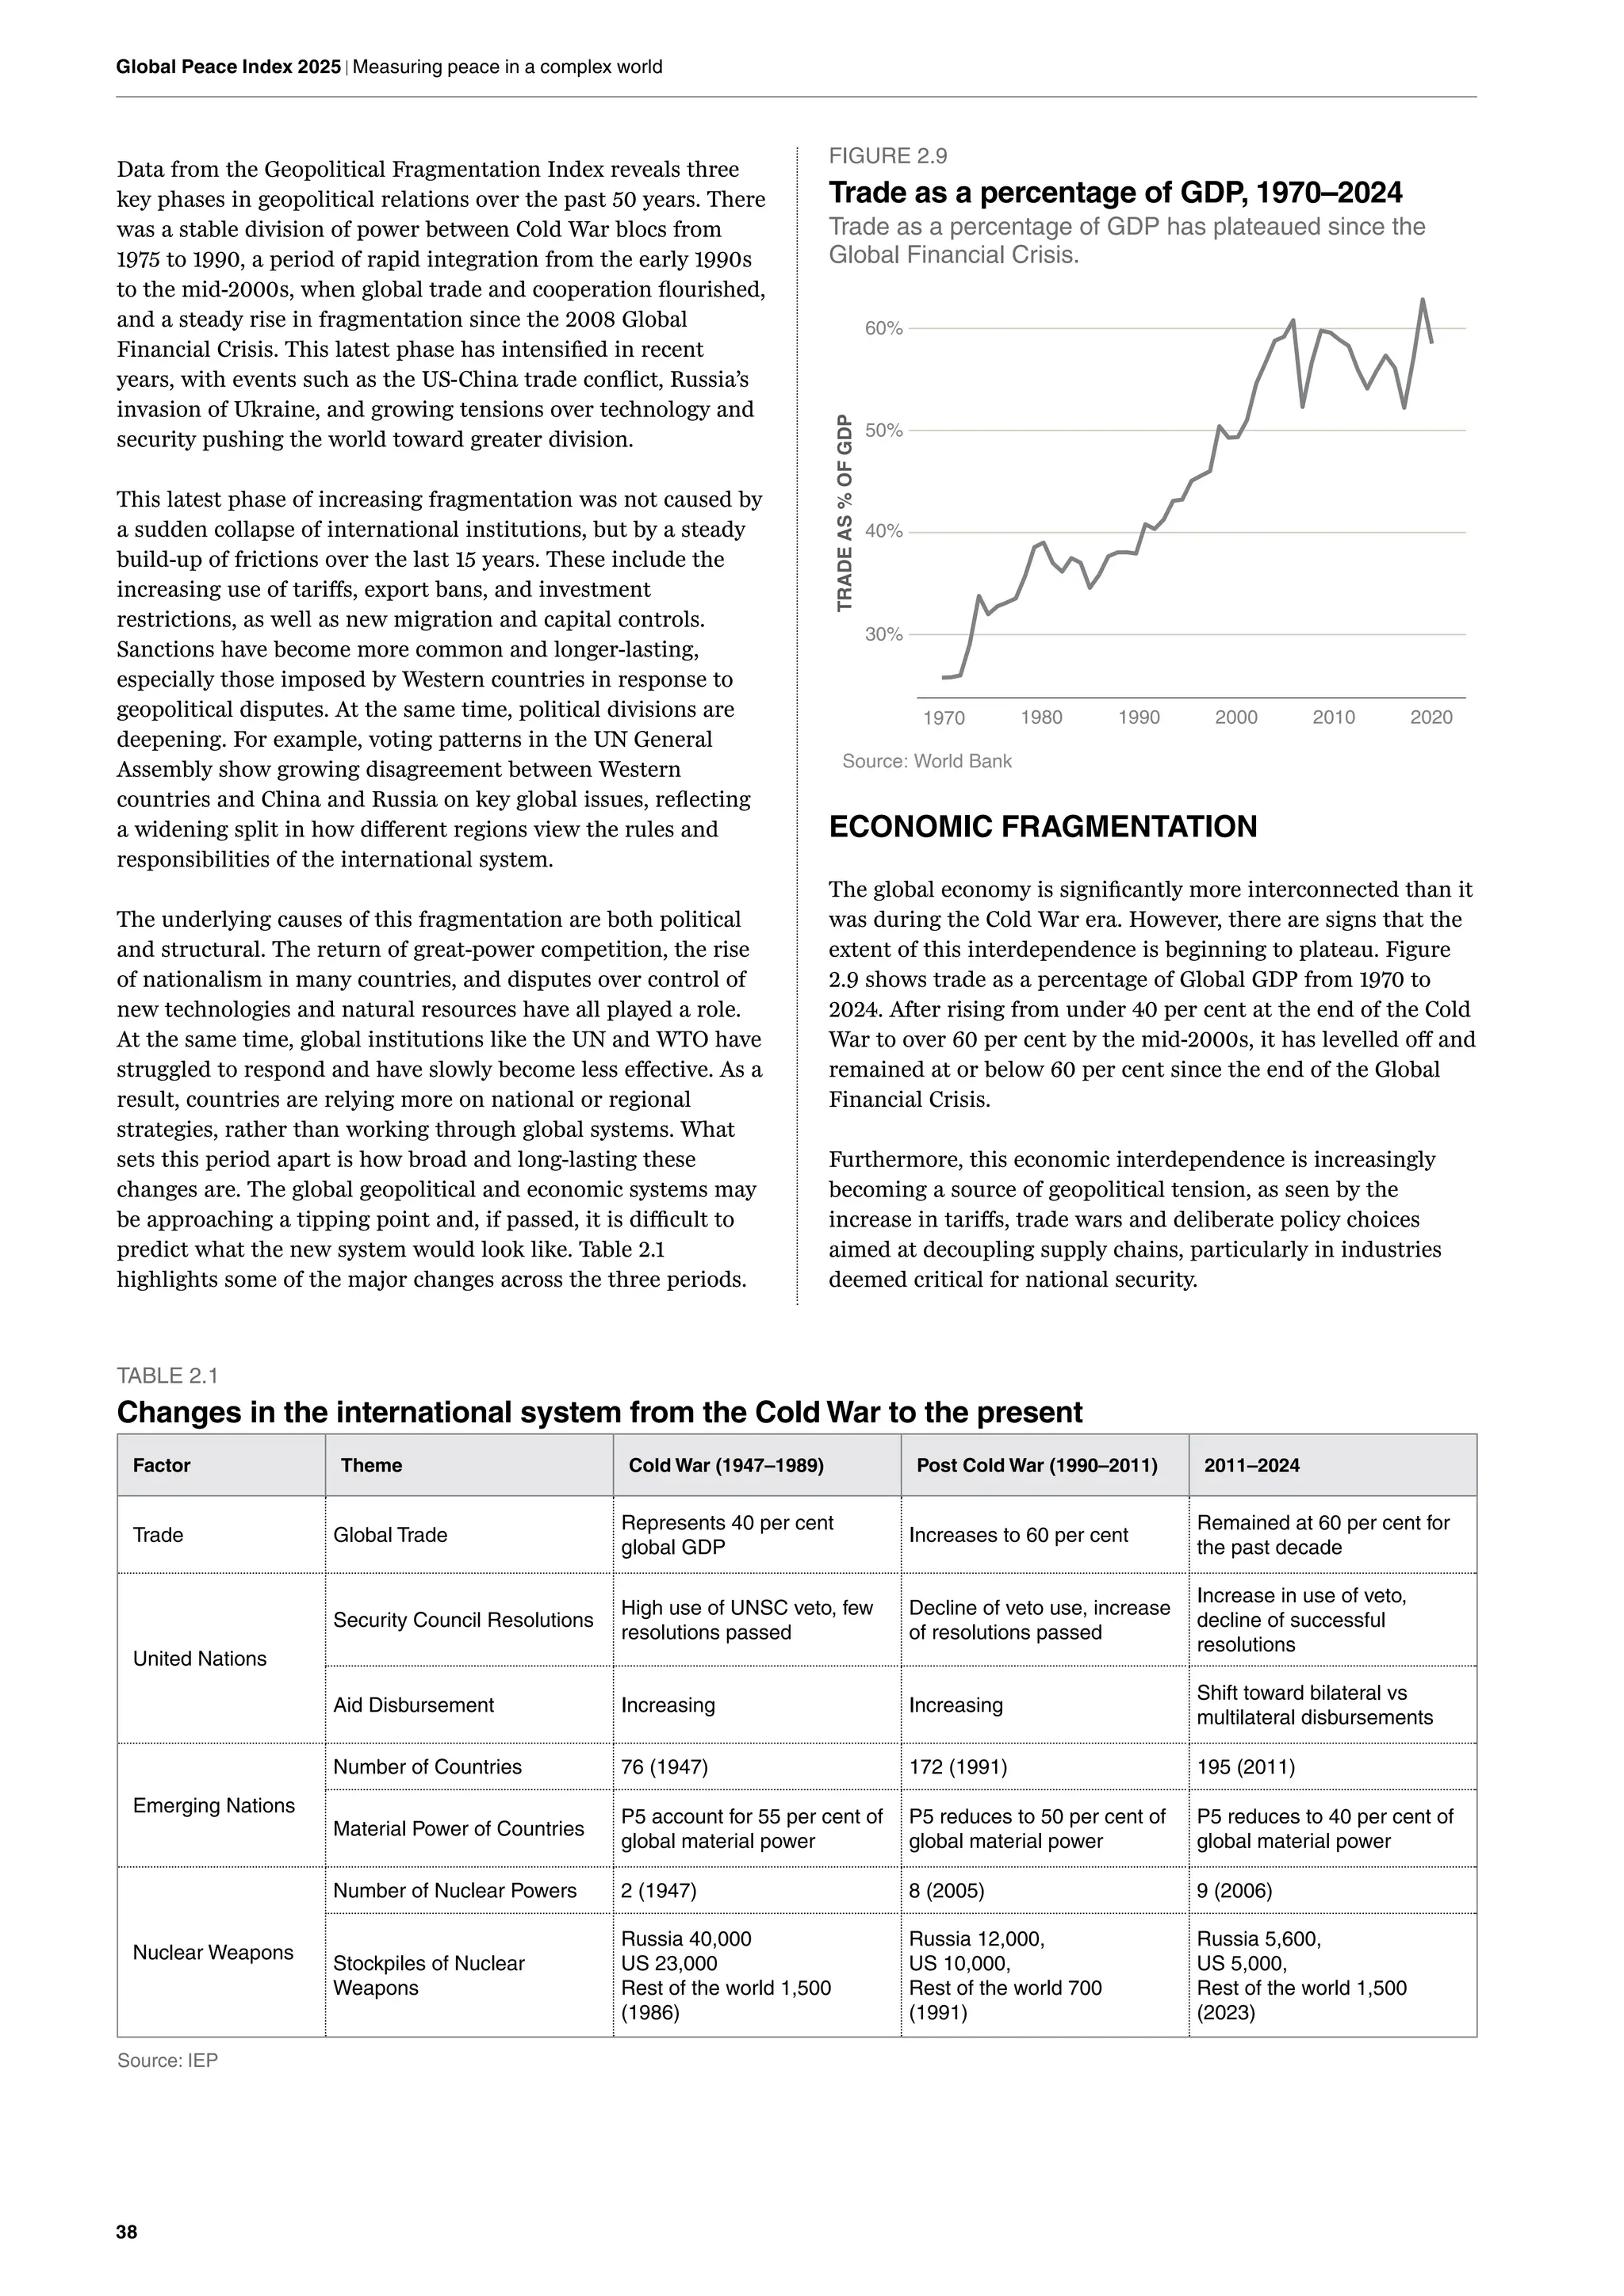
• Global trade has plateaued at around 60 per cent of global GDP
over the past decade, following rapid growth after 1990.
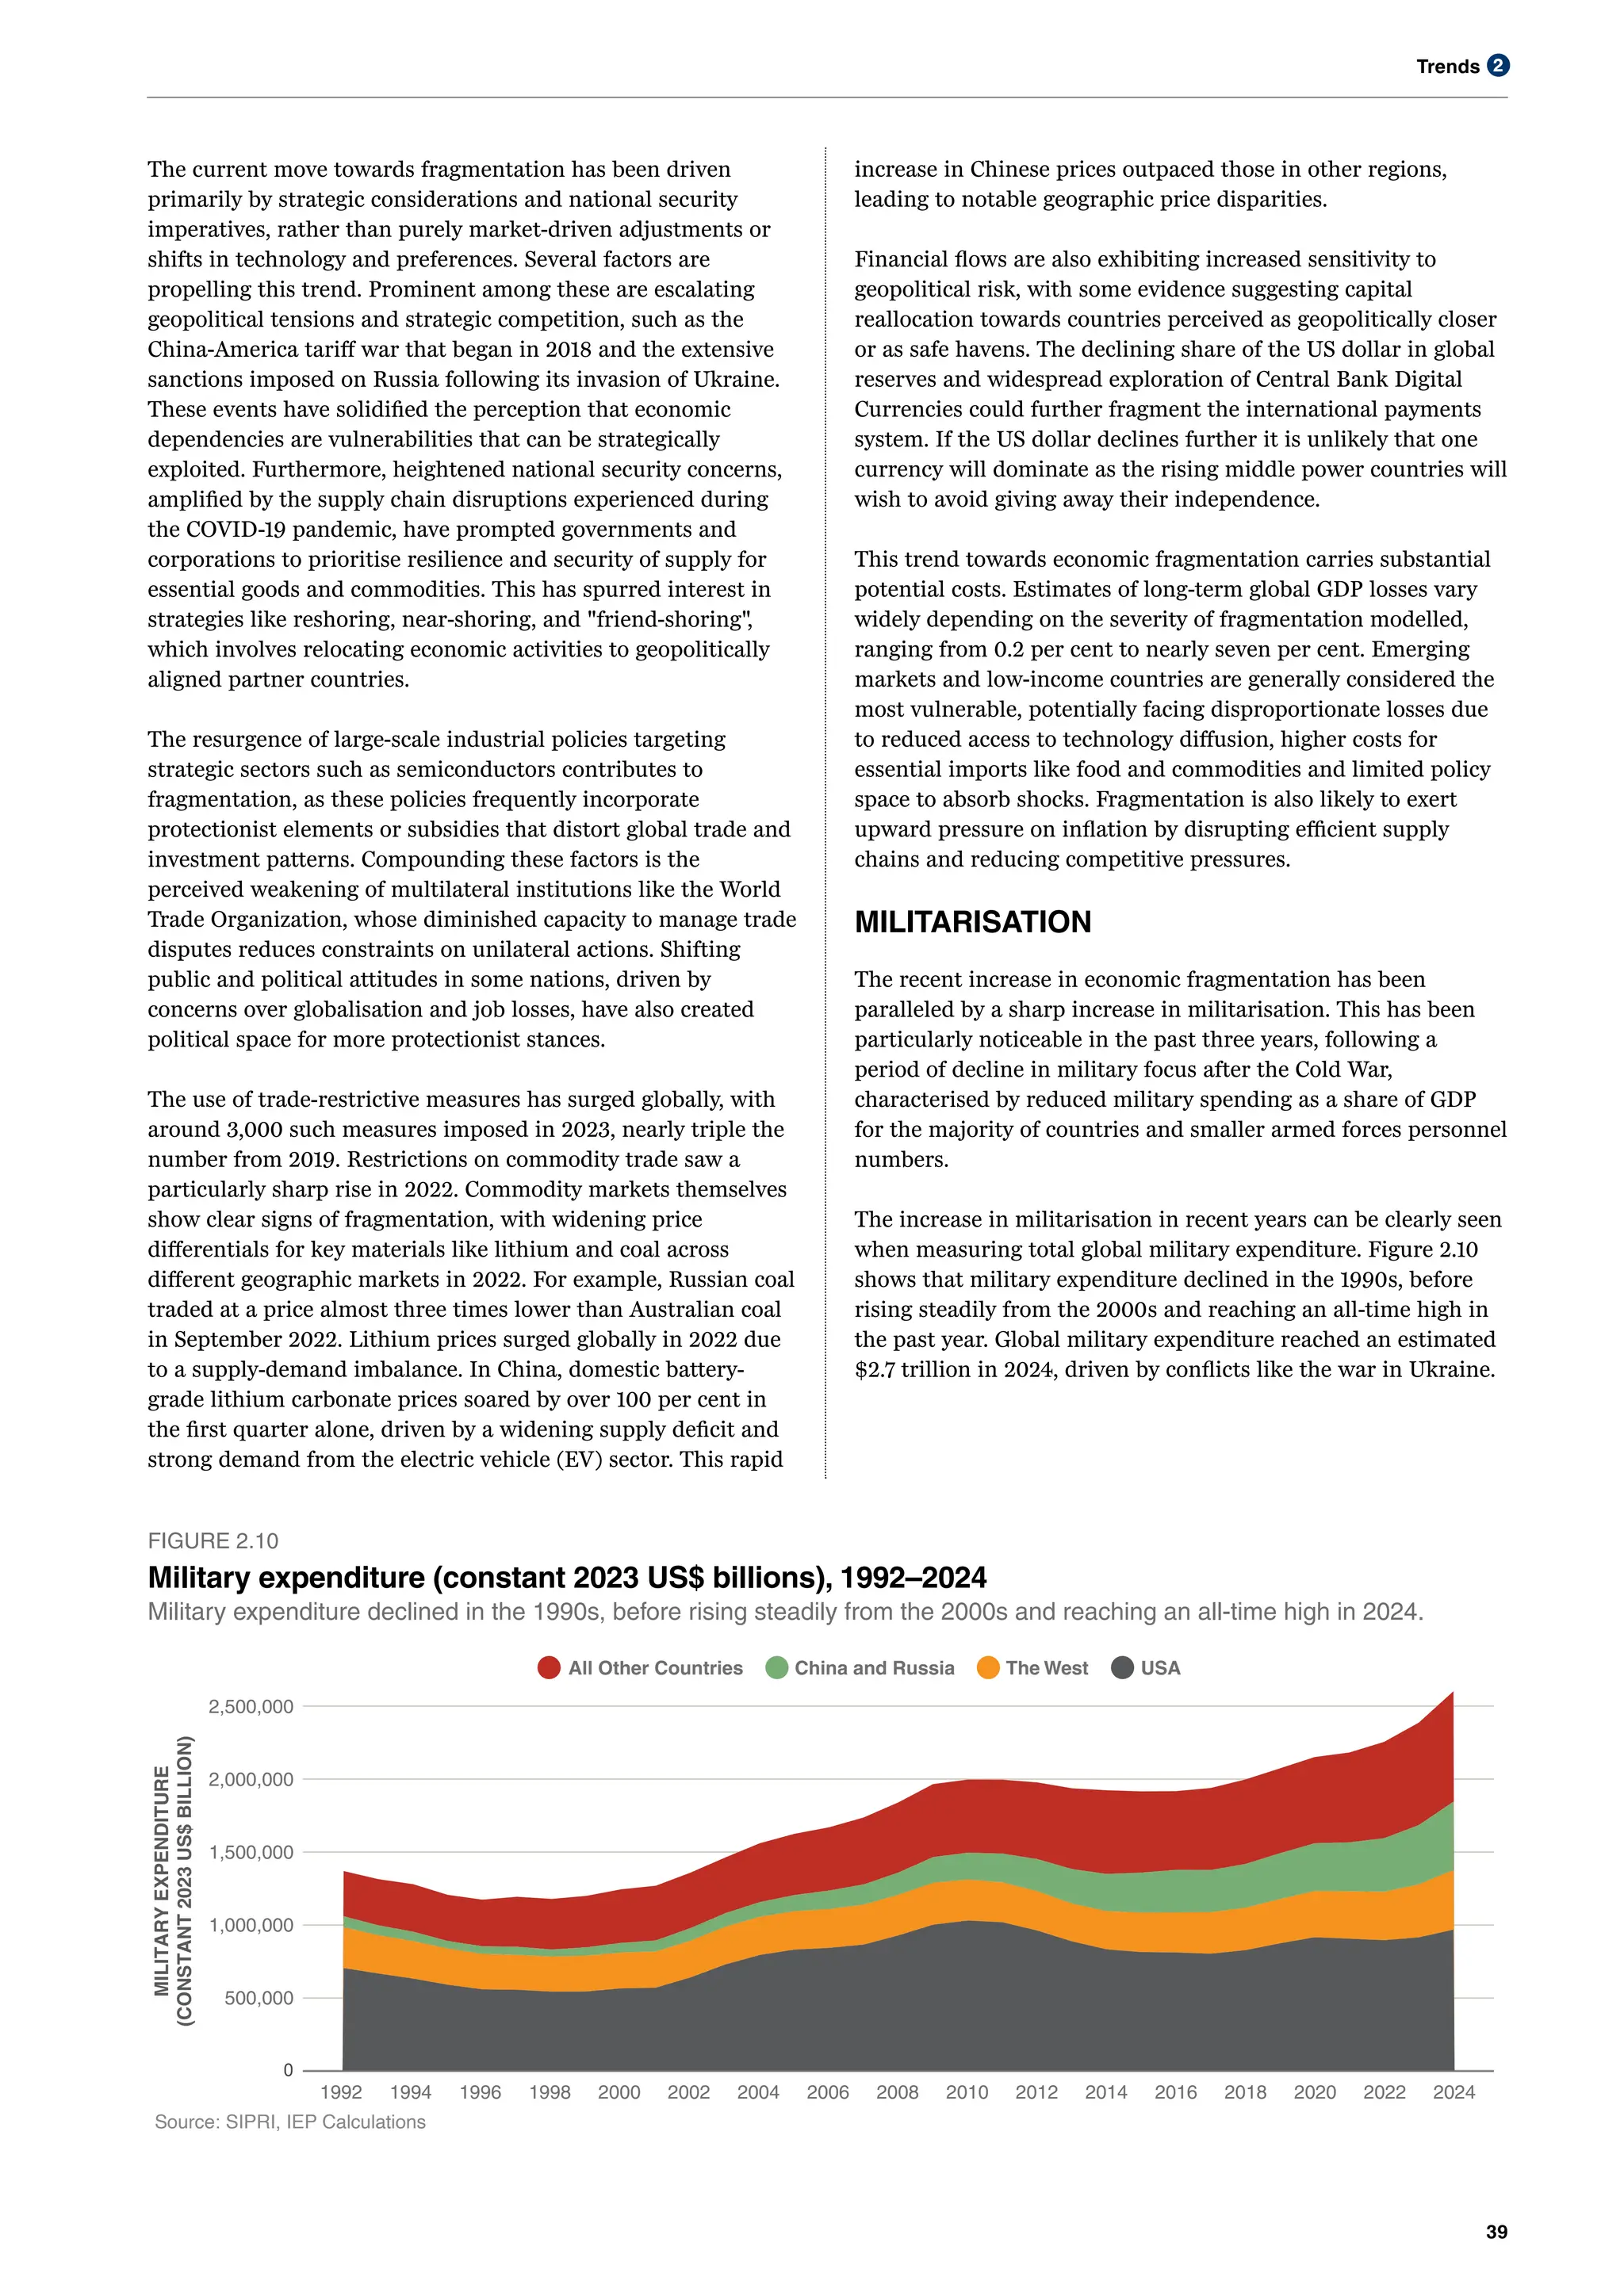
• Global military spending hit a record $2.7 trillion in 2024, a nine per
cent increase from the previous year, driven largely by conflicts such
as the war in Ukraine.
7.
Key Findings
5
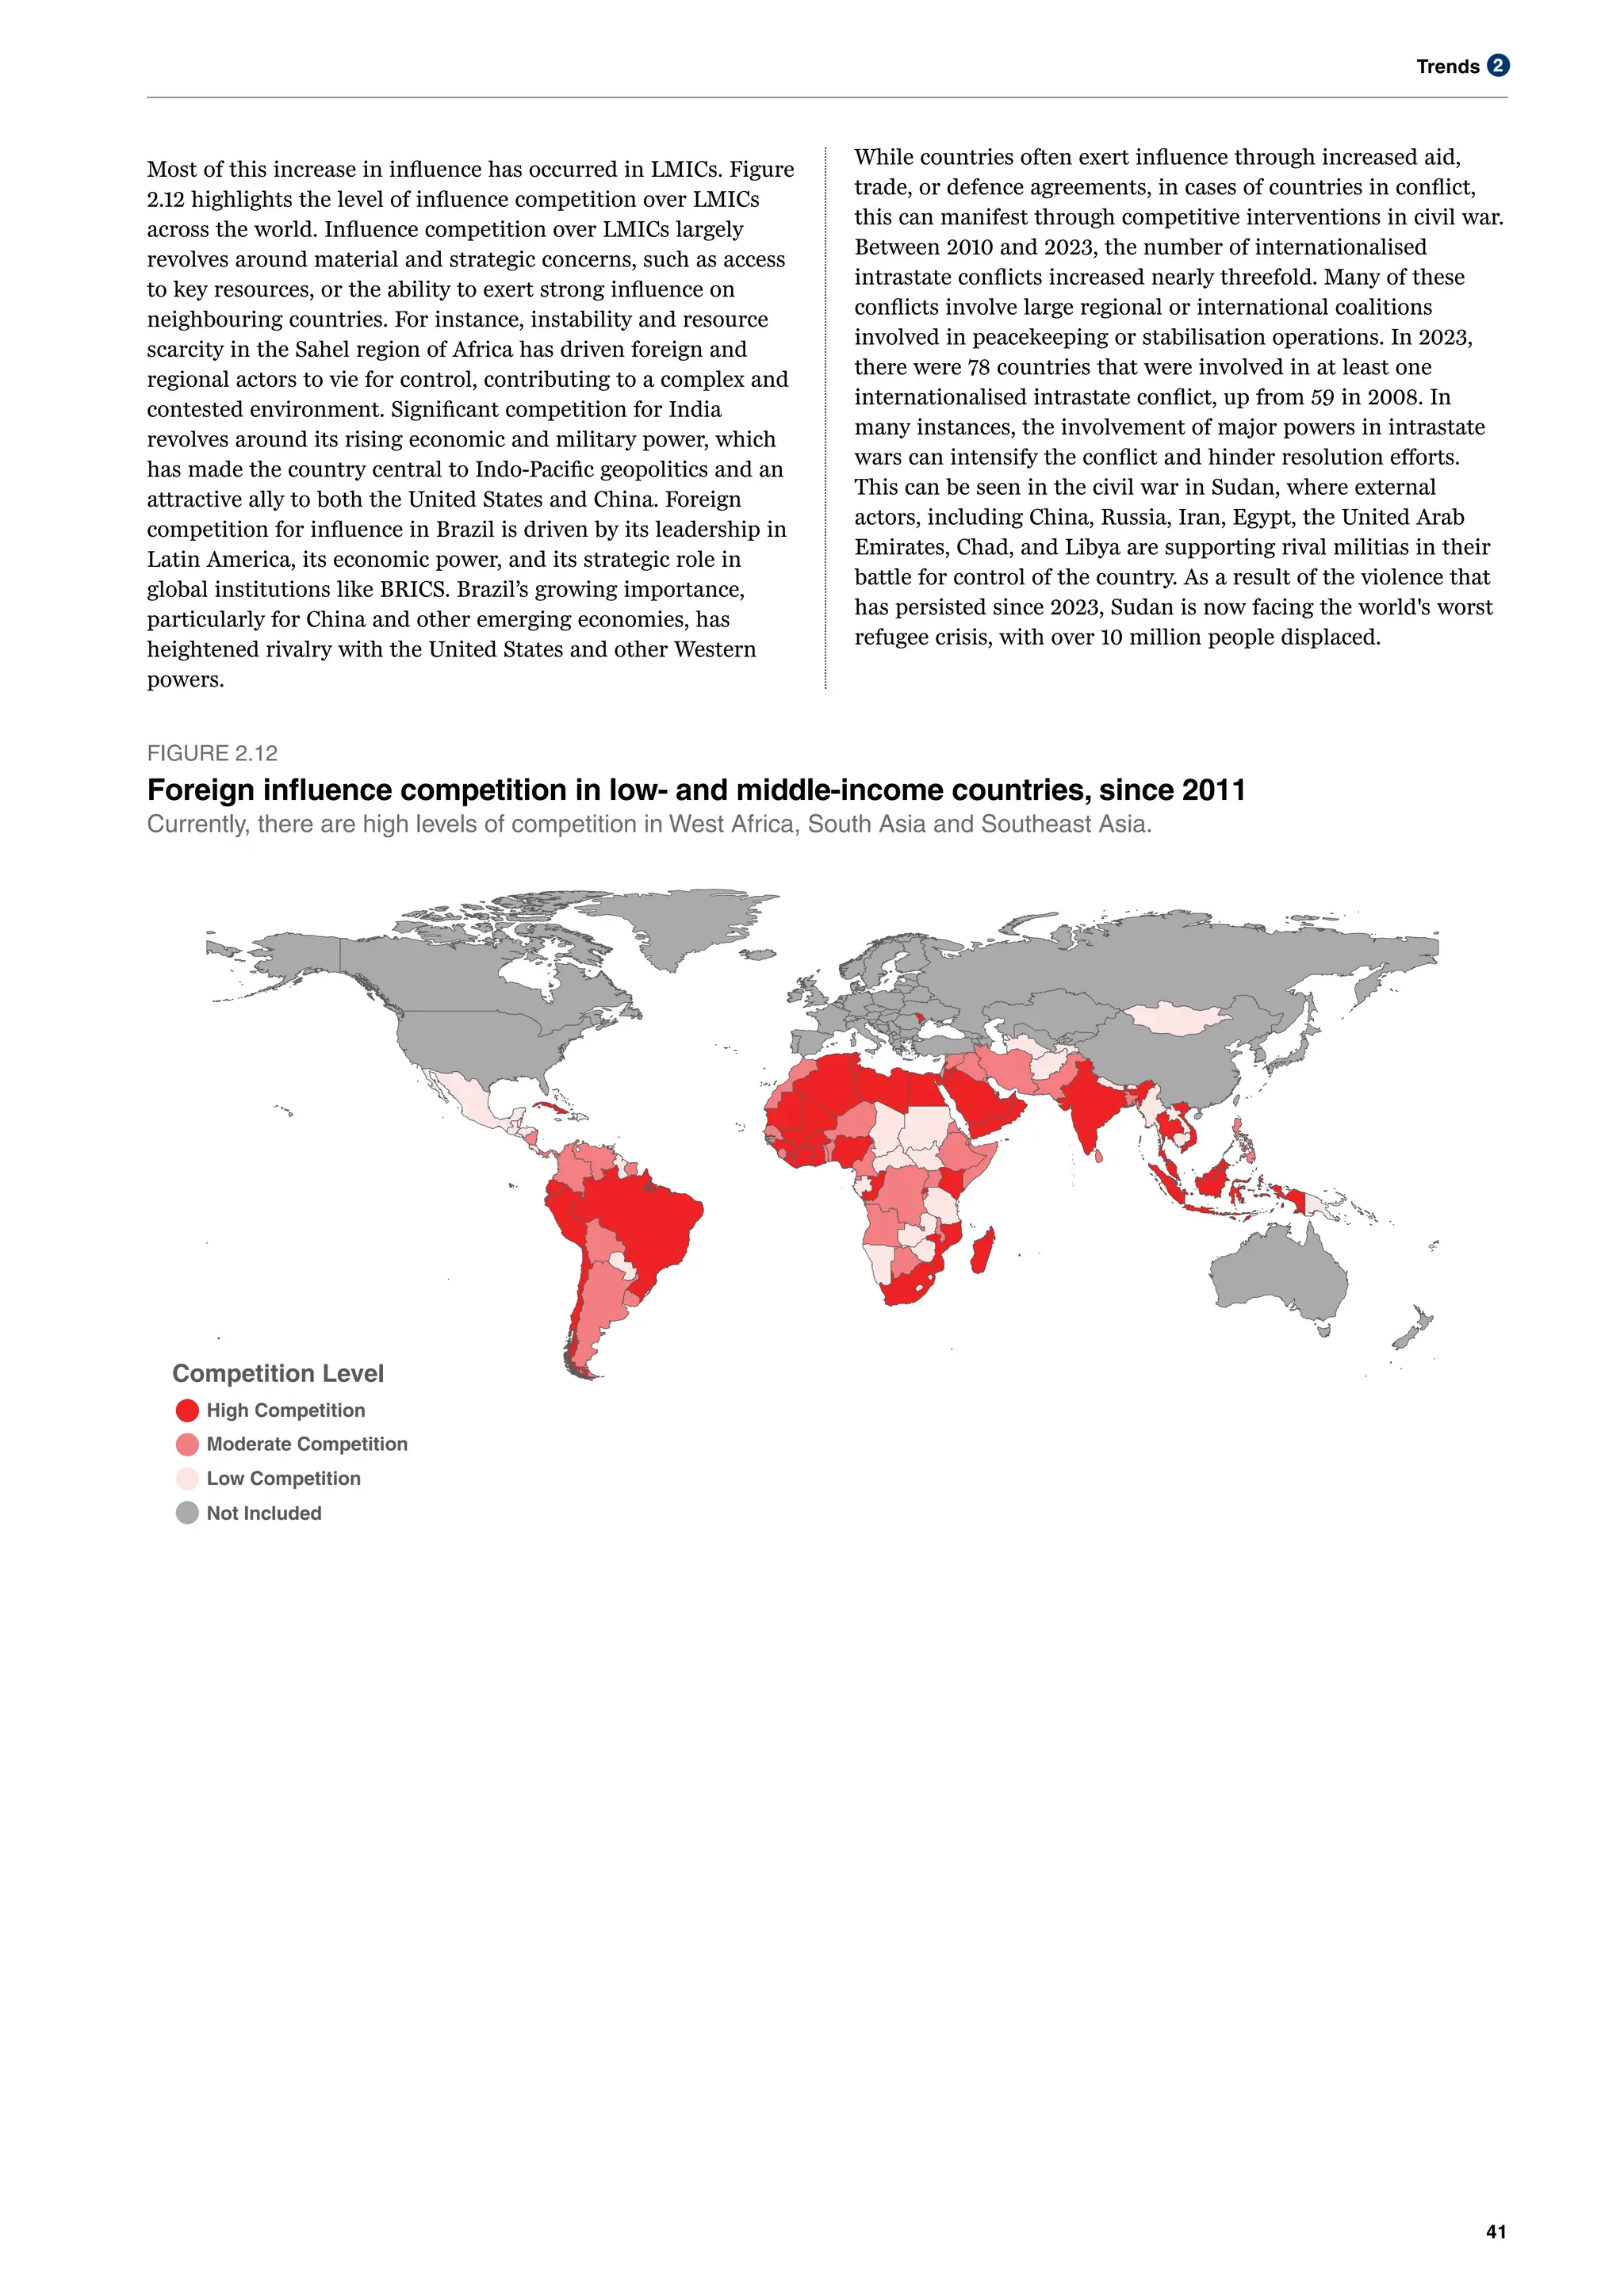
• Competitionfor influence is intensifying in regions like Africa, South
Asia and South America. In the Sahel, instability and scarce
resources are drawing in rival powers and fuelling a complex struggle
for control.
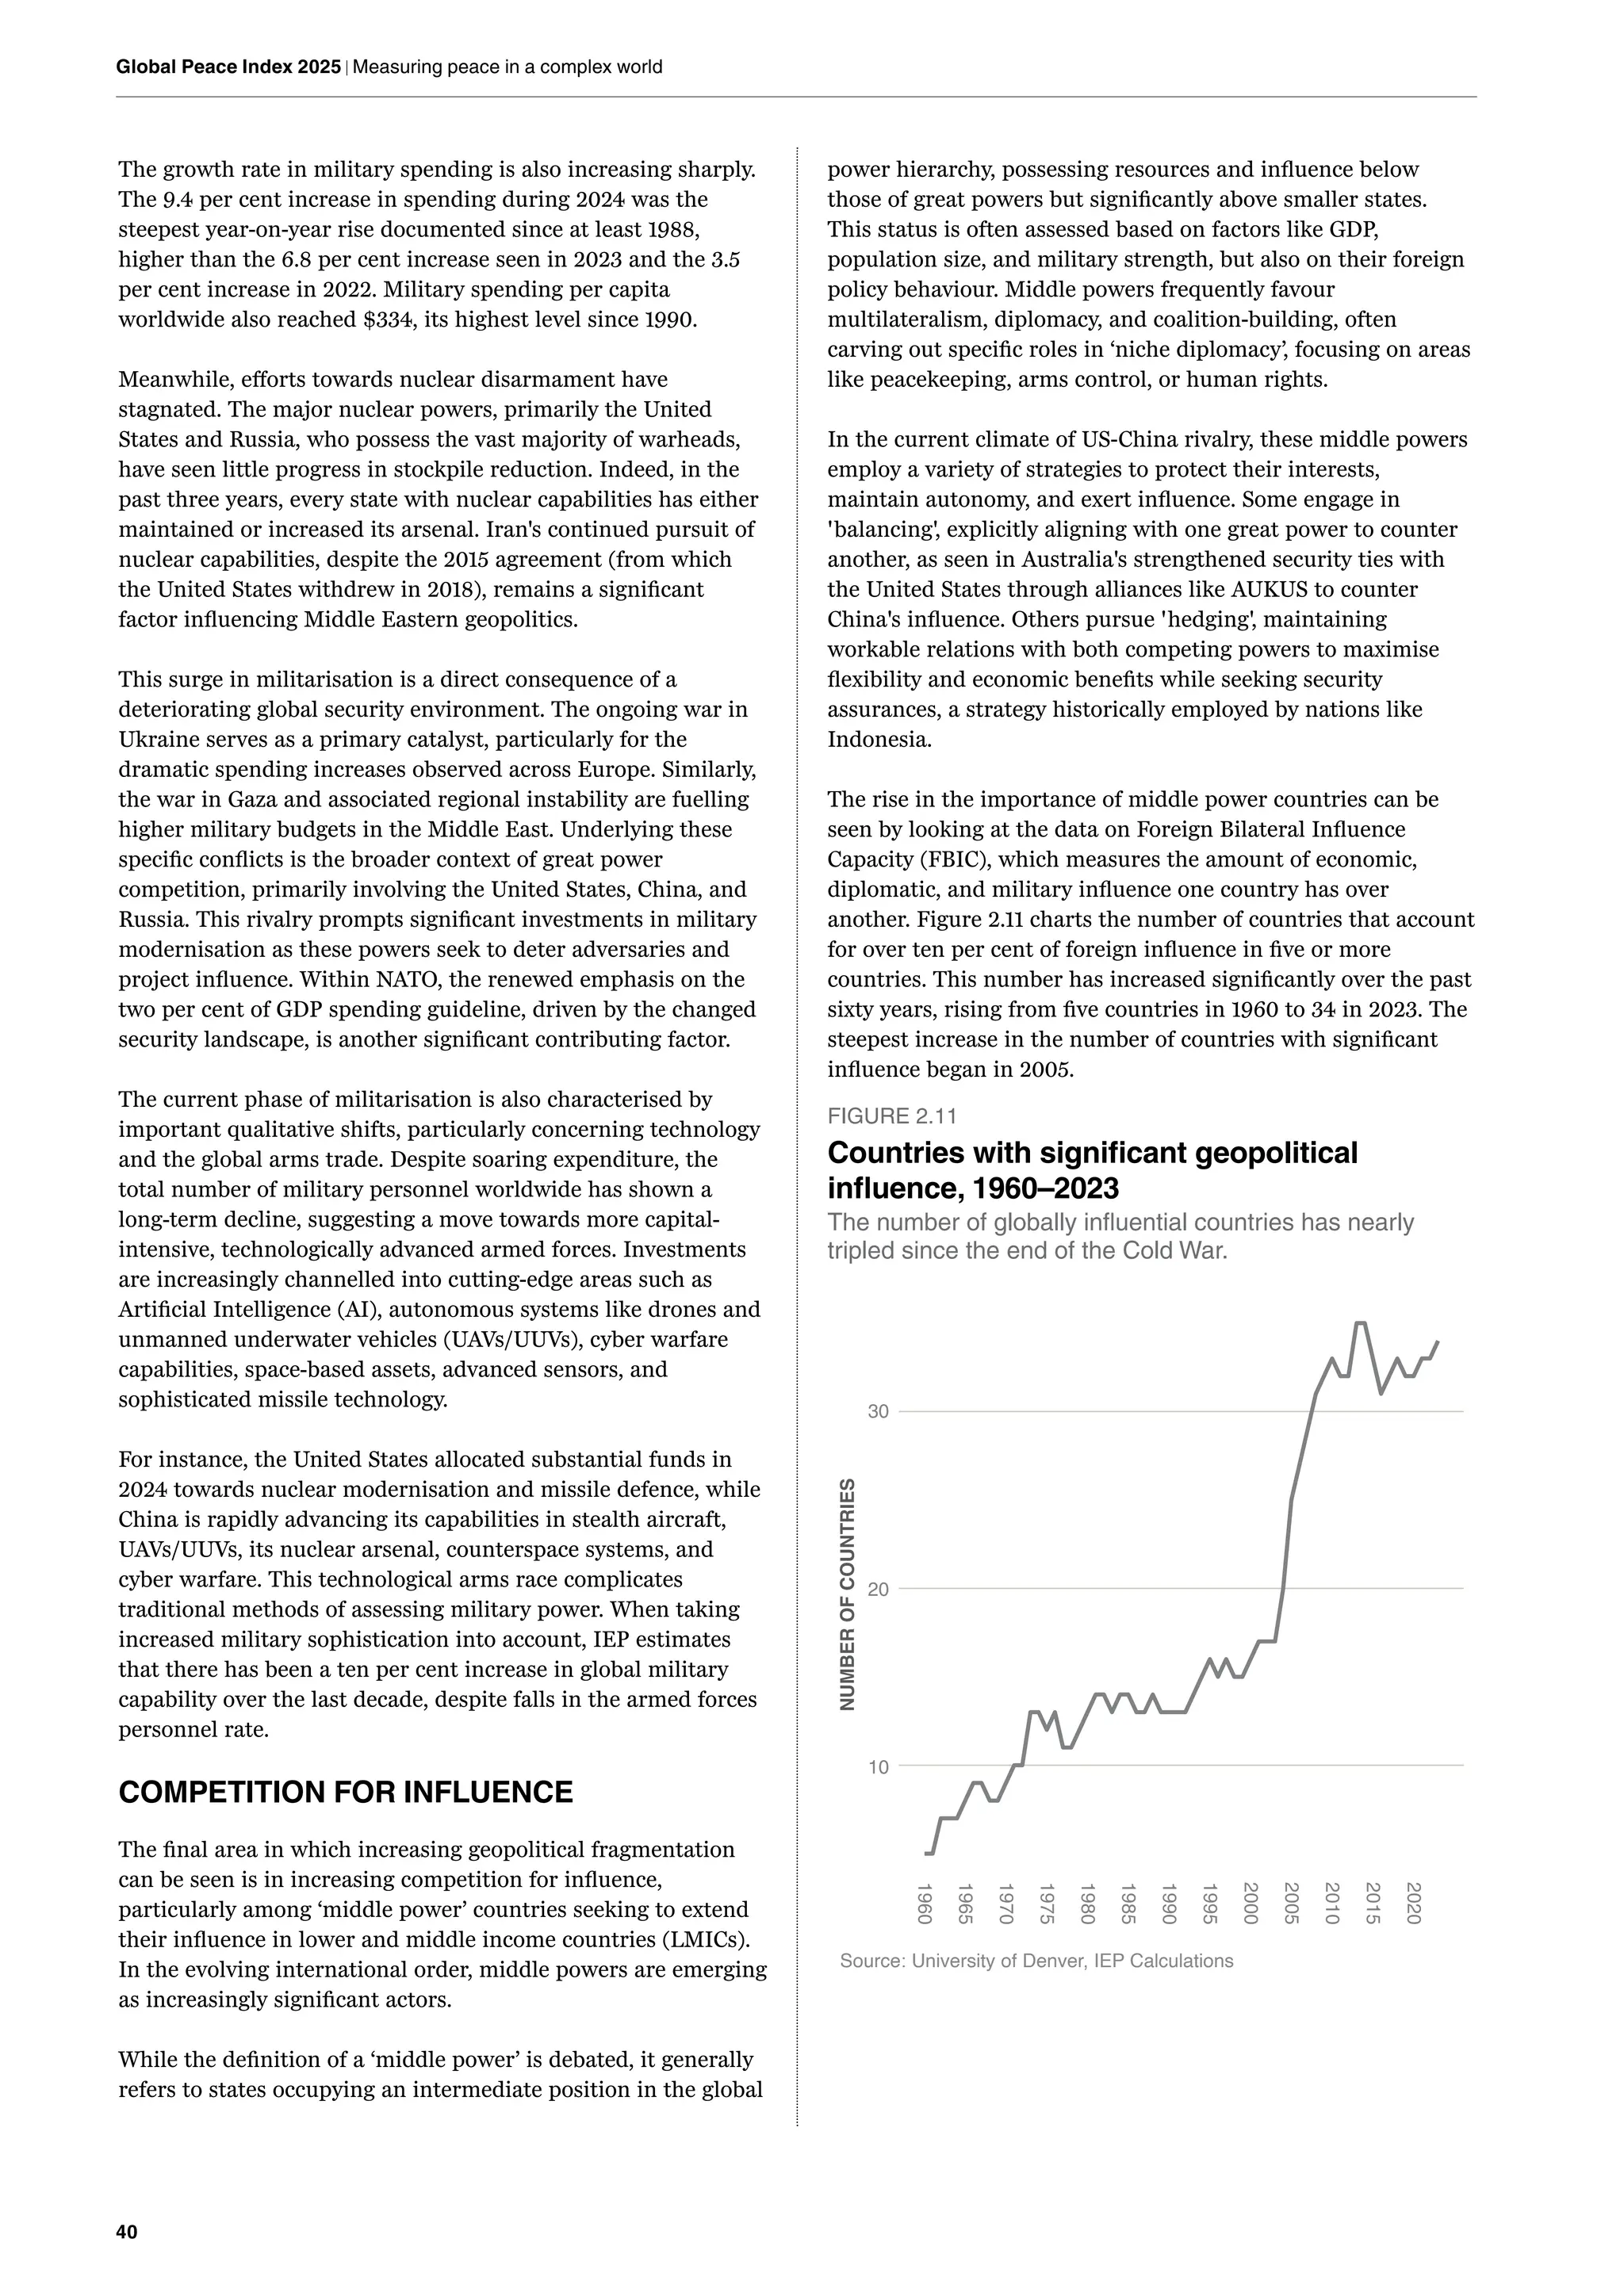
• The number of globally influential countries has nearly tripled since
the Cold War, rising from 13 to 34 by 2023, with nations like Türkiye,
the UAE, Vietnam, South Africa, Brazil and Indonesia expanding their
influence.
Section 3 – Economic Impact of Violence
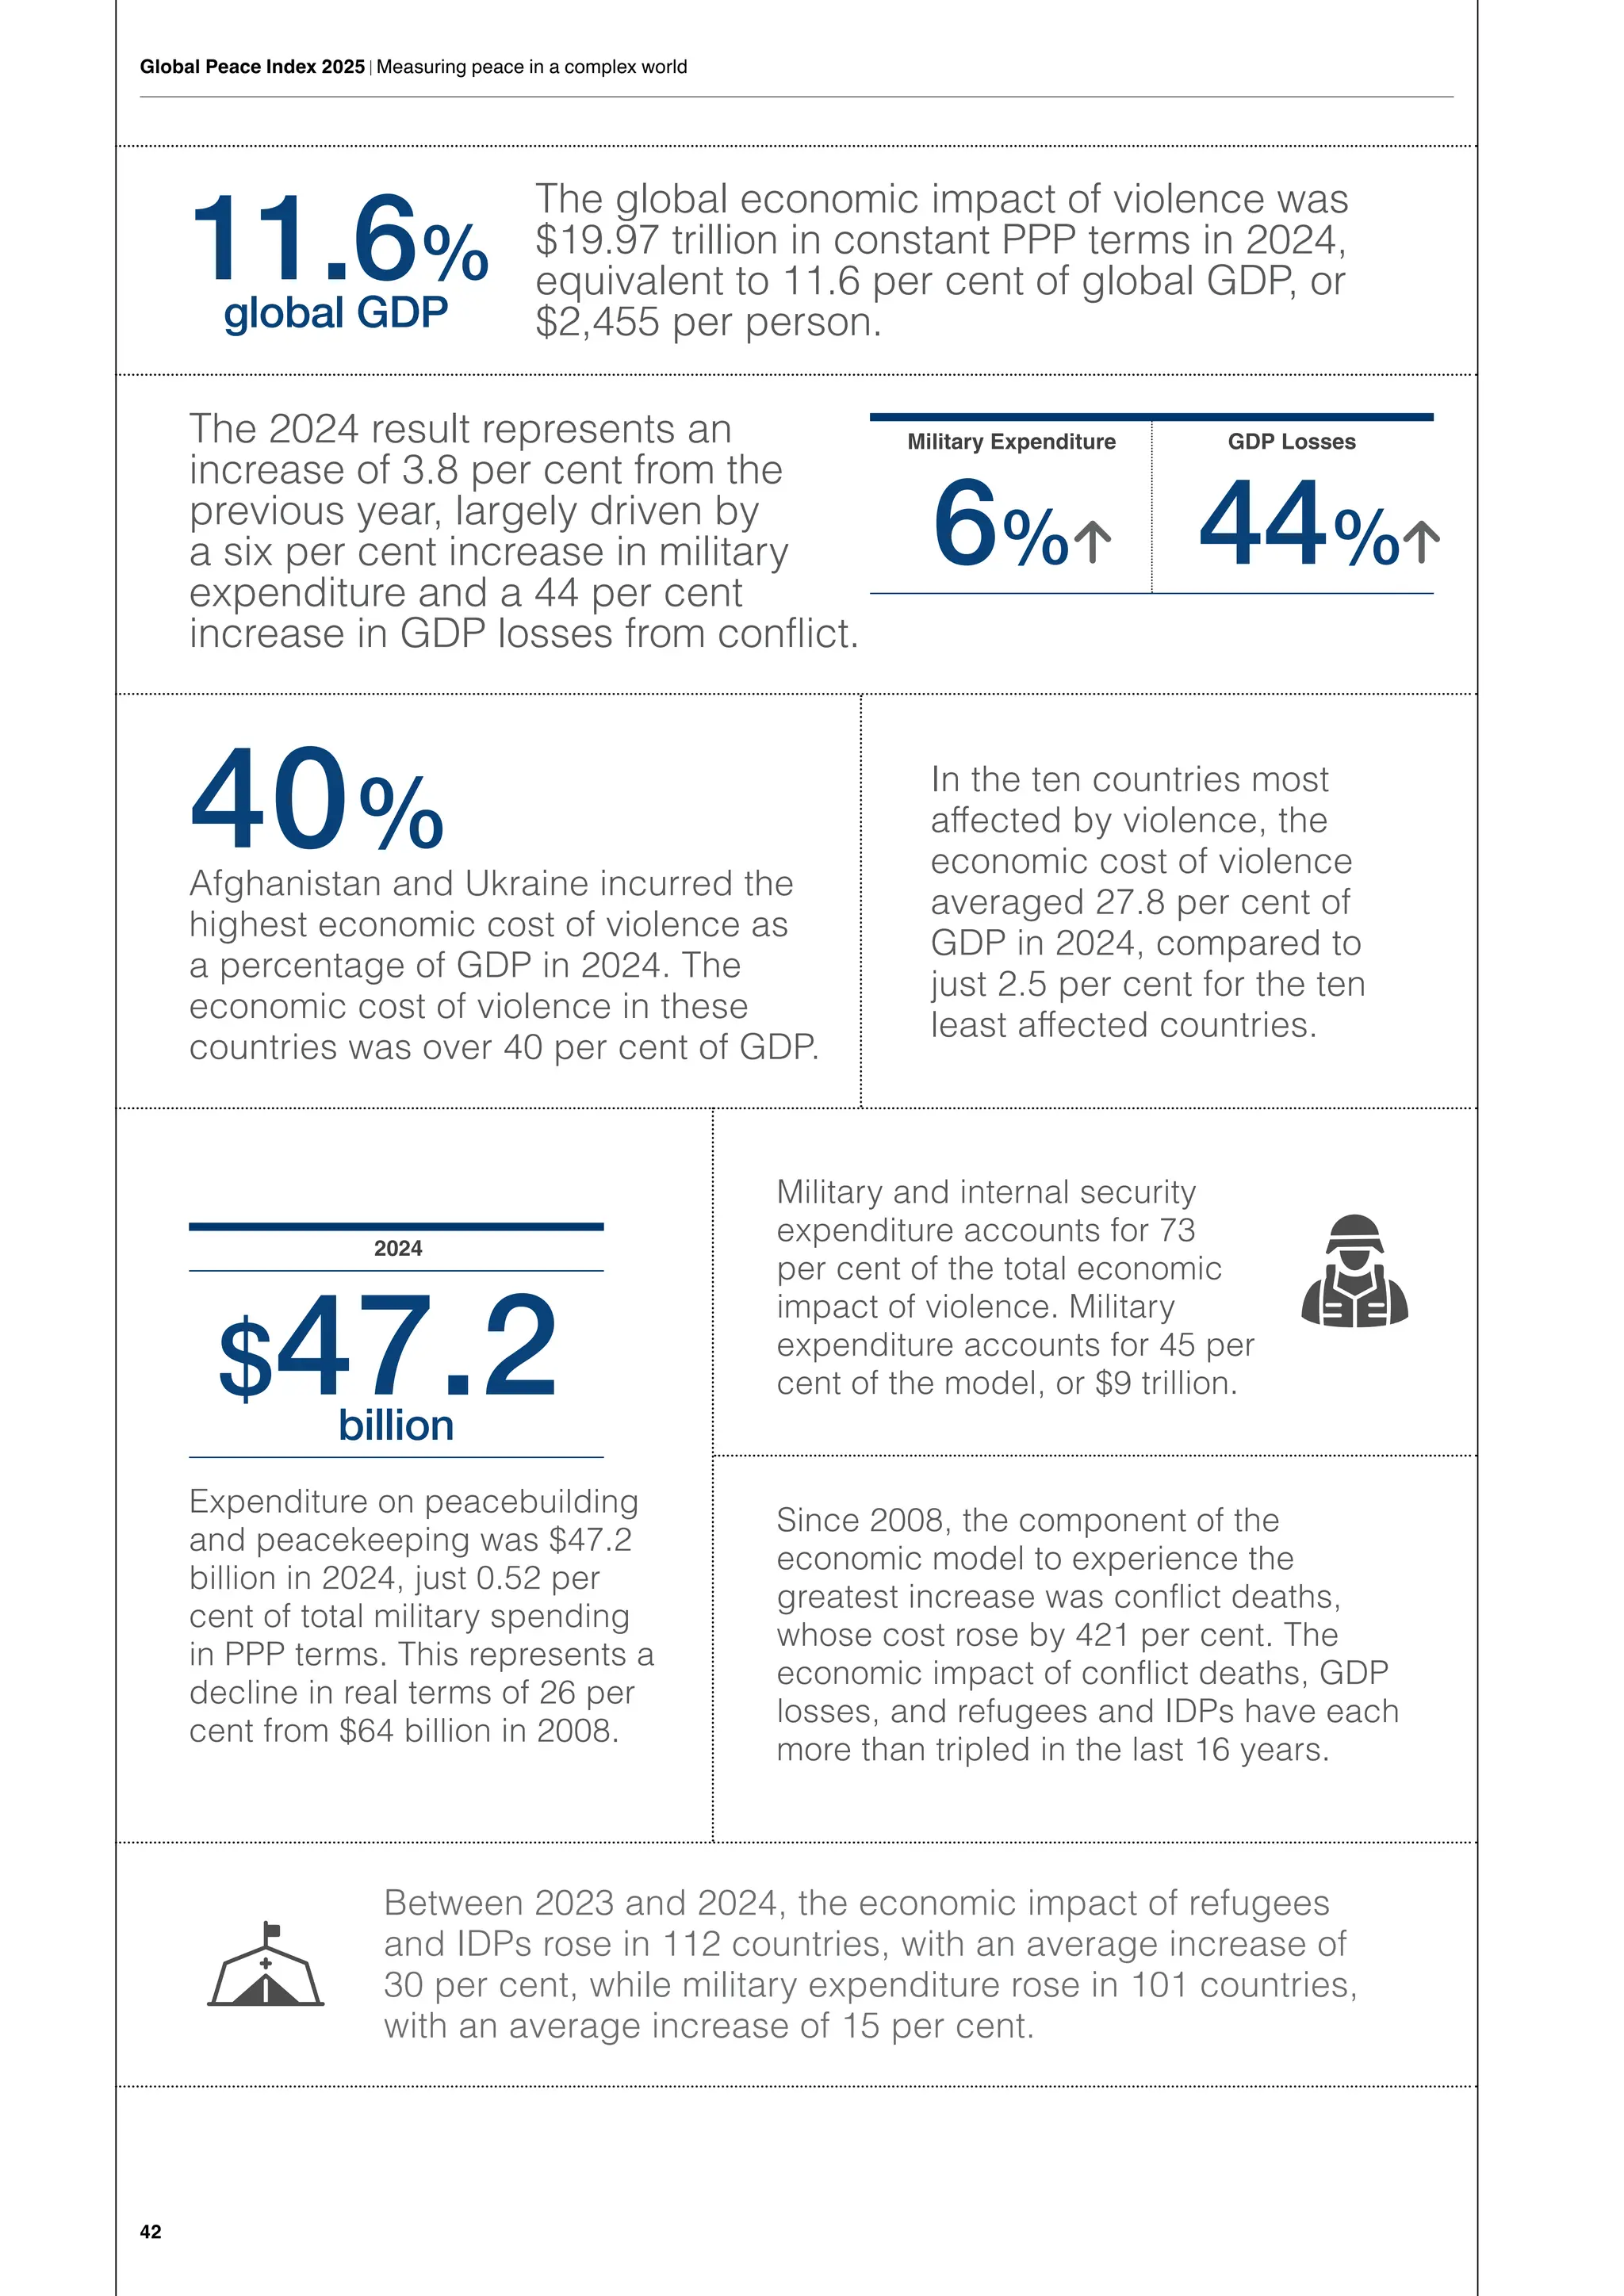
• The global economic impact of violence was $19.97 trillion in
constant PPP terms in 2024, equivalent to 11.6 per cent of global
GDP, or $2,455 per person.
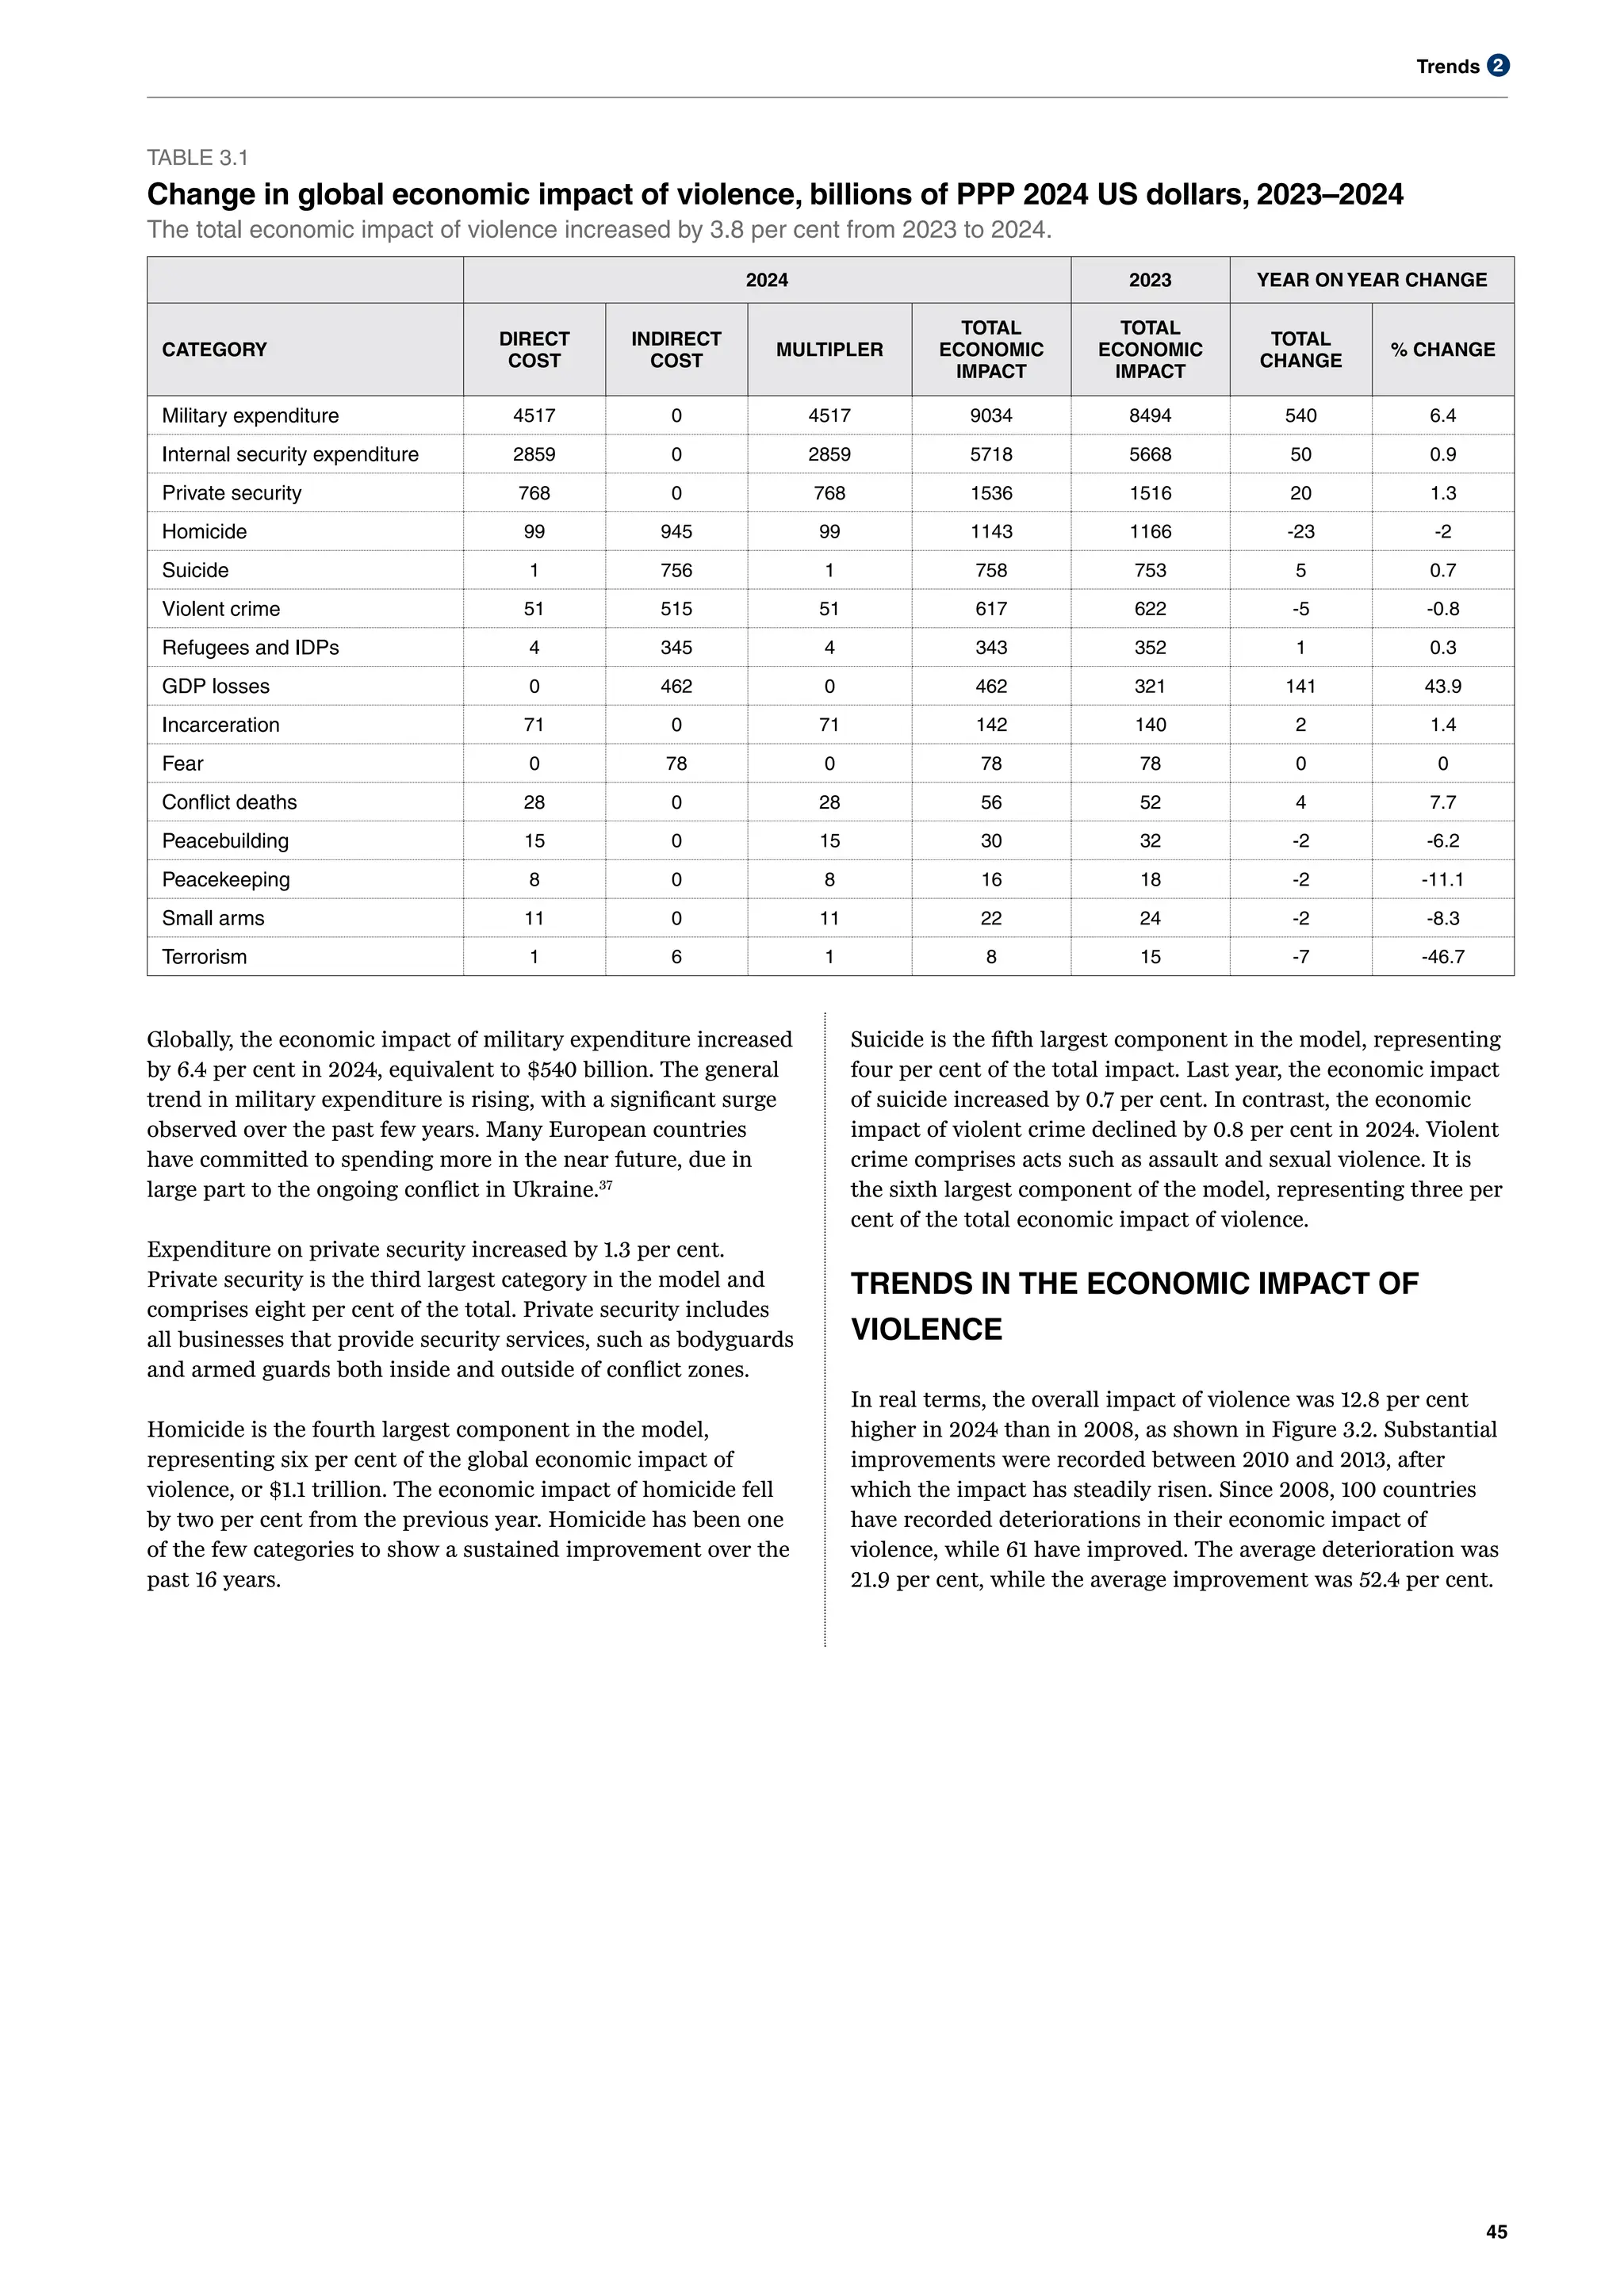
• The 2024 result represents an increase of 3.8 per cent from the
previous year, largely driven by a six per cent increase in military
expenditure and a 44 per cent increase in GDP losses from conflict.
• Afghanistan and Ukraine incurred the highest economic cost of
violence as a percentage of GDP in 2024. The economic cost of
violence in these countries was over 40 per cent of GDP.
• In the ten countries most affected by violence, the economic cost of
violence averaged 27.8 per cent of GDP in 2024, compared to just
2.5 per cent for the ten least affected countries.
• Expenditure on peacebuilding and peacekeeping was $47.2 billion in
2024, just 0.52 per cent of total military spending in PPP terms. This
represents a decline in real terms of 26 per cent from $64 billion in
2008.
• Military and internal security expenditure accounts for 73 per cent of
the total economic impact of violence. Military expenditure accounts
for 45 per cent of the model, or $9 trillion.
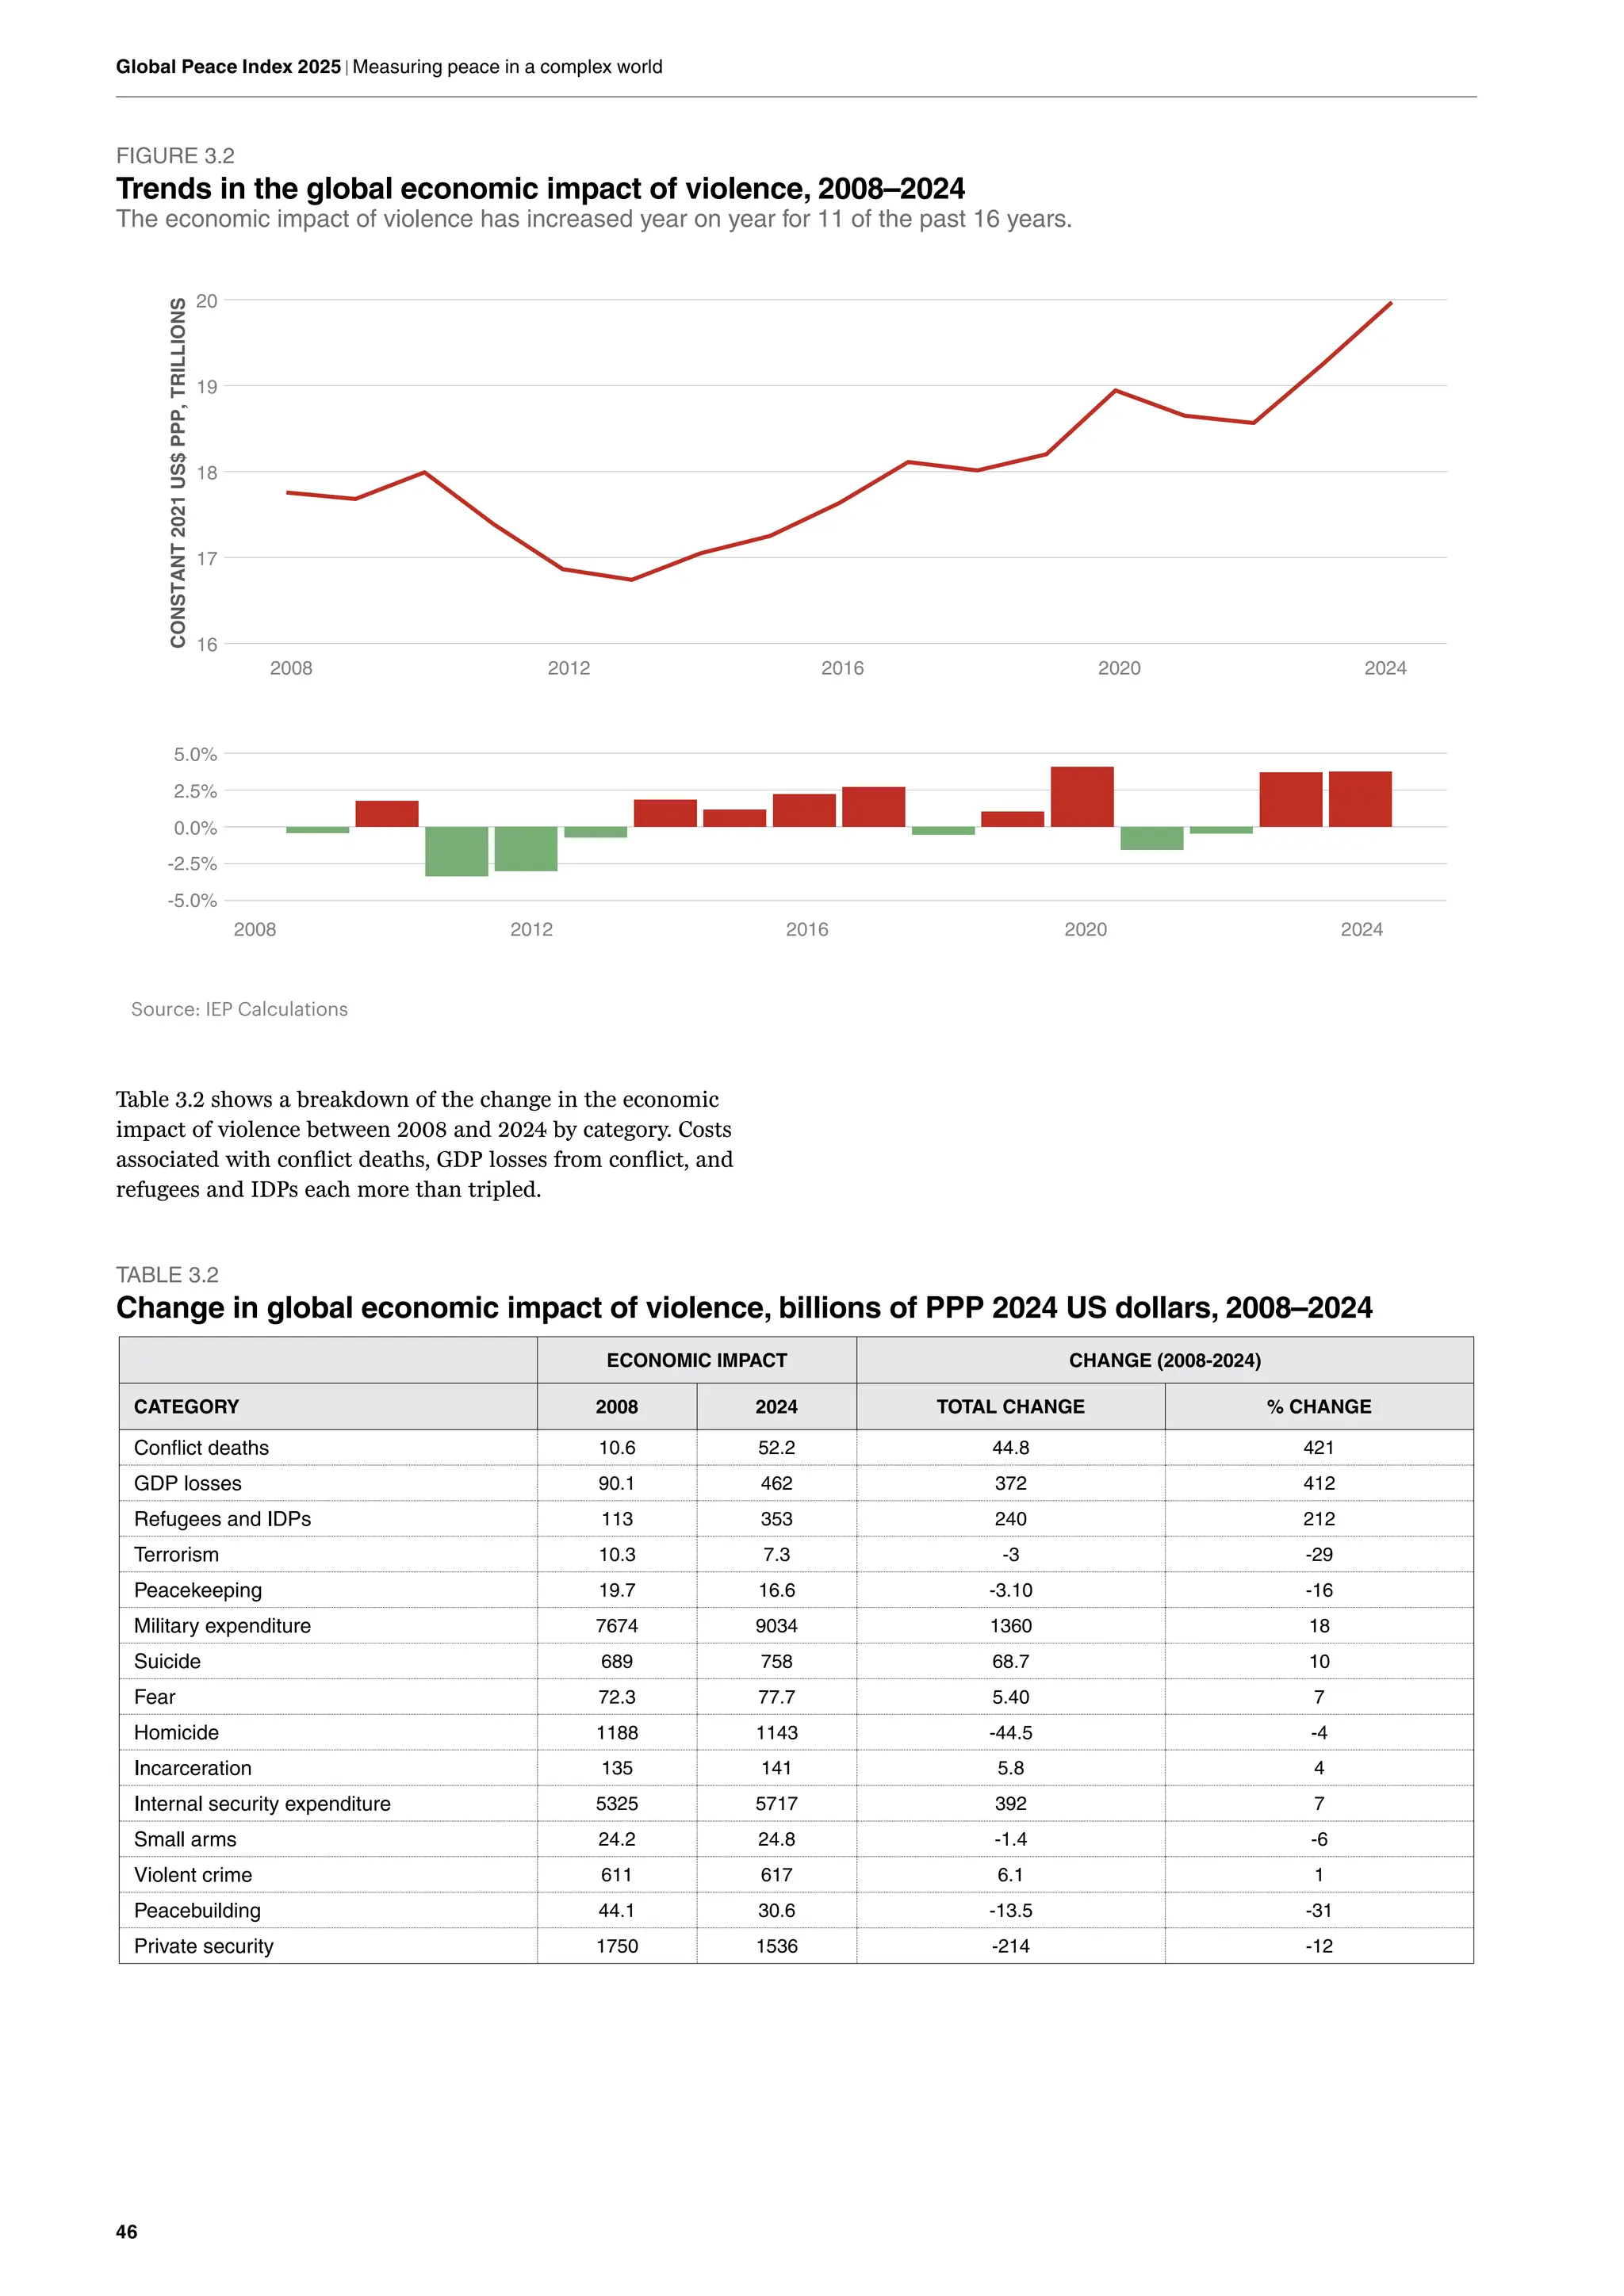
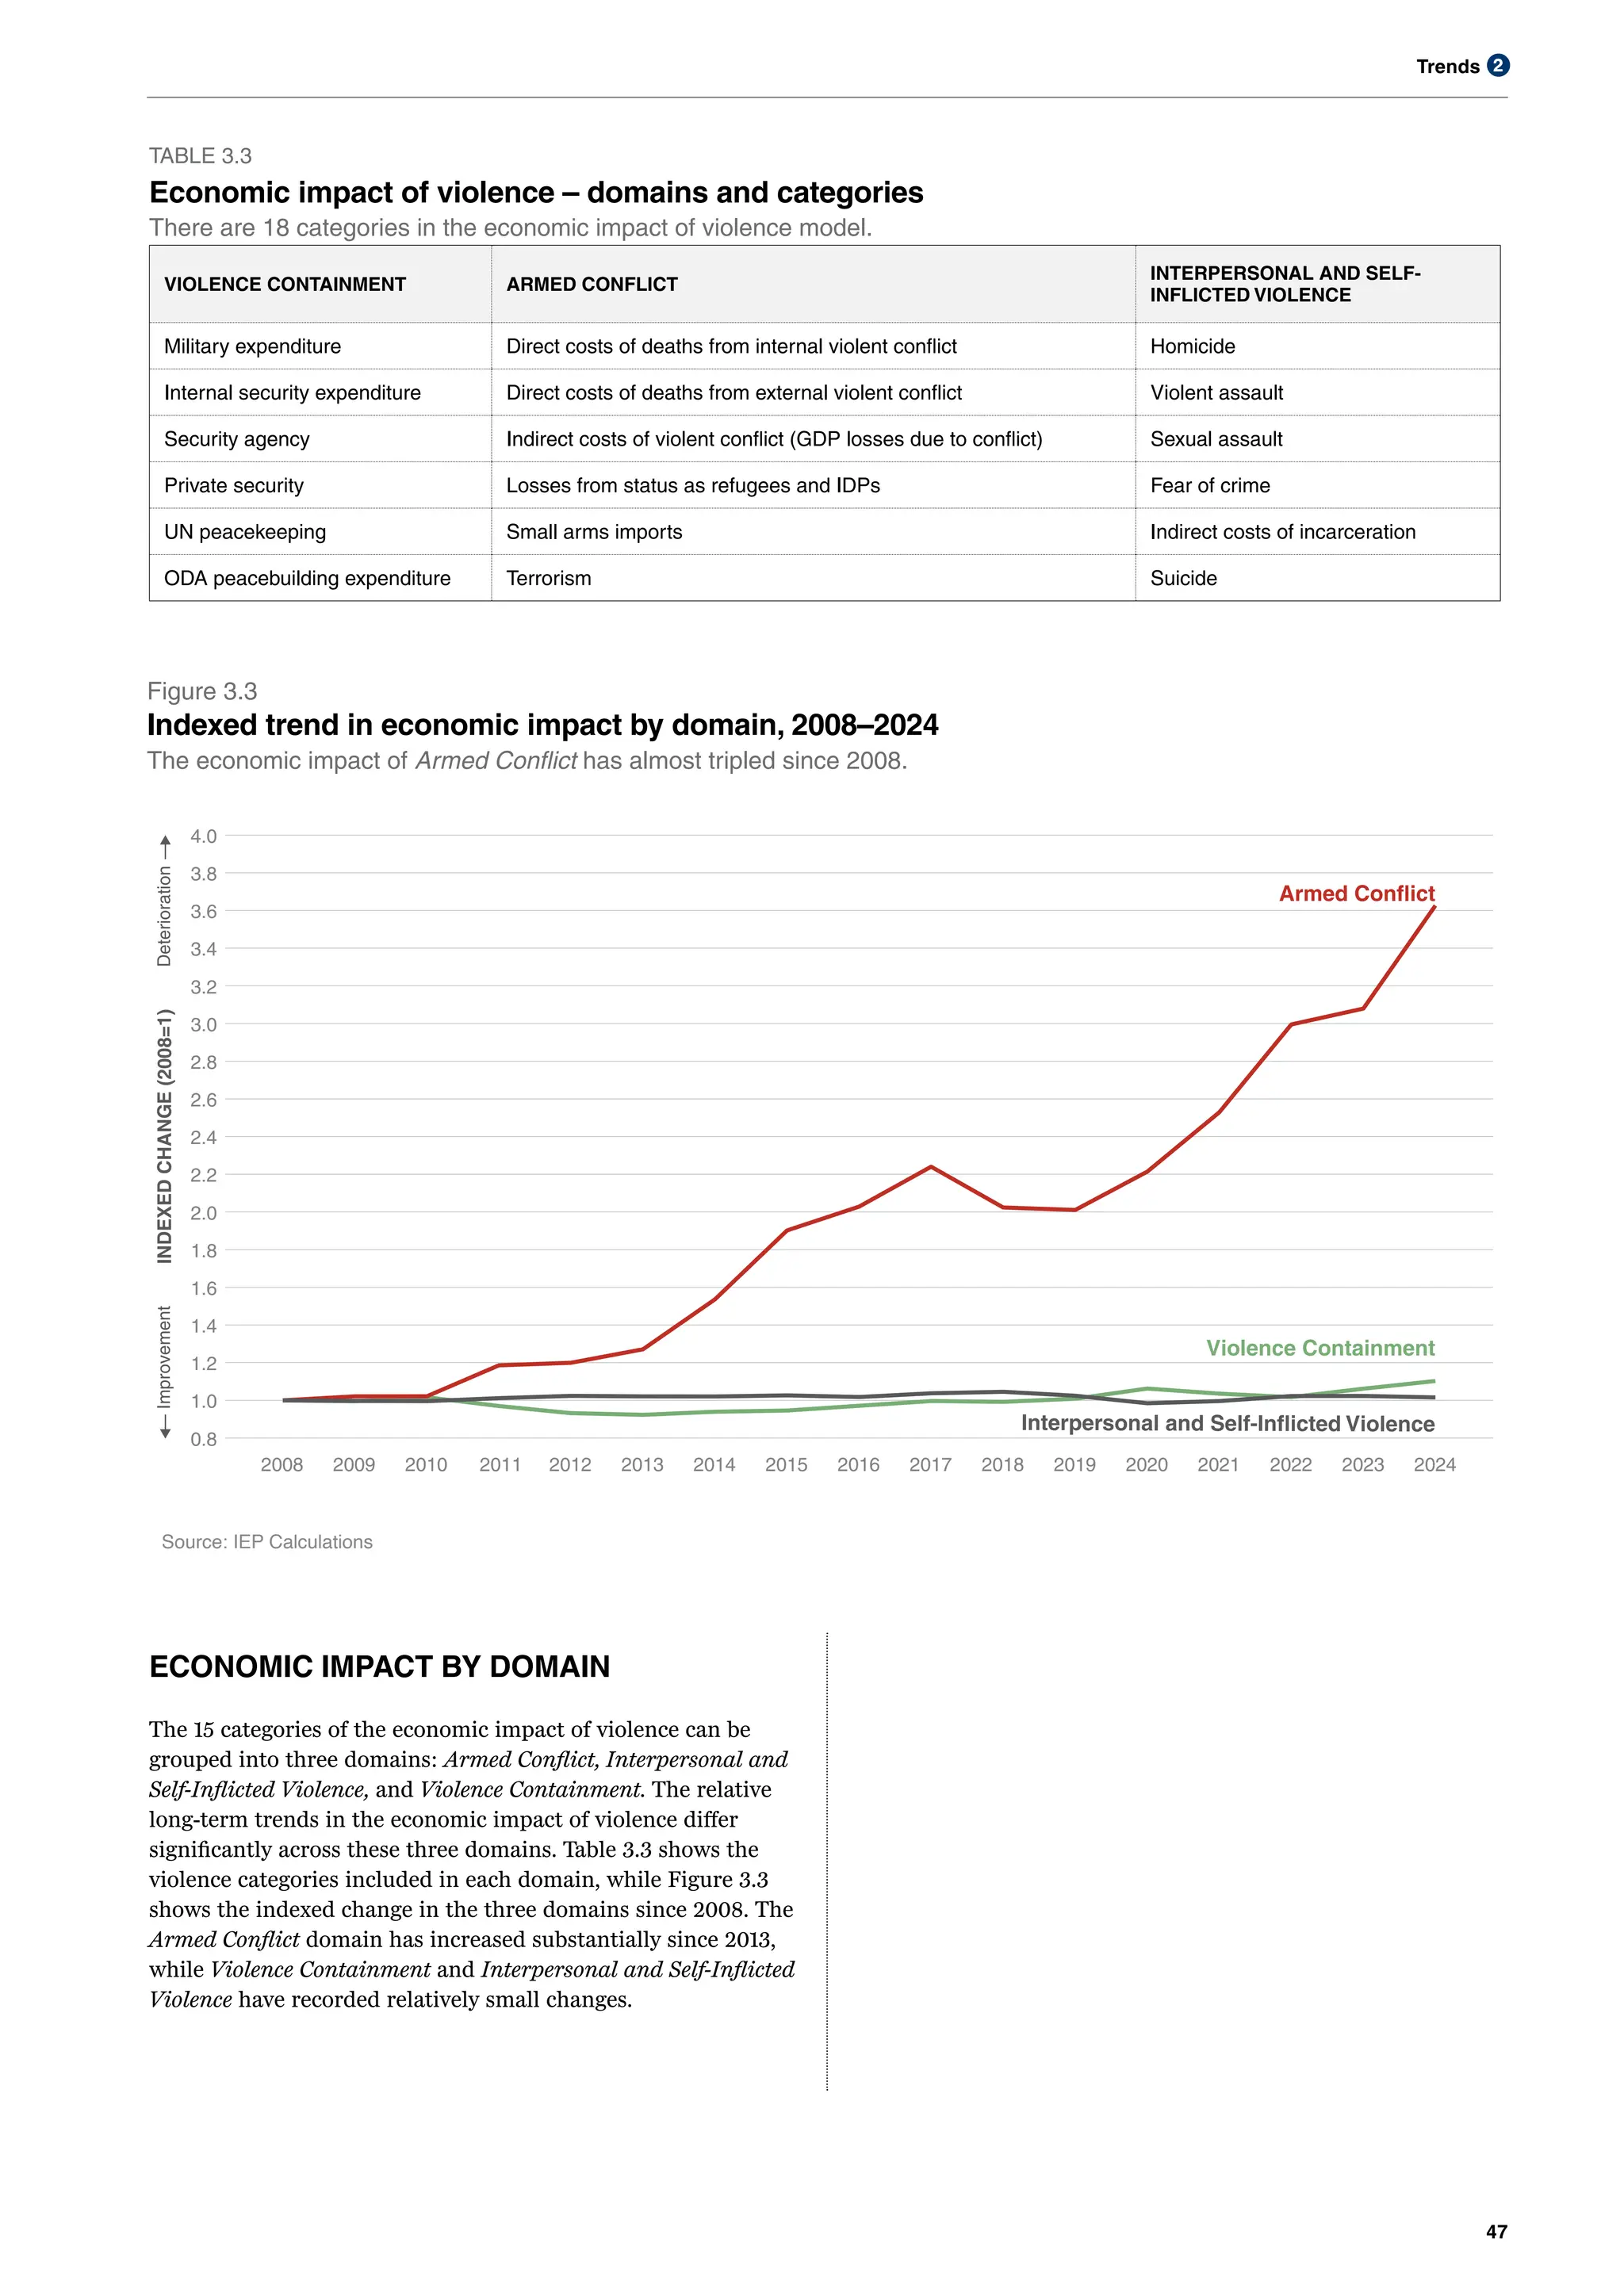
• Since 2008, the component of the economic model to experience the
greatest increase was conflict deaths, whose cost rose by 421 per
cent. The economic impact of conflict deaths, GDP losses, and
refugees and IDPs, have each more than tripled in the last 16 years.
• Between 2023 and 2024, the economic impact of refugees and IDPs
rose in 112 countries, with an average increase of 30 per cent, while
military expenditure rose in 101 countries, with an average increase
of 15 per cent.
• Many of the macro-economic adjustments happening globally are
likely to increase the risk of conflict in the near future.
• In 2024, global GDP growth remained modest at 3.3 per cent, while
inflation stayed elevated at 5.8 per cent, despite easing from its 2022
peak.
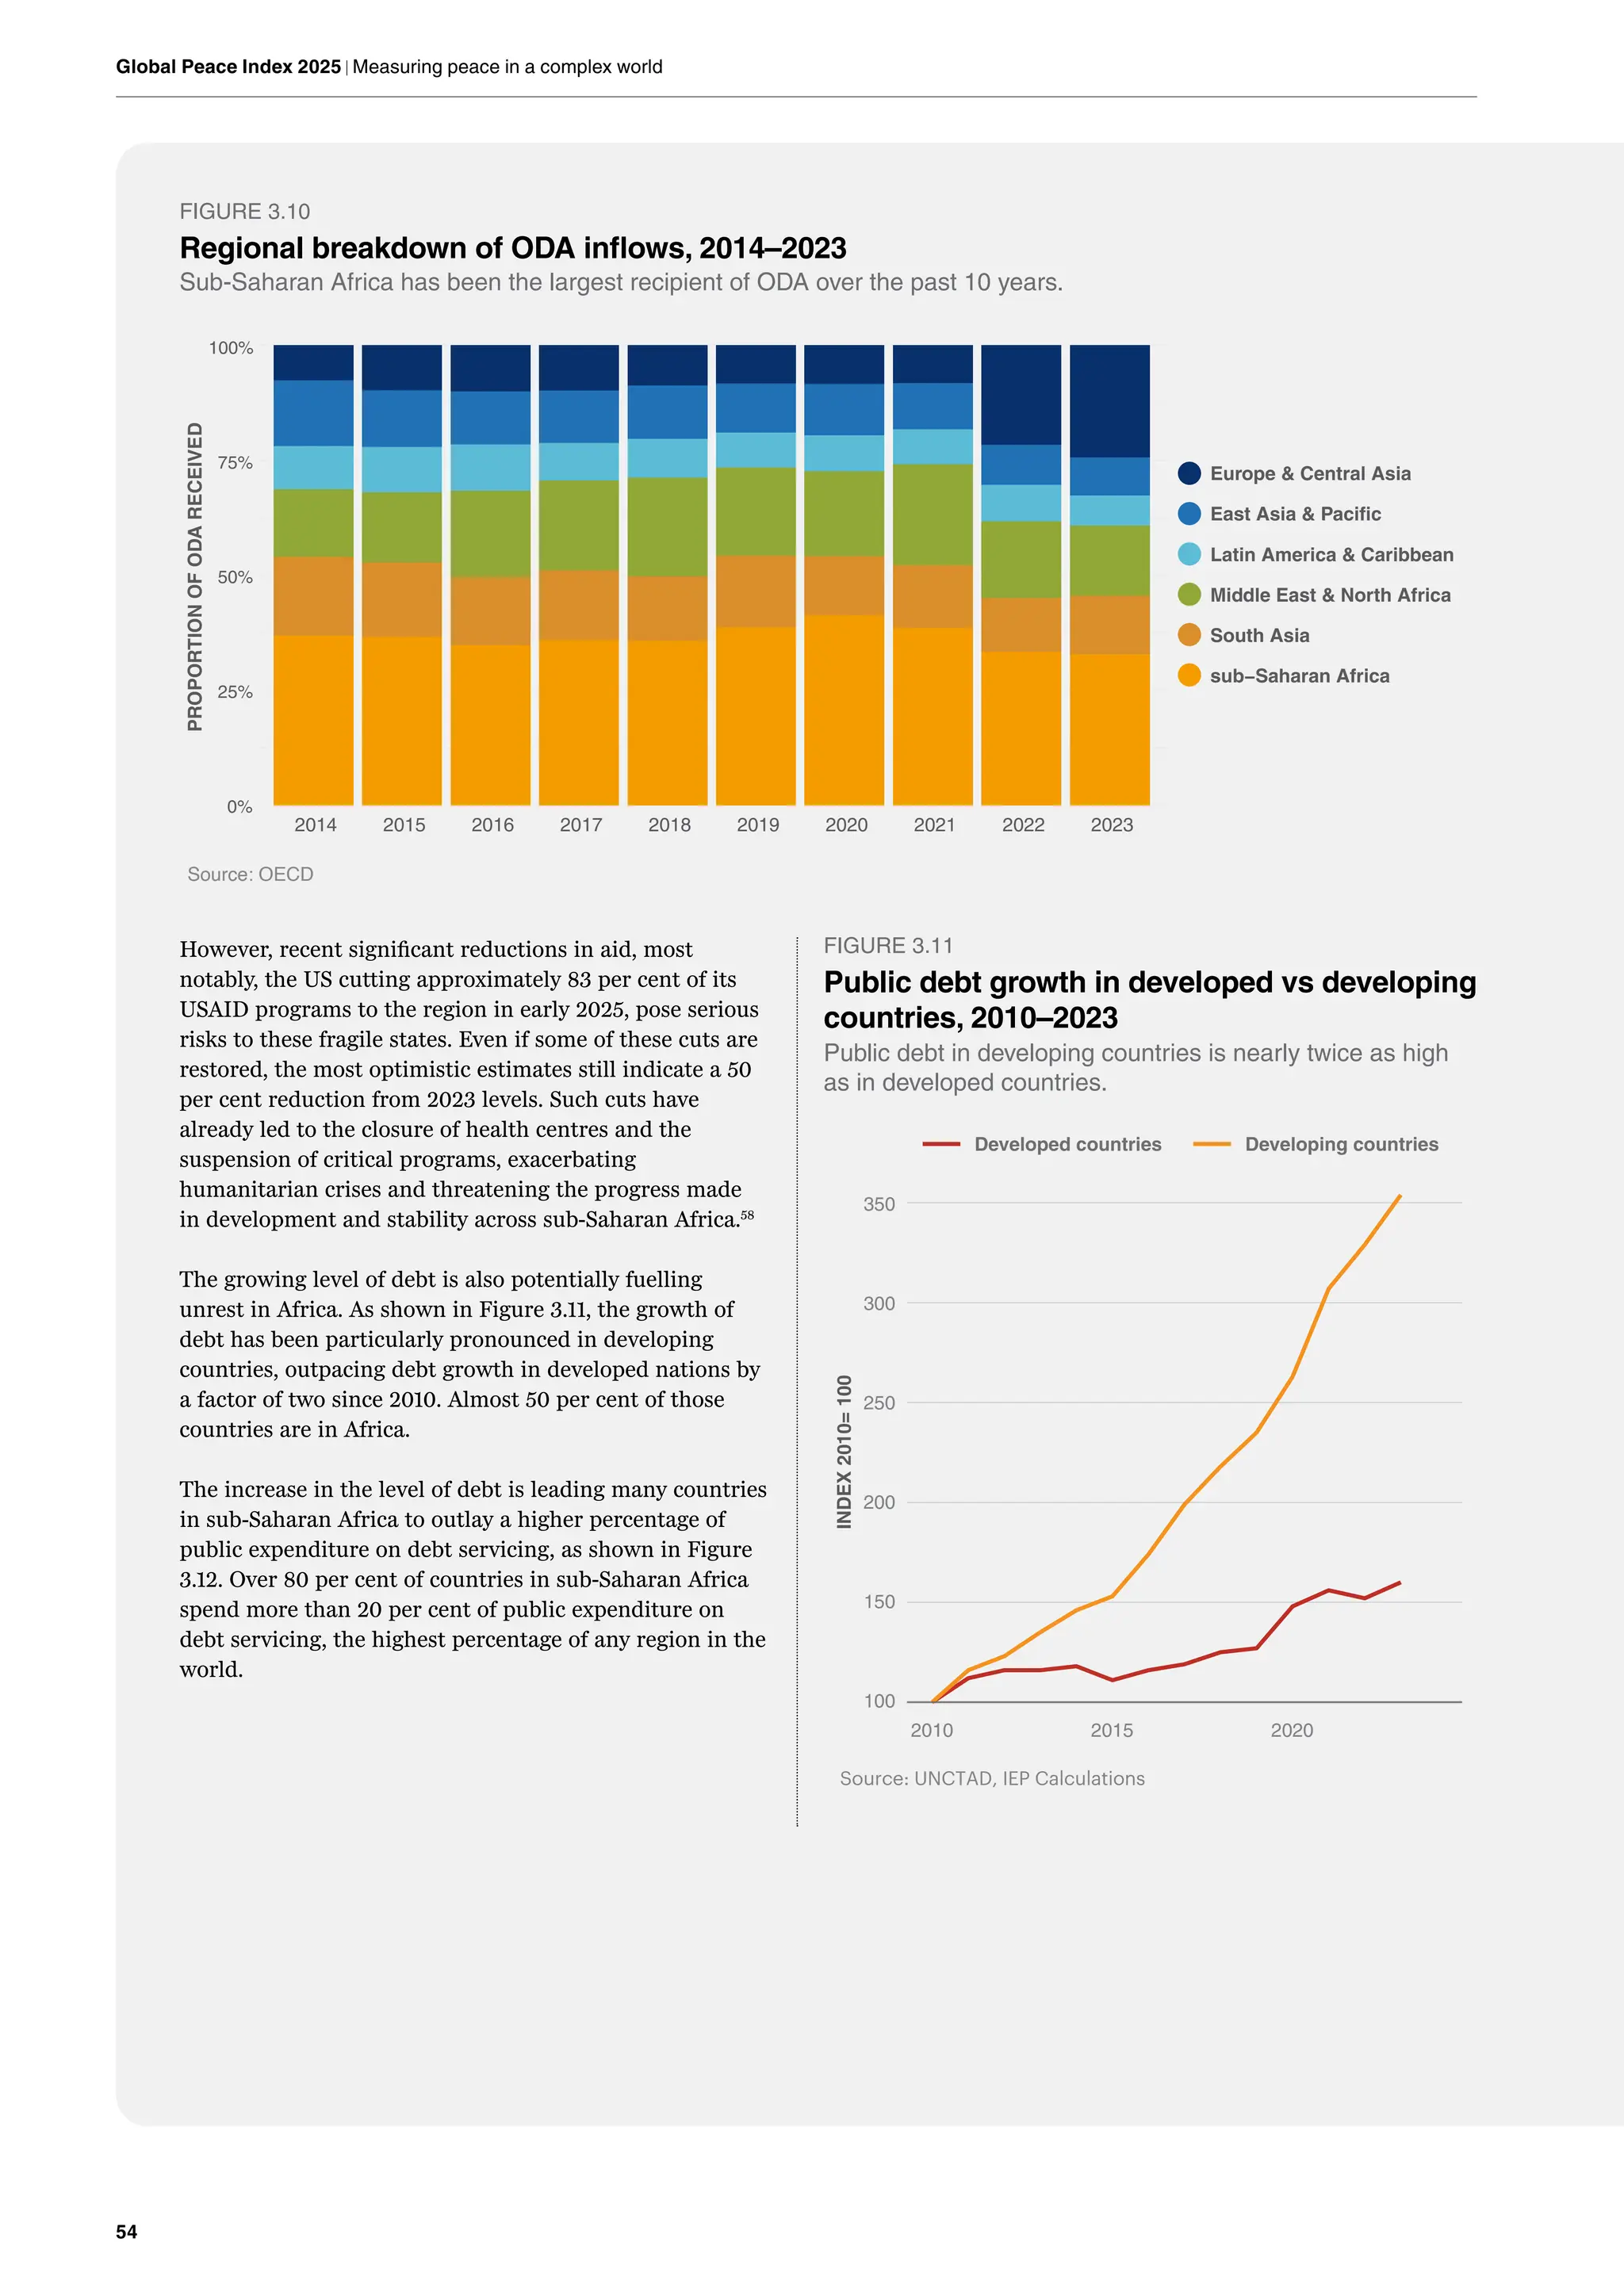
• Sub-Saharan Africa has been the largest recipient of Official
Development Assistance over the past decade, but recent aid cuts
will affect essential services and development.
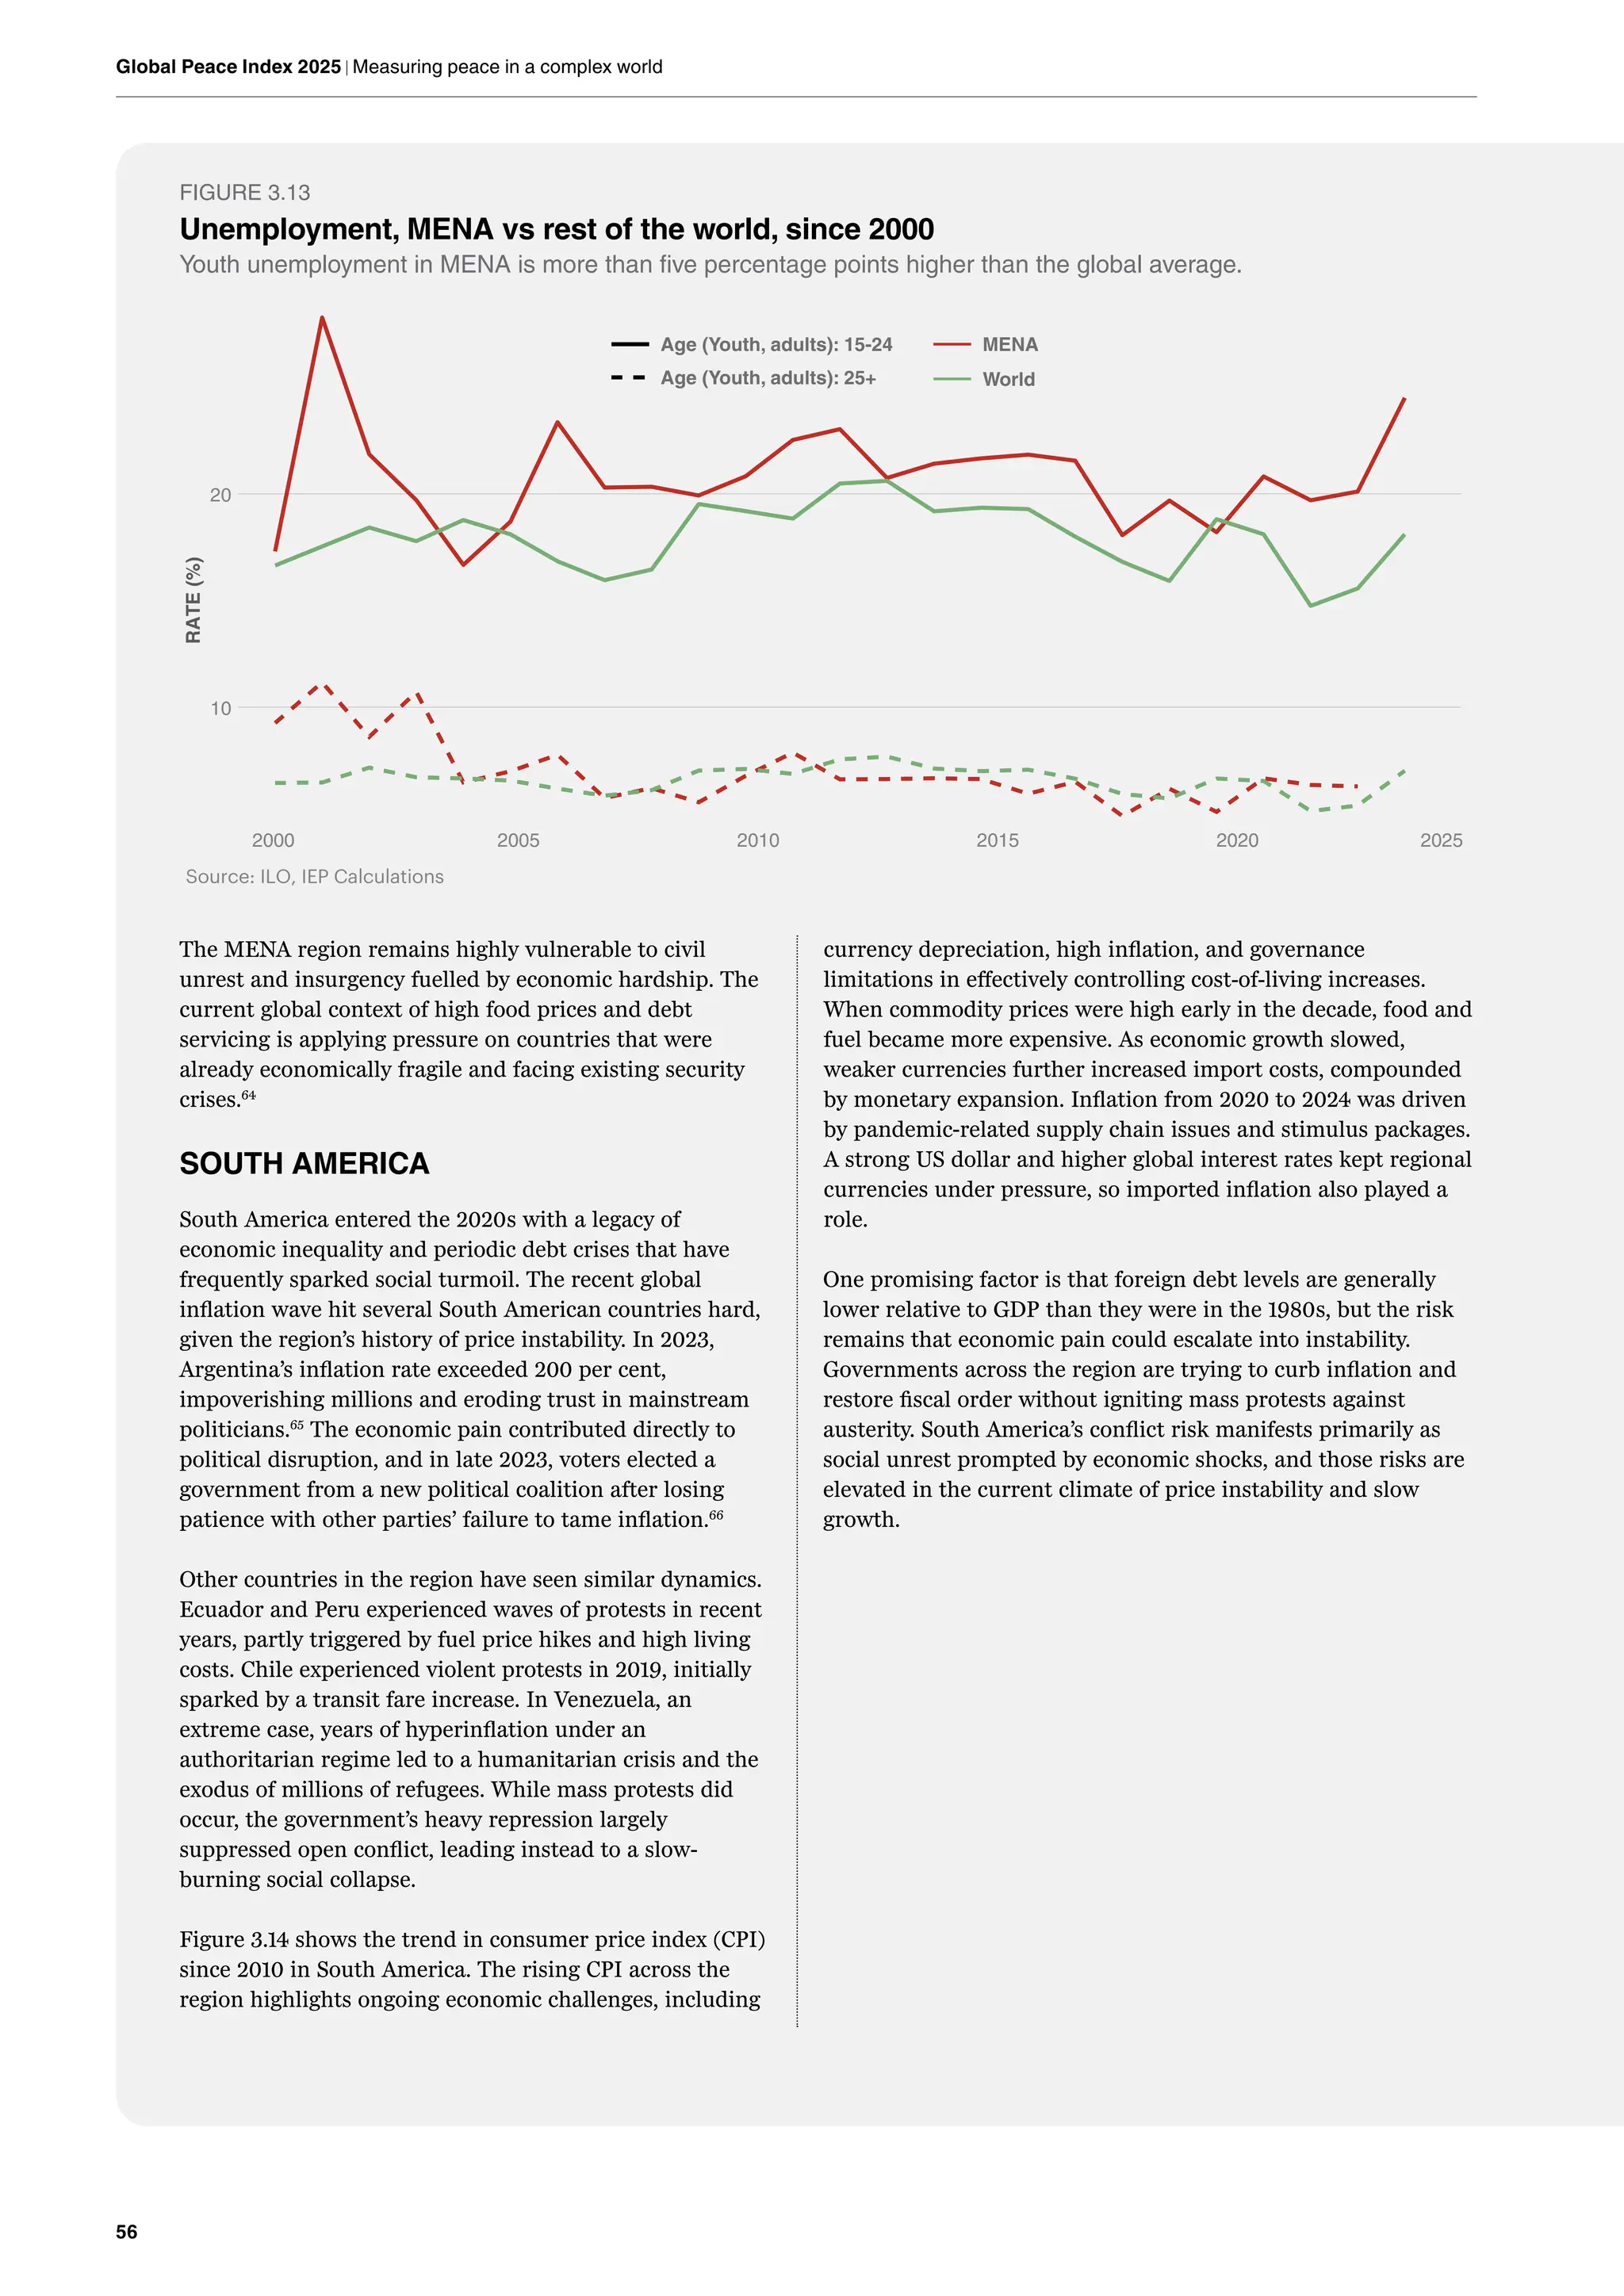
• Youth unemployment in the Middle East and North Africa remained
high, at 24.5 per cent in 2023, which was more than ten percentage
points above the global average.
• While total global debt as proportion of GDP has declined slightly
since 2020, public debt continues to rise, reaching $97 trillion in
2023. Debt in developing countries has been growing twice as fast as
in advanced economies since 2010.
• Debt service is placing increasing pressure on public finances, with
economically developing countries spending an average of 42 per
cent of government revenue on servicing debt.
Section 4 – Why Conflicts Escalate
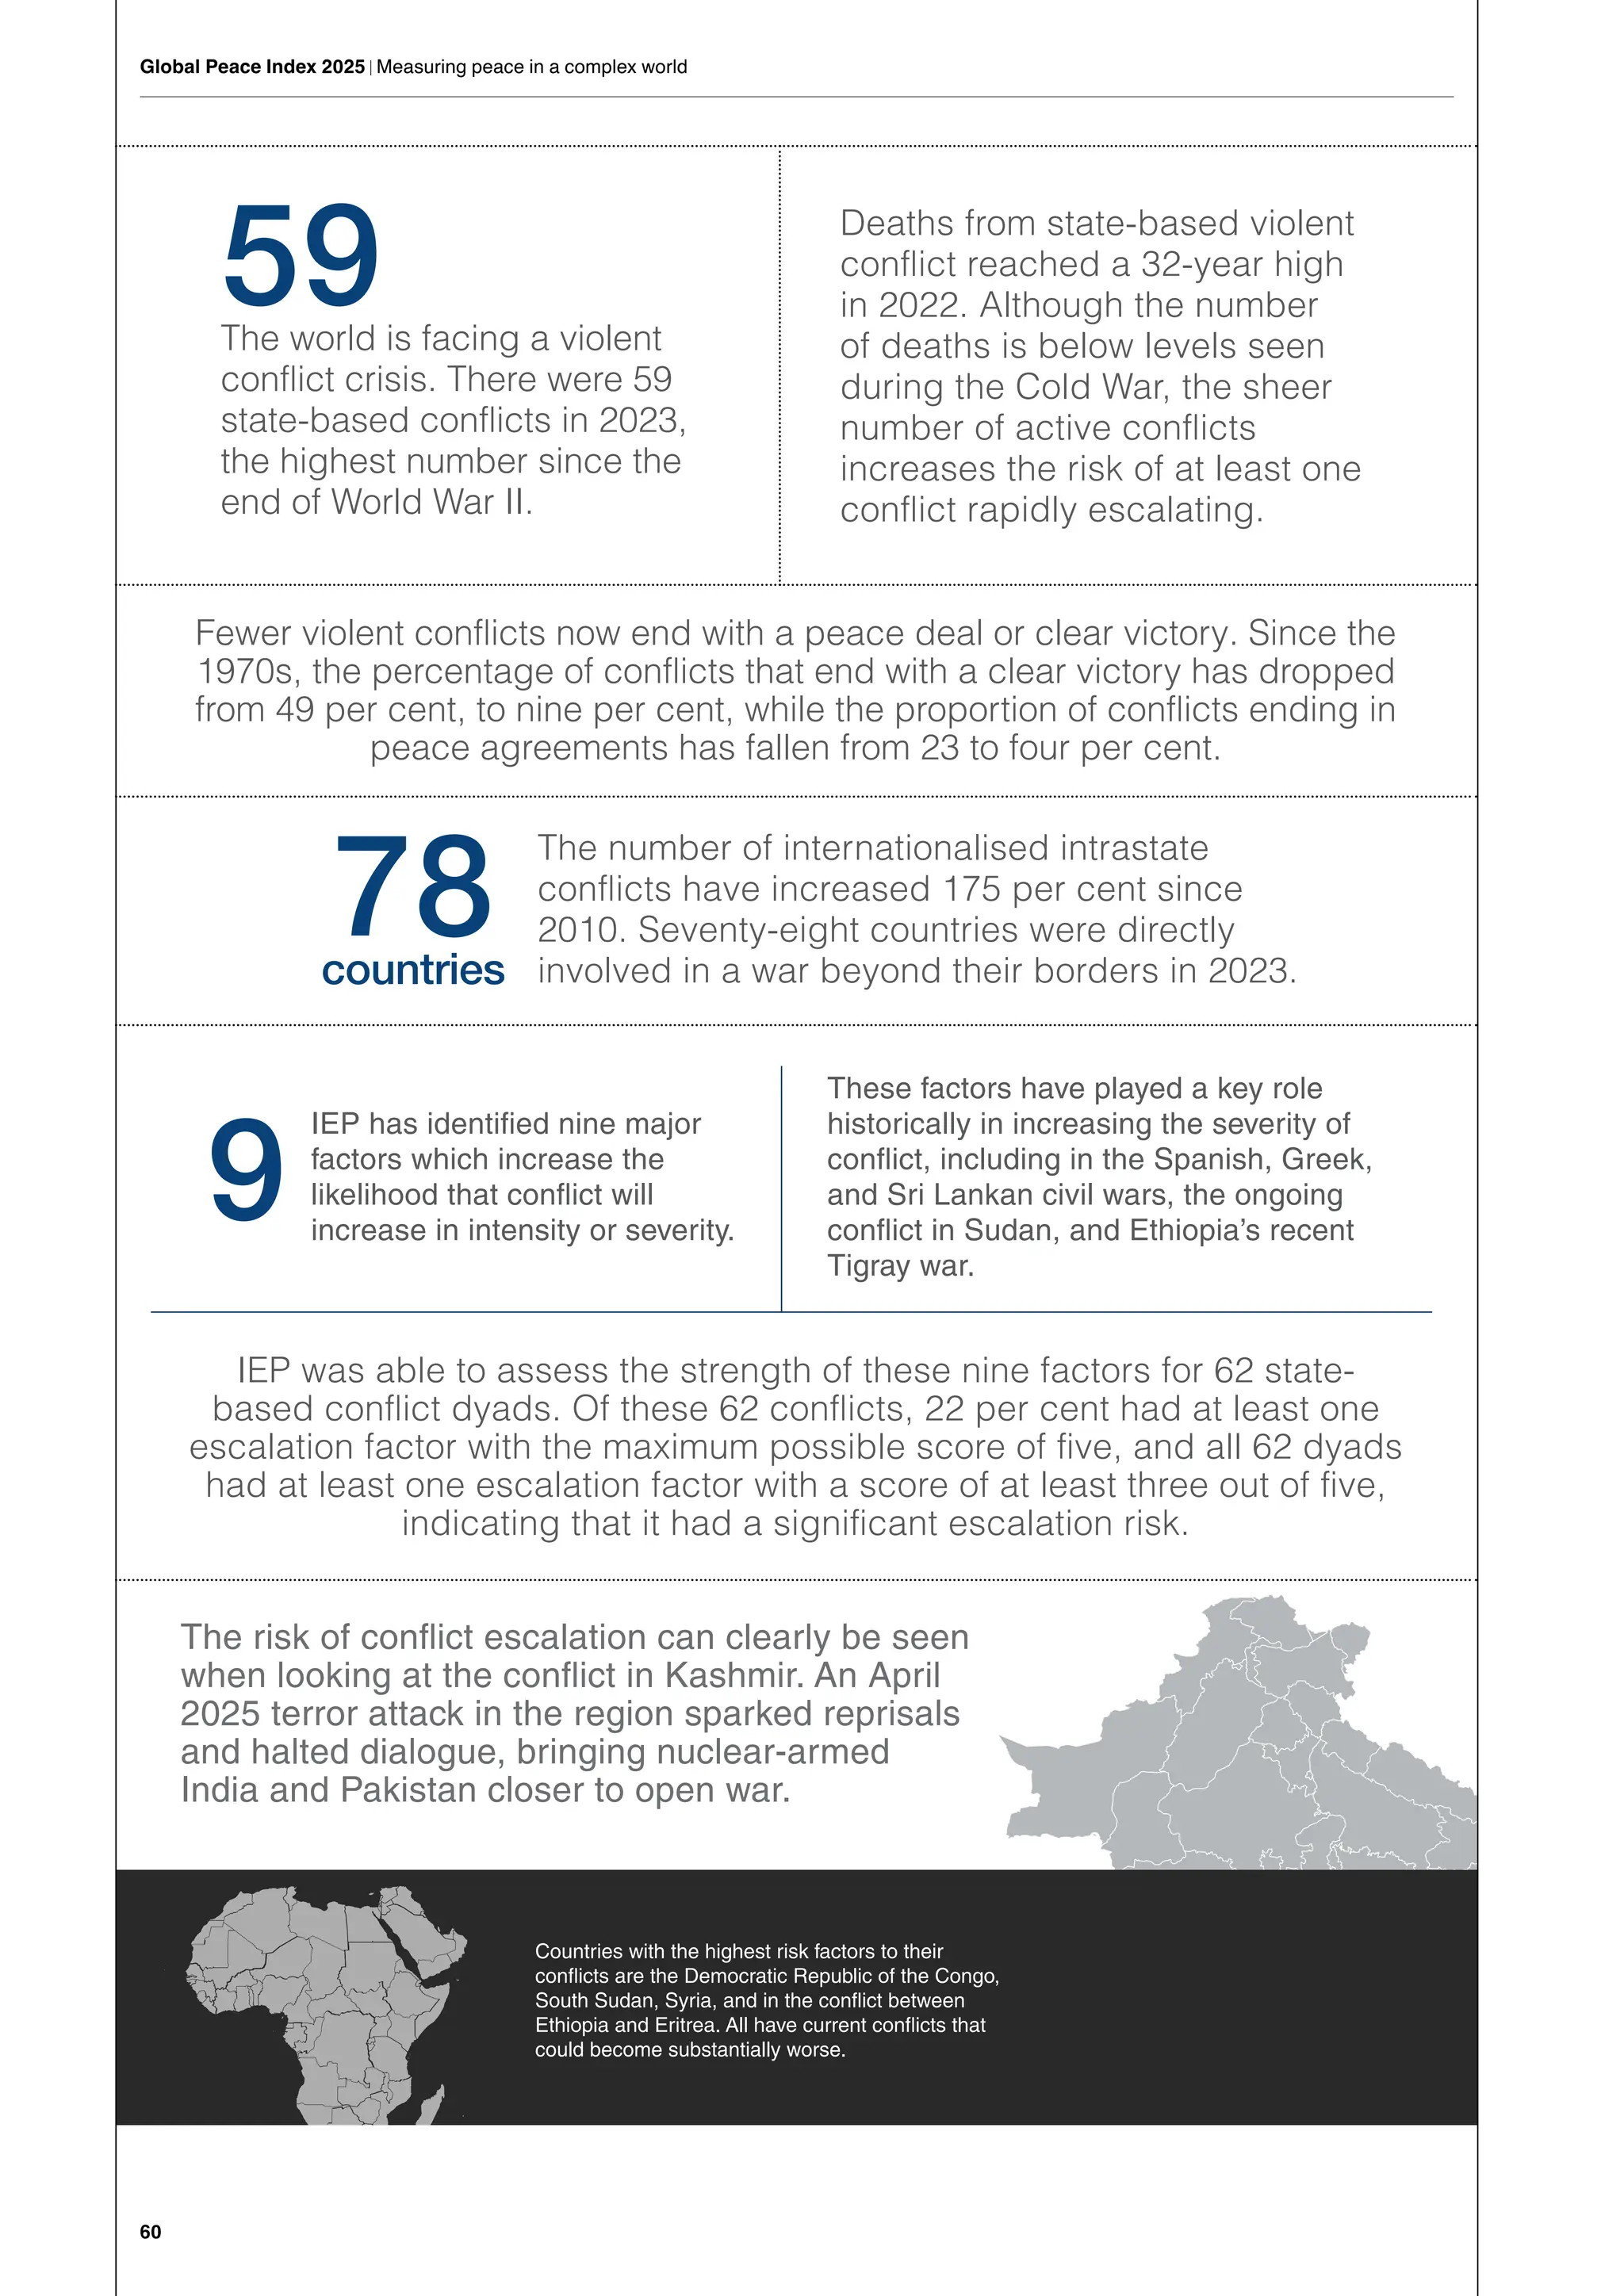
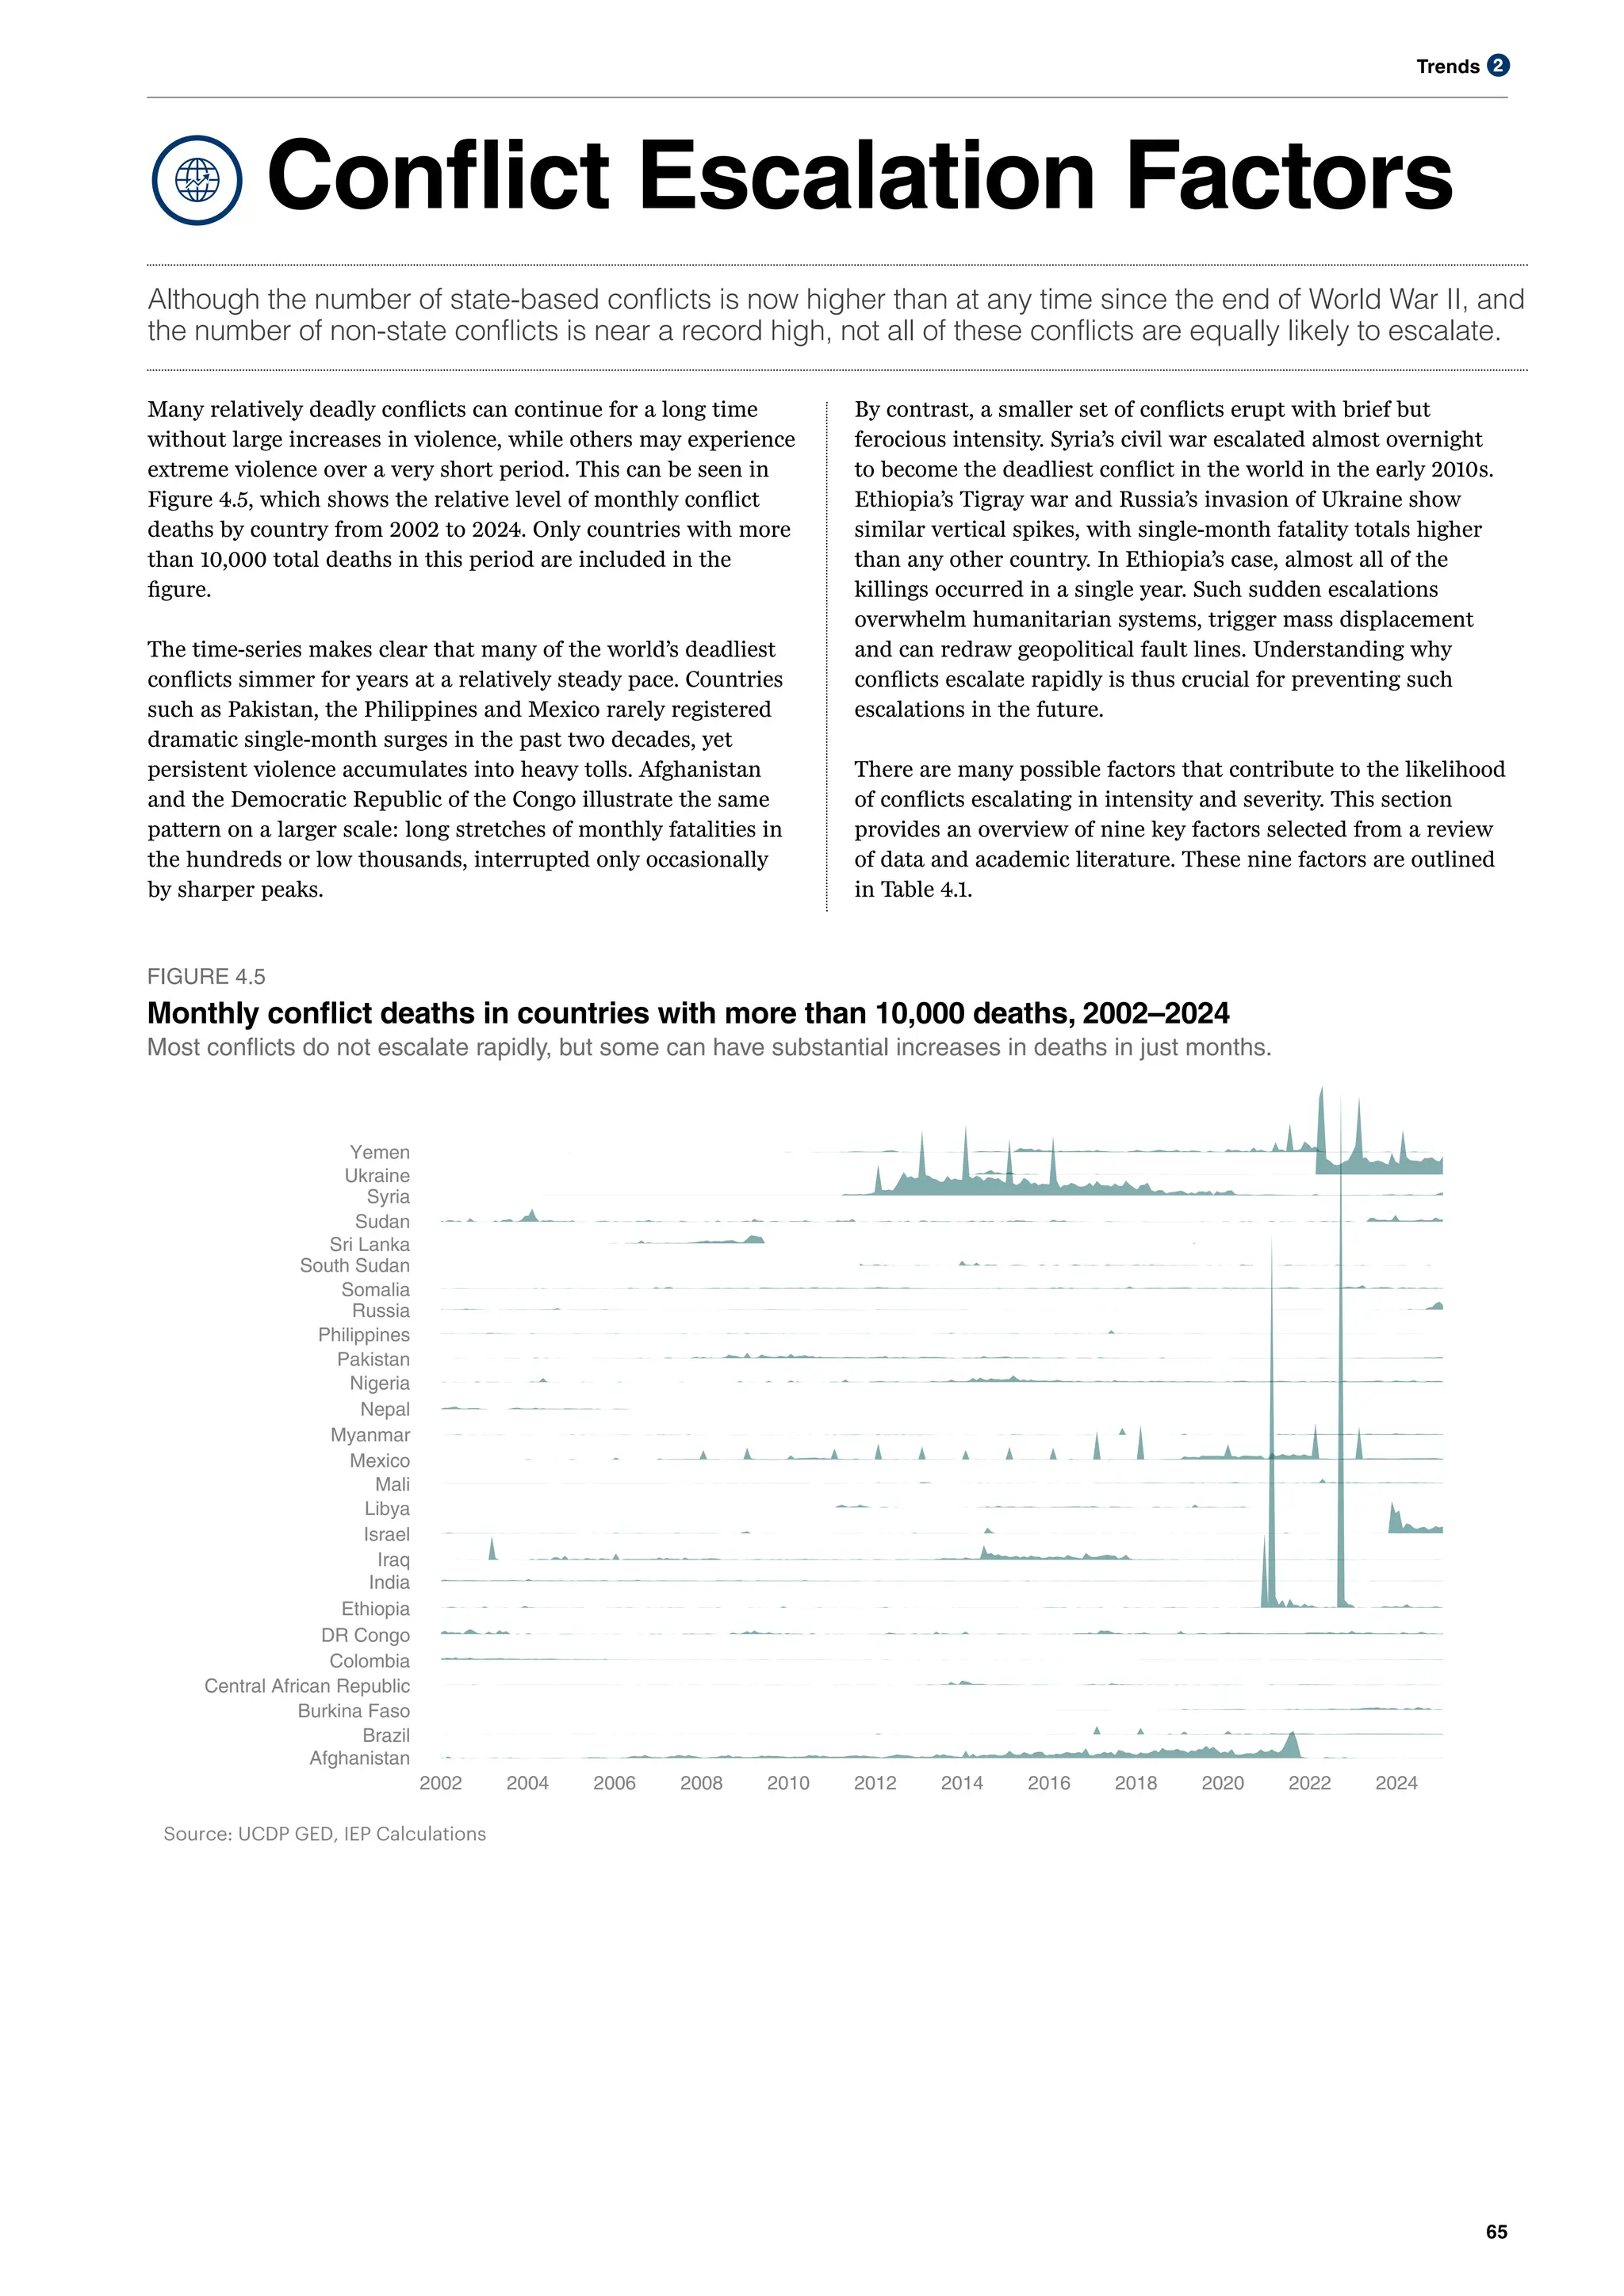
• The world is facing a violent conflict crisis. There were 59 state-based
conflicts in 2023, the highest number since the end of World War II.
• Deaths from state-based violent conflict reached a 32-year high in
2022. Although the number of deaths is below levels seen during
the Cold War, the sheer number of active conflicts increases the
risk of at least one conflict rapidly escalating.
• Fewer violent conflicts now end with a peace deal or clear victory.
Since the 1970s, the percentage of conflicts that end with a clear
victory has dropped from 49 per cent to nine per cent, while the
proportion of conflicts ending in peace agreements has fallen from
23 per cent to four per cent.
• The number of internationalised intrastate conflicts have increased
175 per cent since 2010. Seventy-eight countries were directly
involved in a war beyond their borders in 2023.
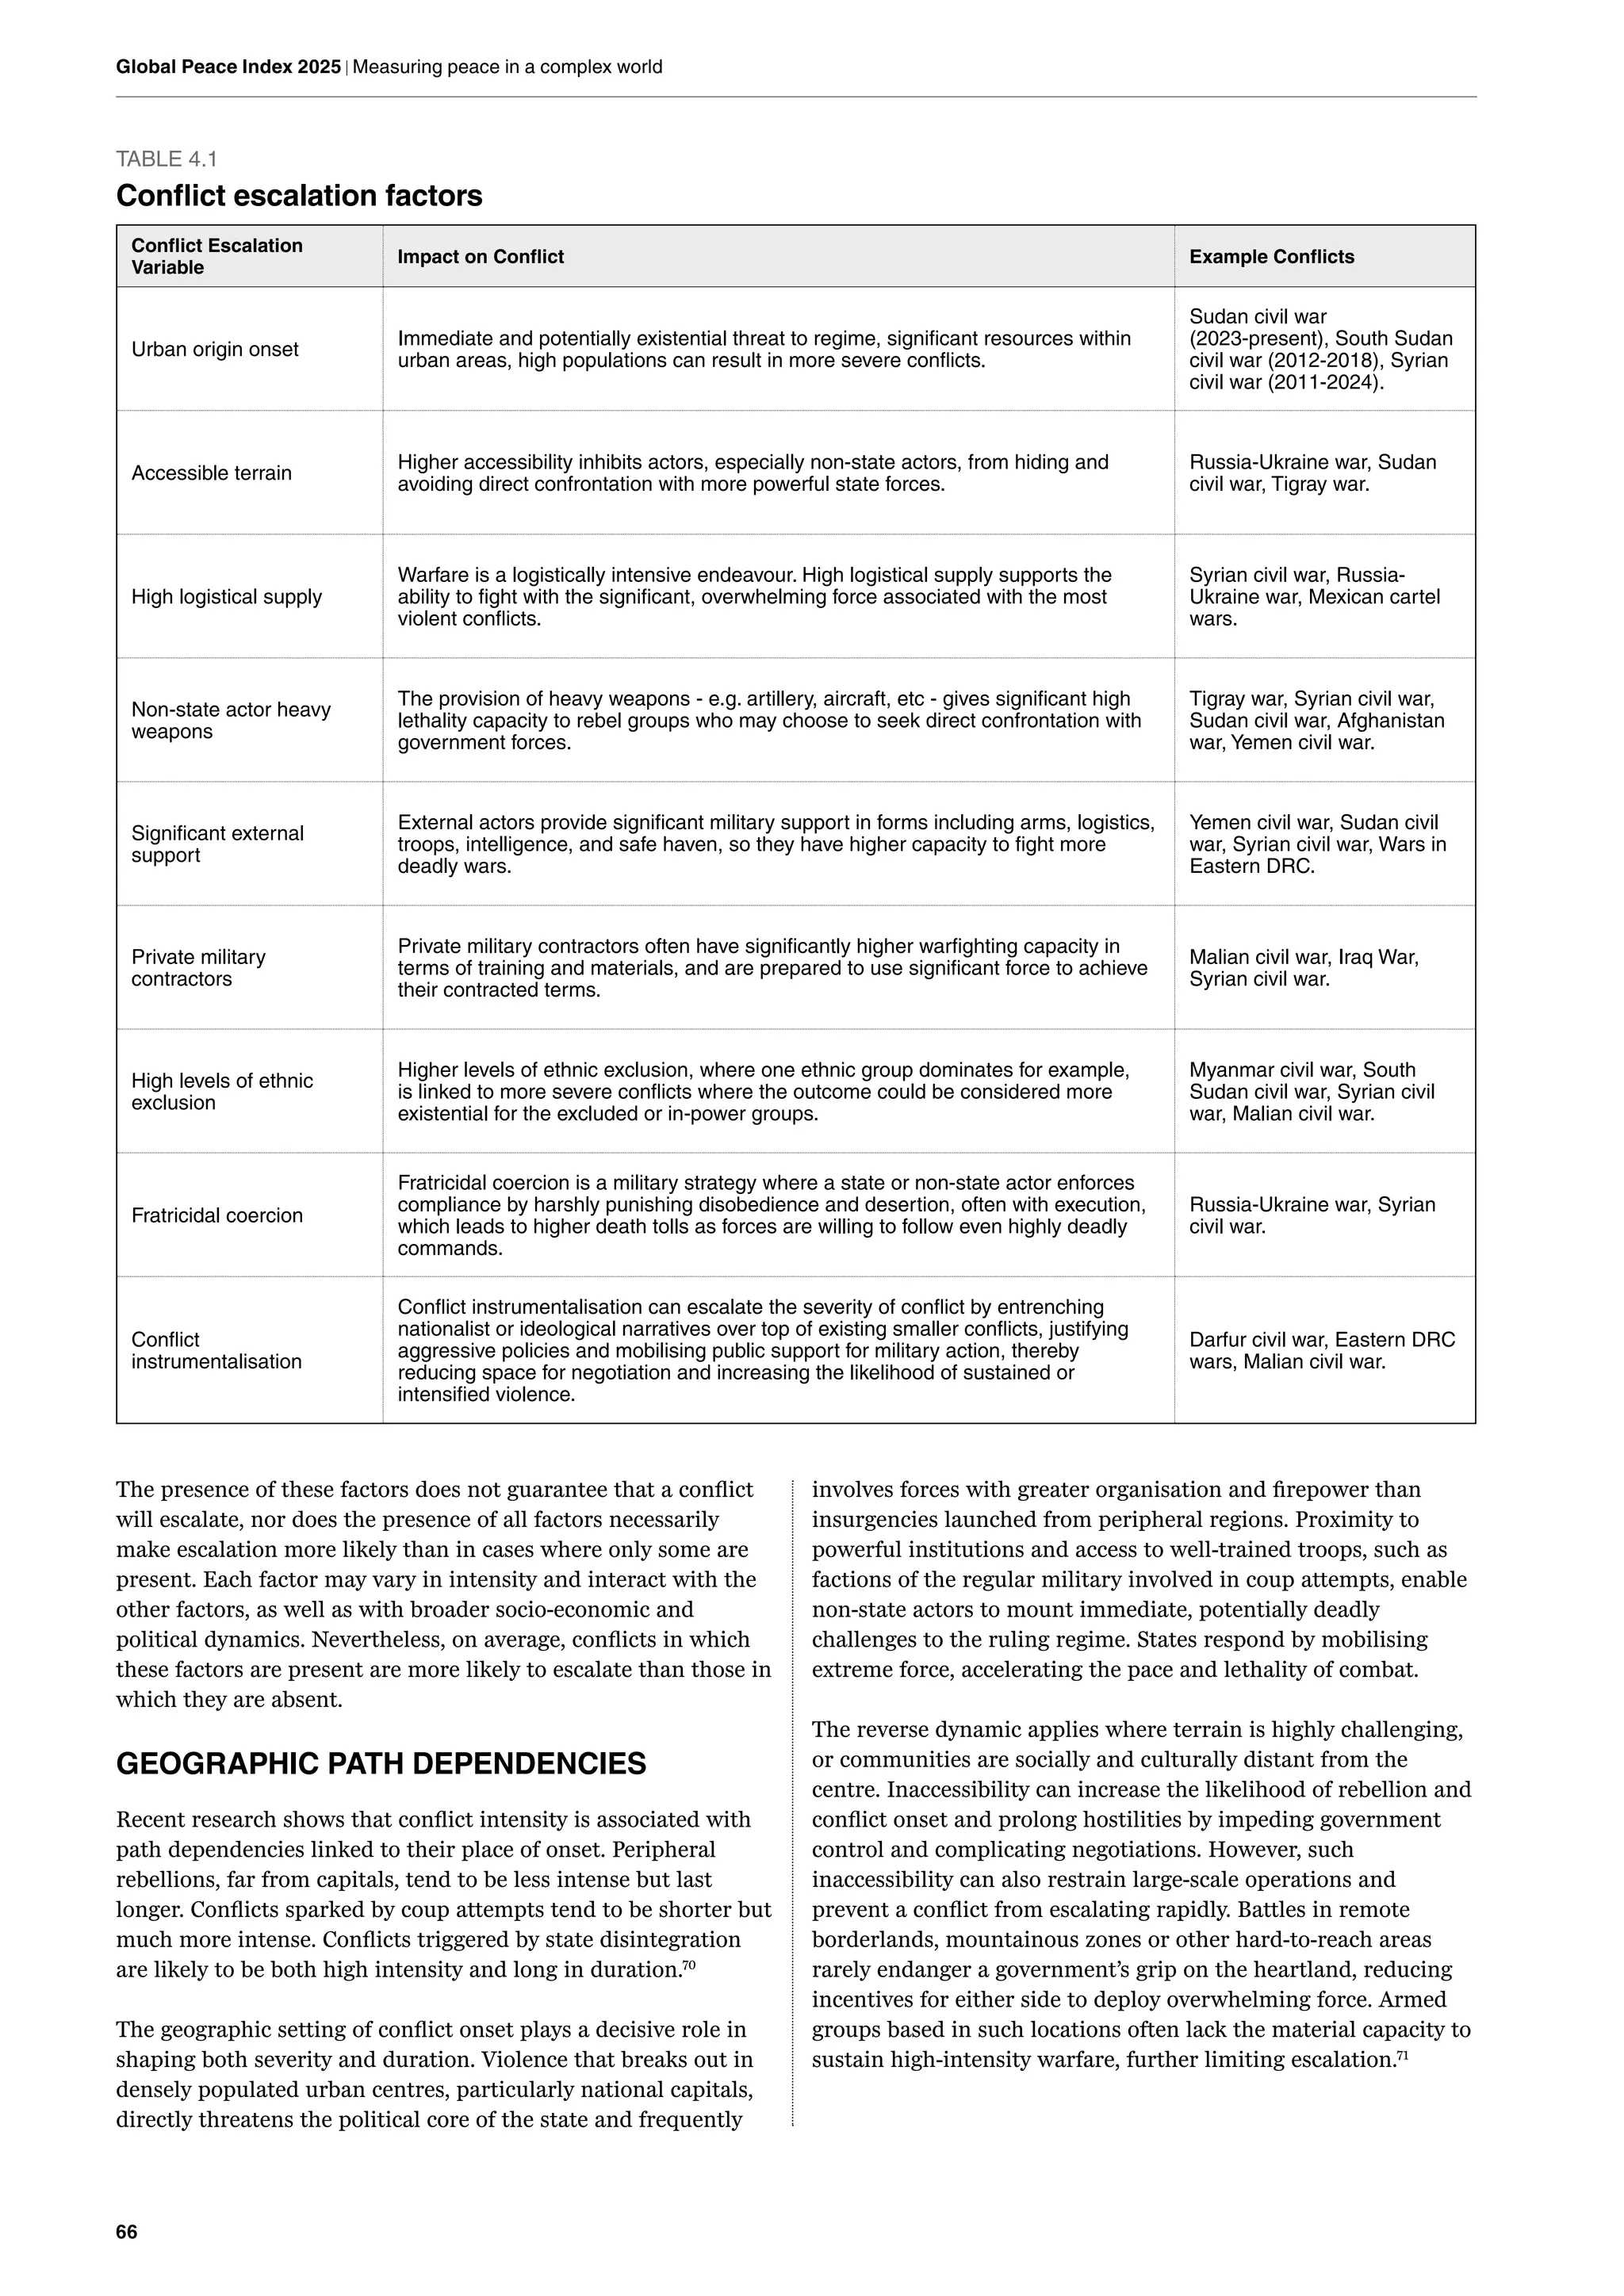
• IEP has identified nine major factors which increase the likelihood
that conflict will increase in intensity or severity.
• These factors have played a key role historically in increasing the
severity of conflict, including in the Spanish, Greek, and Sri Lankan
civil wars, the ongoing conflict in Sudan, and Ethiopia’s recent
Tigray war.
• IEP was able to assess the strength of these nine factors for 62
state-based conflict dyads. Of these 62 conflicts, 22 per cent had at
least one escalation factor with the maximum possible score of five,
and all 62 dyads had at least one escalation factor with a score of
at least three out of five, indicating that it had a significant
escalation risk.
• The risk of conflict escalation can clearly be seen when looking at
the conflict in Kashmir. An April 2025 terror attack in the region
sparked reprisals and halted dialogue, bringing nuclear-armed
India and Pakistan closer to open war.
• Countries facing the highest conflict risk factors are the Democratic
Republic of the Congo, South Sudan, Syria, and the ongoing
conflict between Ethiopia and Eritrea. All have current conflicts that
could become substantially worse.
Section 5 – Positive Peace and the Media
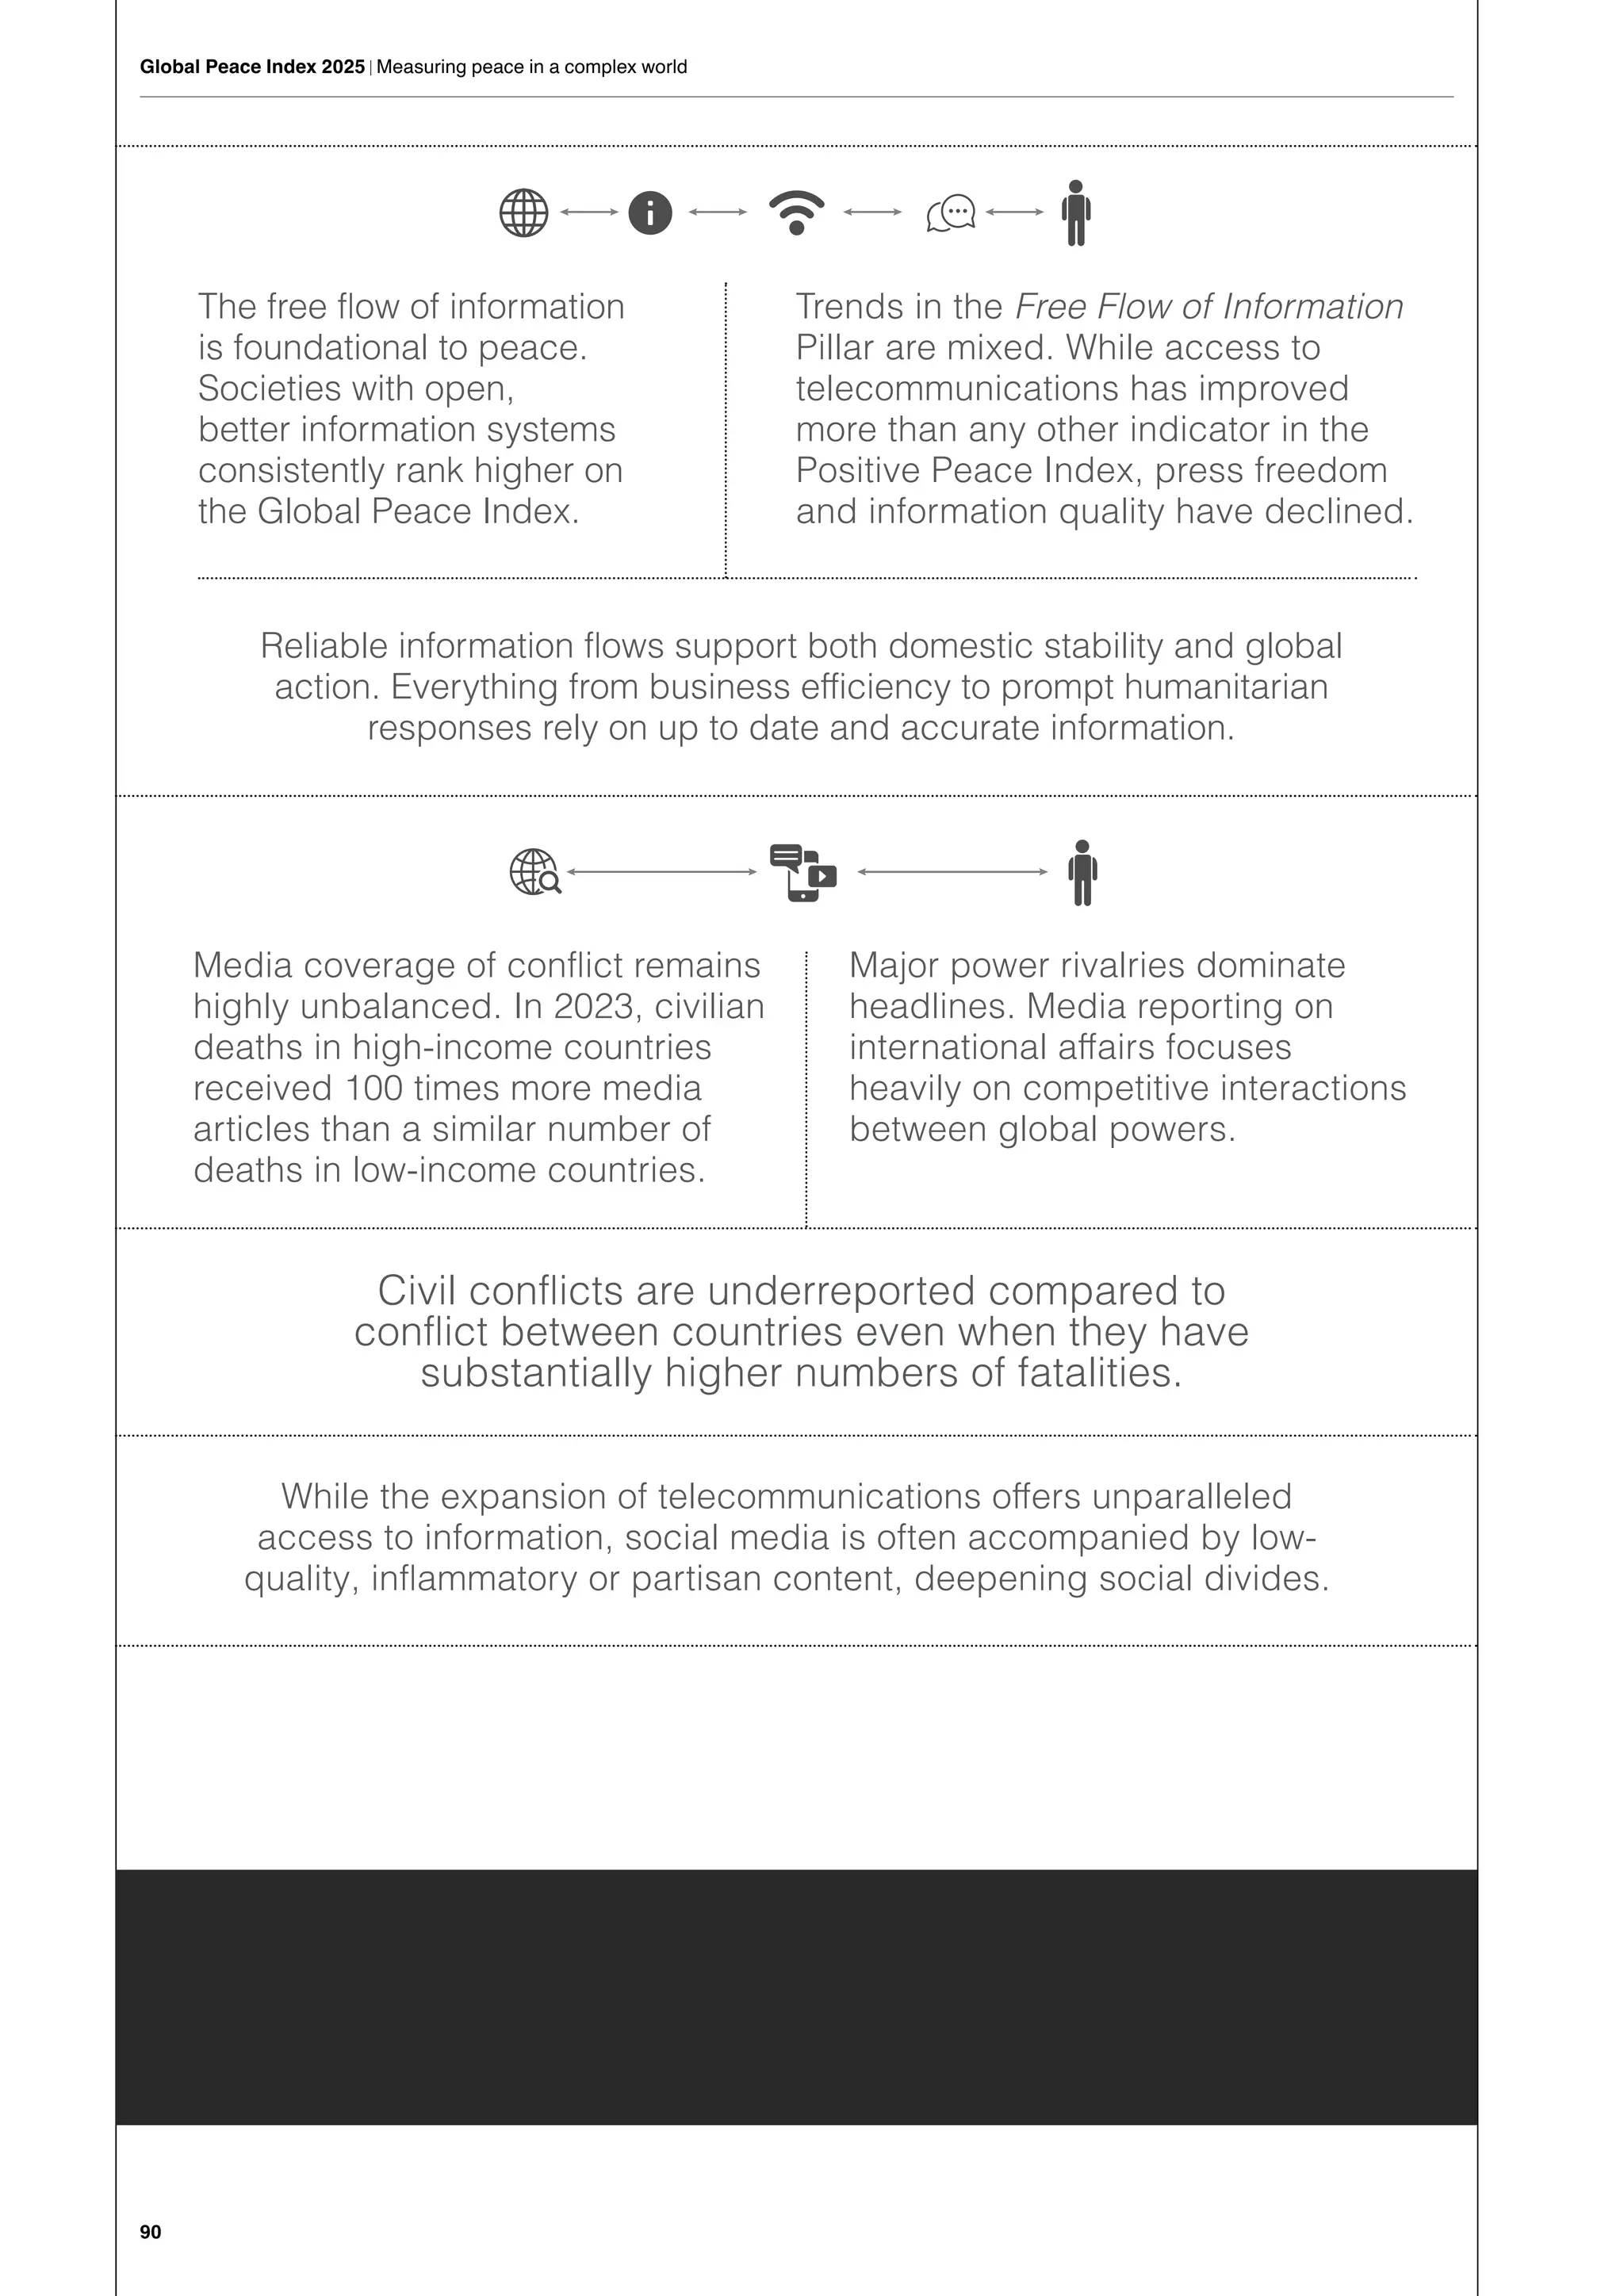
• The Free Flow of Information is foundational to peace. Societies
with open, better information systems consistently rank higher on
the Global Peace Index.
• Reliable information flows support both domestic stability and
global action. Everything from business efficiency to prompt
humanitarian responses rely on up to date and accurate
information.
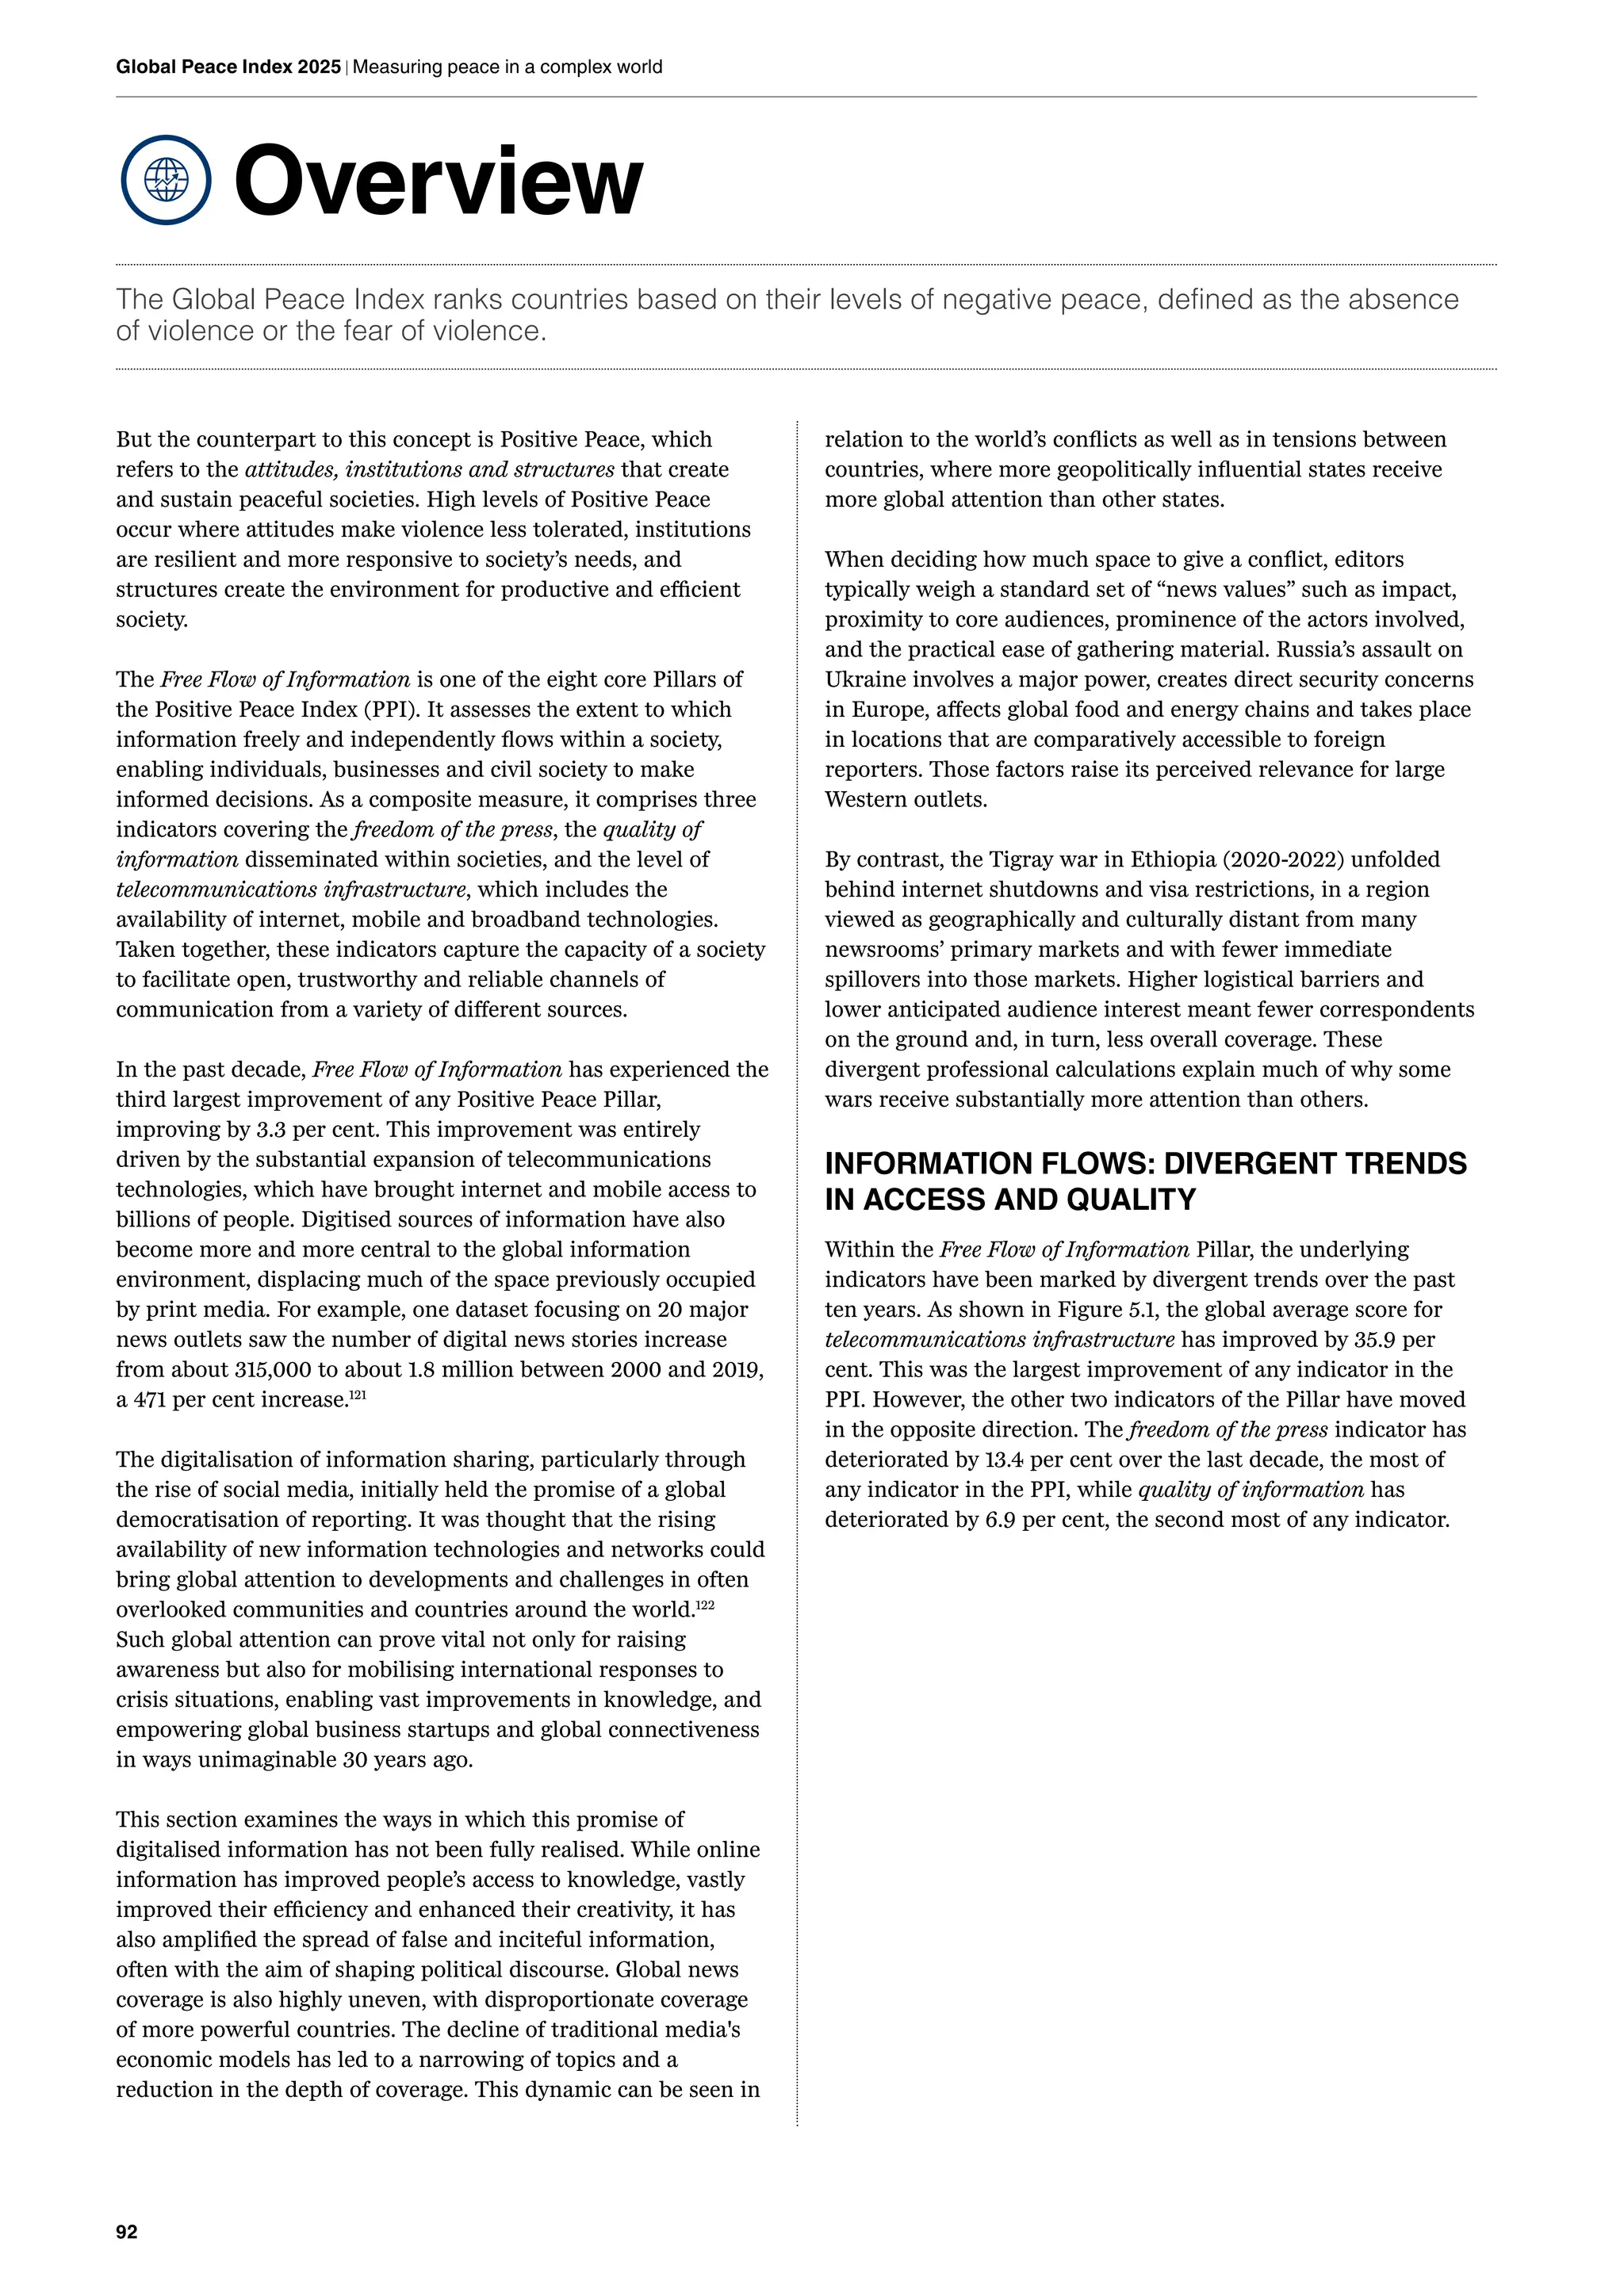
• Trends in the Free Flow of Information Pillar are mixed. While
access to telecommunications has improved more than any other
indicator in the Positive Peace Index, press freedom and
information quality have seen the steepest declines.
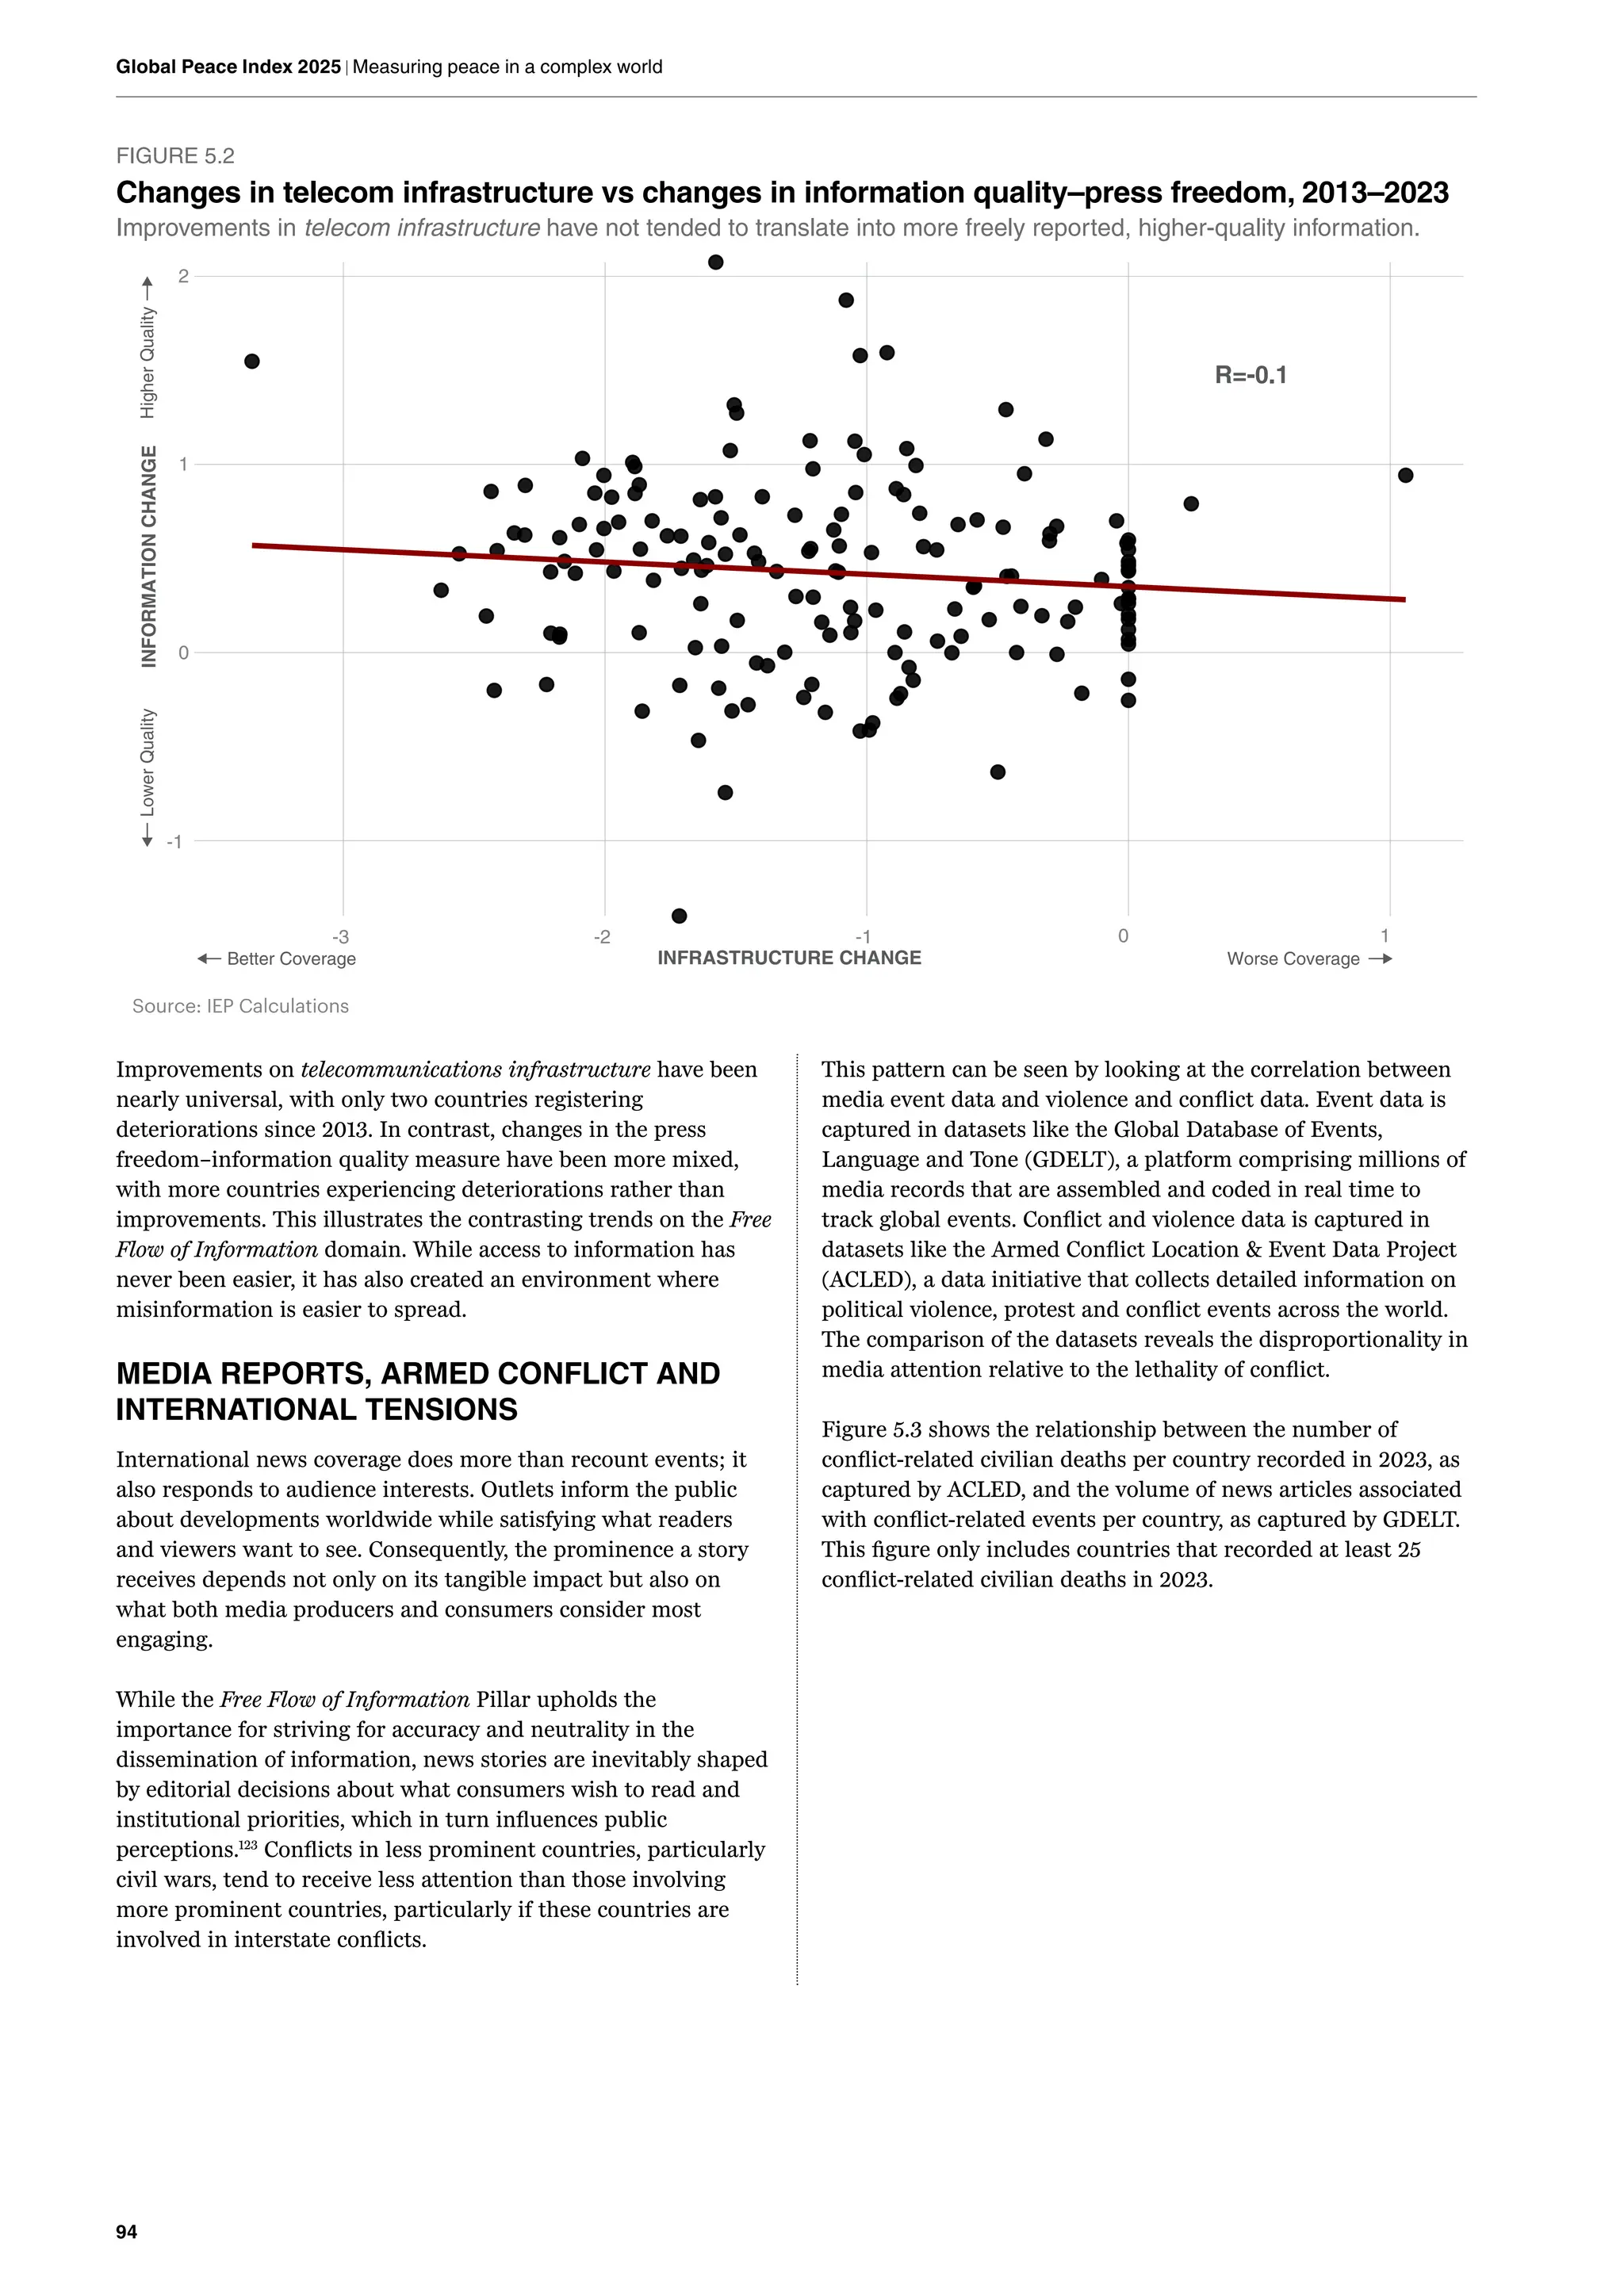
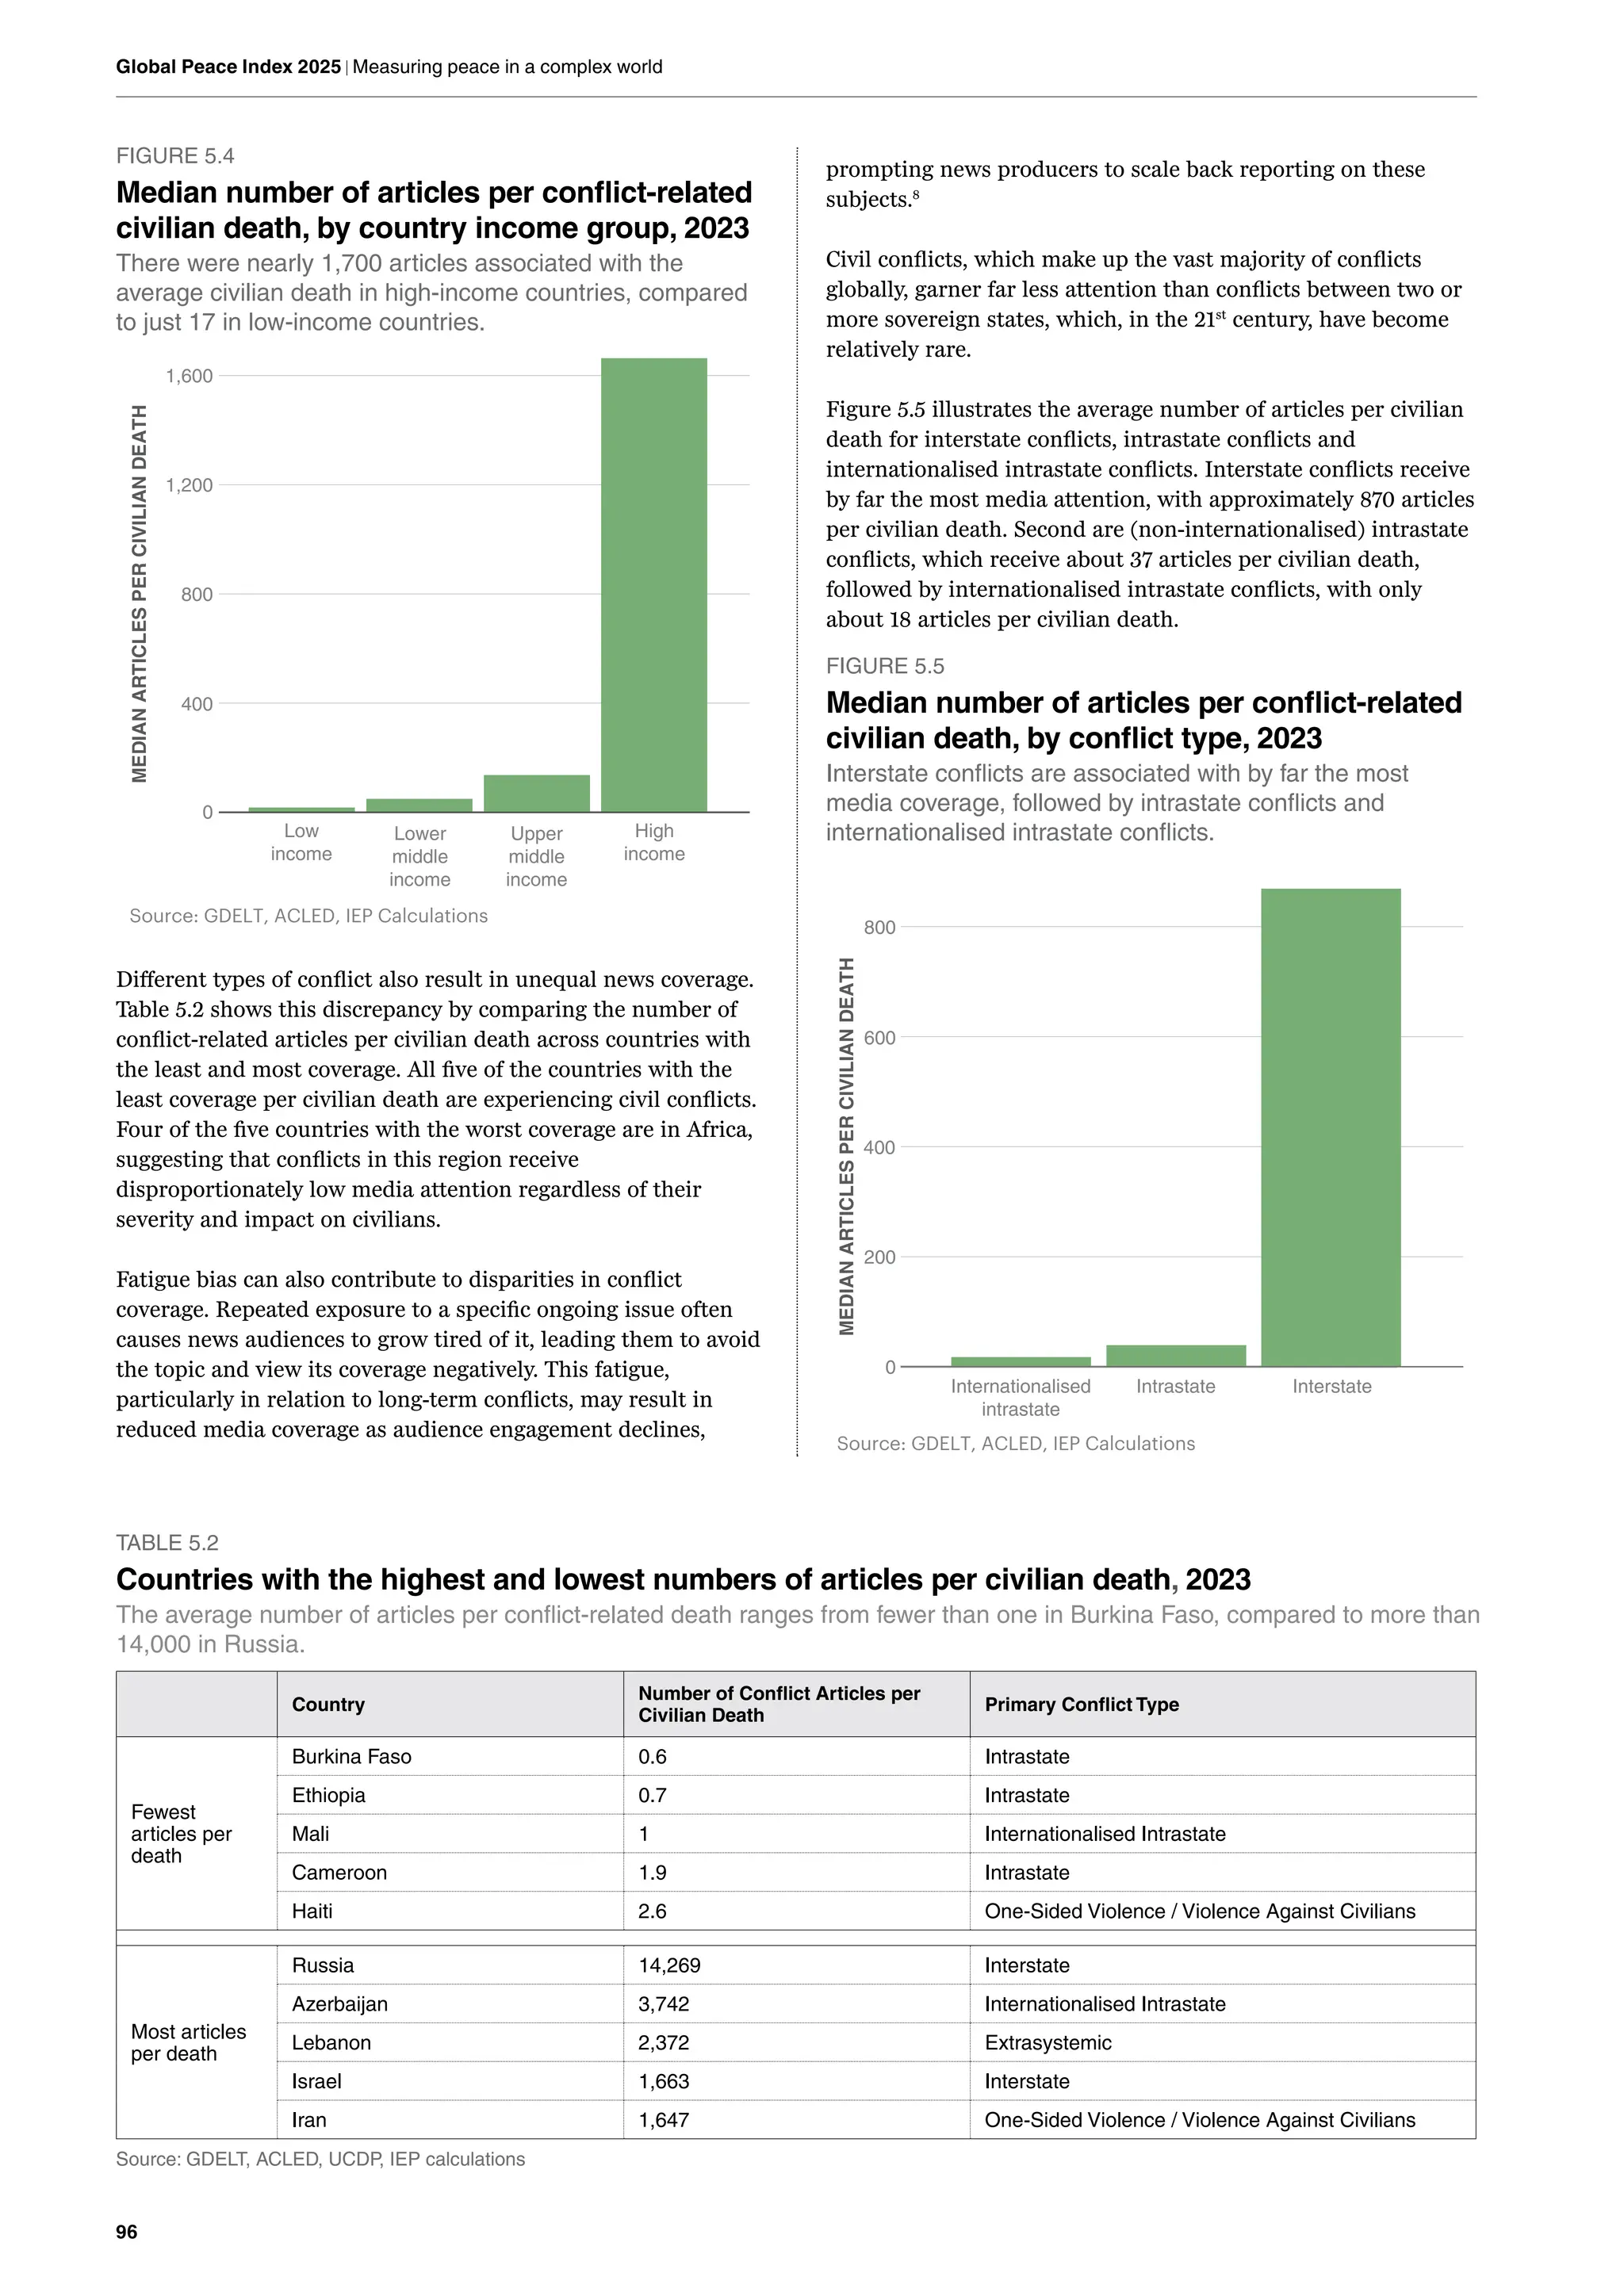
• Media coverage of conflict remains highly unbalanced. In 2023,
civilian deaths in high-income countries received 100 times more
media articles than a similar number of deaths in low-income
countries.
• Civil conflicts are under-reported. They receive less attention on
average than conflicts between states, even when they have
substantially higher numbers of fatalities.
• Major power rivalries dominate headlines. Media reporting on
international affairs focuses heavily on competitive interactions
between global powers.
• While the expansion of telecommunications and social media offers
unparalleled access to information, it is often accompanied by
low-quality, inflammatory or partisan content, deepening social
divides.
8.
There were 17countries with over
1,000 internal conflict deaths in 2024,
the highest since 1999 and a further
18 countries that recorded over one
hundred deaths in the last year.
There were 98 countries that were at least partially
involved in some form of external conflict over the
past five years, up from 59 in 2008. In most cases
countries were offering support to an existing
government against armed rebels or terrorist groups.
Without unified strategic vision and command systems to direct
integrated military capabilities, Europe’s defence potential will
remain unrealised. The efficiency and integration of its fighting
forces are currently more important than increasing its absolute
level of military expenditure.
Europe’s real defence challenge
lies in the absence of integration.
Despite collectively outmatching
Russia, European forces are
hindered by fragmentation.
There were four indicators with average
deteriorations of over two per cent in
the past year: external conflicts fought,
deaths from internal conflict, military
expenditure, and weapons imports.
The average level of country
peacefulness deteriorated
by 0.36 per cent in the 2025
Global Peace Index. This is
the sixth consecutive year
that global peacefulness
has deteriorated.
The average country score on
the GPI has also deteriorated for
13 of the past 17 years, and has
not improved on average in any
year since the 2013 GPI.
This is the second consecutive
year that the Militarisation domain
deteriorated on average, a reversal
of the decade long trend that
had seen levels of Militarisation
improving across much of the world.
Military expenditure (% of GDP) recorded
the second largest yearly deterioration
since the inception of the GPI.
84 countries increased their relative
military expenditure, compared to just 50
where it decreased.
In the past year 74 countries
recorded an improvement, while 87
countries recorded a deterioration
in peacefulness. There are now 97
countries in the world that are less
peaceful now than they were at the
inception of the index in 2008.
In the past year peacefulness
improved slightly on average on
the Safety and Security domain but
deteriorated on both the Ongoing
Conflict and Militarisation domains.
74
0.36
84
87
50 17
Improvements
Increased
Deteriorations
Decreased Countries
Of the 23 GPI indicators, eight recorded an
improvement, 13 recorded a deterioration,
and two recorded no change over the
past year. The largest deterioration was on
external conflicts fought, while the biggest
improvement was on the perceptions of
criminality indicator.
8 13 2
Improvements Deteriorations No Change
6
Global Peace Index 2025 | Measuring peace in a complex world
8
Global Peace Index2025 | Measuring peace in a complex world
1 Iceland 1.095 ↔
2 Ireland 1.260 ↔
3 New Zealand 1.282 UP-LONG 2
4 Austria 1.294 DOWN-LONG 1
5 Switzerland 1.294 DOWN-LONG 1
6 Singapore 1.357 ↔
7 Portugal 1.371 UP-LONG 1
8 Denmark 1.393 DOWN-LONG 1
9 Slovenia 1.409 ↔
10 Finland 1.420 UP-LONG 1
11 Czechia 1.435 UP-LONG 2
12 Japan 1.440 UP-LONG 3
13 Malaysia 1.469 DOWN-LONG 1
=14 Netherlands 1.491 ↔
=14 Canada 1.491 DOWN-LONG 5
16 Belgium 1.492 UP-LONG 4
17 Hungary 1.500 DOWN-LONG 1
18 Australia 1.505 UP-LONG 1
19 Croatia 1.519 DOWN-LONG 1
20 Germany 1.533 DOWN-LONG 3
21 Bhutan 1.536 ↔
=22 Latvia 1.558 UP-LONG 5
=22 Lithuania 1.558 UP-LONG 5
24 Estonia 1.559 DOWN-LONG 2
25 Spain 1.578 ↔
26 Mauritius 1.586 DOWN-LONG 3
27 Qatar 1.593 DOWN-LONG 1
28 Slovakia 1.609 UP-LONG 1
29 Bulgaria 1.610 UP-LONG 1
30 United Kingdom 1.634 UP-LONG 2
31 Kuwait 1.642 ↔
32 Norway 1.644 DOWN-LONG 8
33 Italy 1.662 UP-LONG 1
34 Montenegro 1.685 UP-LONG 5
35 Sweden 1.709 DOWN-LONG 2
36 Poland 1.713 DOWN-LONG 1
37 Mongolia 1.719 UP-LONG 8
=38 Romania 1.721 DOWN-LONG 2
=38 Vietnam 1.721 UP-LONG 1
40 Taiwan 1.730 DOWN-LONG 2
41 South Korea 1.736 UP-LONG 2
42 Oman 1.738 DOWN-LONG 5
43 Botswana 1.743 DOWN-LONG 2
44 Timor-Leste 1.758 UP-LONG 5
45 Greece 1.764 DOWN-LONG 3
46 Argentina 1.768 UP-LONG 5
47 Laos 1.783 DOWN-LONG 3
48 Uruguay 1.784 ↔
49 Indonesia 1.786 UP-LONG 3
50 Namibia 1.789 UP-LONG 4
51 North Macedonia 1.799 DOWN-LONG 4
=52 Albania 1.812 DOWN-LONG 6
=52 United Arab Emirates 1.812 UP-LONG 2
54 Costa Rica 1.843 DOWN-LONG 4
55 The Gambia 1.855 UP-LONG 16
56 Kazakhstan 1.875 UP-LONG 5
57 Sierra Leone 1.887 UP-LONG 2
58 Armenia 1.893 UP-LONG 10
=59 Madagascar 1.895 DOWN-LONG 6
=59
Bosnia and
Herzegovina
1.895 DOWN-LONG 3
61 Ghana 1.898 DOWN-LONG 3
62 Chile 1.899 ↔
63 Kosovo 1.908 DOWN-LONG 3
=64 Serbia 1.914 DOWN-LONG 1
=64 Zambia 1.914 DOWN-LONG 9
66 Moldova 1.918 DOWN-LONG 2
67 Uzbekistan 1.926 UP-LONG 2
68 Cyprus 1.933 DOWN-LONG 1
69 Senegal 1.936 UP-LONG 5
70 Liberia 1.939 UP-LONG 6
71 Malawi 1.955 UP-LONG 14
72 Jordan 1.957 DOWN-LONG 2
73 Tanzania 1.965 DOWN-LONG 8
74 France 1.967 UP-LONG 5
75 Paraguay 1.981 UP-LONG 2
=76 Nepal 1.987 UP-LONG 8
=76 Angola 1.987 DOWN-LONG 11
78 Kyrgyz Republic 1.988 UP-LONG 5
=79 Tajikistan 1.996 UP-LONG 10
=79 Dominican Republic 1.996 UP-LONG 6
81 Tunisia 1.998 DOWN-LONG 3
82 Equatorial Guinea 2.004 UP-LONG 15
83 Bolivia 2.005 DOWN-LONG 10
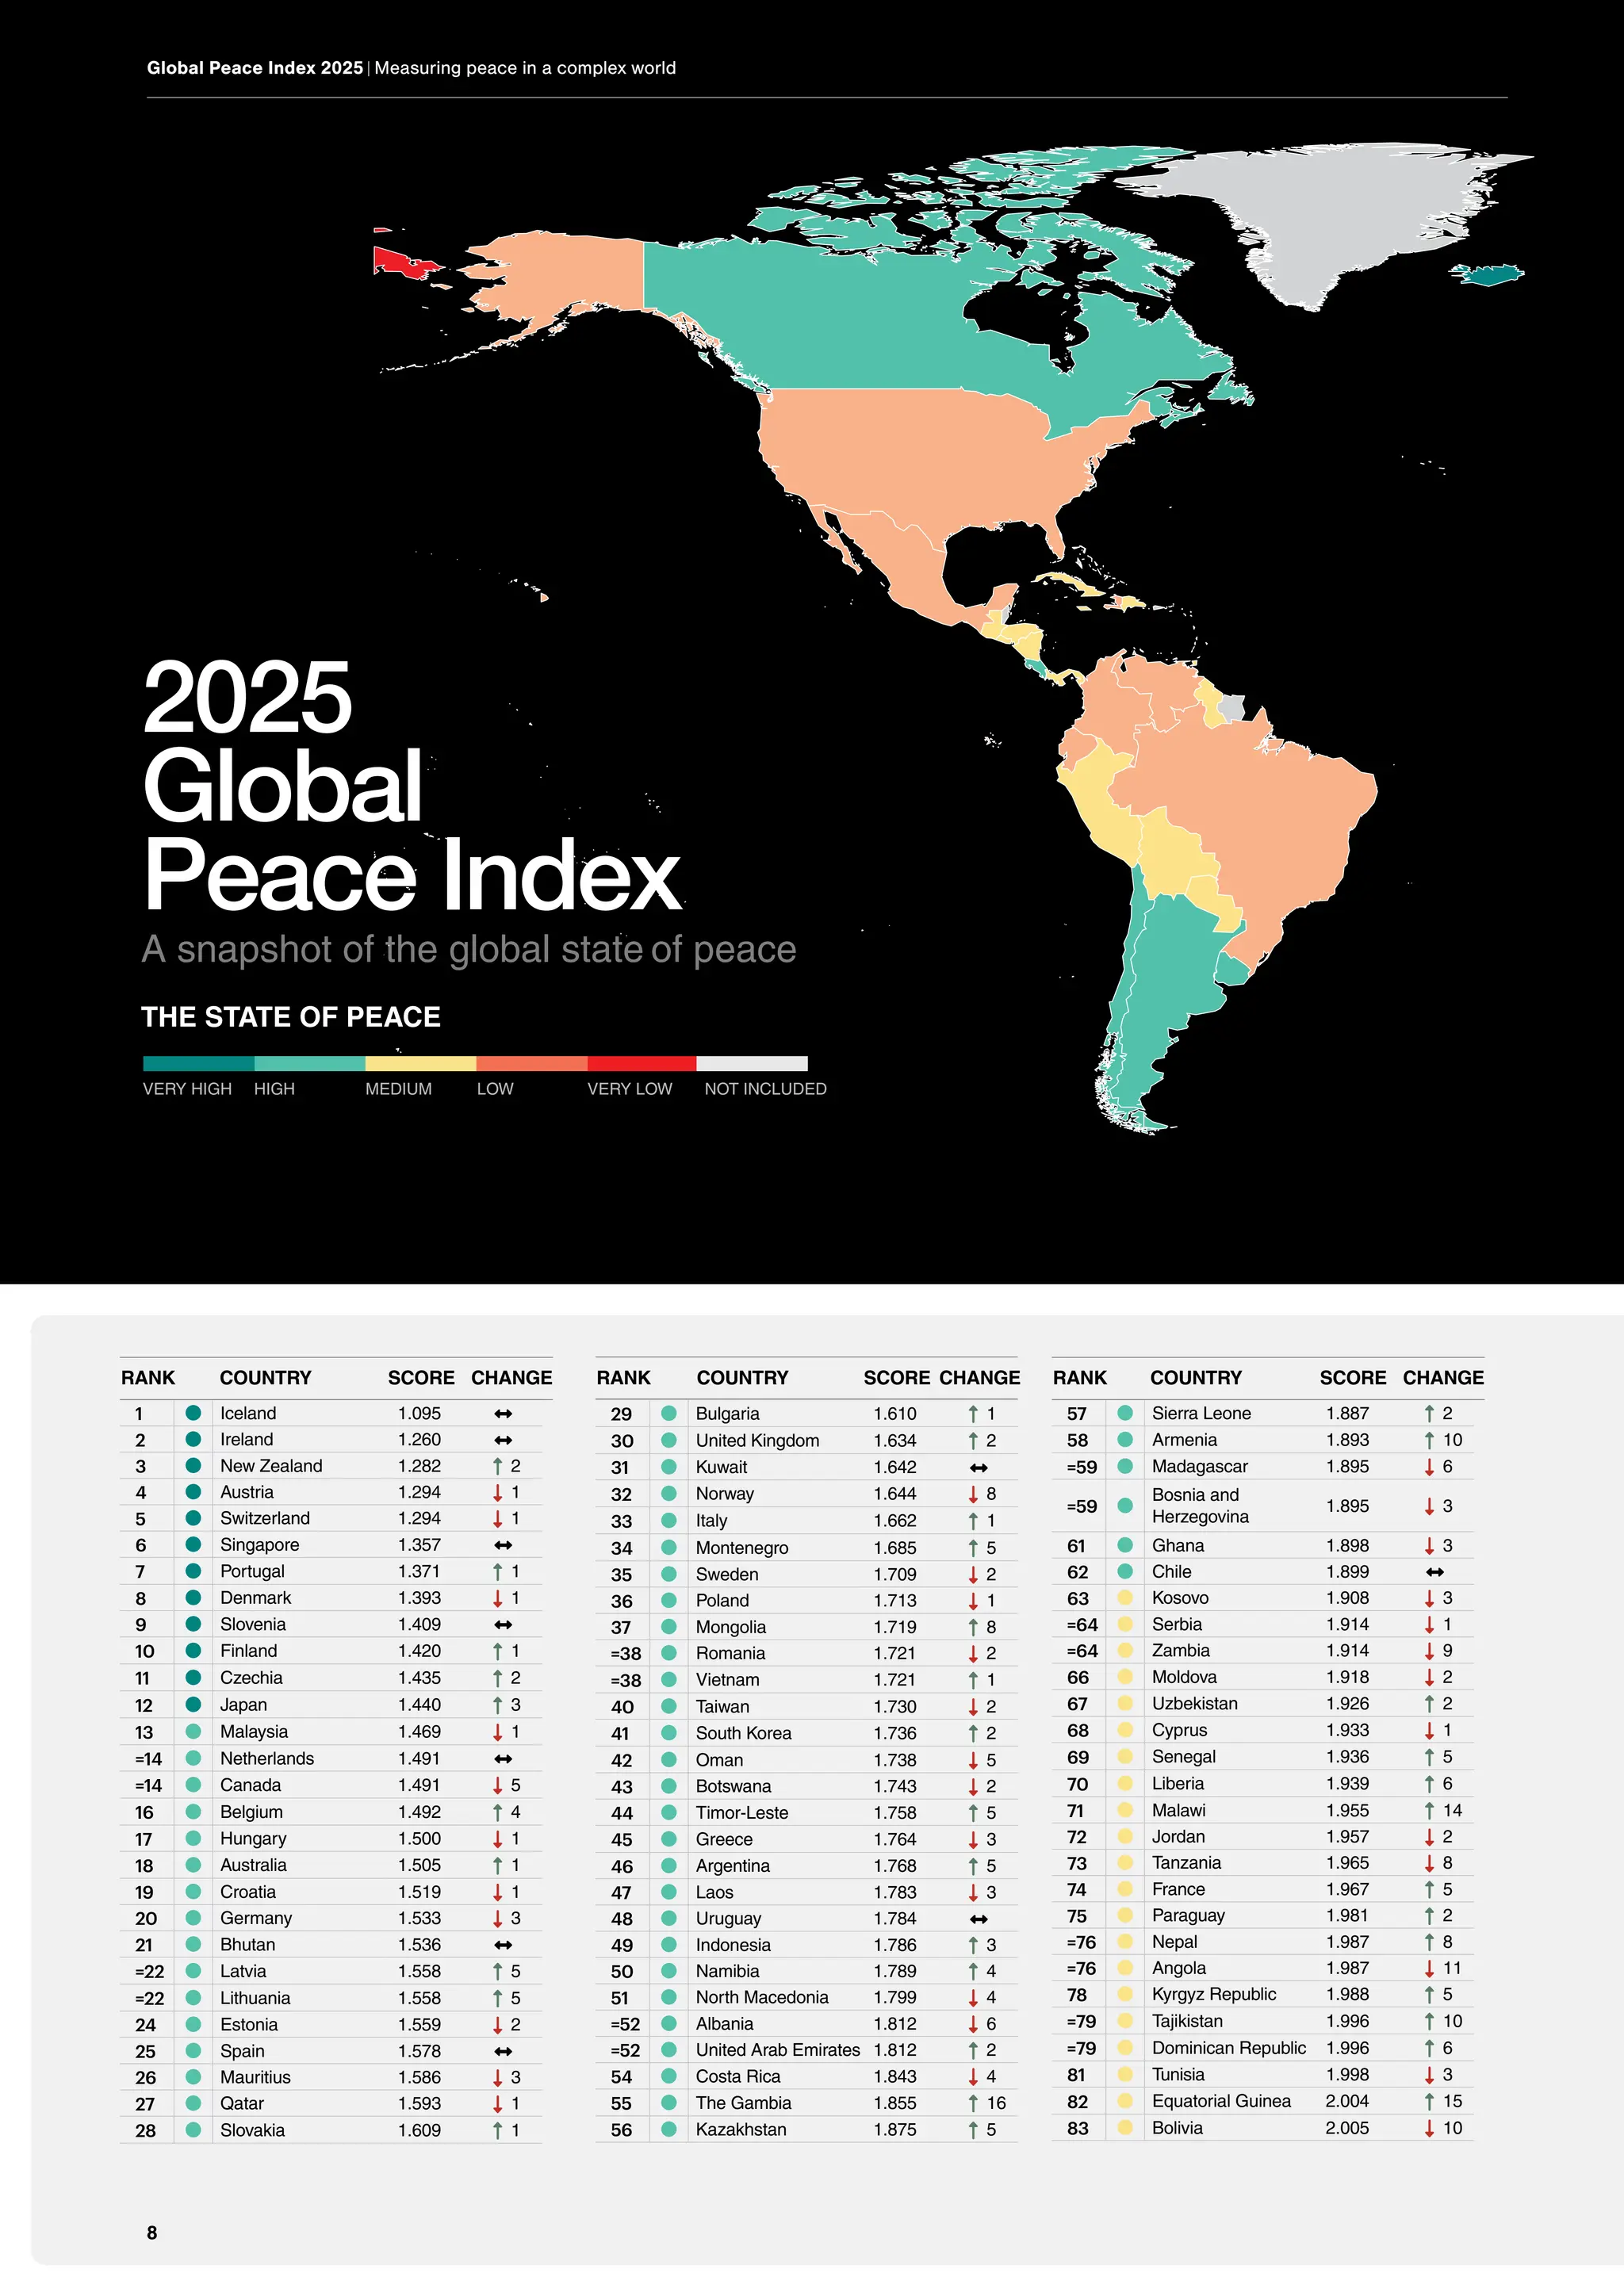
2025
Global
Peace Index
A snapshot of the global state of peace
THE STATE OF PEACE
NOT INCLUDED
VERY HIGH HIGH MEDIUM LOW VERY LOW
RANK COUNTRY SCORE CHANGE
RANK COUNTRY SCORE CHANGE
RANK COUNTRY SCORE CHANGE
Global Peace Index 2025 | Measuring peace in a complex world
8
11.
RANK COUNTRY SCORECHANGE RANK COUNTRY SCORE CHANGE RANK COUNTRY SCORE CHANGE
84 Panama 2.006 UP-LONG 4
85 Morocco 2.012 DOWN-LONG 3
86 Thailand 2.017 DOWN-LONG 5
=87 Cambodia 2.019 DOWN-LONG 12
=87 Turkmenistan 2.019 UP-LONG 7
89 Trinidad and Tobago 2.020 DOWN-LONG 17
90 Saudi Arabia 2.035 UP-LONG 14
91 Rwanda 2.036 UP-LONG 12
92 Algeria 2.042 DOWN-LONG 1
93 Jamaica 2.047 DOWN-LONG 13
94 Côte d'Ivoire 2.066 DOWN-LONG 2
95 Azerbaijan 2.067 UP-LONG 17
96 Peru 2.073 UP-LONG 14
97 Sri Lanka 2.075 UP-LONG 2
98 China 2.093 DOWN-LONG 11
99 Eswatini 2.094 DOWN-LONG 5
100 Bahrain 2.099 DOWN-LONG 7
101 Guinea-Bissau 2.112 DOWN-LONG 5
102 Cuba 2.123 DOWN-LONG 2
103
Republic of the
Congo
2.132 DOWN-LONG 5
104 El Salvador 2.136 UP-LONG 1
105 Philippines 2.148 UP-LONG 6
106 Guyana 2.149 ↔
107 Egypt 2.157 UP-LONG 2
108 Guatemala 2.174 ↔
109 Georgia 2.185 DOWN-LONG 8
110 Mauritania 2.204 DOWN-LONG 8
111 Nicaragua 2.207 UP-LONG 2
112 Benin 2.211 UP-LONG 5
113 Uganda 2.217 UP-LONG 12
114 Zimbabwe 2.223 UP-LONG 8
115 India 2.229 ↔
116 Papua New Guinea 2.230 DOWN-LONG 9
117 Gabon 2.238 DOWN-LONG 1
118 Guinea 2.253 UP-LONG 6
=119 Lesotho 2.267 UP-LONG 4
=119 Belarus 2.267 DOWN-LONG 2
121 Mozambique 2.273 DOWN-LONG 7
122 Djibouti 2.276 DOWN-LONG 2
123 Bangladesh 2.318 DOWN-LONG 33
=124 South Africa 2.347 UP-LONG 3
=124 Honduras 2.347 DOWN-LONG 4
126 Togo 2.381 DOWN-LONG 7
127 Kenya 2.392 DOWN-LONG 1
128
United States of
America
2.443 ↔
129 Ecuador 2.459 ↔
130 Brazil 2.472 UP-LONG 1
131 Libya 2.478 UP-LONG 1
132 Eritrea 2.542 UP-LONG 1
133 Burundi 2.574 DOWN-LONG 3
134 Chad 2.593 ↔
135 Mexico 2.636 UP-LONG 2
136 Lebanon 2.674 DOWN-LONG 1
137 Cameroon 2.683 UP-LONG 5
138 Ethiopia 2.688 UP-LONG 5
139 Venezuela 2.692 DOWN-LONG 3
140 Colombia 2.695 UP-LONG 1
141 Haiti 2.731 UP-LONG 3
142 Iran 2.750 DOWN-LONG 4
143 Niger 2.759 DOWN-LONG 4
144 Pakistan 2.797 DOWN-LONG 4
145 Palestine 2.811 UP-LONG 1
146 Turkiye 2.852 UP-LONG 1
147 Iraq 2.862 UP-LONG 3
148 Nigeria 2.869 DOWN-LONG 3
149 North Korea 2.911 ↔
150
Central African
Republic
2.912 DOWN-LONG 2
151 Somalia 2.983 UP-LONG 3
152 Burkina Faso 3.016 ↔
153 Myanmar 3.045 DOWN-LONG 2
154 Mali 3.061 DOWN-LONG1
155 Israel 3.108 ↔
156 South Sudan 3.117 UP-LONG 2
157 Syria 3.184 DOWN-LONG 1
158 Afghanistan 3.229 UP-LONG 2
159 Yemen 3.262 UP-LONG 3
160
Democratic Republic
of the Congo
3.292 DOWN-LONG 3
161 Sudan 3.323 UP-LONG 2
162 Ukraine 3.434 DOWN-LONG 3
163 Russia 3.441 DOWN-LONG 2
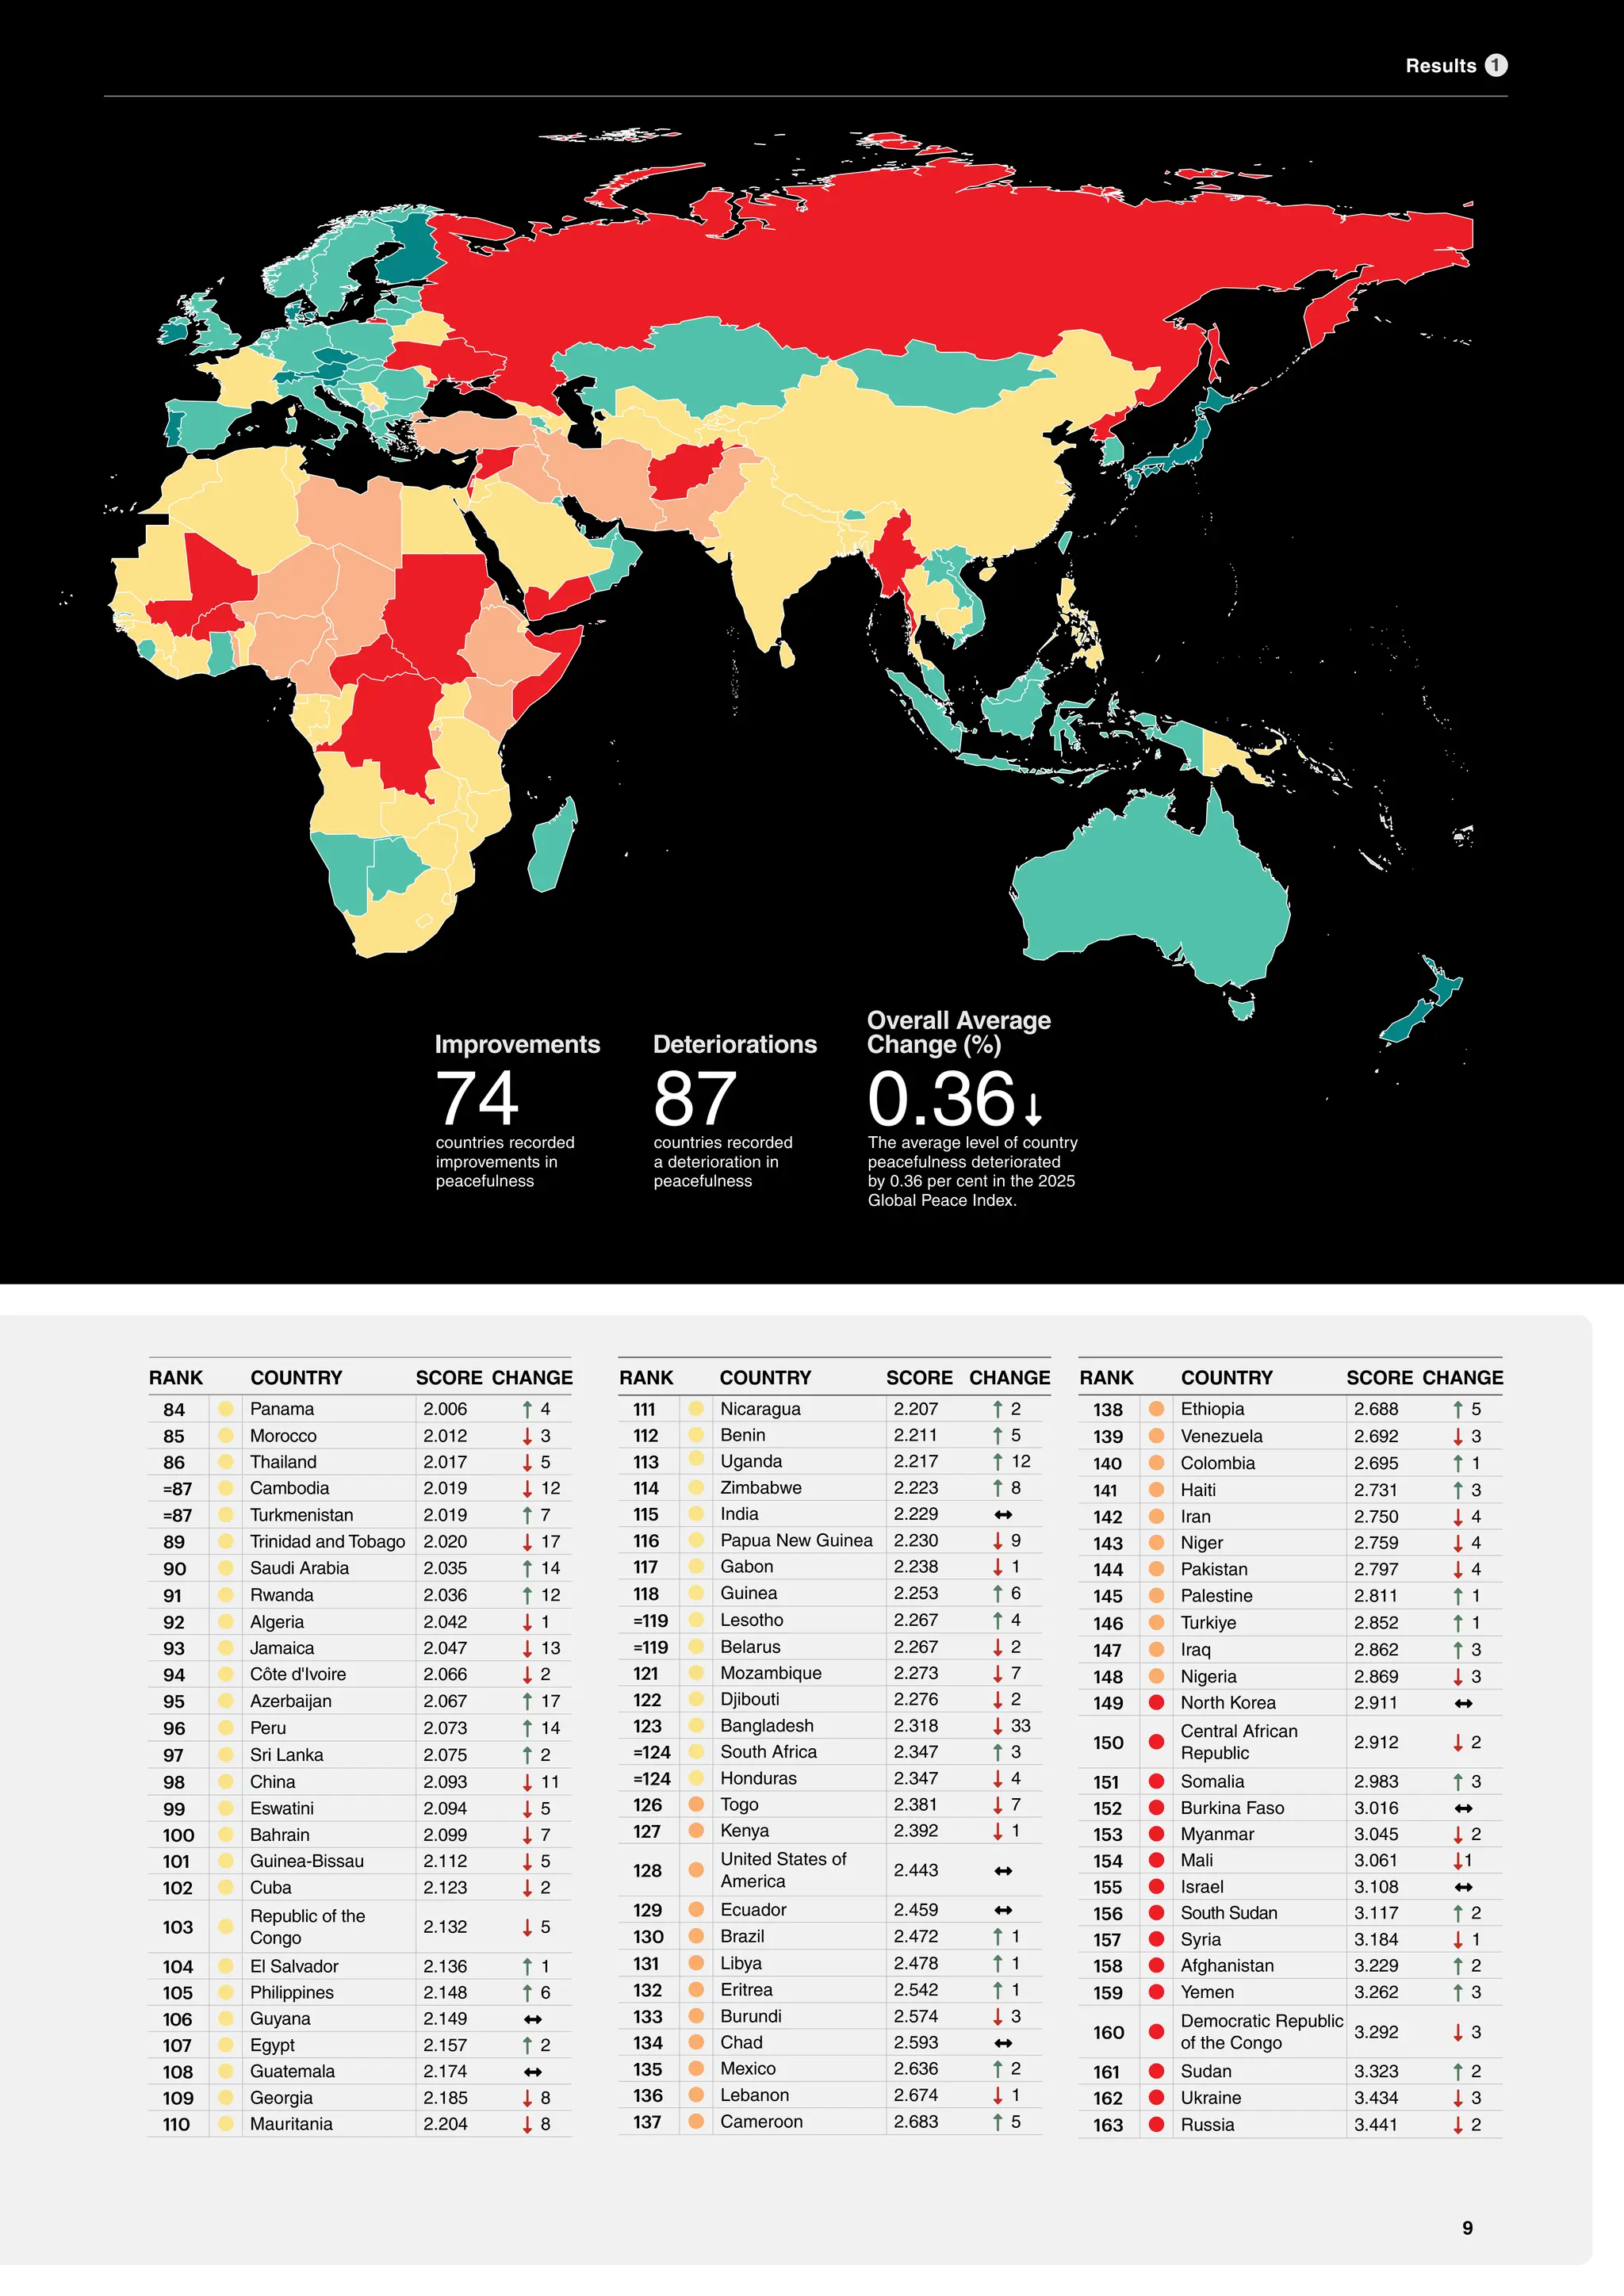
74
countries recorded
improvements in
peacefulness
Improvements
87
countries recorded
a deterioration in
peacefulness
Deteriorations
0.36
The average level of country
peacefulness deteriorated
by 0.36 per cent in the 2025
Global Peace Index.
Overall Average
Change (%)
9
1
Results
UP-LONG
12.
10
Global Peace Index2025 | Measuring peace in a complex world Results
Results
The 2025 GPI finds that the world became less peaceful for the 13th
time in the last 17 years, with the
average level of country peacefulness deteriorating by 0.36 per cent over the prior year. This is the sixth
consecutive year that global peacefulness has deteriorated. Figure 1.1 shows the change in the average
levels of peacefulness for each of the GPI domains, as well as the percentage of countries that improved
or deteriorated. In total, peacefulness improved in 74 countries and deteriorated in 87.
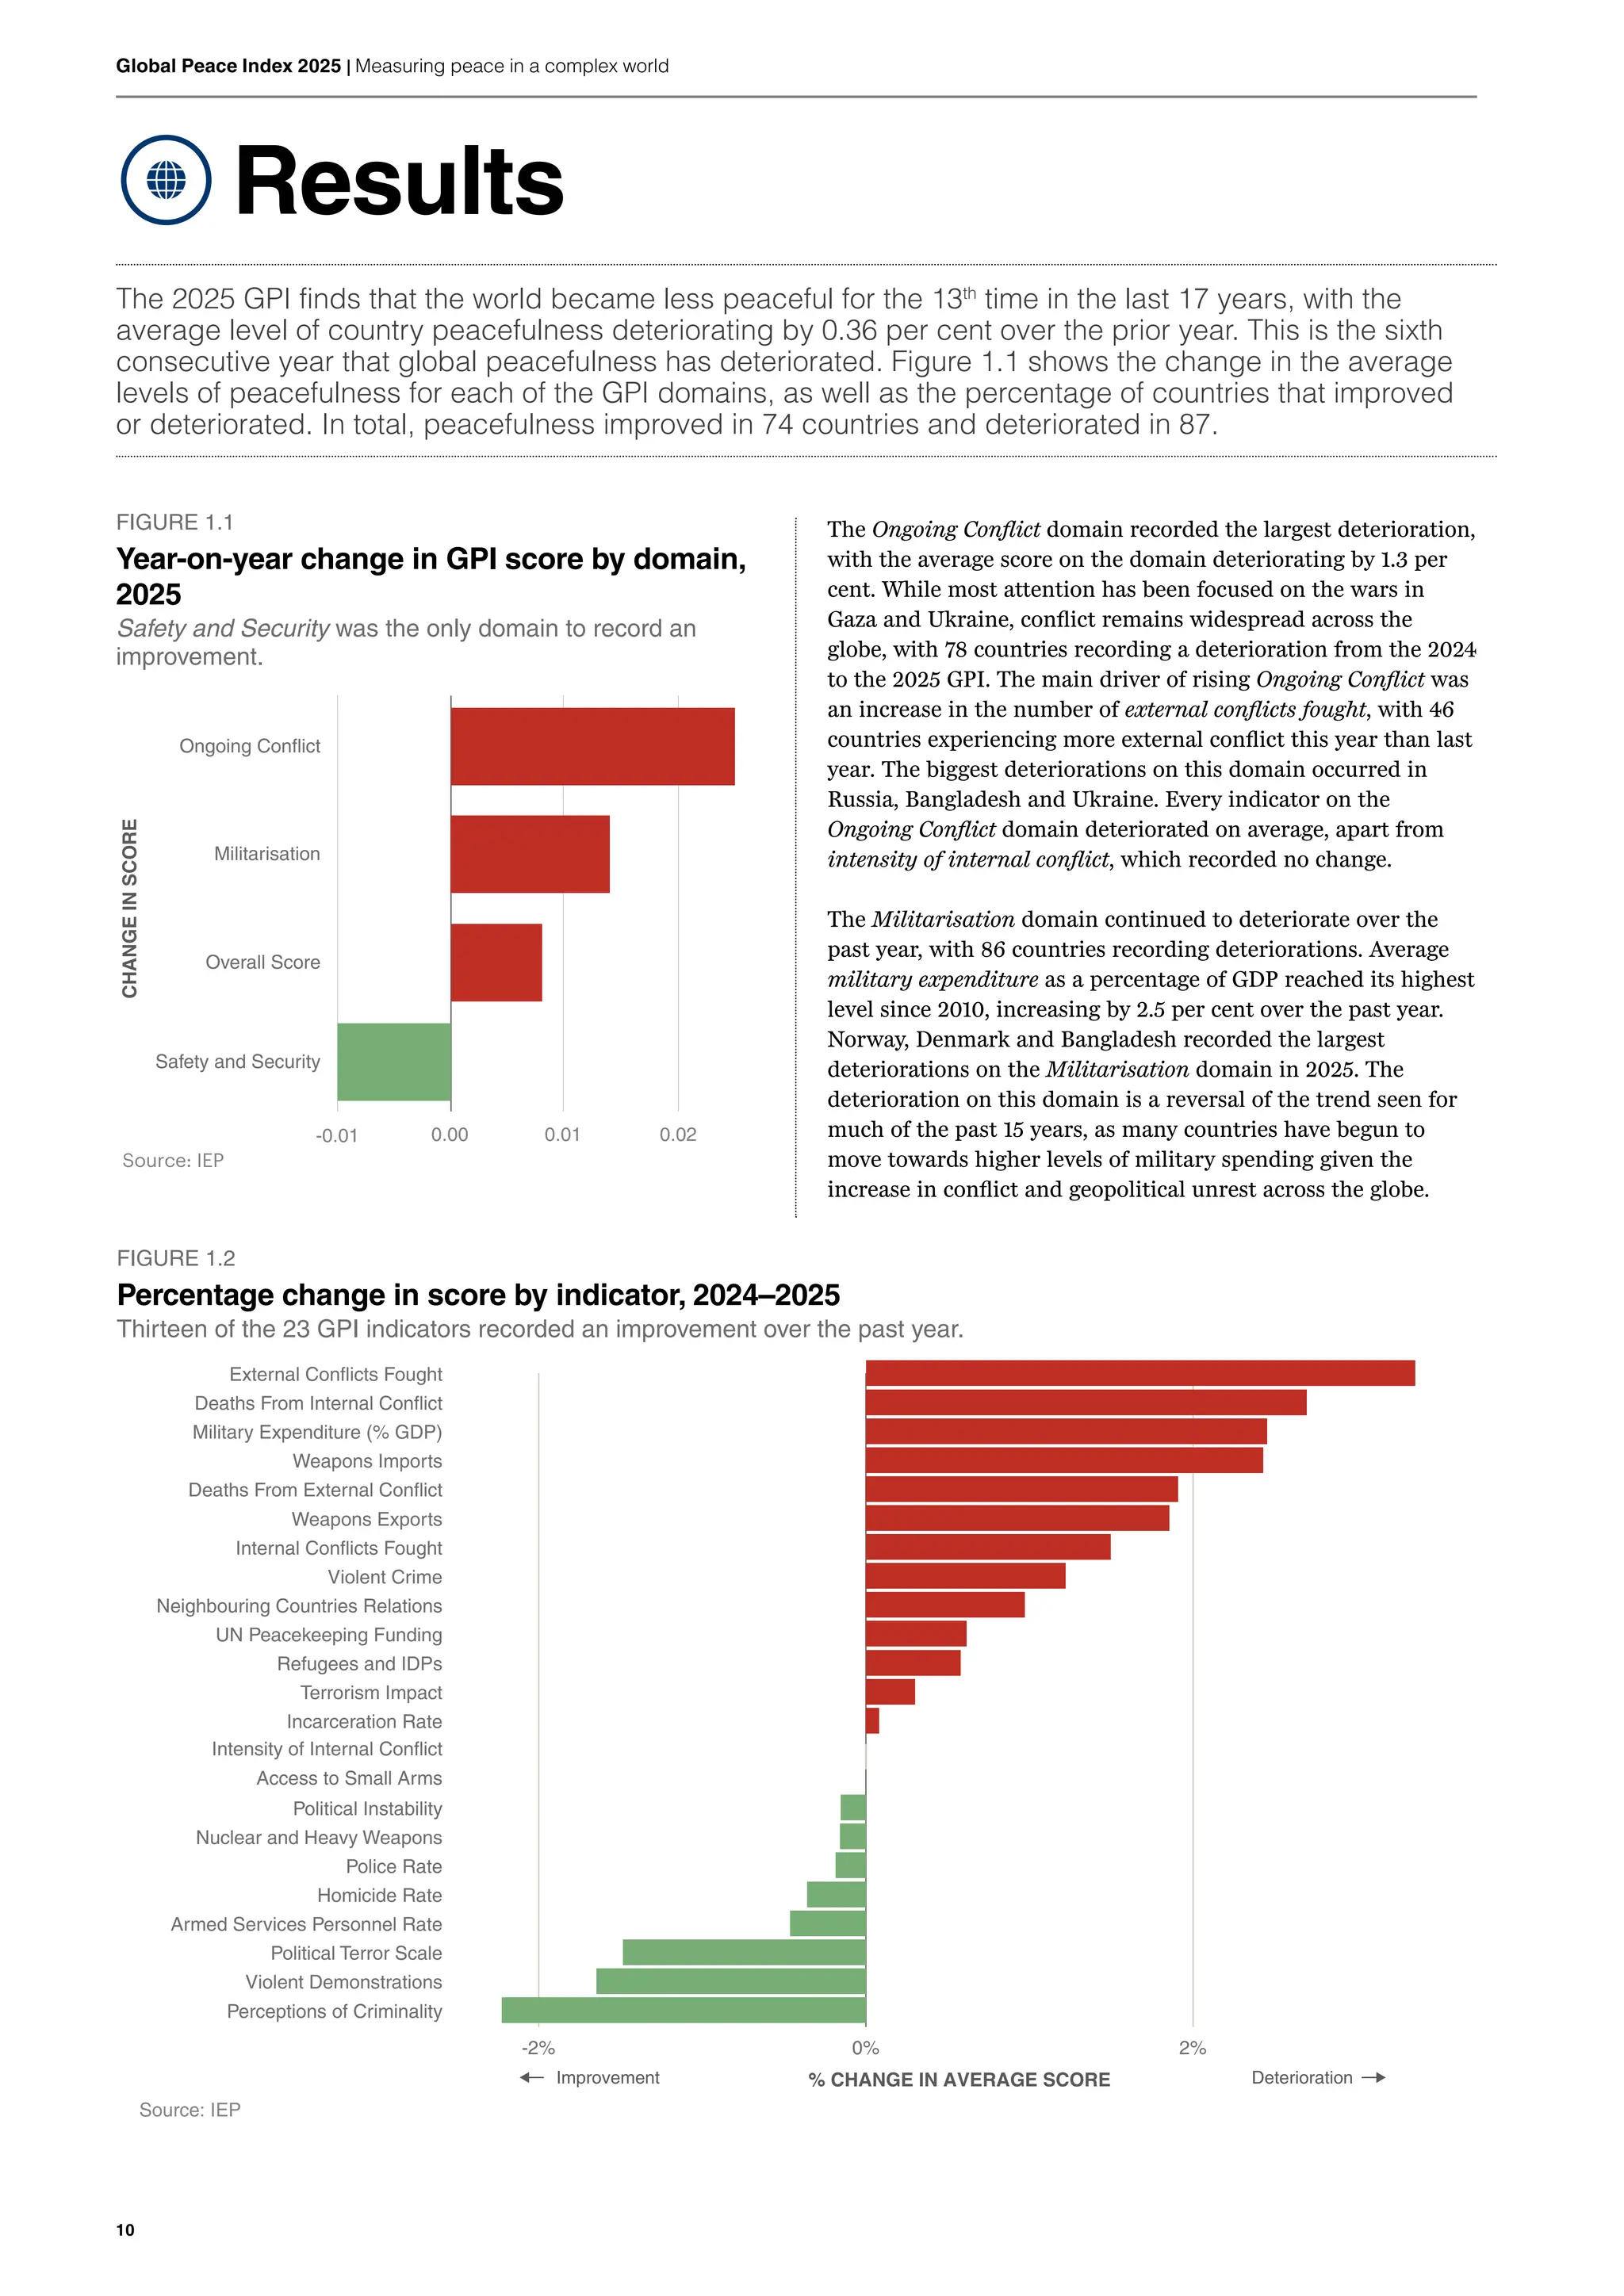
FIGURE 1.1
Year-on-year change in GPI score by domain,
2025
Safety and Security was the only domain to record an
improvement.
-0.01 0.00 0.01 0.02
CHANGE
IN
SCORE
Source: IEP
Safety and Security
Overall Score
Militarisation
Ongoing Conflict
Perceptions of Criminality
Violent Demonstrations
Political Terror Scale
Armed Services Personnel Rate
Homicide Rate
Police Rate
Nuclear and Heavy Weapons
Political Instability
Access to Small Arms
Intensity of Internal Conflict
Incarceration Rate
Terrorism Impact
Refugees and IDPs
UN Peacekeeping Funding
Neighbouring Countries Relations
Violent Crime
Internal Conflicts Fought
Weapons Exports
Deaths From External Conflict
Weapons Imports
Military Expenditure (% GDP)
Deaths From Internal Conflict
External Conflicts Fought
-2% 0% 2%
% CHANGE IN AVERAGE SCORE
Source: IEP
Improvement Deterioration
The Ongoing Conflict domain recorded the largest deterioration,
with the average score on the domain deteriorating by 1.3 per
cent. While most attention has been focused on the wars in
Gaza and Ukraine, conflict remains widespread across the
globe, with 78 countries recording a deterioration from the 2024
to the 2025 GPI. The main driver of rising Ongoing Conflict was
an increase in the number of external conflicts fought, with 46
countries experiencing more external conflict this year than last
year. The biggest deteriorations on this domain occurred in
Russia, Bangladesh and Ukraine. Every indicator on the
Ongoing Conflict domain deteriorated on average, apart from
intensity of internal conflict, which recorded no change.
The Militarisation domain continued to deteriorate over the
past year, with 86 countries recording deteriorations. Average
military expenditure as a percentage of GDP reached its highest
level since 2010, increasing by 2.5 per cent over the past year.
Norway, Denmark and Bangladesh recorded the largest
deteriorations on the Militarisation domain in 2025. The
deterioration on this domain is a reversal of the trend seen for
much of the past 15 years, as many countries have begun to
move towards higher levels of military spending given the
increase in conflict and geopolitical unrest across the globe.
FIGURE 1.2
Percentage change in score by indicator, 2024–2025
Thirteen of the 23 GPI indicators recorded an improvement over the past year.
13.
1
Results
11
The Safety andSecurity domain was the only one of the three
GPI domains to record an improvement over the past year,
despite the increase in armed conflict worldwide. There were 95
countries that recorded improvements on the domain,
compared to 67 that recorded deteriorations. Perceptions of
criminality had the biggest improvement, followed by political
terror scale and violent demonstrations. The average global
homicide rate is at its lowest level since the inception of the
index.
Figure 1.2 shows the average percentage change for each
indicator from the 2024 to the 2025 GPI. Thirteen of the 23 GPI
indicators deteriorated on average, with eight improving and
two remaining unchanged. The largest average deterioration
was on the external conflicts fought indicator, while the
perceptions of criminality indicator had the largest
improvement.
The increase in conflict across the globe led to a deterioration
on the deaths from internal conflict indicator. Although the total
number of deaths fell due to large decreases in Mexico and
Ukraine, 49 countries recorded an increase in conflict deaths in
2024. While the impact of conflict in Ukraine and Palestine
received the most global media coverage, intense conflict has
become increasingly widespread. There were 17 countries with
over 1,000 internal conflict deaths in 2024, the highest since
1999, and a further 18 countries that recorded over one hundred
deaths in the last year.
The largest deterioration year on year was for external conflicts
fought. The deterioration on the indicator reflects the increase
in external actors becoming involved in internal conflicts. The
United States, Russia, Iran and France are among the countries
with the highest scores. There were 44 countries with scores
that deteriorated on this indicator, with four of the ten largest
deteriorations occurring in countries in sub-Saharan Africa.
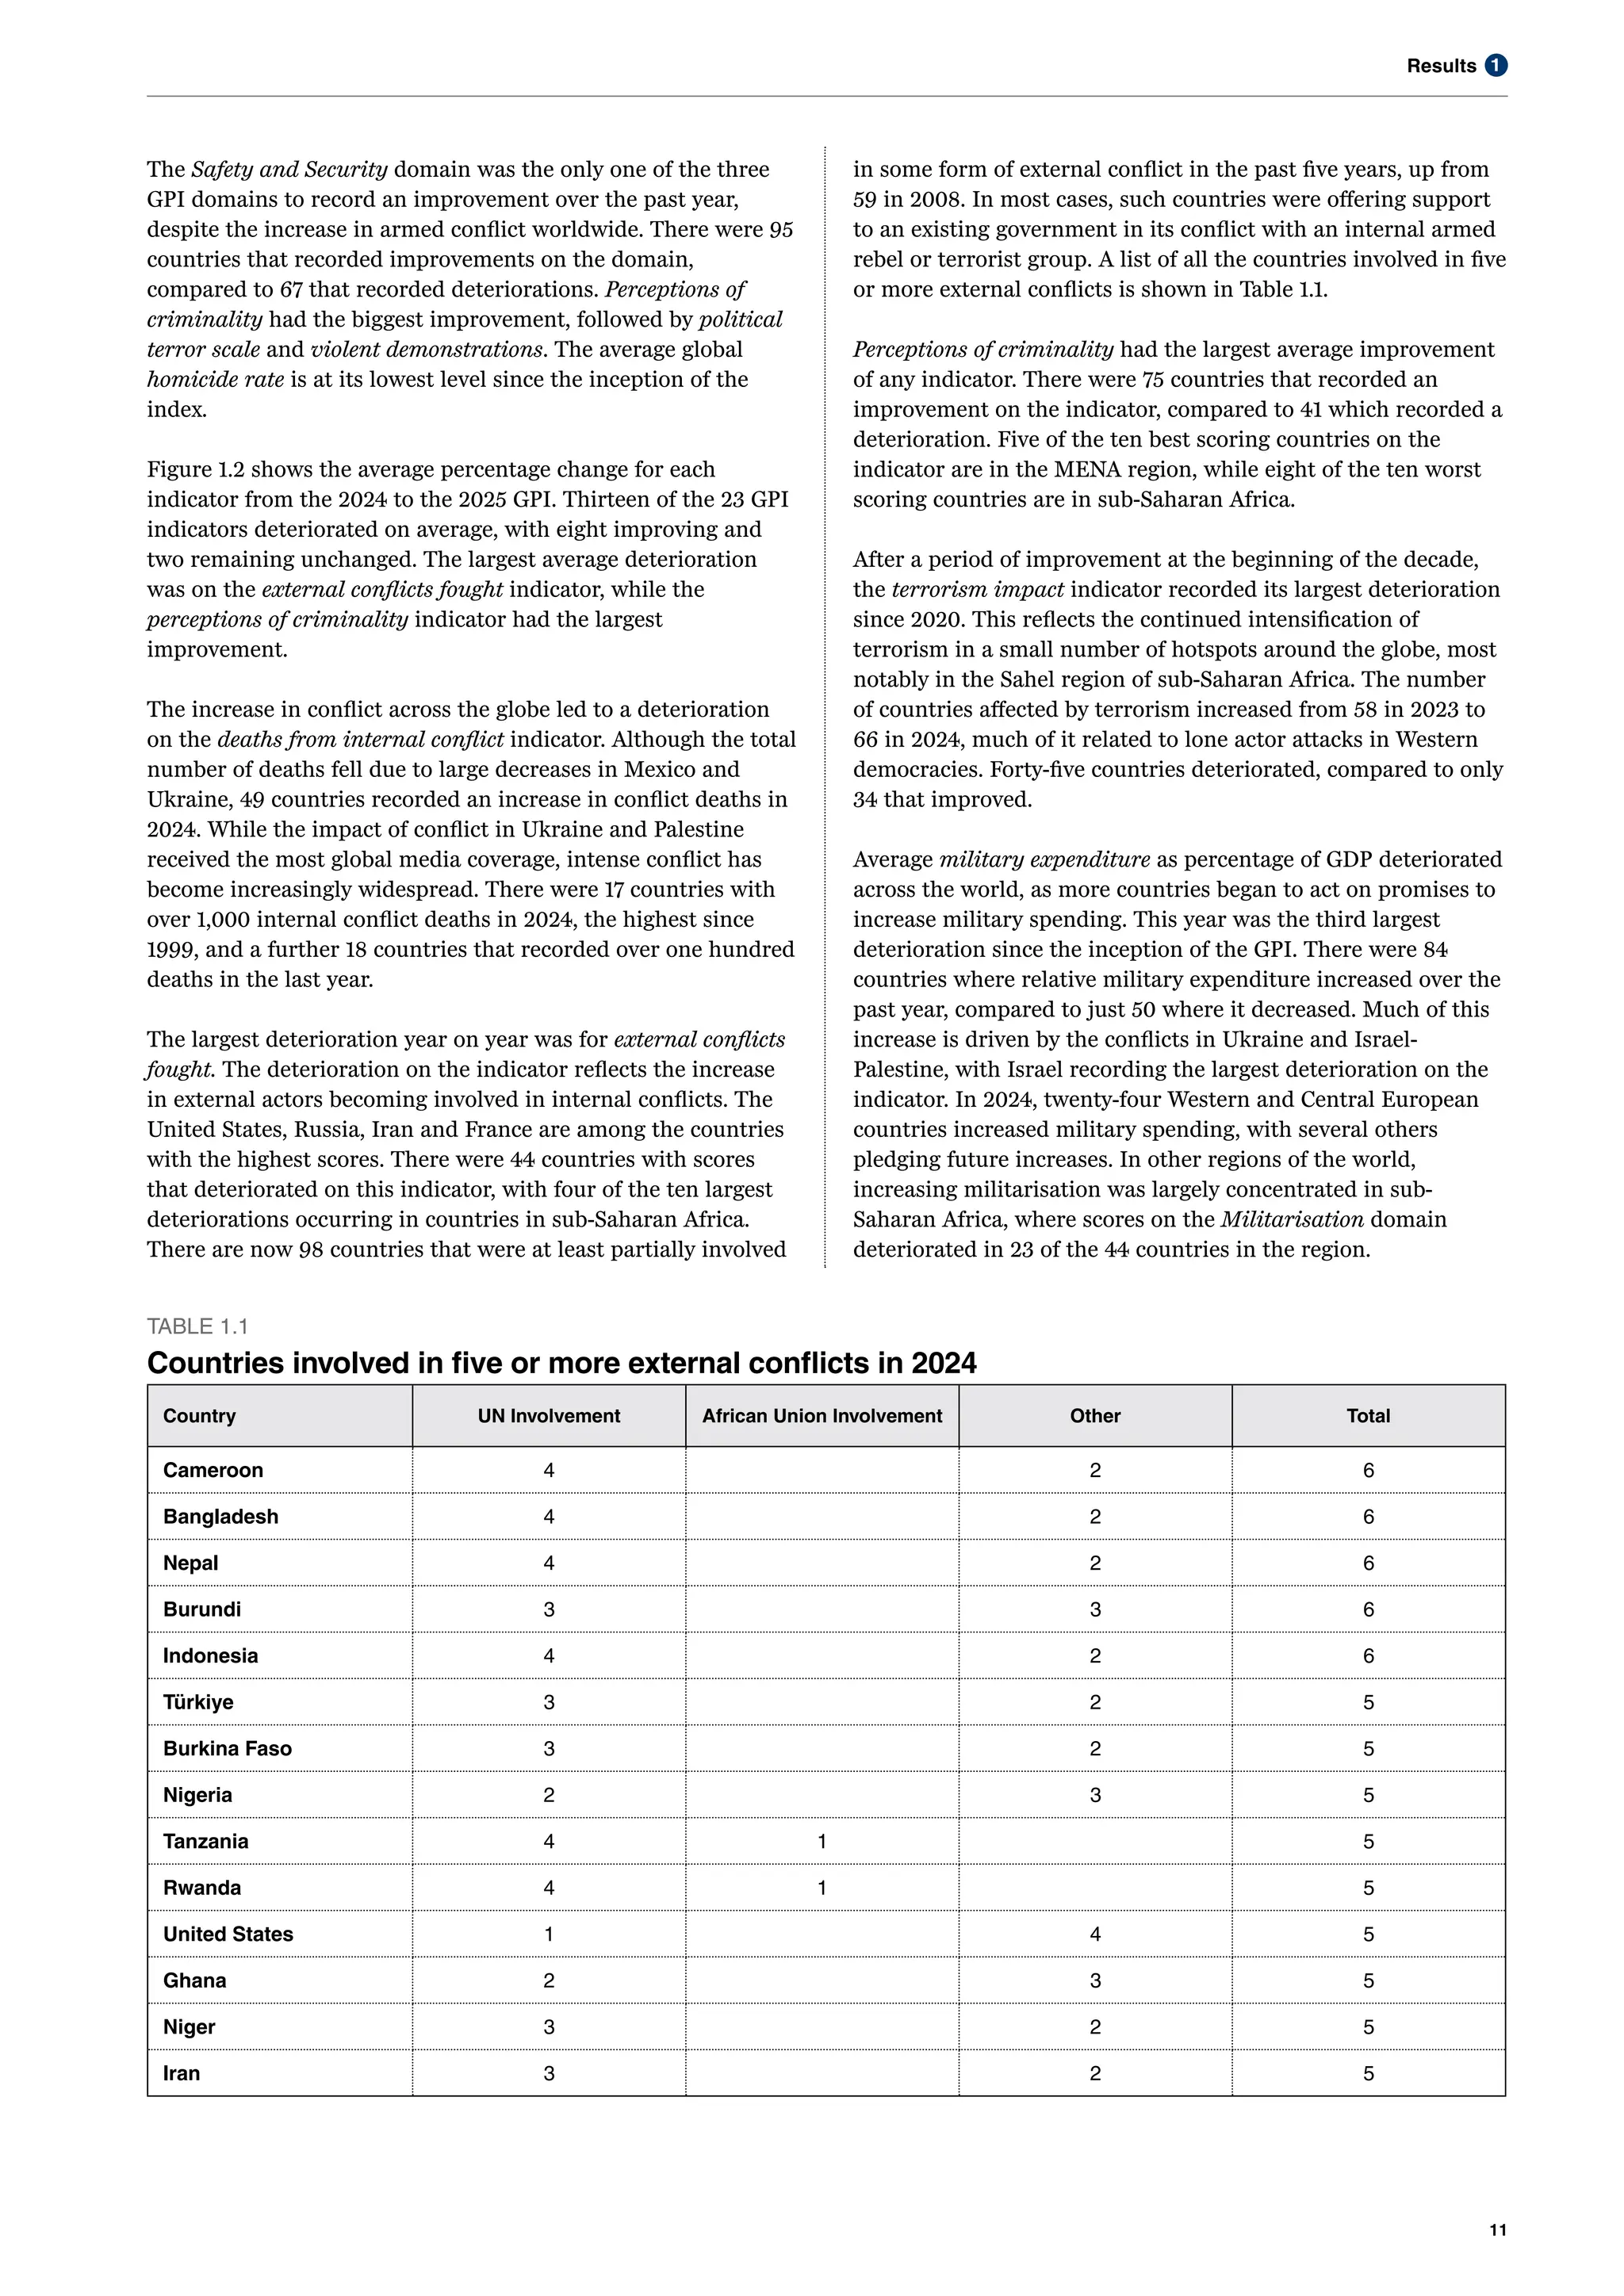
There are now 98 countries that were at least partially involved
in some form of external conflict in the past five years, up from
59 in 2008. In most cases, such countries were offering support
to an existing government in its conflict with an internal armed
rebel or terrorist group. A list of all the countries involved in five
or more external conflicts is shown in Table 1.1.
TABLE 1.1
Countries involved in five or more external conflicts in 2024
Country UN Involvement African Union Involvement Other Total
Cameroon 4 2 6
Bangladesh 4 2 6
Nepal 4 2 6
Burundi 3 3 6
Indonesia 4 2 6
Türkiye 3 2 5
Burkina Faso 3 2 5
Nigeria 2 3 5
Tanzania 4 1 5
Rwanda 4 1 5
United States 1 4 5
Ghana 2 3 5
Niger 3 2 5
Iran 3 2 5
Perceptions of criminality had the largest average improvement
of any indicator. There were 75 countries that recorded an
improvement on the indicator, compared to 41 which recorded a
deterioration. Five of the ten best scoring countries on the
indicator are in the MENA region, while eight of the ten worst
scoring countries are in sub-Saharan Africa.
After a period of improvement at the beginning of the decade,
the terrorism impact indicator recorded its largest deterioration
since 2020. This reflects the continued intensification of
terrorism in a small number of hotspots around the globe, most
notably in the Sahel region of sub-Saharan Africa. The number
of countries affected by terrorism increased from 58 in 2023 to
66 in 2024, much of it related to lone actor attacks in Western
democracies. Forty-five countries deteriorated, compared to only
34 that improved.
Average military expenditure as percentage of GDP deteriorated
across the world, as more countries began to act on promises to
increase military spending. This year was the third largest
deterioration since the inception of the GPI. There were 84
countries where relative military expenditure increased over the
past year, compared to just 50 where it decreased. Much of this
increase is driven by the conflicts in Ukraine and Israel-
Palestine, with Israel recording the largest deterioration on the
indicator. In 2024, twenty-four Western and Central European
countries increased military spending, with several others
pledging future increases. In other regions of the world,
increasing militarisation was largely concentrated in sub-
Saharan Africa, where scores on the Militarisation domain
deteriorated in 23 of the 44 countries in the region.
14.
12
Global Peace Index2025 | Measuring peace in a complex world
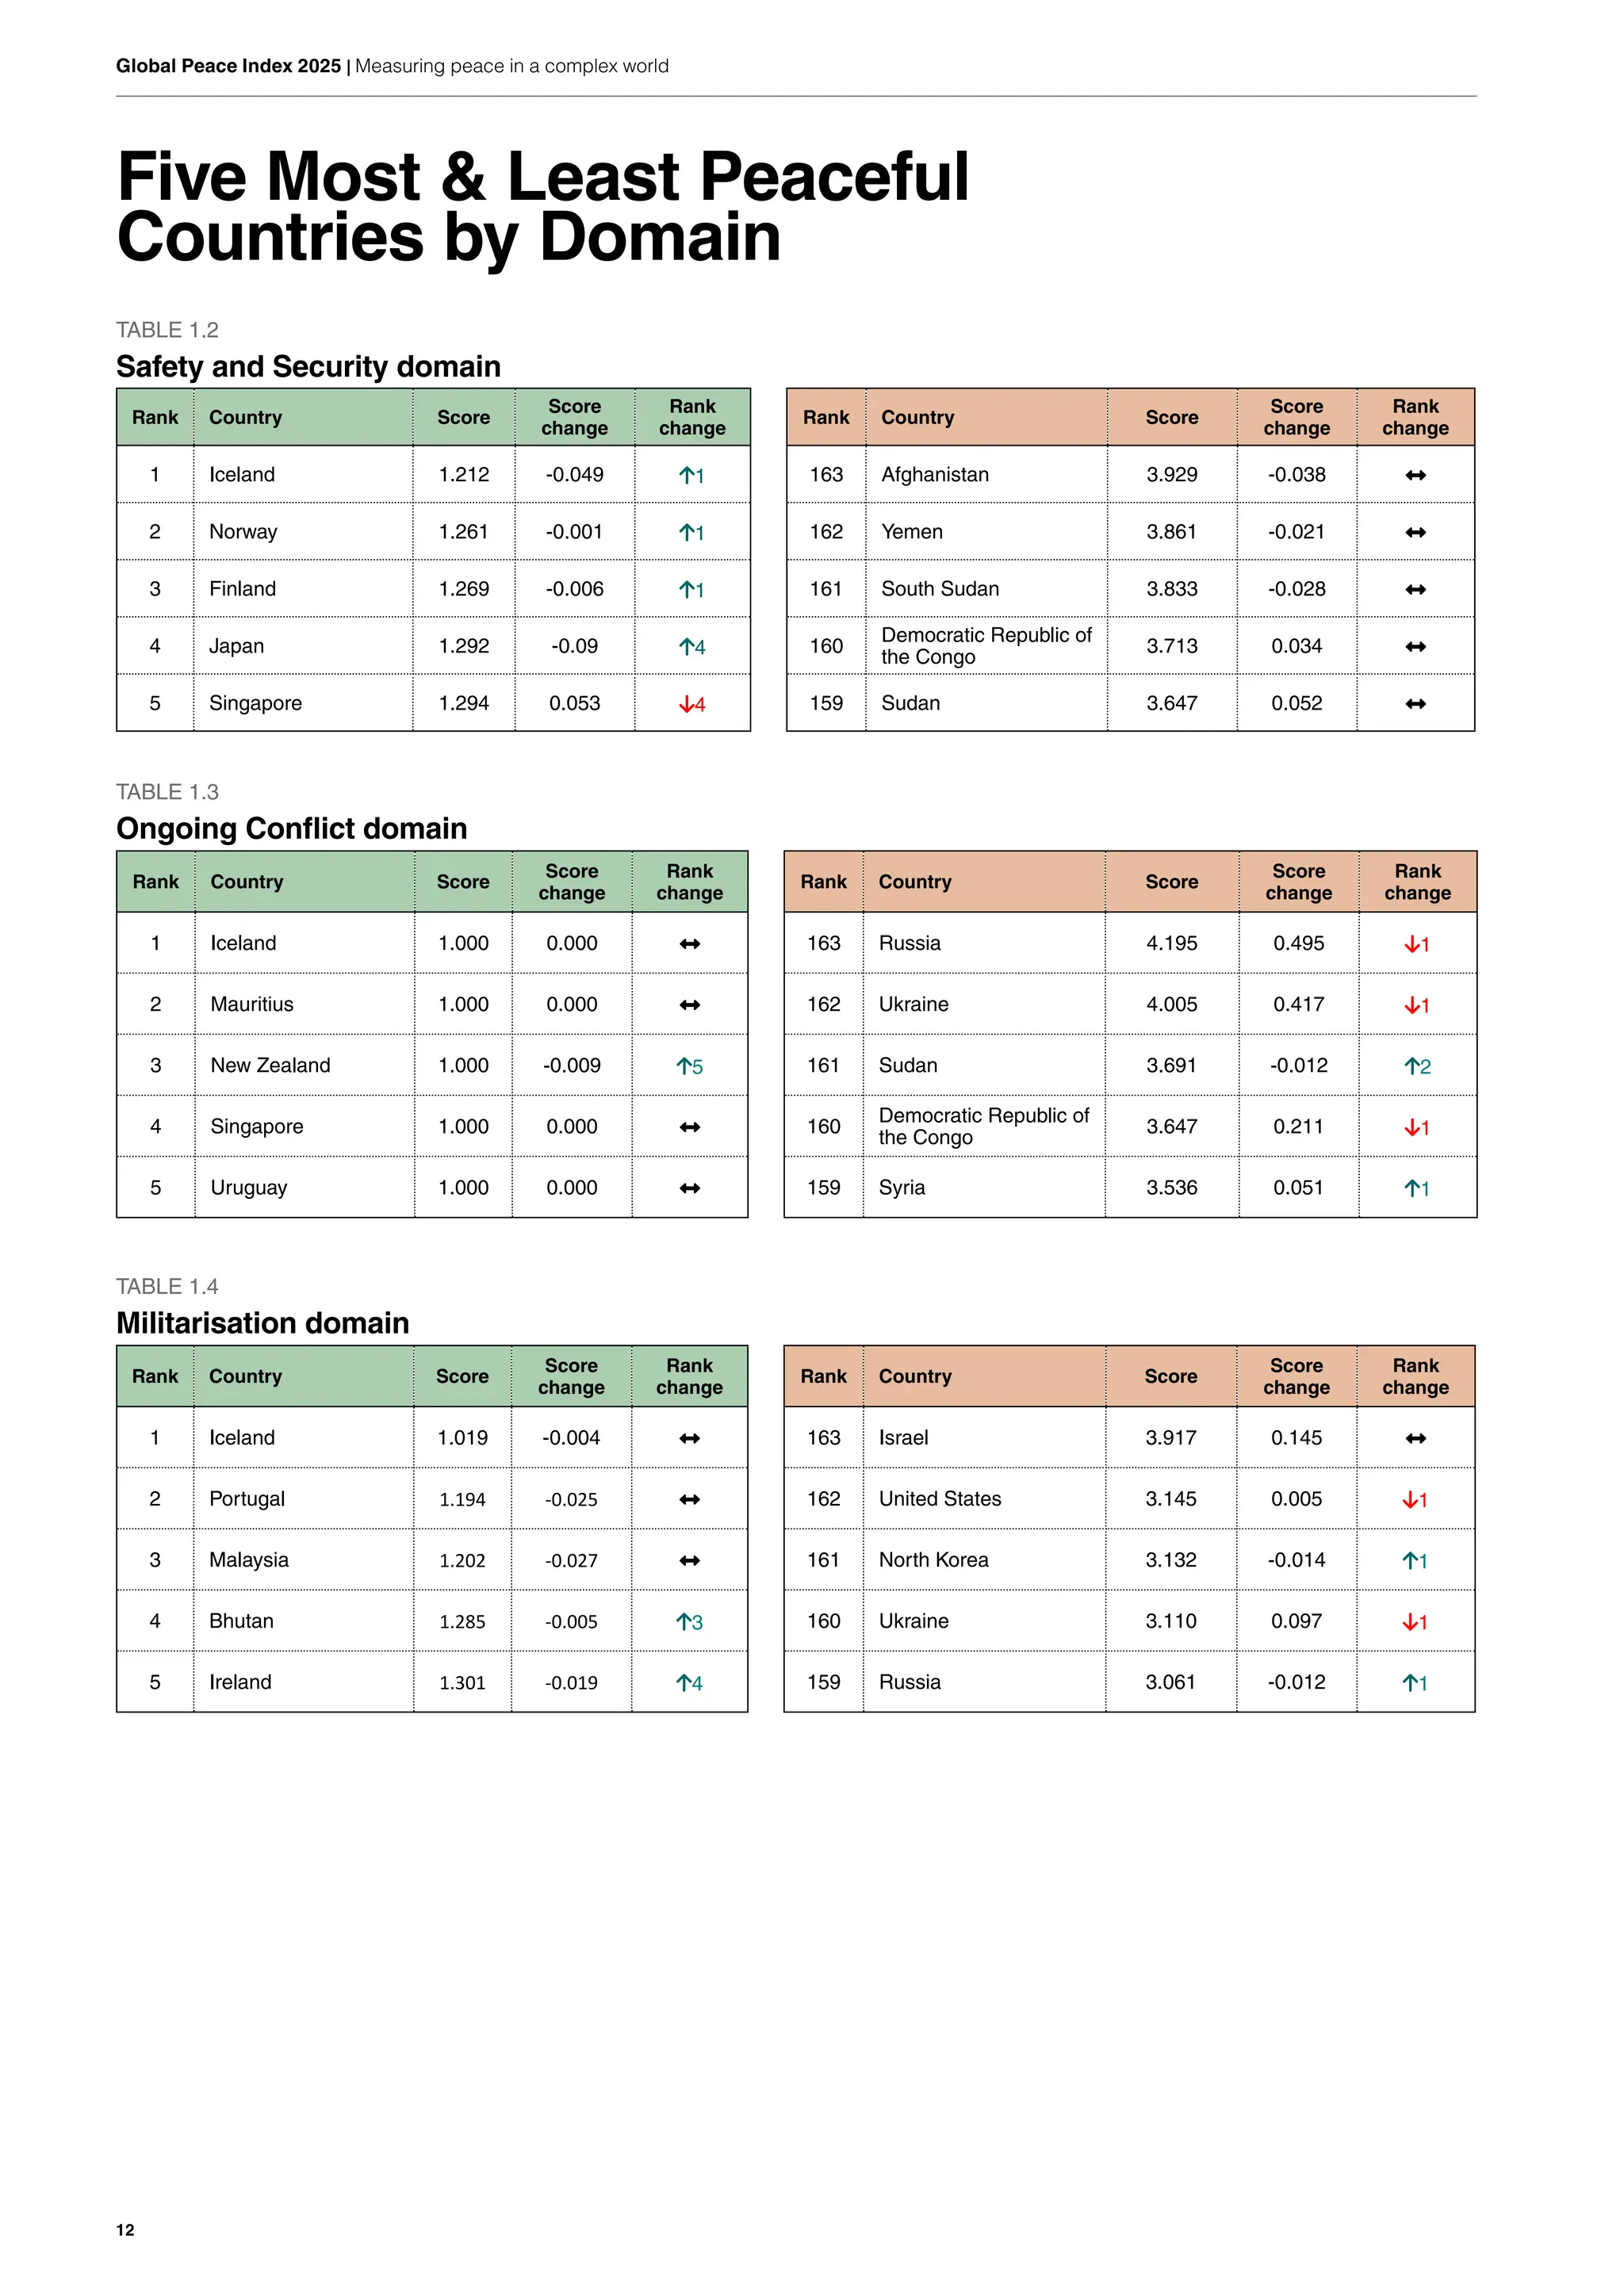
Five Most & Least Peaceful
Countries by Domain
TABLE 1.2
Safety and Security domain
Rank Country Score
Score
change
Rank
change
Rank Country Score
Score
change
Rank
change
1 Iceland 1.212 -0.049 ↑1 163 Afghanistan 3.929 -0.038 ↔
2 Norway 1.261 -0.001 ↑1 162 Yemen 3.861 -0.021 ↔
3 Finland 1.269 -0.006 ↑1 161 South Sudan 3.833 -0.028 ↔
4 Japan 1.292 -0.09 ↑4 160
Democratic Republic of
the Congo
3.713 0.034 ↔
5 Singapore 1.294 0.053 ↓4 159 Sudan 3.647 0.052 ↔
TABLE 1.3
Ongoing Conflict domain
Rank Country Score
Score
change
Rank
change
Rank Country Score
Score
change
Rank
change
1 Iceland 1.000 0.000 ↔ 163 Russia 4.195 0.495 ↓1
2 Mauritius 1.000 0.000 ↔ 162 Ukraine 4.005 0.417 ↓1
3 New Zealand 1.000 -0.009 ↑5 161 Sudan 3.691 -0.012 ↑2
4 Singapore 1.000 0.000 ↔ 160
Democratic Republic of
the Congo
3.647 0.211 ↓1
5 Uruguay 1.000 0.000 ↔ 159 Syria 3.536 0.051 ↑1
TABLE 1.4
Militarisation domain
Rank Country Score
Score
change
Rank
change
Rank Country Score
Score
change
Rank
change
1 Iceland 1.019 -0.004 ↔ 163 Israel 3.917 0.145 ↔
2 Portugal 1.194 -0.025 ↔ 162 United States 3.145 0.005 ↓1
3 Malaysia 1.202 -0.027 ↔ 161 North Korea 3.132 -0.014 ↑1
4 Bhutan 1.285 -0.005 ↑3 160 Ukraine 3.110 0.097 ↓1
5 Ireland 1.301 -0.019 ↑4 159 Russia 3.061 -0.012 ↑1
15.
1
Results
13
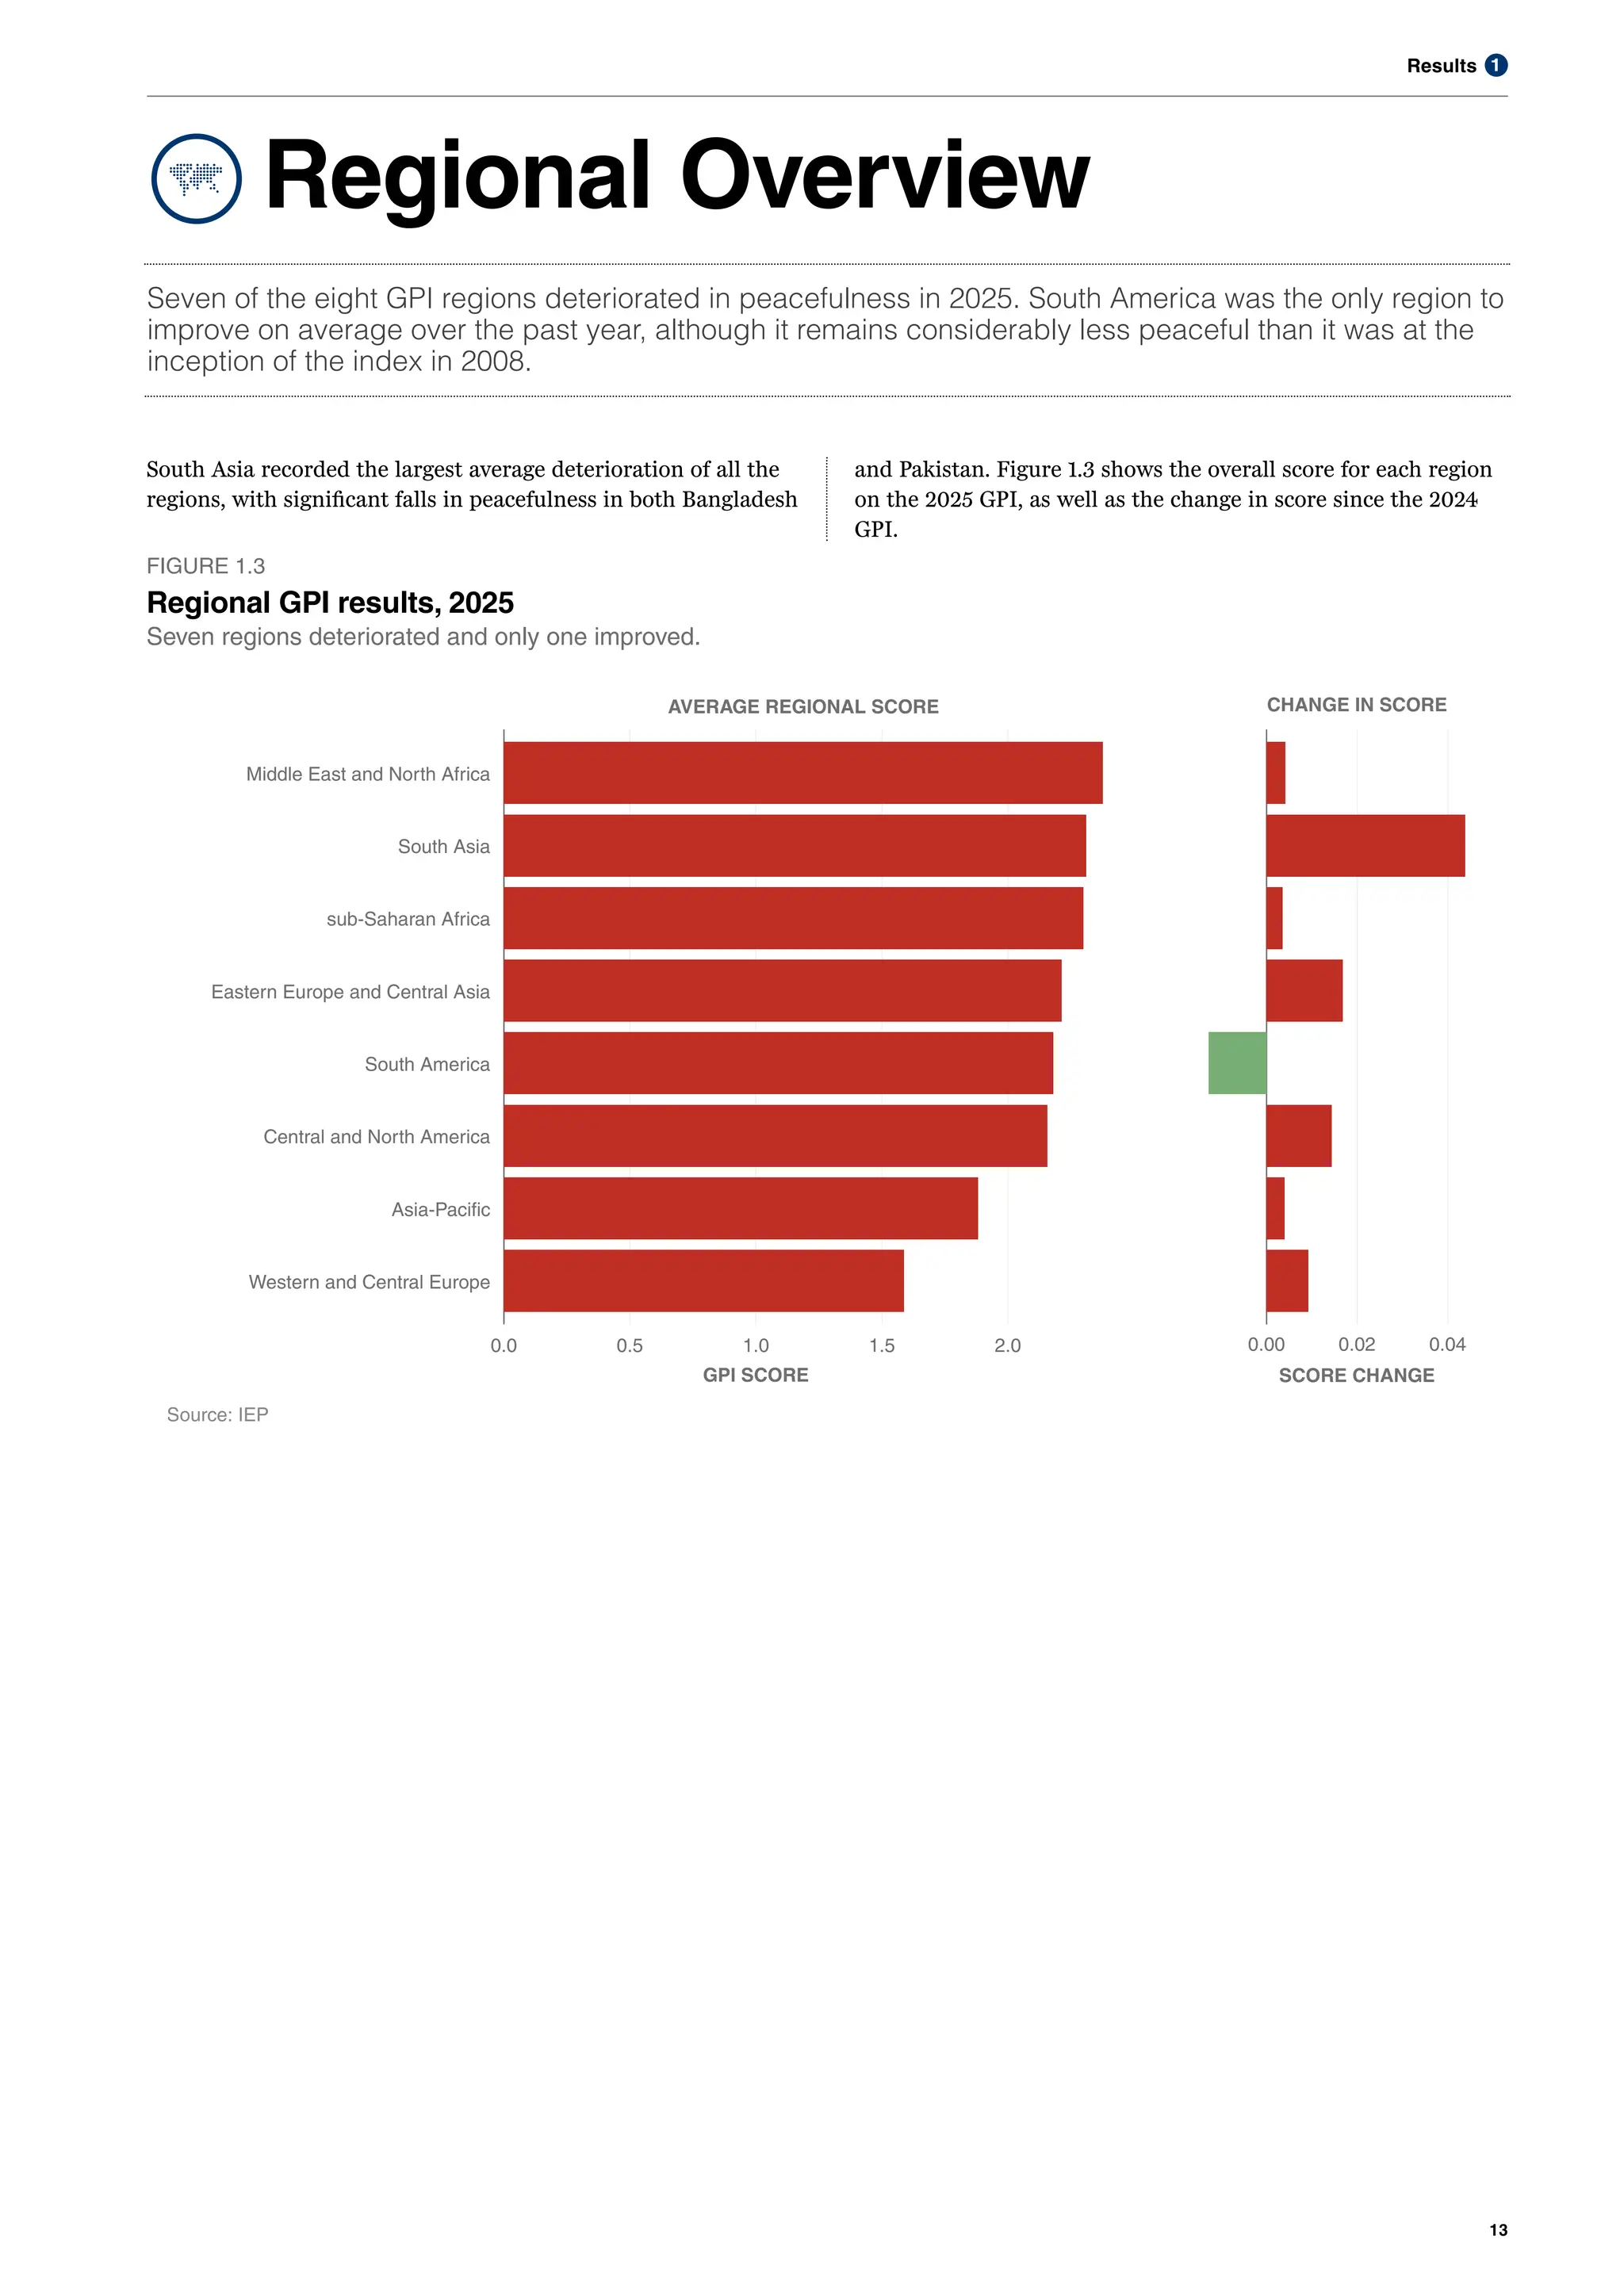
Regional Overview
Seven ofthe eight GPI regions deteriorated in peacefulness in 2025. South America was the only region to
improve on average over the past year, although it remains considerably less peaceful than it was at the
inception of the index in 2008.
South Asia recorded the largest average deterioration of all the
regions, with significant falls in peacefulness in both Bangladesh
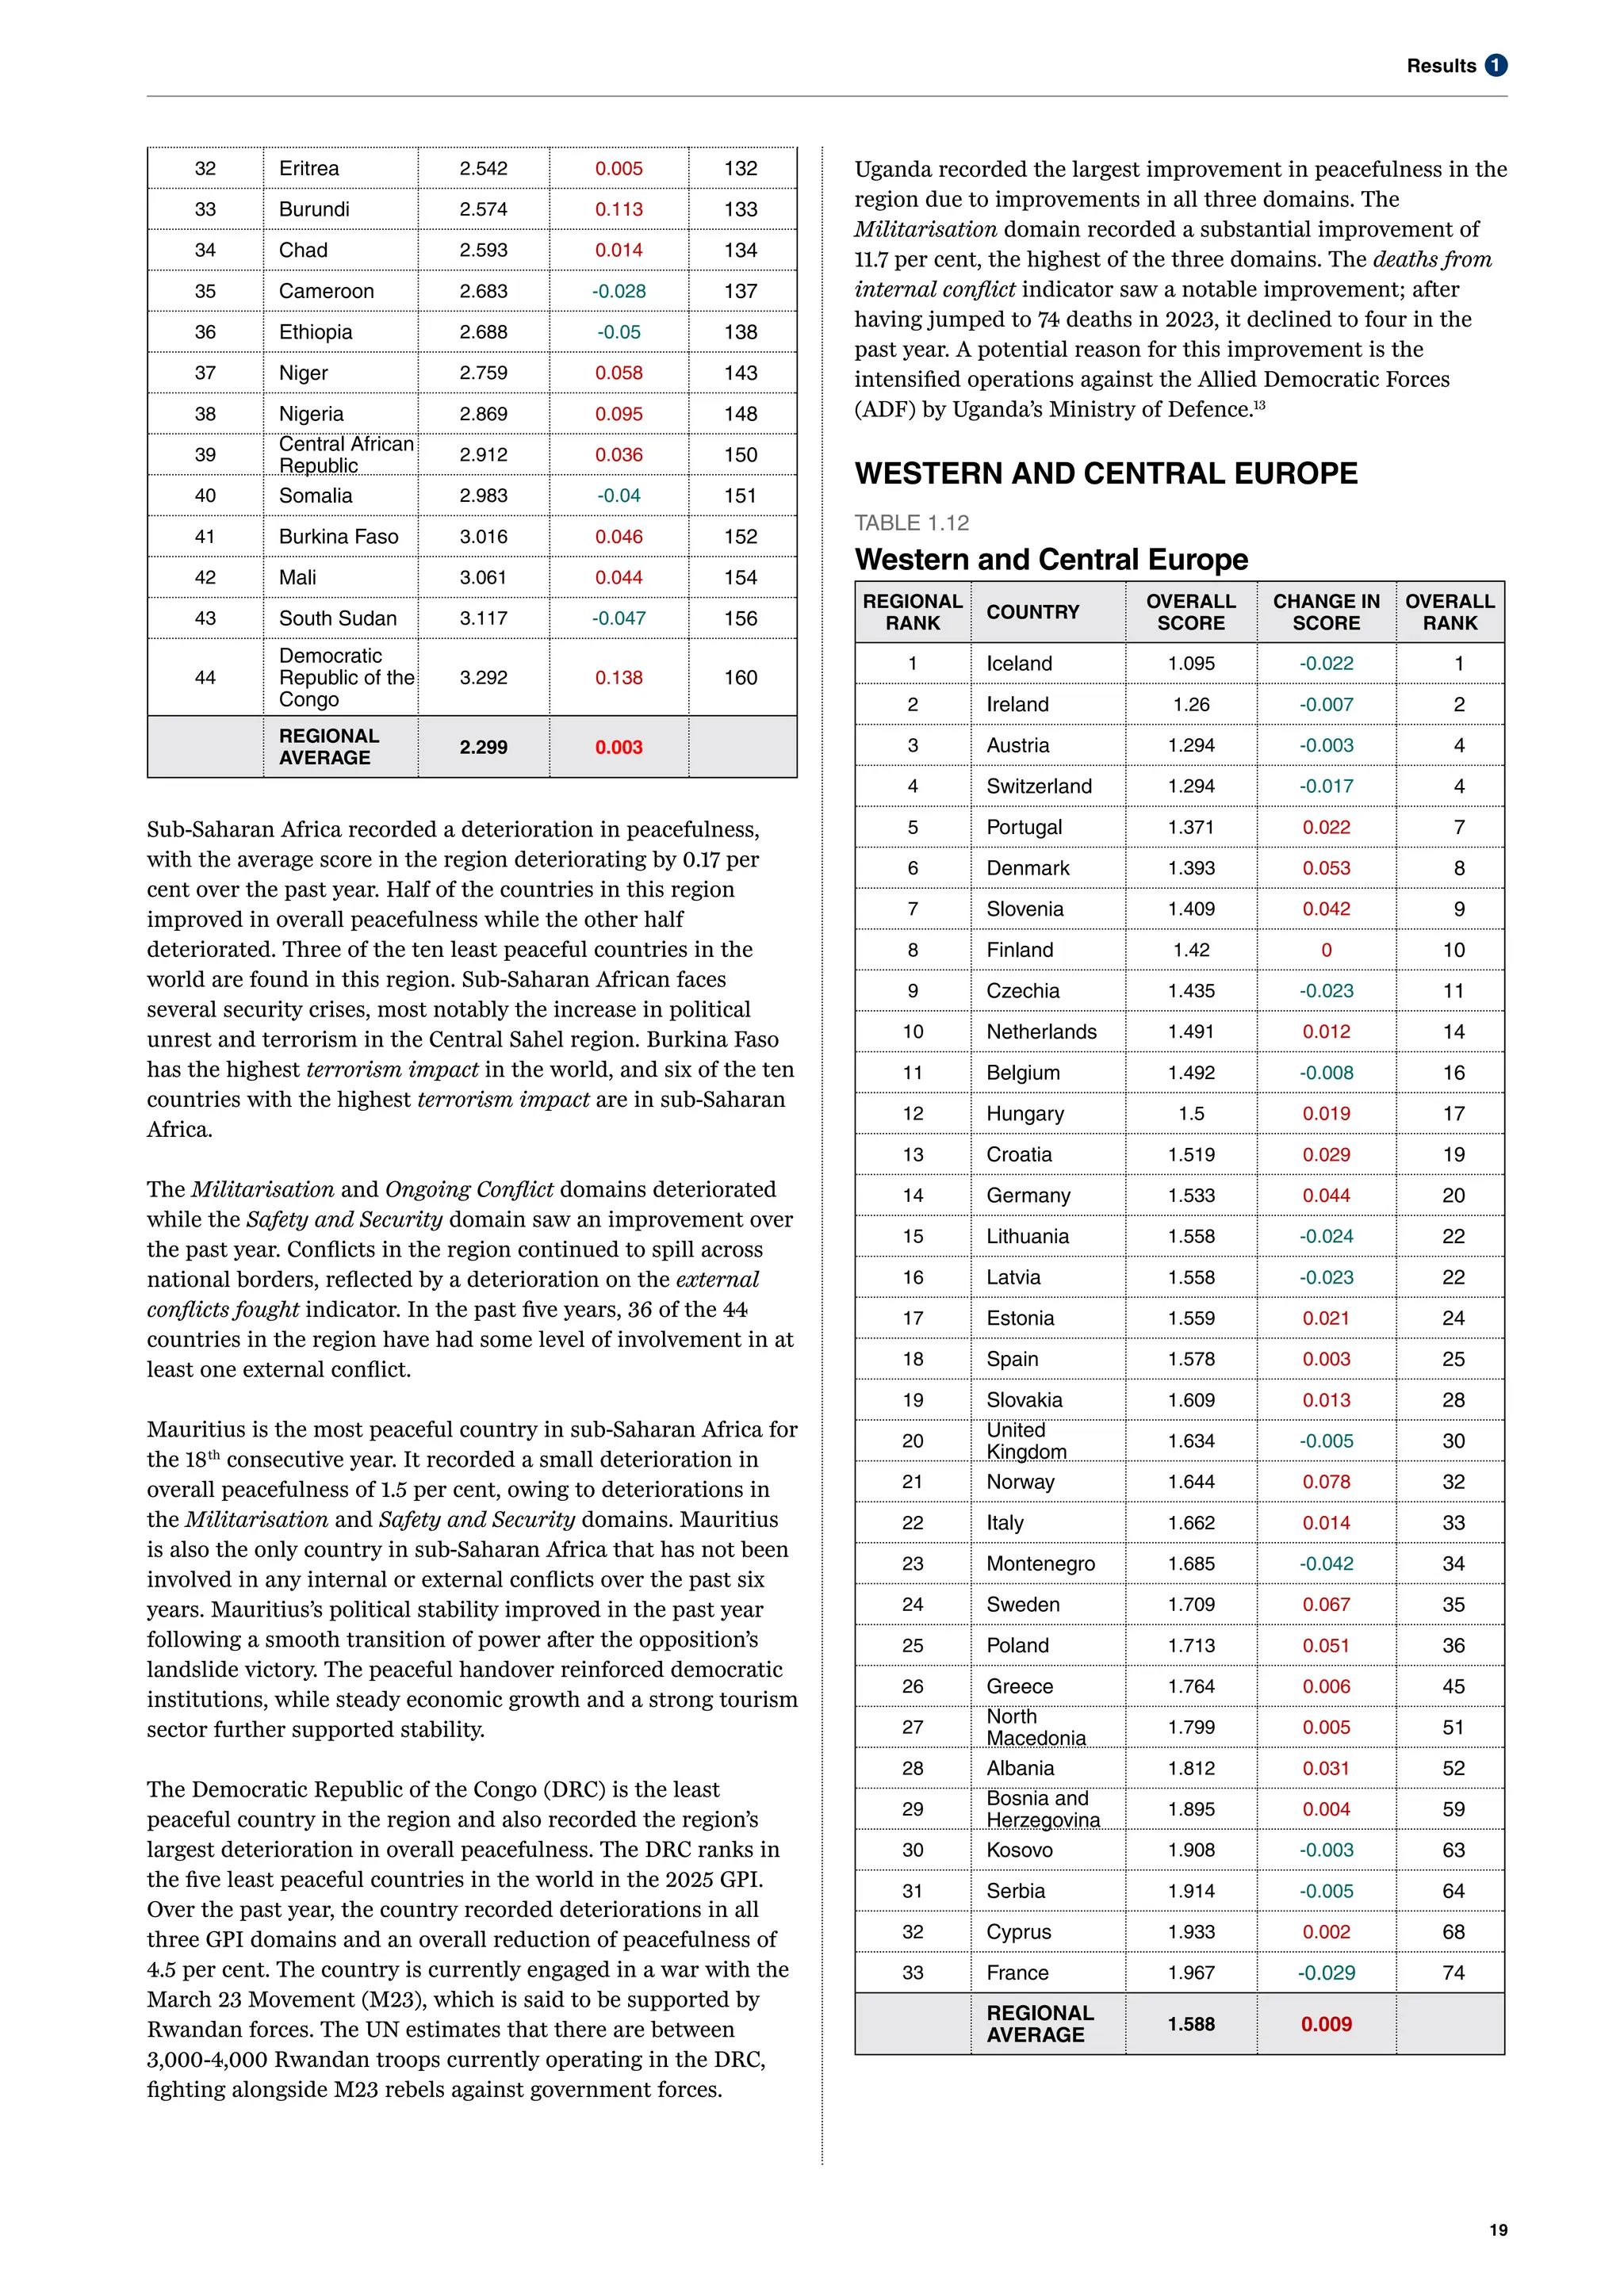
Western and Central Europe
Asia-Pacific
Central and North America
South America
Eastern Europe and Central Asia
sub-Saharan Africa
South Asia
Middle East and North Africa
0.0 0.5 1.0 1.5 2.0
GPI SCORE
AVERAGE REGIONAL SCORE
Source: IEP
0.00 0.02 0.04
SCORE CHANGE
CHANGE IN SCORE
FIGURE 1.3
Regional GPI results, 2025
Seven regions deteriorated and only one improved.
and Pakistan. Figure 1.3 shows the overall score for each region
on the 2025 GPI, as well as the change in score since the 2024
GPI.
16.
14
Global Peace Index2025 | Measuring peace in a complex world
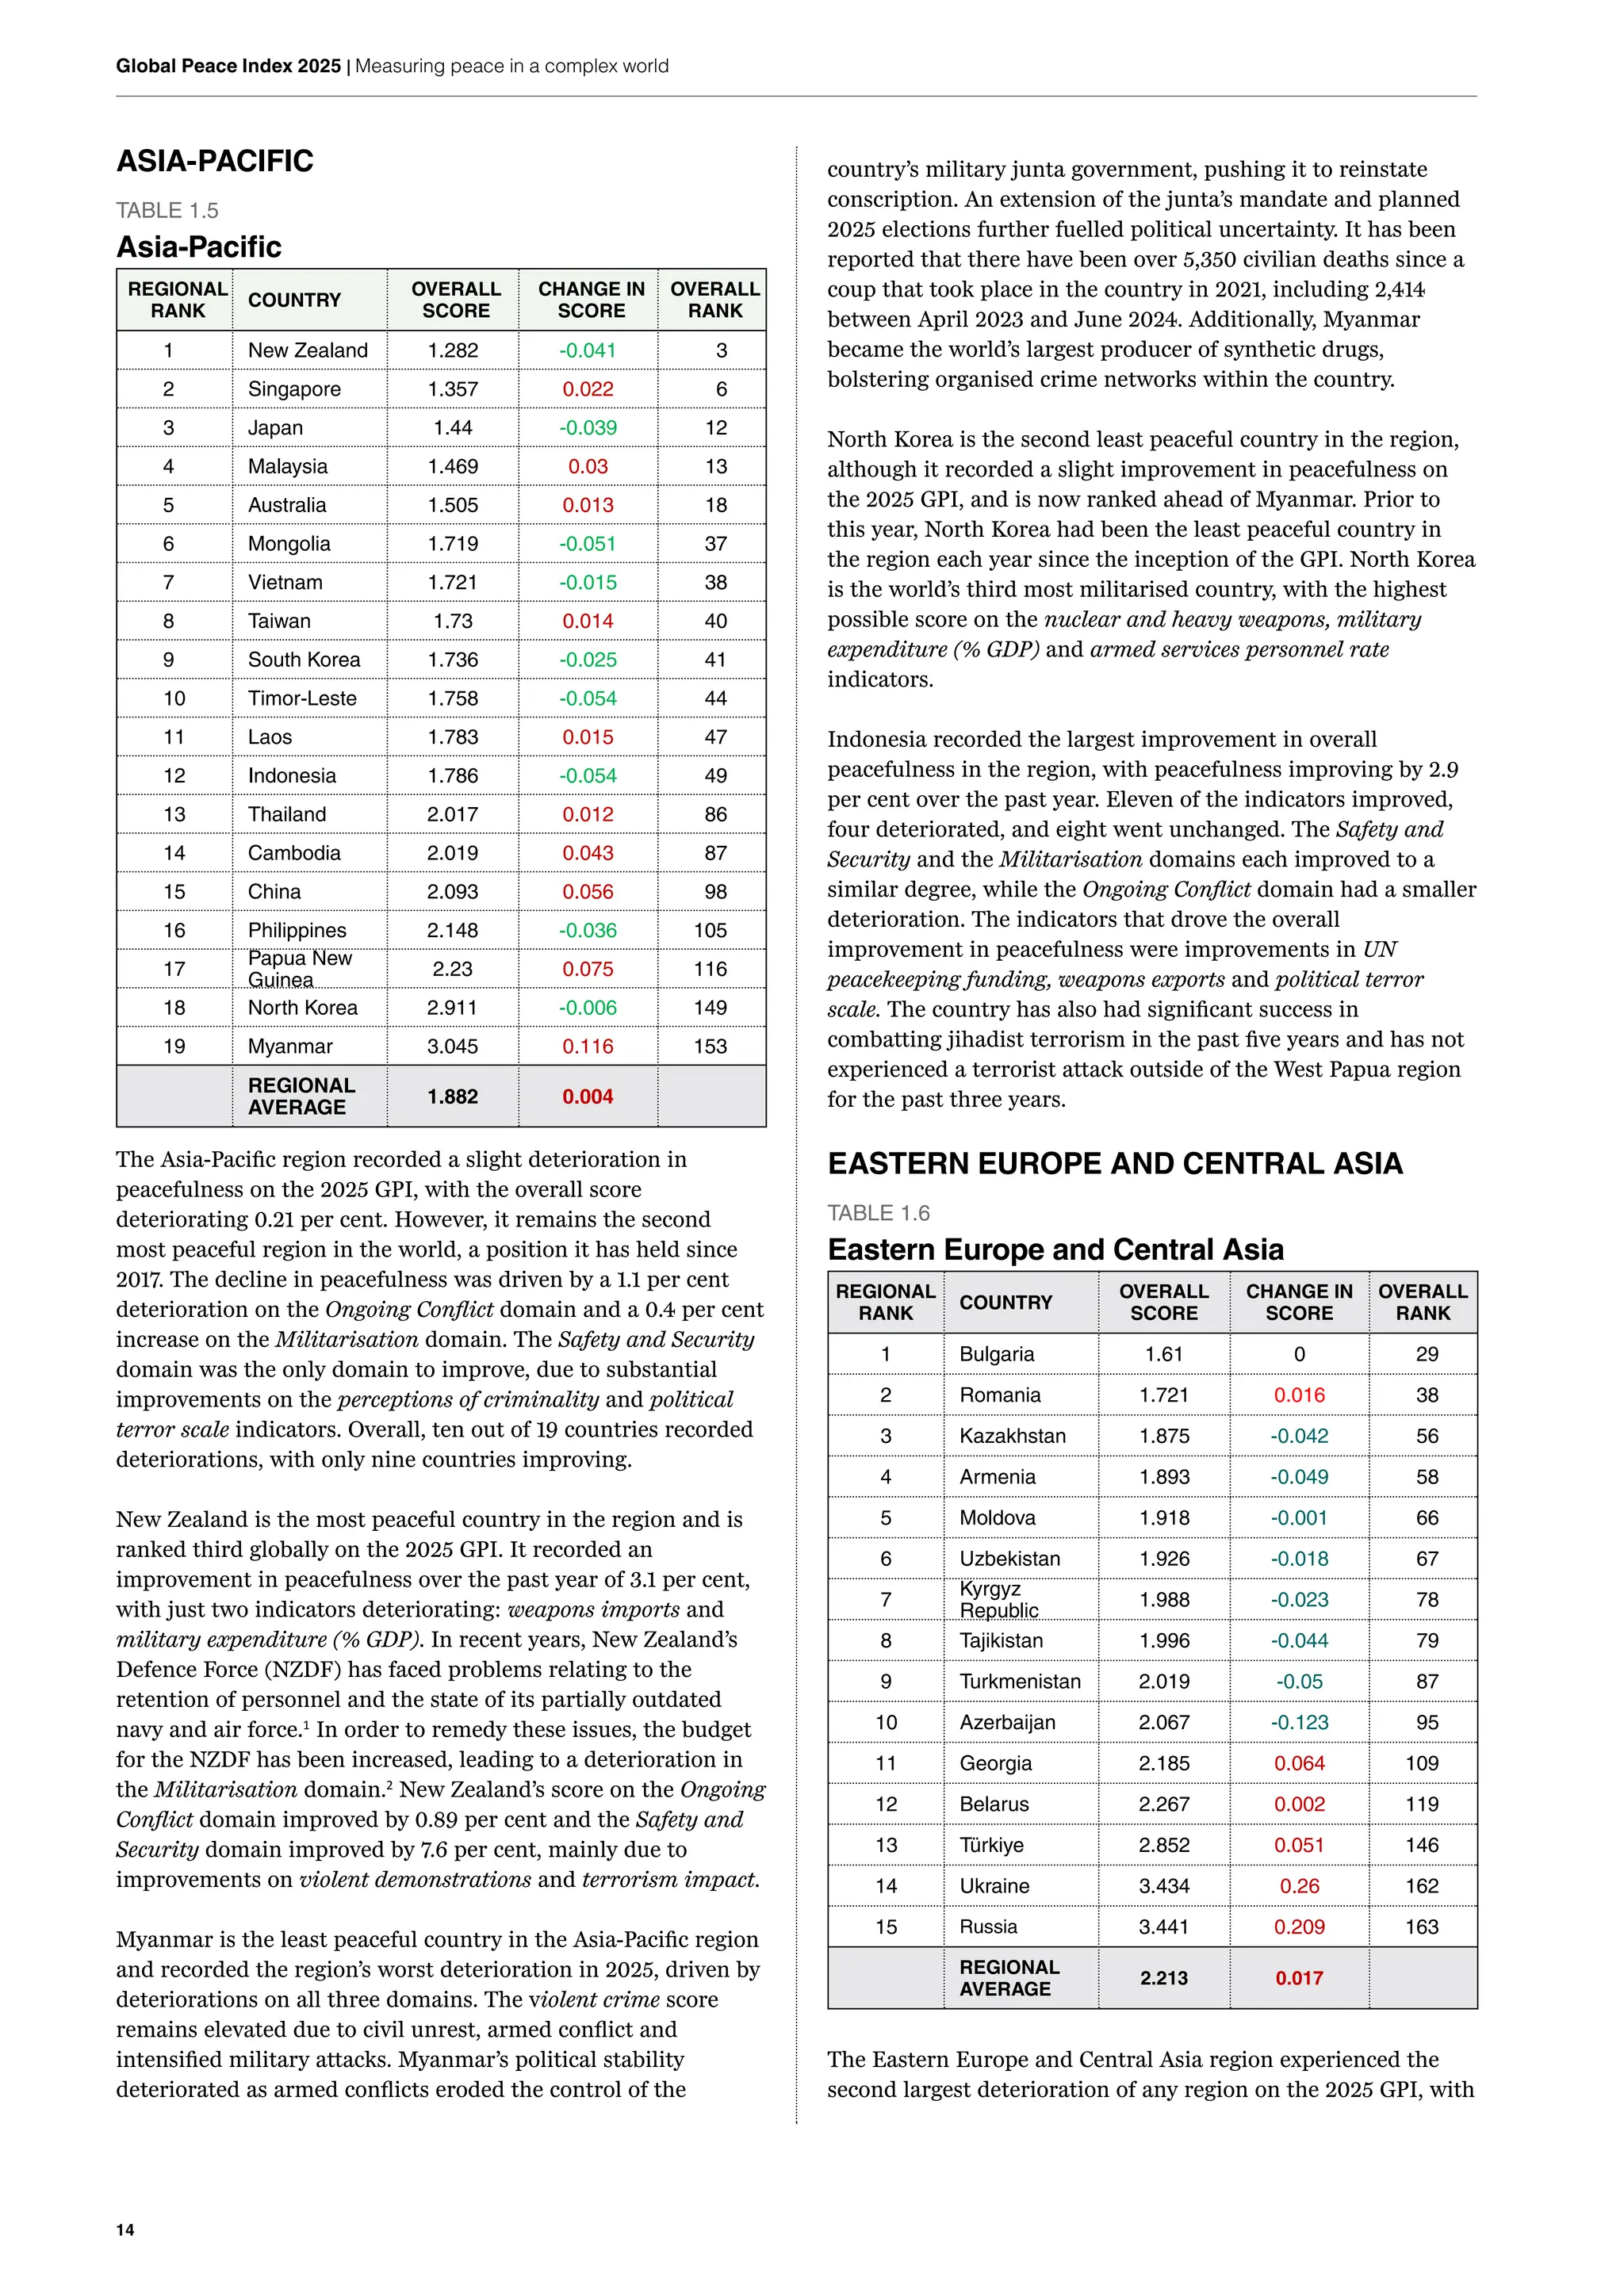
ASIA-PACIFIC
TABLE 1.5
Asia-Pacific
REGIONAL
RANK
COUNTRY
OVERALL
SCORE
CHANGE IN
SCORE
OVERALL
RANK
1 New Zealand 1.282 -0.041 3
2 Singapore 1.357 0.022 6
3 Japan 1.44 -0.039 12
4 Malaysia 1.469 0.03 13
5 Australia 1.505 0.013 18
6 Mongolia 1.719 -0.051 37
7 Vietnam 1.721 -0.015 38
8 Taiwan 1.73 0.014 40
9 South Korea 1.736 -0.025 41
10 Timor-Leste 1.758 -0.054 44
11 Laos 1.783 0.015 47
12 Indonesia 1.786 -0.054 49
13 Thailand 2.017 0.012 86
14 Cambodia 2.019 0.043 87
15 China 2.093 0.056 98
16 Philippines 2.148 -0.036 105
17
Papua New
Guinea
2.23 0.075 116
18 North Korea 2.911 -0.006 149
19 Myanmar 3.045 0.116 153
REGIONAL
AVERAGE
1.882 0.004
The Asia-Pacific region recorded a slight deterioration in
peacefulness on the 2025 GPI, with the overall score
deteriorating 0.21 per cent. However, it remains the second
most peaceful region in the world, a position it has held since
2017. The decline in peacefulness was driven by a 1.1 per cent
deterioration on the Ongoing Conflict domain and a 0.4 per cent
increase on the Militarisation domain. The Safety and Security
domain was the only domain to improve, due to substantial
improvements on the perceptions of criminality and political
terror scale indicators. Overall, ten out of 19 countries recorded
deteriorations, with only nine countries improving.
New Zealand is the most peaceful country in the region and is
ranked third globally on the 2025 GPI. It recorded an
improvement in peacefulness over the past year of 3.1 per cent,
with just two indicators deteriorating: weapons imports and
military expenditure (% GDP). In recent years, New Zealand’s
Defence Force (NZDF) has faced problems relating to the
retention of personnel and the state of its partially outdated
navy and air force.1
In order to remedy these issues, the budget
for the NZDF has been increased, leading to a deterioration in
the Militarisation domain.2
New Zealand’s score on the Ongoing
Conflict domain improved by 0.89 per cent and the Safety and
Security domain improved by 7.6 per cent, mainly due to
improvements on violent demonstrations and terrorism impact.
Myanmar is the least peaceful country in the Asia-Pacific region
and recorded the region’s worst deterioration in 2025, driven by
deteriorations on all three domains. The violent crime score
remains elevated due to civil unrest, armed conflict and
intensified military attacks. Myanmar’s political stability
deteriorated as armed conflicts eroded the control of the
country’s military junta government, pushing it to reinstate
conscription. An extension of the junta’s mandate and planned
2025 elections further fuelled political uncertainty. It has been
reported that there have been over 5,350 civilian deaths since a
coup that took place in the country in 2021, including 2,414
between April 2023 and June 2024. Additionally, Myanmar
became the world’s largest producer of synthetic drugs,
bolstering organised crime networks within the country.
North Korea is the second least peaceful country in the region,
although it recorded a slight improvement in peacefulness on
the 2025 GPI, and is now ranked ahead of Myanmar. Prior to
this year, North Korea had been the least peaceful country in
the region each year since the inception of the GPI. North Korea
is the world’s third most militarised country, with the highest
possible score on the nuclear and heavy weapons, military
expenditure (% GDP) and armed services personnel rate
indicators.
Indonesia recorded the largest improvement in overall
peacefulness in the region, with peacefulness improving by 2.9
per cent over the past year. Eleven of the indicators improved,
four deteriorated, and eight went unchanged. The Safety and
Security and the Militarisation domains each improved to a
similar degree, while the Ongoing Conflict domain had a smaller
deterioration. The indicators that drove the overall
improvement in peacefulness were improvements in UN
peacekeeping funding, weapons exports and political terror
scale. The country has also had significant success in
combatting jihadist terrorism in the past five years and has not
experienced a terrorist attack outside of the West Papua region
for the past three years.
EASTERN EUROPE AND CENTRAL ASIA
TABLE 1.6
Eastern Europe and Central Asia
REGIONAL
RANK
COUNTRY
OVERALL
SCORE
CHANGE IN
SCORE
OVERALL
RANK
1 Bulgaria 1.61 0 29
2 Romania 1.721 0.016 38
3 Kazakhstan 1.875 -0.042 56
4 Armenia 1.893 -0.049 58
5 Moldova 1.918 -0.001 66
6 Uzbekistan 1.926 -0.018 67
7
Kyrgyz
Republic
1.988 -0.023 78
8 Tajikistan 1.996 -0.044 79
9 Turkmenistan 2.019 -0.05 87
10 Azerbaijan 2.067 -0.123 95
11 Georgia 2.185 0.064 109
12 Belarus 2.267 0.002 119
13 Türkiye 2.852 0.051 146
14 Ukraine 3.434 0.26 162
15 Russia 3.441 0.209 163
REGIONAL
AVERAGE
2.213 0.017
The Eastern Europe and Central Asia region experienced the
second largest deterioration of any region on the 2025 GPI, with
17.
1
Results
15
the average levelof peacefulness in the region deteriorating by
0.77 per cent. Overall levels of peacefulness in the region remain
low, mainly driven by the conflict between Ukraine and Russia.
Eight countries registered improvements, six registered
deteriorations, and one remained unchanged. All three domains
recorded deteriorations in the past year, the most significant
being in the Ongoing Conflict domain.
The dominant issue in the region remains the conflict between
Russia and Ukraine, which led to significant deteriorations in
peacefulness in both countries. Russia and Ukraine are ranked
as the least and second least peaceful countries in the world on
the 2025 GPI. With no immediate end to the conflict in sight, it
is likely that Russia and Ukraine will remain two of the least
peaceful countries in the world for the foreseeable future.
Russia is now the least peaceful country in the world on the
2025 GPI and recorded the second largest deterioration in the
region, behind Ukraine. Russia ranked as the 163rd
country on
the Ongoing Conflict domain. Its overall level of peacefulness
deteriorated by 6.5 per cent in the past year. The Safety and
Security domain and the Ongoing Conflict domain deteriorated,
while the Militarisation domain improved solely due to a
decrease on the weapons exports indicator. The deaths from
internal conflict indicator increased as a result of the Kursk
offensive by Ukrainian troops in August 2024. This marked the
first significant combat operation within Russia’s borders since
the onset of the conflict.
Ukraine recorded the largest deterioration in overall
peacefulness in the region in the past year. It ranks as the
second least peaceful country in the region and in the world on
the 2025 GPI. In addition to its ongoing conflict with Russia,
Ukraine experienced a significant rise in other forms of internal
violence, driven in part by stresses and deprivations associated
with the war. Domestic violence cases surged in 2024, with over
291,000 incidents reported, a 20 per cent increase from the
previous year. Additionally, organised crime activities
intensified, including increased arms trafficking and gang-
related violence. The proliferation of firearms from the conflict
zone contributed to these trends, exacerbating public safety
concerns.
Bulgaria is the most peaceful country in the region. Although
the overall peacefulness score remained unchanged, several
indicators had significant changes, with the violent
demonstrations and military expenditure indicators
deteriorating, while perceptions of criminality and nuclear and
heavy weapons improved. The October 2024 national election
was followed by reports of vote-count irregularities, disputed
results and protests. In March 2025, the results were declared
illegitimate.3
The increase in violent demonstrations was also
driven by protests in early 2025 against the country’s plan to
adopt the euro as its national currency.4
Azerbaijan recorded the largest improvement in peacefulness in
the region. Its overall score improved by 5.4 per cent, leading to
a rise in the GPI rankings from 113th
to 95th
place. The Ongoing
Conflict and Safety and Security domains recorded
improvements, while the Militarisation domain deteriorated.
The Ongoing Conflict domain recorded the largest
improvement, driven by the deaths from internal conflict and
the deaths from external conflict indicators both improving by
100 per cent. These drops in conflict deaths were likely caused
by the cessation of active hostilities in the Nagorno-Karabakh
conflict in 2023-2024.5
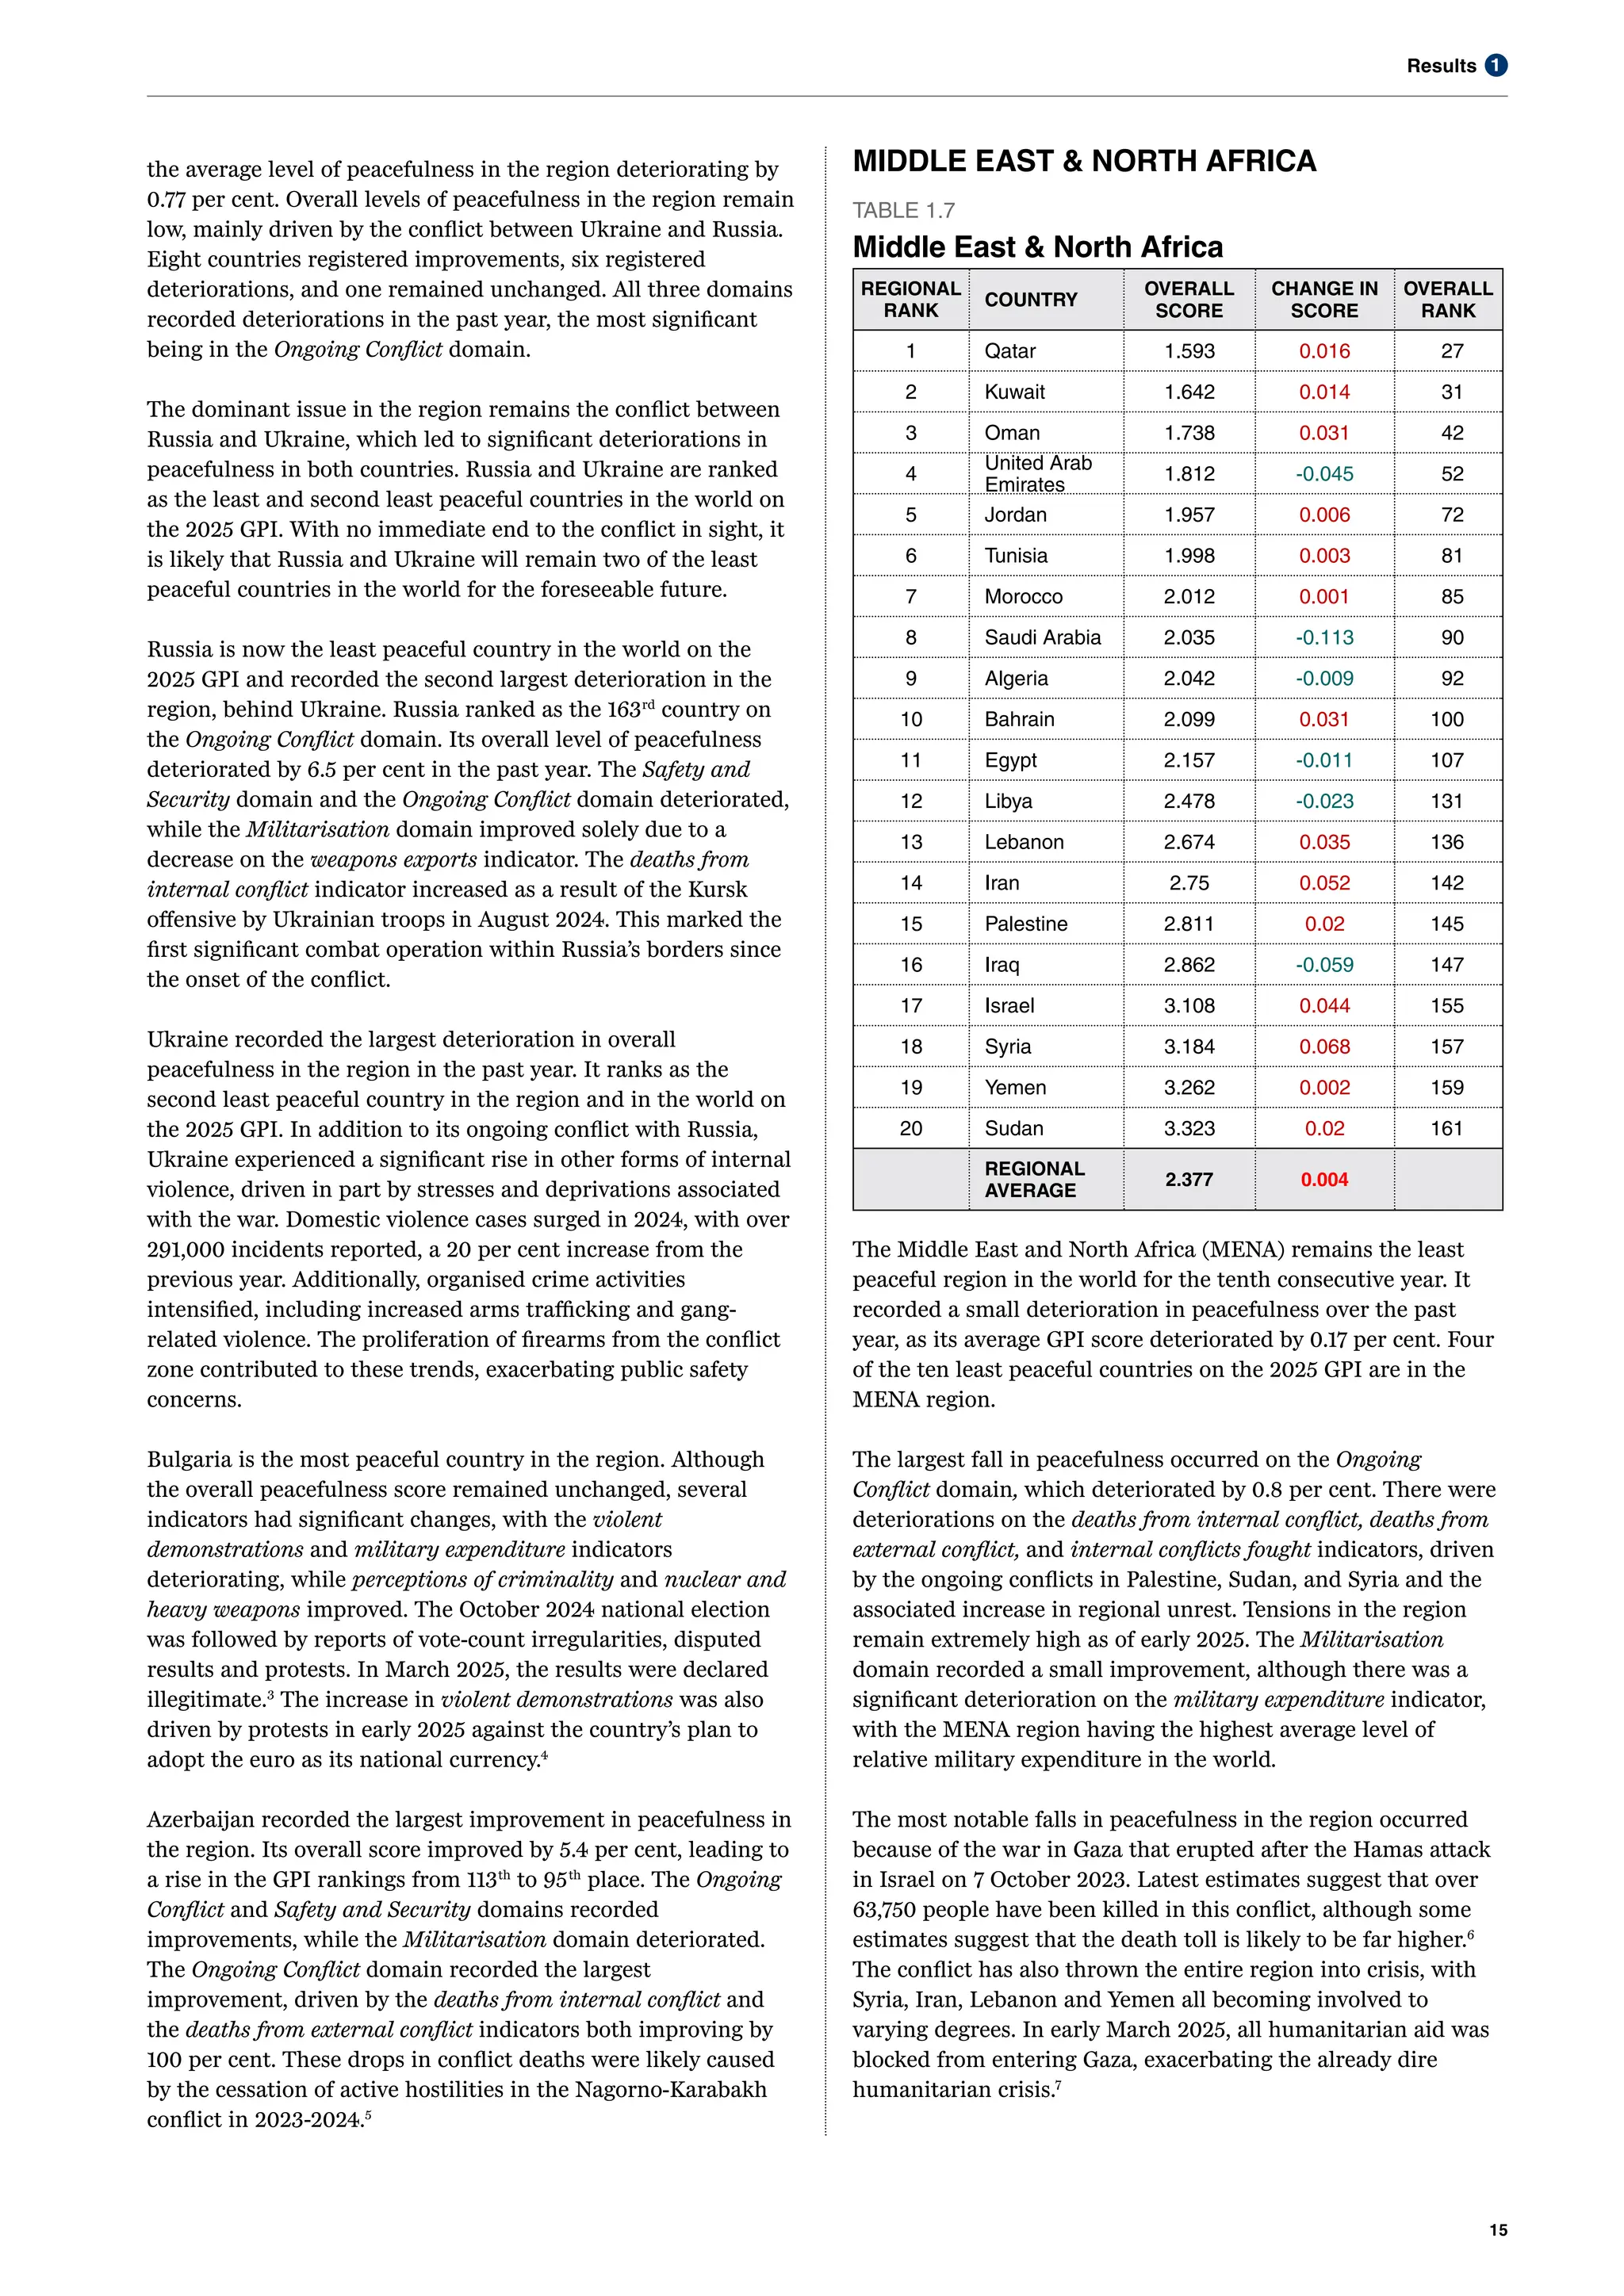
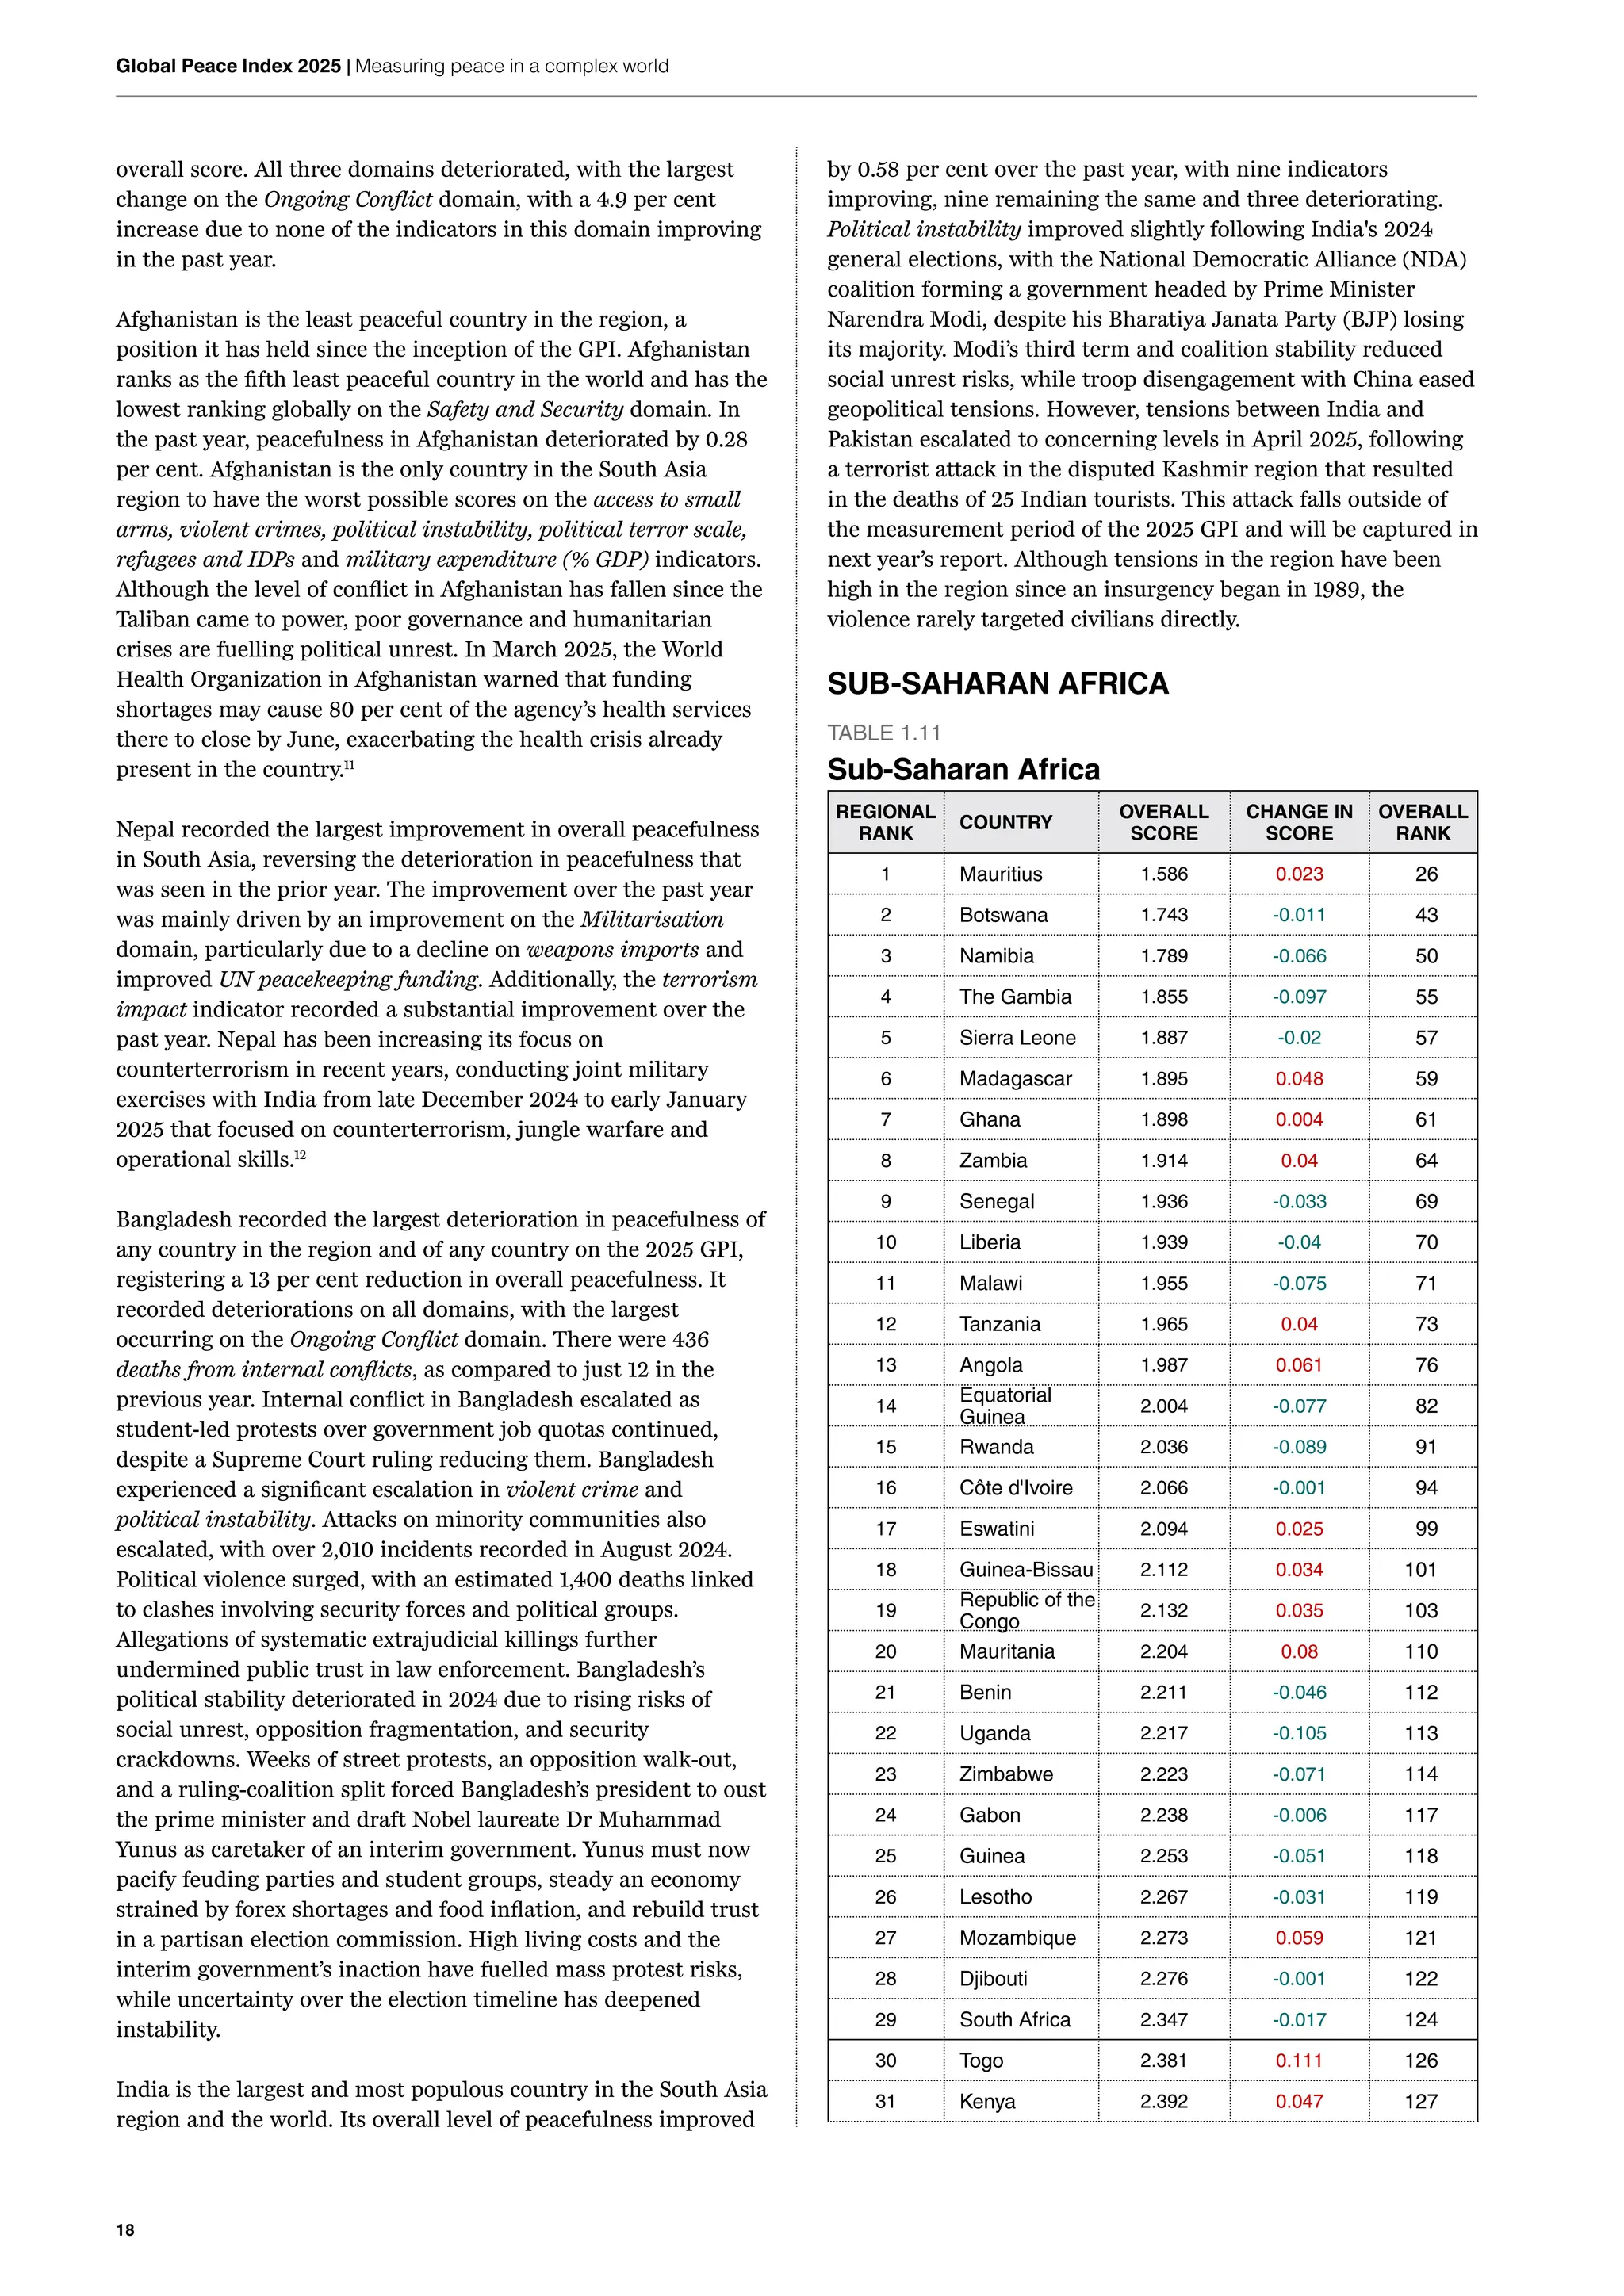
MIDDLE EAST & NORTH AFRICA
TABLE 1.7
Middle East & North Africa
REGIONAL
RANK
COUNTRY
OVERALL
SCORE
CHANGE IN
SCORE
OVERALL
RANK
1 Qatar 1.593 0.016 27
2 Kuwait 1.642 0.014 31
3 Oman 1.738 0.031 42
4
United Arab
Emirates
1.812 -0.045 52
5 Jordan 1.957 0.006 72
6 Tunisia 1.998 0.003 81
7 Morocco 2.012 0.001 85
8 Saudi Arabia 2.035 -0.113 90
9 Algeria 2.042 -0.009 92
10 Bahrain 2.099 0.031 100
11 Egypt 2.157 -0.011 107
12 Libya 2.478 -0.023 131
13 Lebanon 2.674 0.035 136
14 Iran 2.75 0.052 142
15 Palestine 2.811 0.02 145
16 Iraq 2.862 -0.059 147
17 Israel 3.108 0.044 155
18 Syria 3.184 0.068 157
19 Yemen 3.262 0.002 159
20 Sudan 3.323 0.02 161
REGIONAL
AVERAGE
2.377 0.004
The Middle East and North Africa (MENA) remains the least
peaceful region in the world for the tenth consecutive year. It
recorded a small deterioration in peacefulness over the past
year, as its average GPI score deteriorated by 0.17 per cent. Four
of the ten least peaceful countries on the 2025 GPI are in the
MENA region.
The largest fall in peacefulness occurred on the Ongoing
Conflict domain, which deteriorated by 0.8 per cent. There were
deteriorations on the deaths from internal conflict, deaths from
external conflict, and internal conflicts fought indicators, driven
by the ongoing conflicts in Palestine, Sudan, and Syria and the
associated increase in regional unrest. Tensions in the region
remain extremely high as of early 2025. The Militarisation
domain recorded a small improvement, although there was a
significant deterioration on the military expenditure indicator,
with the MENA region having the highest average level of
relative military expenditure in the world.
The most notable falls in peacefulness in the region occurred
because of the war in Gaza that erupted after the Hamas attack
in Israel on 7 October 2023. Latest estimates suggest that over
63,750 people have been killed in this conflict, although some
estimates suggest that the death toll is likely to be far higher.6
The conflict has also thrown the entire region into crisis, with
Syria, Iran, Lebanon and Yemen all becoming involved to
varying degrees. In early March 2025, all humanitarian aid was
blocked from entering Gaza, exacerbating the already dire
humanitarian crisis.7
18.
16
Global Peace Index2025 | Measuring peace in a complex world
Qatar is the most peaceful country in the MENA region, and the
27th
most peaceful country overall. It is one of the three countries
in the region that is ranked among the 50 most peaceful
countries in the world. However, it recorded a 0.99 per cent
deterioration in overall peacefulness in the past year. This was
driven by a deterioration on the Safety and Security domain,
because of deteriorating political instability. Political
uncertainty increased after a constitutional referendum
abolished legislative elections.
Sudan is the least peaceful country in the region and ranks as
the third least peaceful country overall on the 2025 GPI.
Peacefulness in Sudan fell by 0.54 per cent over the past year,
owing to substantial deteriorations on the nuclear and heavy
weapons, refugees and IDP and internal conflicts fought
indicators. Additionally, violent crime deteriorated largely due to
the ongoing civil war between the Sudanese Armed Forces (SAF)
and the paramilitary Rapid Support Forces (RSF). Conflict broke
out in April 2023 between the SAF and RSF after a plan was
proposed to dissolve the RSF and integrate it with the army. The
armed conflict has led to the displacement of millions of people,
with an estimated 6,800 deaths from internal conflict recorded
in 2024. The increasing civil unrest and lawlessness has meant
that humanitarian agencies and multilateral organisations are
unable to safely operate in most locations, including in the
capital city of Khartoum.
Saudi Arabia recorded the largest improvement in peacefulness
in the region, with improvements recorded across all three GPI
domains. The primary driver of the improvement in peacefulness
was a decrease on deaths from internal conflict, which recorded
an improvement of 100 per cent. Political stability improved as
the government’s Vision 2030 reforms and diplomatic outreach
strengthened governance and regional cooperation. The country
has restored ties with Lebanon and Iran, and it has served as a
mediating party in some international conflicts amid the
substantial geopolitical tensions in the region.
Syria recorded the largest deterioration in peacefulness in the
region and ranks in the ten least peaceful countries in the world
on the 2025 GPI. The decline in peacefulness over the past year
was driven by deteriorations on the Ongoing Conflict domain
and the Safety and Security domain. Violent demonstrations
significantly increased, as did deaths from internal conflict.
Recent figures estimate that since 2011, more than 14 million
Syrians have fled the country and 70 per cent of the population
needs humanitarian aid. In December 2024, the government of
Bashar al-Assad was overthrown after 24 years of rule. Since
then, more than one million Syrians have returned to Syria.8
A
new transitional government was sworn into power at the end of
March 2025.9
During the change of government, tensions rose
and fighting broke out over control of the Syria-Lebanese border,
but a ceasefire agreement between the two parties was reached
on 17 March 2025.10
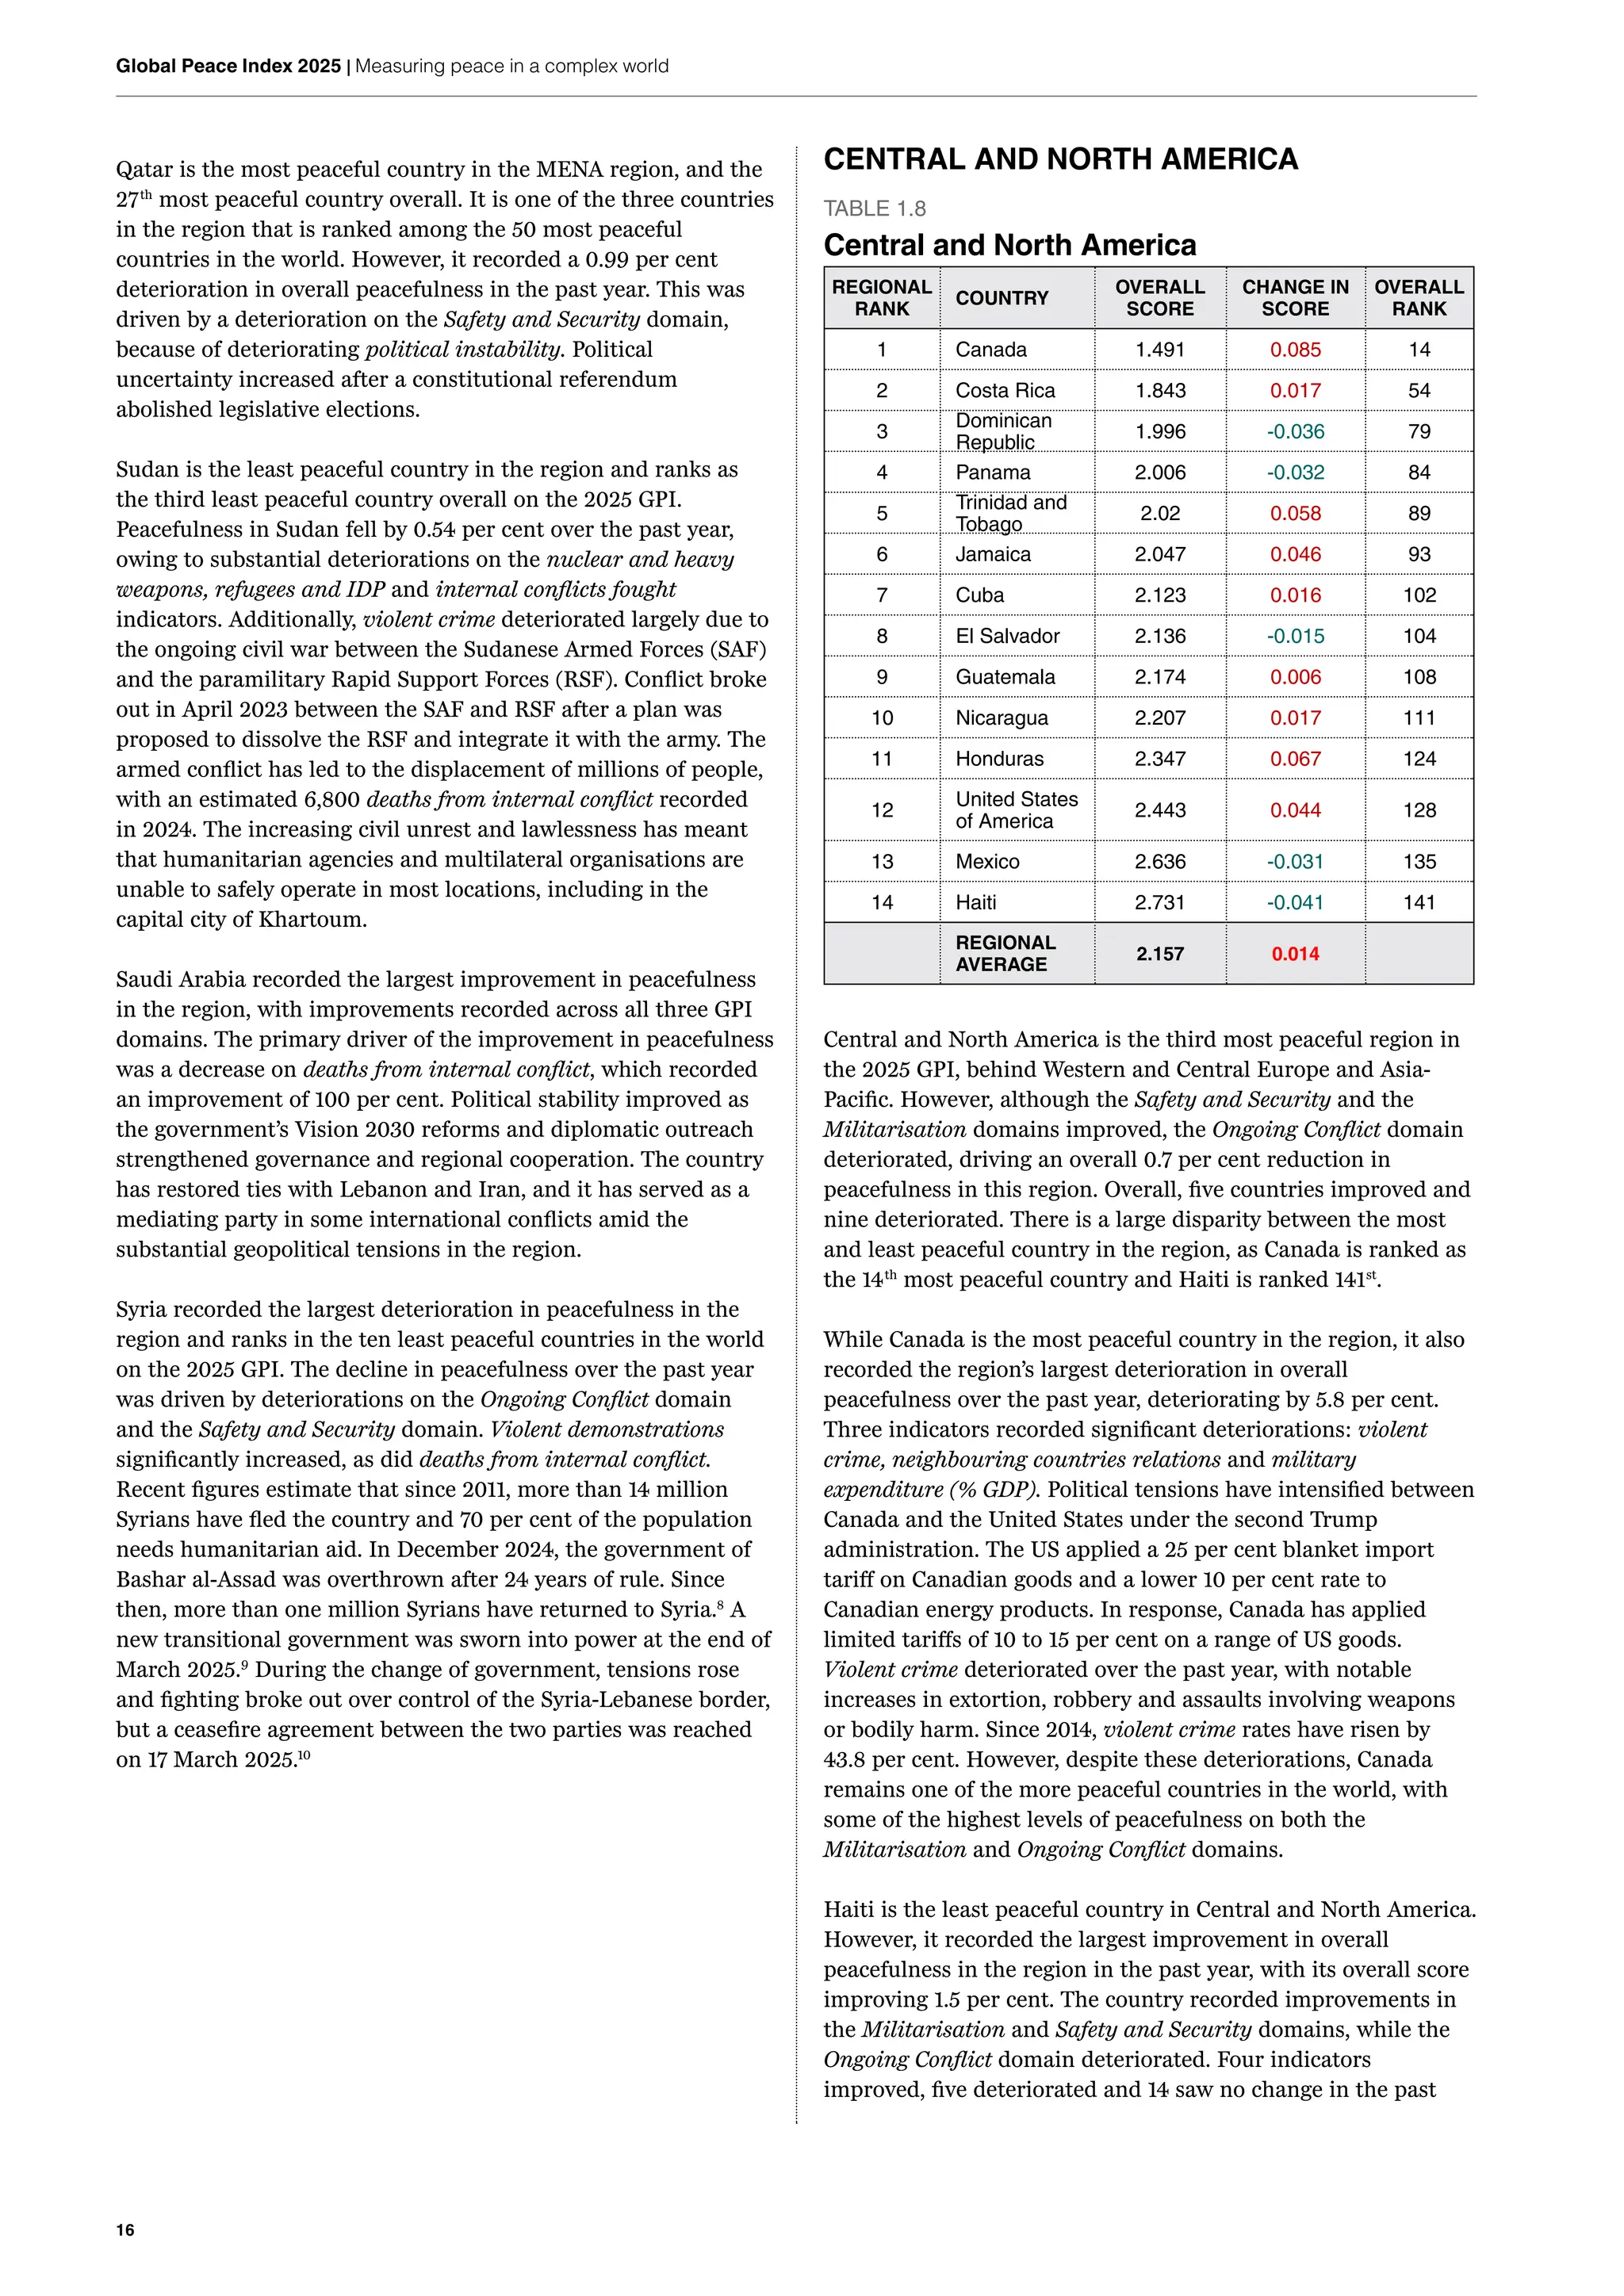
CENTRAL AND NORTH AMERICA
TABLE 1.8
Central and North America
REGIONAL
RANK
COUNTRY
OVERALL
SCORE
CHANGE IN
SCORE
OVERALL
RANK
1 Canada 1.491 0.085 14
2 Costa Rica 1.843 0.017 54
3
Dominican
Republic
1.996 -0.036 79
4 Panama 2.006 -0.032 84
5
Trinidad and
Tobago
2.02 0.058 89
6 Jamaica 2.047 0.046 93
7 Cuba 2.123 0.016 102
8 El Salvador 2.136 -0.015 104
9 Guatemala 2.174 0.006 108
10 Nicaragua 2.207 0.017 111
11 Honduras 2.347 0.067 124
12
United States
of America
2.443 0.044 128
13 Mexico 2.636 -0.031 135
14 Haiti 2.731 -0.041 141
REGIONAL
AVERAGE
2.157 0.014
Central and North America is the third most peaceful region in
the 2025 GPI, behind Western and Central Europe and Asia-
Pacific. However, although the Safety and Security and the
Militarisation domains improved, the Ongoing Conflict domain
deteriorated, driving an overall 0.7 per cent reduction in
peacefulness in this region. Overall, five countries improved and
nine deteriorated. There is a large disparity between the most
and least peaceful country in the region, as Canada is ranked as
the 14th
most peaceful country and Haiti is ranked 141st
.
While Canada is the most peaceful country in the region, it also
recorded the region’s largest deterioration in overall
peacefulness over the past year, deteriorating by 5.8 per cent.
Three indicators recorded significant deteriorations: violent
crime, neighbouring countries relations and military
expenditure (% GDP). Political tensions have intensified between
Canada and the United States under the second Trump
administration. The US applied a 25 per cent blanket import
tariff on Canadian goods and a lower 10 per cent rate to
Canadian energy products. In response, Canada has applied
limited tariffs of 10 to 15 per cent on a range of US goods.
Violent crime deteriorated over the past year, with notable
increases in extortion, robbery and assaults involving weapons
or bodily harm. Since 2014, violent crime rates have risen by
43.8 per cent. However, despite these deteriorations, Canada
remains one of the more peaceful countries in the world, with
some of the highest levels of peacefulness on both the
Militarisation and Ongoing Conflict domains.
Haiti is the least peaceful country in Central and North America.
However, it recorded the largest improvement in overall
peacefulness in the region in the past year, with its overall score
improving 1.5 per cent. The country recorded improvements in
the Militarisation and Safety and Security domains, while the
Ongoing Conflict domain deteriorated. Four indicators
improved, five deteriorated and 14 saw no change in the past
19.
1
Results
17
year. Haiti hasbeen in a state of crisis since 2021, when
president Jovenel Moïse was assassinated. Rates of violent crime
have soared amid rampant gang activity. However, Haiti's
political instability improved in the past year due to the
establishment of a Transitional Presidential Council in April
2024, to oversee governance until elections in 2026.
Additionally, the UN, led by Kenyan peacekeeping forces, helped
curb escalating gang violence that had previously paralysed
economic activities and displaced over 700,000 people. These
combined efforts have contributed to a modest stabilisation in
Haiti's political landscape.
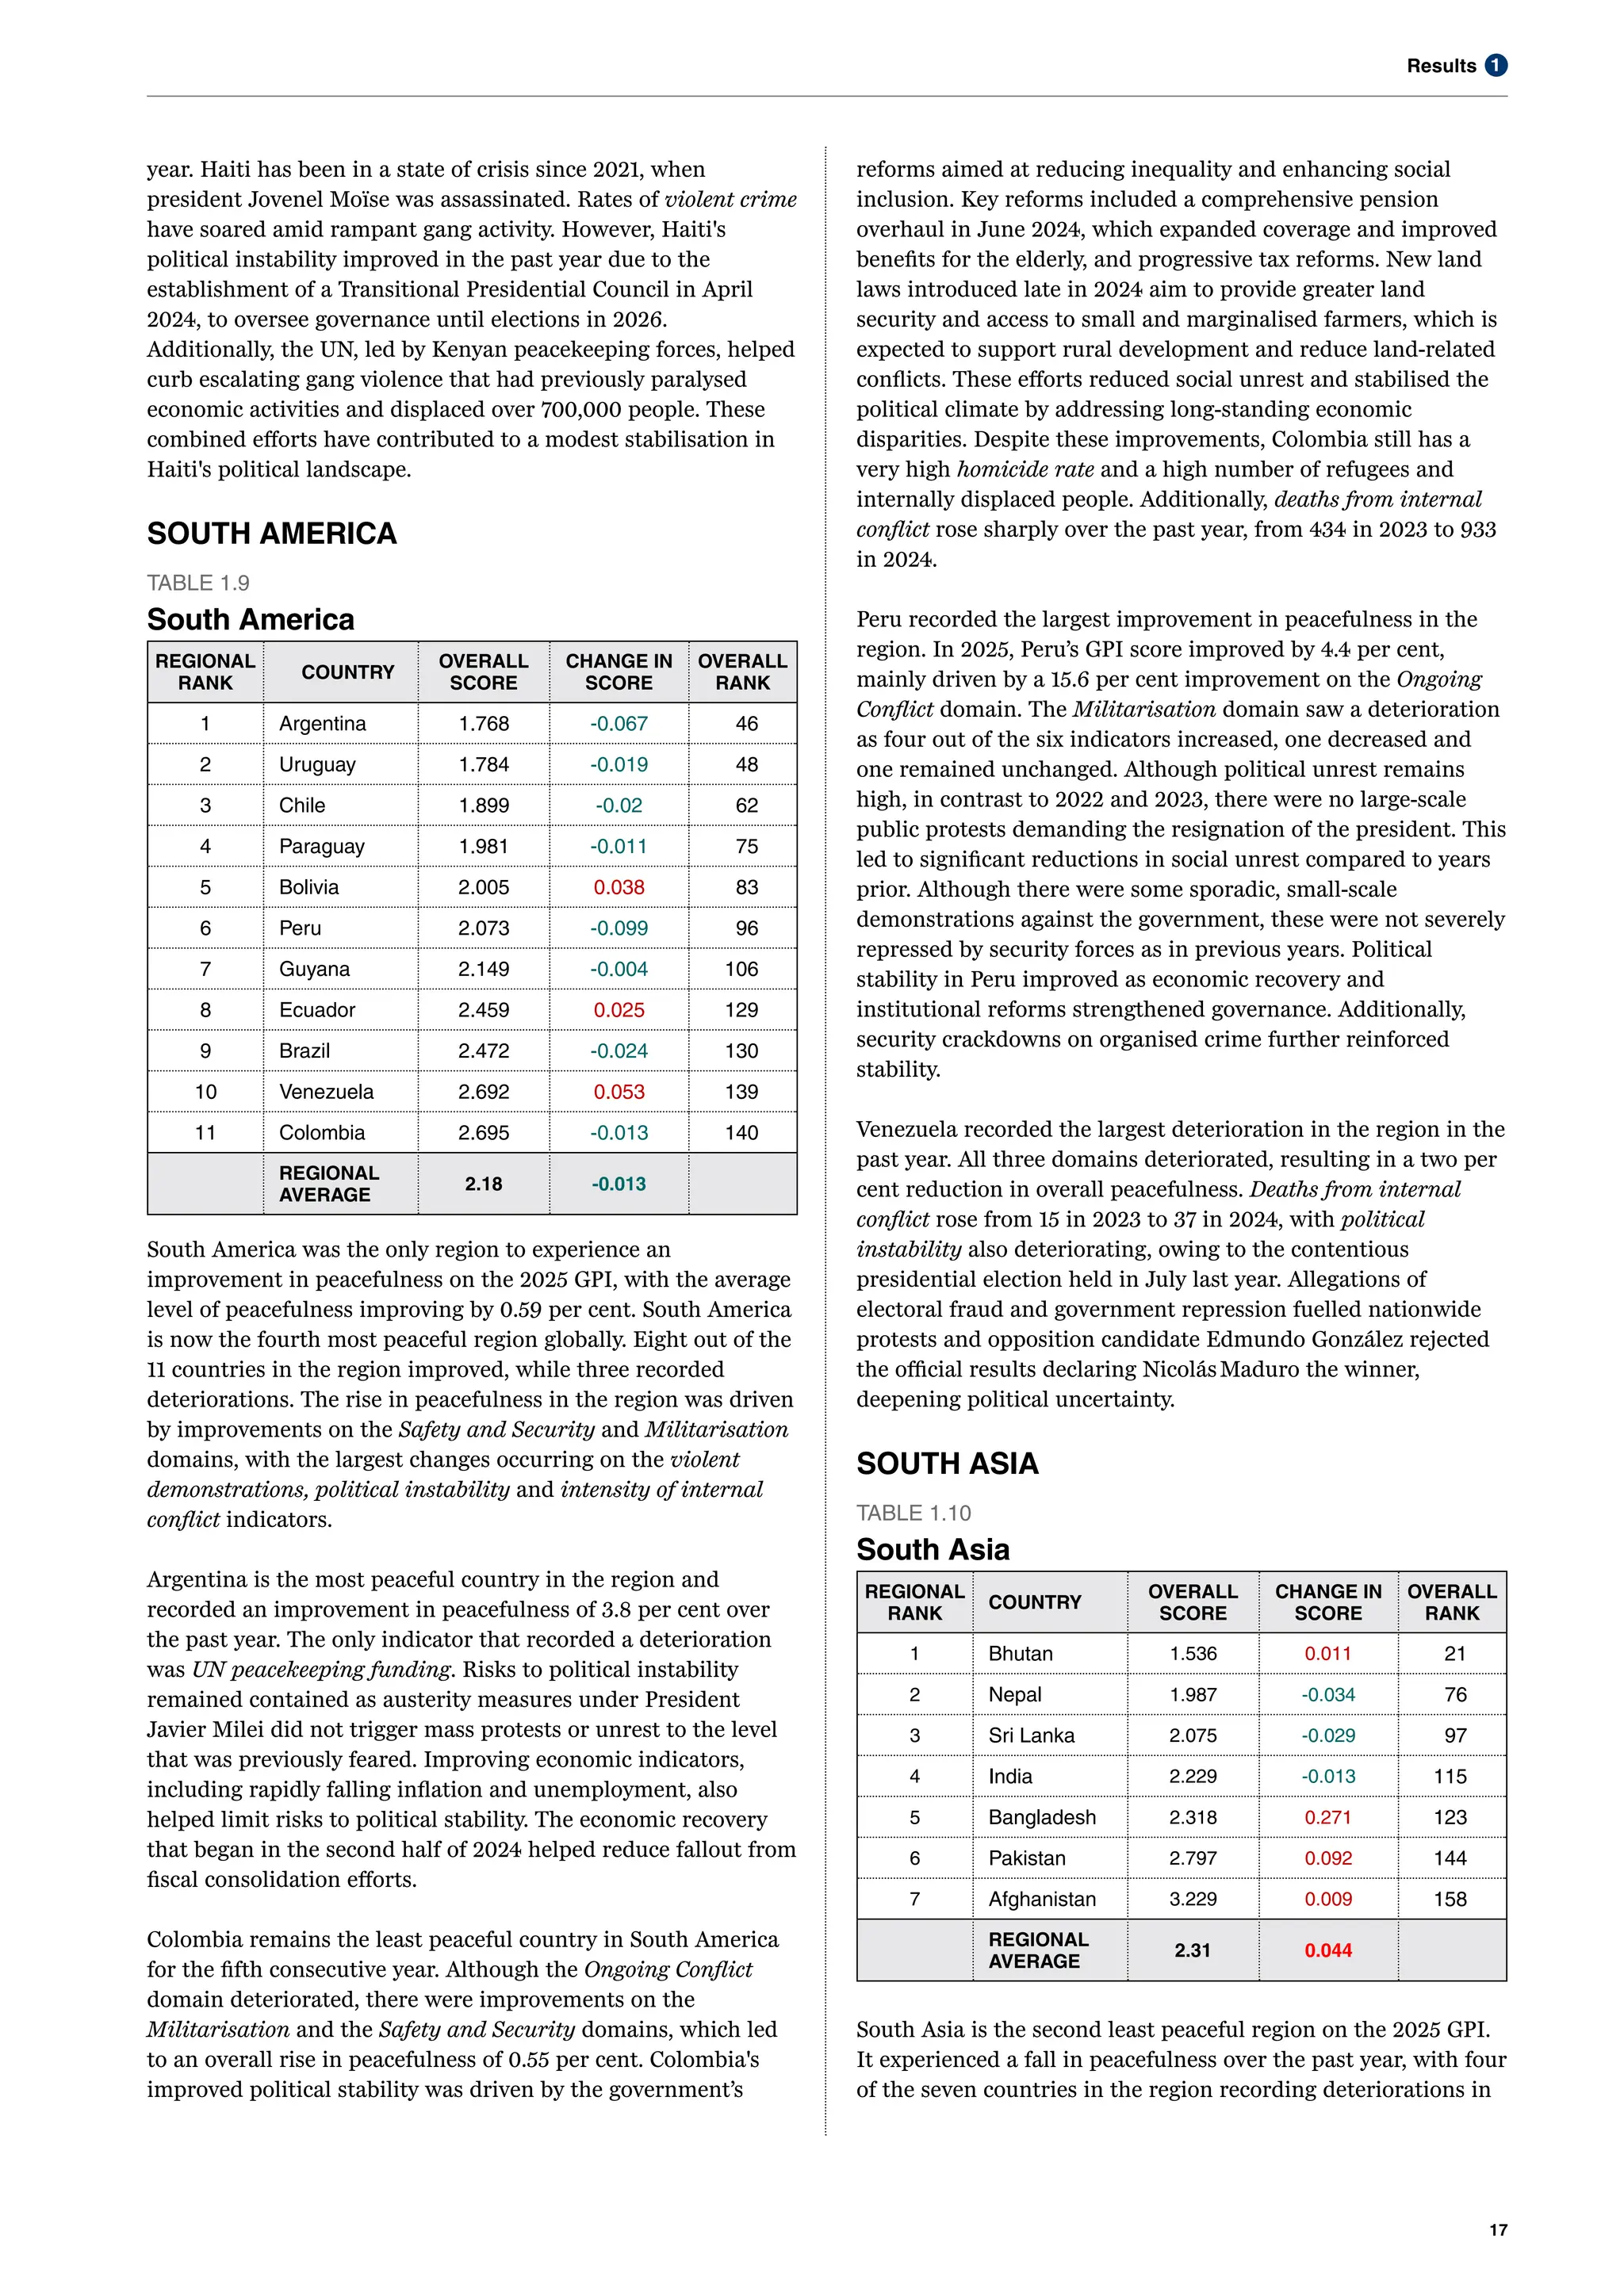
SOUTH AMERICA
TABLE 1.9
South America
REGIONAL
RANK
COUNTRY
OVERALL
SCORE
CHANGE IN
SCORE
OVERALL
RANK
1 Argentina 1.768 -0.067 46
2 Uruguay 1.784 -0.019 48
3 Chile 1.899 -0.02 62
4 Paraguay 1.981 -0.011 75
5 Bolivia 2.005 0.038 83
6 Peru 2.073 -0.099 96
7 Guyana 2.149 -0.004 106
8 Ecuador 2.459 0.025 129
9 Brazil 2.472 -0.024 130
10 Venezuela 2.692 0.053 139
11 Colombia 2.695 -0.013 140
REGIONAL
AVERAGE
2.18 -0.013
South America was the only region to experience an
improvement in peacefulness on the 2025 GPI, with the average
level of peacefulness improving by 0.59 per cent. South America
is now the fourth most peaceful region globally. Eight out of the
11 countries in the region improved, while three recorded
deteriorations. The rise in peacefulness in the region was driven
by improvements on the Safety and Security and Militarisation
domains, with the largest changes occurring on the violent
demonstrations, political instability and intensity of internal
conflict indicators.
Argentina is the most peaceful country in the region and
recorded an improvement in peacefulness of 3.8 per cent over
the past year. The only indicator that recorded a deterioration
was UN peacekeeping funding. Risks to political instability
remained contained as austerity measures under President
Javier Milei did not trigger mass protests or unrest to the level
that was previously feared. Improving economic indicators,
including rapidly falling inflation and unemployment, also
helped limit risks to political stability. The economic recovery
that began in the second half of 2024 helped reduce fallout from
fiscal consolidation efforts.
Colombia remains the least peaceful country in South America
for the fifth consecutive year. Although the Ongoing Conflict
domain deteriorated, there were improvements on the
Militarisation and the Safety and Security domains, which led
to an overall rise in peacefulness of 0.55 per cent. Colombia's
improved political stability was driven by the government’s
reforms aimed at reducing inequality and enhancing social
inclusion. Key reforms included a comprehensive pension
overhaul in June 2024, which expanded coverage and improved
benefits for the elderly, and progressive tax reforms. New land
laws introduced late in 2024 aim to provide greater land
security and access to small and marginalised farmers, which is
expected to support rural development and reduce land-related
conflicts. These efforts reduced social unrest and stabilised the
political climate by addressing long-standing economic
disparities. Despite these improvements, Colombia still has a
very high homicide rate and a high number of refugees and
internally displaced people. Additionally, deaths from internal
conflict rose sharply over the past year, from 434 in 2023 to 933
in 2024.
Peru recorded the largest improvement in peacefulness in the
region. In 2025, Peru’s GPI score improved by 4.4 per cent,
mainly driven by a 15.6 per cent improvement on the Ongoing
Conflict domain. The Militarisation domain saw a deterioration
as four out of the six indicators increased, one decreased and
one remained unchanged. Although political unrest remains
high, in contrast to 2022 and 2023, there were no large-scale
public protests demanding the resignation of the president. This
led to significant reductions in social unrest compared to years
prior. Although there were some sporadic, small-scale
demonstrations against the government, these were not severely
repressed by security forces as in previous years. Political
stability in Peru improved as economic recovery and
institutional reforms strengthened governance. Additionally,
security crackdowns on organised crime further reinforced
stability.
Venezuela recorded the largest deterioration in the region in the
past year. All three domains deteriorated, resulting in a two per
cent reduction in overall peacefulness. Deaths from internal
conflict rose from 15 in 2023 to 37 in 2024, with political
instability also deteriorating, owing to the contentious
presidential election held in July last year. Allegations of
electoral fraud and government repression fuelled nationwide
protests and opposition candidate Edmundo González rejected
the official results declaring NicolásMaduro the winner,
deepening political uncertainty.
SOUTH ASIA
TABLE 1.10
South Asia
REGIONAL
RANK
COUNTRY
OVERALL
SCORE
CHANGE IN
SCORE
OVERALL
RANK
1 Bhutan 1.536 0.011 21
2 Nepal 1.987 -0.034 76
3 Sri Lanka 2.075 -0.029 97
4 India 2.229 -0.013 115
5 Bangladesh 2.318 0.271 123
6 Pakistan 2.797 0.092 144
7 Afghanistan 3.229 0.009 158
REGIONAL
AVERAGE
2.31 0.044
South Asia is the second least peaceful region on the 2025 GPI.
It experienced a fall in peacefulness over the past year, with four
of the seven countries in the region recording deteriorations in
20.
18
Global Peace Index2025 | Measuring peace in a complex world
overall score. All three domains deteriorated, with the largest
change on the Ongoing Conflict domain, with a 4.9 per cent
increase due to none of the indicators in this domain improving
in the past year.
Afghanistan is the least peaceful country in the region, a
position it has held since the inception of the GPI. Afghanistan
ranks as the fifth least peaceful country in the world and has the
lowest ranking globally on the Safety and Security domain. In
the past year, peacefulness in Afghanistan deteriorated by 0.28
per cent. Afghanistan is the only country in the South Asia
region to have the worst possible scores on the access to small
arms, violent crimes, political instability, political terror scale,
refugees and IDPs and military expenditure (% GDP) indicators.
Although the level of conflict in Afghanistan has fallen since the
Taliban came to power, poor governance and humanitarian
crises are fuelling political unrest. In March 2025, the World
Health Organization in Afghanistan warned that funding
shortages may cause 80 per cent of the agency’s health services
there to close by June, exacerbating the health crisis already
present in the country.11
Nepal recorded the largest improvement in overall peacefulness
in South Asia, reversing the deterioration in peacefulness that
was seen in the prior year. The improvement over the past year
was mainly driven by an improvement on the Militarisation
domain, particularly due to a decline on weapons imports and
improved UN peacekeeping funding. Additionally, the terrorism
impact indicator recorded a substantial improvement over the
past year. Nepal has been increasing its focus on
counterterrorism in recent years, conducting joint military
exercises with India from late December 2024 to early January
2025 that focused on counterterrorism, jungle warfare and
operational skills.12
Bangladesh recorded the largest deterioration in peacefulness of
any country in the region and of any country on the 2025 GPI,
registering a 13 per cent reduction in overall peacefulness. It
recorded deteriorations on all domains, with the largest
occurring on the Ongoing Conflict domain. There were 436
deaths from internal conflicts, as compared to just 12 in the
previous year. Internal conflict in Bangladesh escalated as
student-led protests over government job quotas continued,
despite a Supreme Court ruling reducing them. Bangladesh
experienced a significant escalation in violent crime and
political instability. Attacks on minority communities also
escalated, with over 2,010 incidents recorded in August 2024.
Political violence surged, with an estimated 1,400 deaths linked
to clashes involving security forces and political groups.
Allegations of systematic extrajudicial killings further
undermined public trust in law enforcement. Bangladesh’s
political stability deteriorated in 2024 due to rising risks of
social unrest, opposition fragmentation, and security
crackdowns. Weeks of street protests, an opposition walk-out,
and a ruling-coalition split forced Bangladesh’s president to oust
the prime minister and draft Nobel laureate Dr Muhammad
Yunus as caretaker of an interim government. Yunus must now
pacify feuding parties and student groups, steady an economy
strained by forex shortages and food inflation, and rebuild trust
in a partisan election commission. High living costs and the
interim government’s inaction have fuelled mass protest risks,
while uncertainty over the election timeline has deepened
instability.
India is the largest and most populous country in the South Asia
region and the world. Its overall level of peacefulness improved
by 0.58 per cent over the past year, with nine indicators
improving, nine remaining the same and three deteriorating.
Political instability improved slightly following India's 2024
general elections, with the National Democratic Alliance (NDA)
coalition forming a government headed by Prime Minister
Narendra Modi, despite his Bharatiya Janata Party (BJP) losing
its majority. Modi’s third term and coalition stability reduced
social unrest risks, while troop disengagement with China eased
geopolitical tensions. However, tensions between India and
Pakistan escalated to concerning levels in April 2025, following
a terrorist attack in the disputed Kashmir region that resulted
in the deaths of 25 Indian tourists. This attack falls outside of
the measurement period of the 2025 GPI and will be captured in
next year’s report. Although tensions in the region have been
high in the region since an insurgency began in 1989, the
violence rarely targeted civilians directly.
SUB-SAHARAN AFRICA
TABLE 1.11
Sub-Saharan Africa
REGIONAL
RANK
COUNTRY
OVERALL
SCORE
CHANGE IN
SCORE
OVERALL
RANK
1 Mauritius 1.586 0.023 26
2 Botswana 1.743 -0.011 43
3 Namibia 1.789 -0.066 50
4 The Gambia 1.855 -0.097 55
5 Sierra Leone 1.887 -0.02 57
6 Madagascar 1.895 0.048 59
7 Ghana 1.898 0.004 61
8 Zambia 1.914 0.04 64
9 Senegal 1.936 -0.033 69
10 Liberia 1.939 -0.04 70
11 Malawi 1.955 -0.075 71
12 Tanzania 1.965 0.04 73
13 Angola 1.987 0.061 76
14
Equatorial
Guinea
2.004 -0.077 82
15 Rwanda 2.036 -0.089 91
16 Côte d'Ivoire 2.066 -0.001 94
17 Eswatini 2.094 0.025 99
18 Guinea-Bissau 2.112 0.034 101
19
Republic of the
Congo
2.132 0.035 103
20 Mauritania 2.204 0.08 110
21 Benin 2.211 -0.046 112
22 Uganda 2.217 -0.105 113
23 Zimbabwe 2.223 -0.071 114
24 Gabon 2.238 -0.006 117
25 Guinea 2.253 -0.051 118
26 Lesotho 2.267 -0.031 119
27 Mozambique 2.273 0.059 121
28 Djibouti 2.276 -0.001 122
29 South Africa 2.347 -0.017 124
30 Togo 2.381 0.111 126
31 Kenya 2.392 0.047 127
21.
1
Results
19
32 Eritrea 2.5420.005 132
33 Burundi 2.574 0.113 133
34 Chad 2.593 0.014 134
35 Cameroon 2.683 -0.028 137
36 Ethiopia 2.688 -0.05 138
37 Niger 2.759 0.058 143
38 Nigeria 2.869 0.095 148
39
Central African
Republic
2.912 0.036 150
40 Somalia 2.983 -0.04 151
41 Burkina Faso 3.016 0.046 152
42 Mali 3.061 0.044 154
43 South Sudan 3.117 -0.047 156
44
Democratic
Republic of the
Congo
3.292 0.138 160
REGIONAL
AVERAGE
2.299 0.003
Sub-Saharan Africa recorded a deterioration in peacefulness,
with the average score in the region deteriorating by 0.17 per
cent over the past year. Half of the countries in this region
improved in overall peacefulness while the other half
deteriorated. Three of the ten least peaceful countries in the
world are found in this region. Sub-Saharan African faces
several security crises, most notably the increase in political
unrest and terrorism in the Central Sahel region. Burkina Faso
has the highest terrorism impact in the world, and six of the ten
countries with the highest terrorism impact are in sub-Saharan
Africa.
The Militarisation and Ongoing Conflict domains deteriorated
while the Safety and Security domain saw an improvement over
the past year. Conflicts in the region continued to spill across
national borders, reflected by a deterioration on the external
conflicts fought indicator. In the past five years, 36 of the 44
countries in the region have had some level of involvement in at
least one external conflict.
Mauritius is the most peaceful country in sub-Saharan Africa for
the 18th
consecutive year. It recorded a small deterioration in
overall peacefulness of 1.5 per cent, owing to deteriorations in
the Militarisation and Safety and Security domains. Mauritius
is also the only country in sub-Saharan Africa that has not been
involved in any internal or external conflicts over the past six
years. Mauritius’s political stability improved in the past year
following a smooth transition of power after the opposition’s
landslide victory. The peaceful handover reinforced democratic
institutions, while steady economic growth and a strong tourism
sector further supported stability.
The Democratic Republic of the Congo (DRC) is the least
peaceful country in the region and also recorded the region’s
largest deterioration in overall peacefulness. The DRC ranks in
the five least peaceful countries in the world in the 2025 GPI.
Over the past year, the country recorded deteriorations in all
three GPI domains and an overall reduction of peacefulness of
4.5 per cent. The country is currently engaged in a war with the
March 23 Movement (M23), which is said to be supported by
Rwandan forces. The UN estimates that there are between
3,000-4,000 Rwandan troops currently operating in the DRC,
fighting alongside M23 rebels against government forces.
Uganda recorded the largest improvement in peacefulness in the
region due to improvements in all three domains. The
Militarisation domain recorded a substantial improvement of
11.7 per cent, the highest of the three domains. The deaths from
internal conflict indicator saw a notable improvement; after
having jumped to 74 deaths in 2023, it declined to four in the
past year. A potential reason for this improvement is the
intensified operations against the Allied Democratic Forces
(ADF) by Uganda’s Ministry of Defence.13
WESTERN AND CENTRAL EUROPE
TABLE 1.12
Western and Central Europe
REGIONAL
RANK
COUNTRY
OVERALL
SCORE
CHANGE IN
SCORE
OVERALL
RANK
1 Iceland 1.095 -0.022 1
2 Ireland 1.26 -0.007 2
3 Austria 1.294 -0.003 4
4 Switzerland 1.294 -0.017 4
5 Portugal 1.371 0.022 7
6 Denmark 1.393 0.053 8
7 Slovenia 1.409 0.042 9
8 Finland 1.42 0 10
9 Czechia 1.435 -0.023 11
10 Netherlands 1.491 0.012 14
11 Belgium 1.492 -0.008 16
12 Hungary 1.5 0.019 17
13 Croatia 1.519 0.029 19
14 Germany 1.533 0.044 20
15 Lithuania 1.558 -0.024 22
16 Latvia 1.558 -0.023 22
17 Estonia 1.559 0.021 24
18 Spain 1.578 0.003 25
19 Slovakia 1.609 0.013 28
20
United
Kingdom
1.634 -0.005 30
21 Norway 1.644 0.078 32
22 Italy 1.662 0.014 33
23 Montenegro 1.685 -0.042 34
24 Sweden 1.709 0.067 35
25 Poland 1.713 0.051 36
26 Greece 1.764 0.006 45
27
North
Macedonia
1.799 0.005 51
28 Albania 1.812 0.031 52
29
Bosnia and
Herzegovina
1.895 0.004 59
30 Kosovo 1.908 -0.003 63
31 Serbia 1.914 -0.005 64
32 Cyprus 1.933 0.002 68
33 France 1.967 -0.029 74
REGIONAL
AVERAGE
1.588 0.009
22.
20
Global Peace Index2025 | Measuring peace in a complex world
Western and Central Europe remains the most peaceful region
in the world on the 2025 GPI and is home to eight of the ten
most peaceful countries in the world. However, it recorded a
deterioration in peacefulness of 0.57 per cent over the past year.
Of the 33 countries in the region, 13 improved in peacefulness,
19 deteriorated, and one remained unchanged. The driver of the
fall in peacefulness in this region was a deterioration on the
Militarisation domain. The conflict between Russia and
Ukraine has led to many European countries reassessing their
level of military spending and general combat readiness, with
24 of the 33 countries in this region recording a deterioration
on this domain over the past year. The Ongoing Conflict and
Safety and Security domains both improved slightly.
Iceland remains the most peaceful country in the region and
the world on the 2025 GPI. It recorded a two per cent
improvement in overall peacefulness over the past year as only
one indicator deteriorated: military expenditure (% GDP).
Iceland is the most peaceful country in the world by a
considerable margin, with the gap in peacefulness between the
first two countries on the 2025 GPI being the same size as the
gap between the second and 10th
ranked countries.
France is the least peaceful country in the region and has the
highest levels of Militarisation of any country in Western and
Central Europe. France’s political stability declined in the past
year due to a fragmented parliamentary election and
government deadlock. President Emmanuel Macron’s
dissolution of the country’s National Assembly led to a hung
parliament, and Prime Minister Michel Barnier’s government
collapsed after a no-confidence vote. Rising public debt and
economic uncertainty further weakened confidence,
exacerbating political instability.
Montenegro recorded the largest improvement in the region,
with its overall score improving by 2.3 per cent in the past year.
This was primarily driven by an improvement in the Safety and
Security domain, as the homicide rate indicator and the
political terror scale indicator improved by 69.7 and 25 per cent,
respectively. The homicide rate is 0.8 per 100,000 people, a
record-low for Montenegro. In October 2024, a regional
initiative to reduce illicit weapons possession – the Western
Balkans Small Arms and Light Weapons (SALW) Control
Roadmap – was endorsed for a second phase following the
success of the original Western Balkans SALW Control
Roadmap, which was adopted in 2018 and set goals to be
achieved by 2024.14
Norway experienced the largest deterioration in peacefulness in
the region, which was primarily caused by a substantial
deterioration on the Militarisation domain. The military
expenditure (% GDP) indicator deteriorated by 31.1 per cent and
the weapons exports indicator deteriorated by 145 per cent. In
2024, the government unanimously adopted a new long-term
defence strategy that will substantially increase the total
defence budget over the next 12 years.15
The Safety and Security
domain saw a slight improvement of 0.08 per cent while all the
indicators in the Ongoing Conflict domain had no change.
Despite its fall in overall peacefulness, Norway has the second
most peaceful ranking in the world on the Safety and Security
domain.
23.
Improvements &
Deteriorations
CHANGE INGPI
SCORE 2024–2025
Azerbajian
0.123
0.271
Bangladesh
95
123
0.260
0.113
Saudi
Arabia
Ukraine
0.209
Uganda
Russia
0.105
0.138
Peru
0.099
0.115
The
Gambia
Myanmar
Democratic
Republic of
the Congo
0.097
2025 GPI RANK
90
162
113
163
96
160
55
154
24.
22
Global Peace Index2025 | Measuring peace in a complex world
Five Largest
Improvements in
Peace
Azerbaijan Rank: 95
Change in Score
2024-2025:
0.123
Change in Rank
2024-2025:
17
Azerbaijan experienced the largest improvement in peacefulness
on the 2025 GPI, with its score improving by 5.6 per cent.
Azerbaijan is now ranked 95th
on the GPI and is at its most
peaceful since 2008. This is the country’s second consecutive
year of improvement in peacefulness. Eleven indicators
improved, two deteriorated and ten recorded no change.
Peacefulness reached a low point in Azerbaijan in 2020, after a
major escalation in the territorial dispute between Azerbaijan
and Armenia over the Nagorno-Karabakh region. More than
seven thousand soldiers and civilians were killed over six weeks
of fighting. A ceasefire deal was reached in November 2020,
brokered by Russia and reinforced by Russian peacekeepers.
However, violations by both countries prompted a short, yet
deadly period of cross-border attacks in 2022. In September
2023, Azerbaijan launched a military offensive in Nagorno-
Karabakh and regained full control of the region. Russian-
mediated peace talks resumed and have continued into 2025,
with a peace treaty reportedly drafted in March 2025.16
Although Azerbaijan’s actions in Nagorno-Karabakh remain
controversial, the halt in fighting has proved effective at
reducing violence in the country. In particular, last year
Azerbaijan recorded significant improvements on the Ongoing
Conflict and Safety and Security domains. Both the number of
deaths from internal conflict and number of deaths from
external conflict fell to zero, with a similarly large improvement
in the violent demonstrations indicator. On the Militarisation
domain, the armed services personnel rate, weapons imports
and UN peacekeeping funding indicators all improved, the latter
two by 13.7 and 9.8 per cent, respectively.
Although violence has subsided following Azerbaijan’s
reclamation of Nagorno-Karabakh, renewed uncertainty over
the state of peace talks may reignite conflict. In March 2025, an
Azerbaijan news outlet accused Armenia of training its reserve
forces in preparation for an offensive.17
Similarly, Azerbaijan saw
deteriorations on the military expenditure and nuclear and
heavy weapons indicators on the Militarisation domain, with
military expenditure rising to 4.9 per cent of GDP. This signals
that the country may be positioning itself to respond to any
threat to its current position.
Saudi Arabia Rank: 90
Change in Score
2024-2025:
0.113
Change in Rank
2024-2025:
14
Saudia Arabia recorded the second largest improvement in
peacefulness on the 2025 GPI, moving up 14 places to rank 90th
.
Its overall score improved by 5.2 per cent, with improvements
on nine indicators, deteriorations on three, and 11 recording no
change. All three GPI domains recorded improvements over the
past year.
The largest improvement was seen on the Militarisation
domain, driven by improvements on the armed services
personnel rate, weapons imports, and UN peacekeeping funding
indicators. The Ongoing Conflict domain recorded a minor
improvement, with deaths from internal conflict, internal
conflicts fought, and external conflicts fought all improving
The Safety and Security domain also recorded an improvement,
largely due to a 22.2 per cent decrease in political instability.
The political landscape in Saudi Arabia has improved as a result
of the government’s Vision 2030 reforms, which aim to increase
economic, social, and cultural diversification. Diplomatic
outreach by Saudi Arabia has also strengthened governance and
regional cooperation. Additionally, it has restored ties with
Lebanon and Iran, and the country has served as a mediating
party in some international conflicts amid the substantial
geopolitical tensions in the region.
Although the Militarisation domain improved as a whole, two
indicators on this domain deteriorated, with military
expenditure and nuclear and heavy weapons indicators
deteriorating by 5.3 and 1.9 per cent, respectively. Military
expenditure as a percentage of GDP in Saudi Arabia is now over
6.5 per cent, the sixth highest level of any country globally.
Uganda Rank: 113
Change in Score
2024-2025:
0.105
Change in Rank
2024-2025:
12
Uganda recorded the third largest improvement in peacefulness
on the 2025 GPI, with its overall score improving by 4.5 per
cent. It moved up 12 places in the rankings and is now ranked
113th
. All three GPI domains improved, with Militarisation and
Ongoing Conflict recording the largest improvements, at 11.7 and
7.2 per cent, respectively.
Within the Militarisation domain, all indicators improved aside
from weapons exports, which showed no change from the year
prior. Notably, the UN peacekeeping funding indicator improved
by 40.5 per cent, while weapons imports improved by 14.5 per
cent.
The improvement on the Ongoing Conflict domain was driven
by a 94.5 per cent decrease in the deaths from internal conflict
indicator. Conflict deaths in Uganda are now at their lowest
level since 2021. The fall in conflict deaths was mirrored by an
improvement on the terrorism impact indicator, which was the
↑
↑
↑
25.
1
Results
23
most improved indicatoron the Safety and Security domain in
the past year. This improvement comes after an 80 per cent
deterioration on the same indicator in 2023, when attacks by
the Allied Democratic Forces (ADF), a rebel group linked to
Islamic State and based in the Democratic Republic of Congo,
resulted in the deaths of 37 students in western Uganda.18
The
homicide rate and violent demonstrations indicators also
recorded improvements over the past year.
Despite improvements on several indicators, Uganda still faces
many challenges in the security and conflict spheres. There
were slight deteriorations on the refugees and IDPs and
perceptions of criminality indicators over the past year, with
over half the population reporting that they do not feel safe
walking alone at night. Furthermore, Uganda’s ongoing military
operations within the Democratic Republic of Congo against the
ADF led to a deterioration on the external conflicts fought
indicator. In March 2025, Uganda also deployed special forces to
South Sudan as the country faces the threat of civil war.19
Peru Rank: 96
Change in Score
2024-2025:
0.099
Change in Rank
2024-2025:
14
Peru recorded the fourth largest improvement in peacefulness
on the 2025 GPI, with its overall score improving by 4.5 per
cent. It moved up 14 places in the rankings and is now ranked
96th
. Both the Ongoing Conflict and Safety and Security
domains improved, while the Militarisation domain
deteriorated. In all, eight indicators improved, eight
deteriorated and seven experienced no change.
Many of Peru’s improvements were linked to a decline in civil
unrest and a reduction in public demonstrations opposing the
government of President Dina Boluarte, which came to power in
2022 following the removal of President Pedro Castillo, who had
attempted to dissolve the national congress. In the past year, the
violent demonstrations indicator improved by 22 per cent.
The political instability indicator also improved by 13.6 per cent
as a lack of major unrest allowed President Boluarte to
consolidate her presidency. Additionally, economic recovery and
institutional reforms strengthened governance, while security
crackdowns on organised crime further reinforced stability.
Other indicators on the Safety and Security domain that
improved were terrorism impact, which decreased by 24.8 per
cent, and the homicide rate, and police rate, which registered
smaller improvements.
The fall in political unrest also led to an improvement on the
Ongoing Conflict domain. Deaths from internal conflict fell from
12 in 2023 to zero in 2024, marking the first year since 2019 that
no conflict deaths were recorded.
However, increasing Militarisation remains a concern, as the
domain registered an overall deterioration of 1.4 per cent. Four
out of six indicators deteriorated in 2024, with UN peacekeeping
funding recording the largest deterioration. Other indicators to
deteriorate were nuclear and heavy weapons, military
expenditure and weapons imports.
The Gambia Rank: 55
Change in Score
2024-2025:
0.097
Change in Rank
2024-2025:
16
The Gambia recorded the fifth largest improvement in
peacefulness on the 2025 GPI, rising 16 places to rank 55th
. Its
overall score improved by 4.9 per cent, with improvements in six
indicators, deteriorations on two, and 15 recording no change.
The Militarisation and Safety and Security domains both
improved by over seven per cent, and The Gambia is now the
fourth most peaceful country in sub-Saharan Africa, behind only
Mauritius, Botswana, and Namibia.
The improvement on the Safety and Security domain was driven
by an improvement on The Gambia’s score on the political
terror scale. The Gambia is now the only country in sub-Saharan
Africa with a perfect score of 1 on the Political Terror Scale,
which indicates a secure rule of law, with political violence
being exceptional or rare. The level of violent demonstrations
also fell, despite a deterioration on the political instability
indicator.
The deterioration on the Ongoing Conflict domain was driven
solely by the external conflicts fought indicator, which
deteriorated by 12.7 per cent. The deterioration in this indicator
is driven by The Gambia’s proximity to the Casamance region of
Senegal, which has been contested by separatist rebels since the
1980s. In recent years, violence near The Gambia’s border has
displaced thousands of people internally and prompted
heightened border security operations by The Gambian Armed
Forces.20
However, despite strong economic growth, averaging over five
per cent for the last three years, The Gambia still faces
significant challenges. Political instability deteriorated over the
past year, largely a result of civil unrest fuelled by discontent
over poverty, mismanagement and rising living costs. Delays in
more political reforms, lingering insecurity from a failed 2022
coup and regional instability further heightened tensions, while
increasing utility prices and inflation exacerbated economic
hardship.
↑
↑
26.
24
Global Peace Index2025 | Measuring peace in a complex world
Five Largest
Deteriorations in
Peace
Bangladesh Rank: 123
Change in Score
2024-2025:
0.271
Change in Rank
2024-2025:
33
Bangladesh experienced the largest deterioration in
peacefulness on the 2025 GPI, falling 33 places to 123rd
, its
lowest ranking since the inception of the index. After
experiencing an improvement in 2023, Bangladesh’s overall
score deteriorated by 13.2 per cent in 2024. The primary driver
of the fall in peacefulness was wide-scale civil unrest, followed
by a subsequent government crackdown that resulted in deadly
violence. In August 2024, amid demonstrations calling for the
end of Prime Minister Sheikh Hasina’s rule, she resigned and
fled the country. An interim government was established;
however, the power transition remains fragile in the face of
competing interests between opposition groups, student
protesters and the military.
Bangladesh recorded significant deteriorations in the Safety
and Security domain, driven by the violent demonstrations and
political instability indicators because of large-scale student
protests over dissatisfaction with the Hasina government. The
government's response was marked by severe crackdowns
involving security forces and affiliated groups, leading to
widespread violence and allegations of extrajudicial killings and
forced disappearances. Estimates of the death toll vary, with the
Ministry of Health reporting over 1,000 fatalities, while the
UN's Office of the High Commissioner for Human Rights
estimates around 1,400 deaths.
The unrest over the last year also led Bangladesh’s score on the
Ongoing Conflict domain to deteriorate by nearly 22 per cent,
with significant deteriorations recorded in the deaths from
internal conflict, internal conflicts fought and intensity of
internal conflict indicators. The deaths from internal conflict
indicator deteriorated by over 3,500 per cent in 2024, with 436
conflict deaths recorded over the past year.
The Militarisation domain recorded a 14.3 per cent
deterioration over the past year. This was driven by
deteriorations on the UN peacekeeping funding, nuclear and
heavy weapons, and armed services personnel rate indicators.
However, two indicators in this domain registered
improvements, with weapons imports falling by 52 per cent and
military expenditure falling slightly, from 0.81 to 0.76 per cent
of Bangladesh’s GDP.
Ukraine Rank: 162
Change in Score
2024-2025:
0.260
Change in Rank
2024-2025:
3
Ukraine recorded the second largest deterioration in
peacefulness on the 2025 GPI. Its overall score deteriorated by
8.2 per cent, resulting in a drop of three places to a rank of
162nd
. This is the country’s worst rank in the history of the GPI.
The Ongoing Conflict domain recorded the largest deterioration
of the three domains, with internal conflicts fought and deaths
from external conflicts both deteriorating significantly. There
was also a significant deterioration on the Safety and Security
domain, largely driven by notable increases on the political
terror scale and terrorism impact indicators.
The primary driver of the deterioration in peacefulness in
Ukraine is the ongoing war with Russia. Unsurprisingly, the
impact of the war has led to a large increase in Militarisation.
Over the past year, Ukraine’s score on the weapons imports
indicator deteriorated by 70 per cent, while military
expenditure as a percentage of GDP has increased from 2.1 per
cent at the start of the war, to an estimated 15.4 per cent in
2024.
Ukraine’s score on the Ongoing Conflict domain deteriorated for
the fourth consecutive year. The past year marked the first
major offensive of Ukrainian troops into Russian territory, with
the onset of the Kursk offensive in August 2024. As a result of
this offensive, Ukraine’s score on the external conflict deaths
indicator deteriorated significantly.
Outside of its immediate impact on the Ongoing Conflict and
Militarisation domains, the war in Ukraine has also had a
significant impact on measures of Safety and Security. Violent
crime and organised crime have increased significantly, with
arms trafficking, gang-related violence and reports of domestic
violence all surging over the past year. The proliferation of
firearms from the conflict zone contributed to these trends,
exacerbating public safety concerns.
Russia Rank: 163
Change in Score
2024-2025:
0.209
Change in Rank
2024-2025:
2
Russia recorded the third largest deterioration of any country
on the 2025 GPI, with its overall score deteriorating by 6.5 per
cent. Russia fell two places in the rankings and is now the least
peaceful country on the GPI. The primary driver of the
deterioration in peacefulness in Russia was the ongoing war
with Ukraine, whose impact was reflected in significant
deteriorations on the Ongoing Conflict and Safety and Security
domains, which deteriorated by 13.4 per cent and 4.6 per cent,
respectively.
On the Ongoing Conflict domain, both the internal conflicts
fought and deaths from internal conflict indicators deteriorated
↑
↑
↑
27.
1
Results
25
significantly, with thelatter worsening by over 3,600 per cent.
These deteriorations were the result of the initiation of the
Kursk offensive by Ukrainian forces in August 2024, marking
the first significant offensive taking place within Russia’s
borders. Estimates vary as to the total number of Russian
fatalities from the war in Ukraine, with latest estimates
suggesting that over 170,000 soldiers have been killed over the
past three years, with an additional 600,000 injured.21
Russia also recorded significant deteriorations on several Safety
and Security indicators. There was a strong deterioration on the
violent demonstrations indicator. In January 2024, a
demonstration was held in the region of Bashkortostan in
response to the arrest and imprisonment of a local indigenous
activist. Police responded aggressively, using tear gas and
batons to break up the crowd. This protest was reported as the
largest since anti-war demonstrations following the invasion of
Ukraine in 2022.22
The terrorism impact indicator also deteriorated over the past
year, with Russia experiencing the world’s fourth most deadly
terrorist attack of 2024. In March 2024, members of the
terrorist group Islamic State Khorasan Province (ISK) attacked
Crocus City Hall near Moscow, opening fire on civilians and
detonating explosives. The attack caused a roof collapse and a
fire, killing 133 and injuring 140.23
Just under 4,000 people were killed in violent armed conflict in
the country over the past year.
The high level and number of armed conflicts in the DRC has
had a significant impact on several indicators on the Safety and
Security domain, with refugees and IDPs, violent
demonstrations, and terrorism impact all deteriorating over the
past year. A report from November 2024 estimates that since
2022 nearly seven million people in the DRC have been
internally displaced due to the conflict, one of the highest
numbers of IDPs globally.24
Democratic Republic
of the Congo
Rank: 160
Change in Score
2024-2025:
0.138
Change in Rank
2024-2025:
3
The Democratic Republic of the Congo (DRC) experienced the
fourth largest deterioration in peacefulness on the 2025 GPI
dropping three places to rank 160th
. Its overall score
deteriorated by 4.4 per cent, with all three domains
deteriorating over the past year. The Militarisation domain
experienced the largest deterioration, owing to increases on
four out of the six indicators in this domain, with weapons
imports recording the most significant deterioration.
The decline in peacefulness in the DRC was driven by the
current war between government forces and March 23
Movement (M23), a Rwandan-backed rebel group led by ethnic
Tutsis. The conflict escalated significantly in 2022, following
renewed clashes between M23 and Congolese armed forces,
prompting accusations by the DRC and international observers
of active support for M23 from neighbouring Rwanda. M23 now
controls significant territory in North and South Kivu. The
situation has led to severe humanitarian crises, with millions
displaced internally, and regional tensions have intensified
amid international efforts aimed at negotiating peace and
stabilising the region.
The UN estimates that there are between 3,000-4,000 Rwandan
soldiers currently operating in the DRC, fighting alongside M23
rebels. The presence of foreign troops has led to a 25 per cent
deterioration on the neighbouring countries relations indicator,
while deaths from internal conflict also deteriorated in 2024.
Myanmar Rank: 154
Change in Score
2024-2025:
0.115
Change in Rank
2024-2025:
3
Myanmar recorded the fifth largest deteriorations in
peacefulness on the 2025 GPI, with its overall score
deteriorating by four per cent. This deterioration marks a
strong reversal from the previous year when Myanmar recorded
one of the largest improvements in peacefulness in the world.
Myanmar is now ranked 154th
on the index and registered
deteriorations in all three GPI domains. It has the lowest levels
of peacefulness of any country in the Asia-Pacific region.
The decline in peacefulness was largely a result of the ongoing
civil war between the ruling military junta and a coalition of
pro-democracy fighters and allied ethnic minority groups. The
impact of this conflict is reflected in the 5.9 per cent
deterioration on the Safety and Security domain, with the
violent crime, refugees and IDPs, and political instability
indicators all deteriorating significantly.
Political stability deteriorated in the past year with the erosion
of junta control and unrest over the reinstatement of forced
conscription. Moreover, a series of natural disasters fuelled
mass internal displacements, while political turmoil
complicated relief efforts. An earthquake that struck in March
2025 has led to over 3,700 confirmed deaths and thousands
more injured or missing. The disaster's impact has been
exacerbated by the ongoing civil conflict, particularly in
hard-hit areas like Sagaing and Mandalay. Access to affected
regions has been severely restricted due to damaged
infrastructure, military checkpoints, and the junta's control
over aid distribution, with assistance often withheld from
opposition-held territories.25
Over 5,000 civilian deaths have been reported since the 2021
coup, including 2,414 between April 2023 and June 2024 alone.
In 2024, violent crime in Myanmar remained elevated due to
civil unrest and armed conflict. There have been reports of
government troops carrying out beheadings, gang rapes and
torture against civilians.
↑
↑
28.
26
Global Peace Index2025 | Measuring peace in a complex world
2025 Peace and Conflict Spotlight:
The Integration and Trade-offs for
European Defence Spending
• Many European countries are increasing military
expenditure as a result of the war in Ukraine. However,
raw military expenditure is not the most pressing issue.
• Europe is undergoing rising social tensions and rising
distrust in its institutions. As more public funds are diverted
from employment, healthcare and education toward
defence expenditure, the risk of further exacerbating these
tensions rises.
• Europe’s real defence challenge lies in the absence of integration.
Despite collectively outmatching Russia, European forces are
hindered by fragmentation.
• Europe’s current military expenditure is almost four times that of
Russia, but its combined military capacity is only one third higher.
• Without unified strategic vision and command systems to direct
integrated military capabilities, Europe’s defence potential will
remain unrealised. The efficiency and integration of its fighting
forces are currently more important than increasing its absolute
level of military expenditure.
Europe’s security environment is undergoing a profound
transformation. In response to Russia’s invasion of
Ukraine and diminishing US strategic focus on the
continent, European nations are increasingly diverting
funds from productive sectors of the economy such as
education, healthcare, business development and
infrastructure, towards military expenditure and defence
buildup. This is not necessarily unjustified. However, IEP
analysis finds that the primary issue for Europe is less
about expenditure and more about coordination. That is
to say, the continent should be less concerned about
increasing spending and more focused on effectively
overcoming its structural fragmentation in its defence
forces to build cohesive and efficient defence capabilities.
Focusing disproportionately on military expenditure
could undermine the very stability that defence aims to
protect. Security encompasses both military capability
and broader societal cohesion, economic opportunity and
public trust in institutions. A militarised Europe that fails
to address these internal pressures may risk undermining
its own security if internal pressures are not addressed
alongside external issues, which would in turn sap
political resolve to meet common external threats. A
greater focus on a country's international security can
come at the expense of its domestic stability and security.
At face value, Europe appears more militarily capable
than Russia. NATO members in Europe outspend Russia
on defence by a large margin. But this comparison, often
illustrated using market exchange rates, obscures
important realities. First, such figures do not consider
purchasing power parity (PPP). In countries like Russia,
where personnel and administrative costs are lower, a
dollar can buy significantly more than it can in advanced
economies. Western defence budgets, particularly in Europe,
often allocate a substantial portion to salaries, pensions and
other non-combat costs. As a result, the nominal advantage in
spending by Europe may not reflect the real disparity in effective
military spending and investment. It is worth noting that the
values reported here reflect realised military spending and
exclude long-term increases announced by European countries
since the start of the Russia–Ukraine war in 2022 – many of
which have yet to materialise.
Spending, however, is only part of the equation. What truly
matters is how efficiently resources are translated into usable
military power. IEP’s 2024 report, Contemporary Trends in
Militarisation, estimated real military capability through a
framework that evaluates both the quantity and quality of a
country's military assets, along with battlefield experience and
combat readiness of its armed forces. When seen through this
lens, the gap between Russia and the combined European NATO
members is far narrower than spending figures suggest. Given its
involvement in the largest conflict in Europe since World War II,
Russia's battlefield experience and combat readiness surpass
those of any European NATO member.
The Russian threat is real and no individual European country
comes close to Russia's military capability. Even France and the
United Kingdom, Europe's two most capable militaries, each
have less than a third of Russia's overall capacity. Russia has
also slightly increased its overall military capability since the
beginning of the Ukraine war in 2022. Over the past three years,
it has lost a considerable portion of its armoured vehicles, a
large number of fixed-wing and rotary-wing aircraft, and more
than half of its Black Sea naval fleet. Its ability to recover from
these losses highlights a massive diversion of funds toward
military expenditure and a sustained commitment to
maintaining an outsized military force.
29.
1
Results
27
FIGURE 1.4
Military expenditurevs military capability
While European NATO members significantly outspend Russia on military expenditure, the gap is much narrower in
terms of real military capabilities.
TABLE 1.13
Military capability index: Russia vs
European NATO members
Europe’s two largest military powers, France and the
United Kingdom, lag well behind Russia in terms of
military capability.
Country Military Capability Index
Russia 84,503
France 25,468
United Kingdom 25,457
Türkiye 13,291
Italy 11,315
Germany 9,120
Rest of European NATO Members 37,996
400
300
MILITARY
EXPENDITURE
(2023
USD,
BILLIONS)
Military Spending
200
100
0
Military Capabilities
125
100
MILITARY
CAPABILITIES
INDEX
(,000)
75
50
25
0
Source: IEP
European NATO Members Russia
The major question for Russia is the sustainability of these
expenses. Russia’s GDP declined by 12 per cent to $2 trillion
nominally as the economy pivoted to a war economy. When
measured in PPP, the economy is estimated to remain flat at $6
trillion between 2022 and 2024. The combined economies of
France, the United Kingdom, Italy and Germany are $17.5
trillion in PPP, nearly three times as large. Over the longer term
it may become an economic war of attrition as Russia consumes
more of its internal economy to prop up its war economy.
Europe’s real challenge lies in the absence of integration.
Despite collectively outmatching Russia, European forces are
hindered by fragmentation. Defence policies, procurement
systems and command structures remain predominantly
national, leading to large-scale inefficiencies. NATO has long
depended on American leadership, intelligence sharing and
logistical infrastructure. With uncertainty around continued US
commitment, European nations face mounting pressure to
coordinate their defence capabilities. Yet without unified
strategic vision and an integrated command, Europe’s defence
potential will remain unrealised. The efficiency and integration
of its fighting forces are currently more important than
increasing its absolute level of military expenditure.
Finally, nuclear deterrence remains a critical gap. Currently
Russia has around 1,700 active nuclear warheads, while France
and the United Kingdom have about 400. As both arsenals are
enough to devastate the planet many times over, expanding
nuclear arsenals is not a viable solution. The most pressing
question is not one of capability, but of intent – whether either
side would be willing to deploy such weapons tactically.
Complicating matters further are the socioeconomic trade-offs
of increased defence spending. Allocating more funds to the
military often means diverting resources from essential areas
like business support, health, education and welfare, or
increasing public debt and taxation. Europe is already
grappling with low productivity growth, rising costs of
living and the surge of populist movements that thrive on
economic discontent. Escalating military budgets in this
context risks fuelling societal divides.
Europe's current push toward greater militarisation is not
unwarranted, but it must be strategic. Simply increasing
budgets will not address the most pressing issues: lack of
integration and the political-economic risks of neglecting
domestic priorities. For Europe to truly strengthen its
internal and external security, it must focus on building an
integrated defence force while carefully balancing military
needs with the wellbeing of its citizens.
30.
Eight of theten largest
weapons exporters on a per
capita basis are Western
democracies including France,
Sweden, Italy, the Netherlands,
Germany, and Norway.
More countries deteriorated on
violent demonstrations than any
other indicator in the 17 years
with 109 deteriorating and only 23
improving. The rise of technology
was a critical enabler of global
protests and mass mobilisation.
The world has become less
stable in the past 17 years
with substantial increases in
political instability, number
of conflicts, deaths from
conflict, and geopolitical
fragmentation.
Peace has deteriorated
every year since 2014. Over
this period 100 countries
deteriorated while 62 improved.
Two of the three GPI domains
have deteriorated since 2008,
with Ongoing Conflict and Safety
and Security deteriorating
by 17.5 per cent and 2.5 per
cent, respectively. Only the
Militarisation domain improved,
with peacefulness increasing on
that domain by 2.7 per cent.
17.5
2.5
2.7
Ongoing Conflict
Safety & Security
Militarisation
↓
↓
↓
The gap between the most and least peaceful countries keeps growing
with ‘peace inequality’ widening by 11.7 per cent in the past two decades.
The 25 most peaceful countries deteriorated by 0.5 per cent, while the
least peaceful deteriorated by 12.2 per cent.
Even though the Militarisation
domain improved, that
trend has begun to reverse
over the last five years as
many countries respond to
increasing threats and rising
geopolitical uncertainty.
Over 122 million people are now
forcibly displaced. There are now 17
countries where more than five per cent
of the population are either refugees
or have been internally displaced. The
number of people forcibly displaced has
increased by over 185 per cent since
the inception of the GPI.
Conversely, although
the Safety and Security
domain deteriorated,
several indicators
have shown sustained
improvement, most notably
the homicide rate and
perceptions of criminality.
External conflicts fought and internal conflicts
fought had the largest deteriorations. This
reflects not only the spread of conflict around
the world, but the increasing involvement of
external actors in civil conflicts.
Deaths from internal conflict
increased by over 438 per
cent in the past 17 years,
with 75 countries in the GPI
recording at least one conflict
death in the past year.
122
million
28
Global Peace Index 2025 | Measuring peace in a complex world
62 100
Improved Deteriorated
↓
↓
30
Global Peace Index2025 | Measuring peace in a complex world
GPI Trends
The world is considerably less peaceful now than it was in 2008, with the average level of country
peacefulness deteriorating by 5.4 per cent between 2008 and 2025. Over that same period, 94 countries
have become less peaceful, compared to 66 that have improved.
Figure 2.1 highlights the overall trend in peacefulness from
2008 to 2025, as well as the year-on-year percentage changes in
score. Peacefulness has declined year-on-year for 14 of the last
17 years. The deterioration in peacefulness since 2008 was
largely concentrated in four regions: the Middle East and North
Africa (MENA), Central and North America, sub-Saharan Africa,
and South America.
As Figure 2.1 demonstrates, peace has deteriorated every year
since 2014, with 2025 recording the worst result since the
inception of the GPI. In the past 11 years, overall peacefulness
improved in 62 countries while 100 countries experienced
deteriorations. Across the three domains, Safety and Security
improved in 77 countries, Militarisation in 74, and Ongoing
Conflict in 44, meaning that for each of these domains, more
countries deteriorated than improved overall. Of the three most
improved countries since 2014, all saw an improvement of over
18 per cent on the Safety and Security domain. However, all
three of these countries also all experienced deteriorations on
the Militarisation domain.
In the past decade, Egypt is the most improved country, with its
peace score improving by 13.5 per cent since 2014. Egypt is now
ranked 107th
on the GPI after climbing 38 places from a rank of
146th
ten years ago. The domain to experience the largest
improvement in Egypt since 2014 was the Safety and Security
domain, which improved by 21.5 per cent. This was driven by
1.98
2.01
2.04
2.07
2008 2010 2012 2014 2016 2018 2020 2022 2024
GPI
SCORE
-1.0%
-0.5%
0.0%
0.5%
1.0%
2008 2010 2012 2014 2016 2018 2020 2022 2024
%
CHANGE
Source: IEP
FIGURE 2.1
GPI overall trend and year-on-year percentage change, 2008–2025
Peacefulness has declined year-on-year for 14 of the last 17 years.
significant improvements on the perceptions of criminality,
violent demonstrations, and violent crime indicators. The
Ongoing Conflict domain also improved by nine per cent, with
notable decreases on the deaths from internal conflict and
intensity of internal conflict indicators. Despite Egypt’s
improvements on many GPI indicators, not all areas have
improved. There have been continued reports of the
suppression of peaceful dissent, often through arbitrary
detention of critics of the government and of demonstrators.
The second most improved country since 2014 is Greece, with
its overall score improving by 14.5 per cent. Over this period,
the Safety and Security domain improved by 23.5 per cent,
largely due to significant improvements on the violent
demonstrations, violent crime, political instability, and
homicide rate indicators. Greece was one of the countries most
affected by the global financial crisisthat began in 2007. The
crisis exposed the country's pre-existing financial issues, leading
to a deep recession, high unemployment, and a sovereign debt
crisis. Improvements in peace coincided with improvements in
the country’s economic conditions. In recent years Greece has
also made progress in reducing political tensions with Türkiye
by promoting economic ties through trade, investment and
tourism. The improved relations and cooperation efforts have
contributed greatly to Greece’s own political stability.
33.
Trends
31
2
The gap inpeace between the most and least peaceful countries
in the world has widened considerably in the past decade, as
shown in Figure 2.2. Between 2008 and 2025, the average score
for the 25 least peaceful countries deteriorated by 12.2 per cent,
while the average level of peacefulness for the 25 most peaceful
countries deteriorated by just 0.5 per cent.
FIGURE 2.2
Indexed trend in peace for the most and least peaceful countries, 2008–2025
The most peaceful countries are now less peaceful than they were in 2008.
0.98
1.02
1.06
1.10
2010 2015 2020 2025
INDEXED
SCORE
Least Peaceful
Most Peaceful
Source: IEP Calculations
Although the gap between the most and least peaceful countries
remains large, it has not increased over the past few years. Since
2022, the 25 most peaceful countries in the world have
experienced deteriorations in their average level of peacefulness
and are now less peaceful than at any time since 2012, reflecting
the spread of conflict and political unrest across the world over
the last decade.
34.
32
Global Peace Index2025 | Measuring peace in a complex world
Domain Trends
The GPI measures peacefulness across three domains: Safety and Security, Ongoing Conflict, and
Militarisation. Figure 2.3 highlights the indexed trend across these three domains over the past 17 years.
FIGURE 2.3
Indexed trend in peace by GPI domain,
2008–2025
The Ongoing Conflict domain has deteriorated by 17.5 per
cent since 2008.
0.95
1.00
1.05
1.10
1.15
2010 2015 2020 2025
INDEXED
SCORE
Militarisation
Ongoing Conflict
Safety And Security
Source: IEP
While the world has become less peaceful since 2008, there have
been some notable improvements. The average country score on
the Militarisation domain has improved by 2.7 per cent, with
the largest improvements recorded on the armed services
personnel rate and UN peacekeeping funding indicators.
However, the other two GPI domains recorded deteriorations
over this same period. The Safety and Security domain
deteriorated by 2.5 per cent, while the Ongoing Conflict domain
deteriorated by nearly 18 per cent.
Over the last 17 years, the Militarisation domain improved even
as Ongoing Conflict deteriorated. However, since 2022,
Militarisation has been on the rise. After registering its best
score on record in 2022, the Militarisation domain has since
deteriorated by 2.5 per cent. In 2025, three indicators on the
domain improved and three deteriorated.
The deterioration of the Militarisation domain can be attributed
to an increase in military spending by multiple countries in the
face of geopolitical tensions and their resulting threats to
security. For instance, many NATO members are now seeking to
achieve a defence spending target of five per cent of GDP. This
comes after at least 21 of the 32 NATO member countries failed
to commit two per cent of GDP to defence in 2023. Furthermore,
as defence budgets expand, funds are increasingly dedicated to
heavy weapons and advanced military capabilities. Between
2022 and 2025, 69 countries registered deteriorations on the
nuclear and heavy weapons indicator, while 78 countries
increased their weapons imports per capita.
UN Peacekeeping Funding
Homicide Rate
Armed Services Personnel Rate
Perceptions of Criminality
Terrorism Impact
Nuclear and Heavy Weapons
Political Terror Scale
Access to Small Arms
Weapons Exports
Police Rate
Military Expenditure (% GDP)
Incarceration Rate
Deaths from External Conflict
Violent Crime
Weapons Imports
Political Instability
Refugees and IDPs
Intensity of Internal Conflict
Neighbouring Countries Relations
Deaths from Internal Conflict
Violent Demonstrations
Internal Conflicts Fought
External Conflicts Fought
0% 25% 50%
% CHANGE IN AVERAGE SCORE
Source: IEP
Improvement Deterioration
Figure 2.4 shows the average percentage change in score for
each indicator from the 2008 to the 2025 GPI. Of the 23 GPI
indicators, 16 recorded deteriorations while the remaining
seven recorded improvements.
FIGURE 2.4
Percentage change by GPI indicator, 2008–2025
Between 2008 and 2025, the number of GPI indicators that deteriorated was more than double the number that improved.
35.
Trends
33
2
The largest deteriorationswere recorded on the external
conflicts fought and internal conflicts fought indicators, which
deteriorated by 63.5 and 45 per cent, respectively. This change
reflects that the number of active conflicts around the world has
surged, with a concurrent increase in involvement by external
actors. This dynamic is explored in more detail in Section 4.
The violent demonstrations indicator deteriorated by just over
30 per cent, while deaths from internal conflict deteriorated by
17 per cent. There were six indicators in total that recorded a
deterioration of over ten per cent from 2008 to 2025.
Since 2008, 109 countries deteriorated on the violent
demonstrations indicator, while only 29 improved and 23
remained unchanged. This was the highest number of country
deteriorations of any indicator on the index.
All regions in the world except for MENA recorded
deteriorations on the violent demonstrations indicator, with
South Asia experiencing the largest deterioration at 107 per cent.
Across all regions, the country that had the largest deterioration
on the indicator was Bangladesh, due to a recent surge in
violent protests triggered by the reinstatement of a controversial
job quota favouring descendants of veterans of the 1971 war that
led to independence. The reinstatement of this policy comes in
the context of a deep youth unemployment crisis. Student
demonstrations rapidly escalated into nationwide unrest after a
severe government and security crackdown.26
The growing number of violent demonstrations worldwide
between 2008 and 2025 can be attributed to several factors,
including the rise of technology as a critical enabler of global
protests and mass mobilisation. Social media and the internet
facilitate the rapid sharing of information and the airing of
grievances, fuelling collective action at unprecedented speed
and scale. This digital interconnectedness not only amplifies
calls for action but also lowers the barriers to organising protest,
even in regions previously isolated from global protest
movements. Large-scale demonstrations can quickly escalate
into violence when tensions run high or state responses are
repressive or disproportionate.27
Overall, seven GPI indicators have improved since 2008, while
the remaining 16 deteriorated. Of those that improved, only UN
peacekeeping funding recorded a very large change, improving
by over 20 per cent. Three other indicators (homicide rate,
armed services personnel rate, and perceptions of criminality)
recorded moderately large improvements, each improving by
more than five per cent.
SAFETY AND SECURITY
The Safety and Security domain deteriorated by 2.5 per cent
between 2008 and 2025. Of the 11 indicators on this domain,
seven deteriorated and four improved. The largest deterioration
occurred on the violent demonstrations indicator, with 109
countries and seven regions recording overall deteriorations on
this indicator. Average scores on this indicator have deteriorated
by 30.4 per cent globally. Figure 2.5 highlights the trend from
2008 to 2025 for three key Safety and Security indicators.
6.0
6.5
7.0
7.5
2010 2015 2020
HOMICIDE
RATE
HOMICIDE RATE
Source: UNODC, UNHCR, Dragonfly TerrorismTracker
IDPs
Refugees
20M
40M
60M
2010 2015 2020
PEOPLE
(MILLIONS)
REFUGEES AND IDPS
7,000
8,000
9,000
10,000
11,000
2010 2015 2020
DEATHS
TERRORISM DEATHS
FIGURE 2.5
Trends in key Safety and Security indicators, 2008–2025
The homicide rate was the only indicator of Safety and Security that recorded a consistent improvement.
The refugees and IDPs indicator has deteriorated every year
since 2019. The total number of forcibly displaced people in the
world has increased to over 122 million as of mid-2024, up from
42.7 million at the inception of the GPI.28
Two-thirds of all
displaced people originate from just ten countries. As of
mid-2024, over half of all refugees under the UN Refugee
Agency’s mandate come from just four countries: Afghanistan,
Syria, Ukraine, and Venezuela.29
The extent of displacement is
greatest in Syria, where the impact and aftermath of the Syrian
civil war has led to an ongoing humanitarian crisis. 30
Of the over 122 million forcibly displaced people worldwide, 72
million are internally displaced people. In the Gaza Strip, the
estimated number of internally displaced people reached 1.7
million by mid-2024. Most had been forced to flee multiple
times since the conflict that began in October 2023.
The homicide rate indicator had the largest improvement on
the Safety and Security domain, with 122 countries recording
reductions in their homicide rates since 2008. The average
homicide rate across all GPI countries fell from 7.7 to 6 deaths
per 100,000 people over the past 17 years. There are now 40
36.
34
Global Peace Index2025 | Measuring peace in a complex world
countries globally that have a homicide rate of less than one per
100,000 people, and 64 with a rate of less than two per 100,000.
Between 2008 and 2025, the homicide rate improved in all
regions except for South America and Central and North
America. However, in recent years several countries in Central
America have recorded substantial improvement in their
homicide rates, most notably El Salvador.
In the past two decades, El Salvador’s homicide rate first rose
from 65.4 deaths per 100,000 people to an all-time high rate of
108 in 2015, after which it began to fall precipitously, dropping
to 17.3 as of 2021. This decline was substantially accelerated in
2022 by a sweeping crackdown on gang-related violence
instigated by President Nayib Bukele, who declared a state of
emergency and detained over 60,000 gang members and
suspected gang members. Following this, the homicide rate was
again more than cut in half, dropping to 7.8 deaths per 100,000
people in 2022, and then falling to a rate of under 2.5 in 2023
and 2024. This represents one of the largest ever recorded
reductions on the homicide rate and was also associated with a
notable improvement on the perceptions of criminality
indicator, which in 2025 shows that only 11 per cent of citizens
feel unsafe, down from 53 per cent in 2008. However, while the
homicide rate has fallen, El Salvador’s incarceration rate is now
the highest in the world, with some reports estimating that over
one per cent of the country's population is now incarcerated.
Despite these concerns, El Salvador’s strategy has been
positioned as a model for other Central and South America
countries suffering from extreme homicide rates and gang-
related violence. In Honduras, for instance, a state of emergency
has been in place since November 2022. In June 2024,
Honduran President Xiomara Castro unveiled plans to construct
a mega prison with the capacity to hold 20,000 individuals.31
Honduras’ homicide rate has fallen 23 per cent since 2008 and
is currently 31 per 100,000 people.
The overall improvement on the homicide rate indicator was
strongly correlated with the improvement on the perceptions of
criminality indicator, which measures whether people feel safe
walking alone at night in their city or neighbourhood. Changes
on the homicide rate and perceptions of criminality indicators
were among the most strongly correlated movements between
any pair of indicators on the GPI.
There were 100 countries that improved on the perceptions of
criminality indicator between the 2008 and 2025 GPI, while 51
countries recorded a deterioration. The largest improvements
occurred in El Salvador and Lithuania, which each recorded
42-percentage point improvements. In Lithuania, the
percentage of people who felt unsafe fell from 59 per cent to
just 17 per cent. The largest deterioration occurred in Myanmar,
where the percentage of people who felt unsafe rose from 10 to
57 per cent.
The terrorism impact indicator has improved by an average of
2.9 per cent since 2008. The number of deaths from terrorism
peaked in 2016 at almost 11,000 deaths, with most occurring in
the MENA region. However, while the global number of deaths
from terrorism has fallen since 2015, the epicentre of terrorism
has shifted out of MENA and into sub-Saharan Africa, most
notably in the central Sahel region. The Sahel region accounted
for more terrorism deaths in the past year than both South Asia
and MENA combined.
ONGOING CONFLICT
Ongoing Conflict recorded the largest fall in peacefulness of the
three GPI domains, deteriorating 17.5 per cent between the 2008
GPI and the 2025 GPI. Every indicator on the domain
deteriorated over this period, with the largest deterioration
recorded on the external conflicts fought indicator, which rose
by 63.5 per cent.
Figure 2.6 shows the trends for three key Ongoing Conflict
indicators from the 2008 GPI to the 2025 GPI: the total number
of conflict-related deaths, the average score for the external
conflicts fought indicator, and the average score on the intensity
of internal conflict indicator.
100k
200k
300k
0.5
1.0
1.5
2.0
2.3
2.4
2.5
DEATHS
TOTAL CONFLICT DEATHS
2010 2015 2020 2010 2015 2020 2010 2015 2020
INDICATOR
SCORE
EXTERNAL CONFLICTS FOUGHT
INDICATOR
SCORE
INTENSITY OF INTERNAL CONFLICT
Source: UCDP, EIU, IEP Calculations
FIGURE 2.6
Trends in key Ongoing Conflict indicators, 2008–2025
There were over 300,000 deaths from conflict in 2022.
The total number of deaths from internal conflict increased by
438 per cent between 2008 and 2025. There were over 152,000
deaths last year, the fourth highest number recorded in the last
17 years. Ukraine had the largest number of deaths last year,
followed by Palestine and Russia. These three countries
represented over 63 per cent of deaths from internal conflict in
2024. The highest number of conflict deaths on record occurred
in 2022 when almost 312,000 people were killed in conflict, with
over 165,000 people killed in Ethiopia alone in that year. The
increase in deaths from internal conflict has been widespread,
with 61 countries having a higher number of deaths from
37.
Trends
35
2
internal conflict in2025 than in 2008. Nearly half the countries
in the GPI recorded at least one death from internal conflict in
the past year.
External conflicts fought had the largest deterioration of any
indicator on the Ongoing Conflict domain. There were 86
countries that deteriorated, 31 that improved, and 44 with no
change since 2008. Of the 163 countries in the GPI, 127 have
been involved in at least one external conflict since the
inception of the index. This trend reflects the growing number
of internationalised intrastate conflicts, in which external actors
are involved in civil conflicts between governments and rebel
groups. The support generally goes to governments, often in the
form of a coalition of countries conducting peacekeeping
operations or providing operational support for the military
campaigns.
Since 2008, all regions have recorded a deterioration in their
scores on the external conflicts fought indicator. Sub-Saharan
Africa experienced the most severe deterioration, at 148 per
cent, followed by South Asia at 143 per cent, and MENA at 102
per cent. Sub-Saharan Africa remains the region with the most
countries engaged in external conflicts, with 35 of 43 countries
involved in conflict in 2025, a significant increase from just
seven in 2008.
The deterioration on the external conflicts fought indicator
reflects the increase in external actors becoming involved in
internal conflicts. In the 2025 GPI there were 98 countries that
were at least partially involved in some form of external conflict
in the past five years, up from 59 in 2008. Of those 98, three
were acting alone in an external conflict, 33 were involved in a
small coalition, and 82 were involved in a large coalition of ten
or more countries. In the majority of conflicts, countries were
offering support to an existing government in its conflict with
an internal armed rebel or terrorist group.
The intensity of internal conflict indicator is a measure of the
severity of the latent or manifest forms of organised conflict
within a country. This indicator has deteriorated by 11 per cent
since 2008, with 51 countries recording deteriorations, and 25
countries recording improvements. There are now 76 countries
with a score of three or higher, indicating an explicit threat of
violence or more, compared to just 58 in 2008.
As more groups have become involved in armed conflicts, there
has also been a significant shift in the way conflicts end. The
percentage of conflicts that end due to being classified as low
activity has risen from around 20 per cent in the 1970s to nearly
70 per cent in the 2010s. A conflict ends due to low activity
when there are fewer than 25 deaths in a calendar year, but no
peace agreement or ceasefire is reached, and no side has a clear
victory. These conflicts may become ‘frozen conflicts’ which are
likely to erupt in future years.
Similarly, the percentage of conflicts that end with either a
government or rebel group victory has fallen from just under 50
per cent in the 1970s to less than nine per cent in the 2010s.
Even in conflicts in which one side wins a decisive victory, the
aftermath often brings little peace. Negotiated settlements or
peace agreements have become less common, falling from 22
per cent to four per cent over the past four decades. Clear
victories are often only obtained after the use of extremely
destructive or brutal approaches to conflict. This is evident in
contemporary conflicts such as Sri Lanka, where military
victories have been achieved through severe tactics, leading to
highly securitised post-war periods and substantial risks of
recurrent conflict.
MILITARISATION
The average score on the Militarisation domain improved by 2.7
per cent between 2008 and 2025. It is the only GPI domain to
record an improvement during this period, with 89 countries
improving and 72 deteriorating. Figure 2.7 shows the trend for
the average armed services personnel rate, military expenditure
(% GDP), and the average weapons imports indicator score.
The GPI domain trends shown in Figure 2.3 reveals an
interesting paradox. Although the world has become much less
peaceful and the level of Ongoing Conflict has surged, the
average level of Militarisation has improved, although this
trend has begun to reverse since 2022. Even as the number of
active conflicts around the world surged, and overall conflict
deaths increased by over 560 per cent, the average armed forces
personnel rate fell from almost 500 per 100,000 people, to less
than 425 per 100,000 people.
FIGURE 2.7
Trends in key Militarisation indicators, 2008–2025
The average armed personnel rate has fallen from over 500 to less than 425 per 100,000 people.
425
450
475
500
2010 2015 2020 2025
RATE
PER
100K
ARMED PERSONNEL RATE
1.9
2.0
2.1
2.2
2010 2015 2020 2025
%
OF
GDP
MILITARY EXPENDITURE
1.450
1.475
1.500
1.525
2010 2015 2020 2025
INDICATOR
SCORE
SCORE
WEAPONS IMPORTS
Source: IISS Military Balance, SIPRI
38.
36
Global Peace Index2025 | Measuring peace in a complex world
Three of the six indicators on the Militarisation domain
deteriorated - weapons imports, military expenditure (% GDP),
and weapons exports. The largest proportional improvements
between 2008 and 2025 occurred on the armed services
personnel rate, where 113 countries improved, and the UN
peacekeeping funding indicator, where 86 countries improved.
The global average armed service personnel rate declined from
510 per 100,000 population in 2008, to 420 per 100,000
population by 2024. The improvement on the armed services
personnel rate and military expenditure (% GDP) since 2008
was particularly notable in the five countries with the largest
total military spending: United States, China, India, Russia and
the United Kingdom. Of those countries, all except Russia
recorded improvements on both military expenditure (% GDP)
and armed services personnel rate.
The weapons imports indicator continued to deteriorate in the
past year, resulting in a deterioration of nearly 60 per cent over
the last 17 years. The number of countries that recorded no
weapons imports fell from 27 in 2008, to only 14 in 2025. Six of
the ten countries with the largest per capita weapons imports
from 2019 to 2024 are from the MENA region.
Weapons exports remain highly concentrated, with 100
countries registering no exports at all in 2025. Several highly
peaceful countries performed poorly on this indicator, with
France, Sweden, Italy, the Netherlands, Germany, and Norway
all being ranked amongst the ten highest weapons exporters per
capita in 2025. Eight of the ten largest exporters on a per capita
basis are Western democracies. However, by total export value,
just five countries account for over 75 per cent of total weapons
exports: the US, France, Russia, China, and Germany, with the
US alone accounting for over 40 per cent.
While Russia remains one of the top ten weapons exporters on
the 2025 GPI, it has shown an overall improvement on the
weapons exports indicator of 11.4 per cent over the past 17 years,
falling from the third worst on this indicator in 2008 to ninth
worst last year. The primary cause for this improvement is the
war in Ukraine, a conflict whose prolonged length and intensity
have led to significant loss and damage to Russian military
equipment. This has forced the country to prioritise producing
weaponry for its own uses and has in turn reduced its capacity
to export weapons abroad. Additionally, countries that were
once major buyers of Russian-made weaponry have shifted to
alternative suppliers as a result of the sanctions imposed on
Russia. For instance, in 2019 it was reported that Russia sold
weapons to 31 countries, whereas in 2023 that number fell to
just 12 countries.32
Global levels on the Militarisation domain are likely to keep
rising as countries seek to improve their military readiness
amidst growing international tensions, instability, and security
threats. NATO allies commit to target an investment of at least 2
per cent of GDP in defence expenditure and have recently
agreed that at least 20 per cent of such investment should be
devoted to major new equipment.33
The United States continues
to push for these guidelines to be raised, specifically advocating
for a commitment among NATO allies to allocate five per cent of
GDP towards defence spending..34
In March 2025, the European
Commission published the ReArm Europe Plan/Readiness 2030
and the White Paper for European Defence. The plan aims to
bolster defence capabilities through a surge in investments and
combined spending of over 800 billion euros.35
39.
Trends
37
2
Trends in Geopolitical
Relations
KEYFINDINGS
• Global economic stagnation, increasing debt, and the
weaponisation of economic interdependence via trade wars are
key factors shaping the economic landscape of geopolitics in the
21st century.
• Geopolitical fragmentation is rising, with levels now exceeding
those seen during the Cold War.The rise in fragmentation has
been especially noticeable since 2008, after it had been steadily
decreasing since the end of the Cold War.
• Global trade has plateaued at around 60 per cent of global GDP
over the past decade, following rapid growth after 1990.
• Global military spending hit a record $2.7 trillion in 2024, a nine
per cent increase from the previous year, driven largely by
conflicts like the war in Ukraine.
• Competition for influence is intensifying in regions like Africa,
South Asia, and South America. In the Sahel, instability and
scarce resources are drawing in rival powers and fuelling a
complex struggle for control.
• The number of globally influential countries has nearly tripled
since the Cold War, rising from 13 to 34 by 2023, with nations
like Türkiye, the UAE, Vietnam, South Africa, Brazil and
Indonesia expanding their influence.
OVERVIEW
There has been a significant increase in geopolitical tensions
since the inception of the GPI. The neighbouring countries
relations, which measures the strength of tensions between
neighbouring countries, deteriorated by 13 per cent from 2008
to 2025, the fifth largest deterioration of any indicator in the
GPI. Relations between neighbouring countries deteriorated in
59 countries and improved in just 19.
This deterioration in country relations is part of a much broader
trend of increasing geopolitical and economic fragmentation
that encompasses not just diplomatic tensions but also
increasing risk of conflict. Geopolitical risks today exceed levels
seen during the Cold War, driven by heightened military
spending, stalled efforts at nuclear disarmament, the diminished
role of multilateral institutions, and increasing competition
among major and middle powers and regional blocs.
At the same time, contemporary global economic stagnation,
increasing debt, and the weaponisation of economic
interdependence via trade wars are key factors shaping the
economic landscape of geopolitics in the 21st
century.
This section looks at long term trends in geopolitical relations,
as well as examining the impact of changes in these relations on
economic fragmentation, increasing militarisation, and
competition for influence.
LONG-TERM TRENDS
The long-term trend in geopolitical tensions is shown in Figure
2.8, which shows the trend in geopolitical fragmentation from
1975 to 2024.36
Geopolitical fragmentation refers to the
accelerating breakup of the international system into competing
power blocs and shifting alliances, weakening the common rules
and institutions that once bound states together. It shows up in
sharper strategic rivalries, selective economic decoupling, and a
reduced ability to coordinate on trans-national problems.
Fragmentation is measured using a wide range of data sources
that reflect both economic and political relationships between
countries, capturing four key types of geopolitical
fragmentation: Financial, mobility, political, and trade.
-1
0
1
2
3
1975:Q1 1980:Q1 1985:Q1 1990:Q1 1995:Q1 2000:Q1 2005:Q1 2010:Q1 2015:Q1 2020:Q1
FRAGMENTATION
LEVEL
Financial Mobility Political Trade
Source: Geopolitical Fragmentation Index
Less
Fragmented
More
Fragmented
FIGURE 2.8
Geopolitical fragmentation, 1975–2024
Geopolitical fragmentation has increased significantly since the Global Financial Crisis.
40.
38
Global Peace Index2025 | Measuring peace in a complex world
Data from the Geopolitical Fragmentation Index reveals three
key phases in geopolitical relations over the past 50 years. There
was a stable division of power between Cold War blocs from
1975 to 1990, a period of rapid integration from the early 1990s
to the mid-2000s, when global trade and cooperation flourished,
and a steady rise in fragmentation since the 2008 Global
Financial Crisis. This latest phase has intensified in recent
years, with events such as the US-China trade conflict, Russia’s
invasion of Ukraine, and growing tensions over technology and
security pushing the world toward greater division.
This latest phase of increasing fragmentation was not caused by
a sudden collapse of international institutions, but by a steady
build-up of frictions over the last 15 years. These include the
increasing use of tariffs, export bans, and investment
restrictions, as well as new migration and capital controls.
Sanctions have become more common and longer-lasting,
especially those imposed by Western countries in response to
geopolitical disputes. At the same time, political divisions are
deepening. For example, voting patterns in the UN General
Assembly show growing disagreement between Western
countries and China and Russia on key global issues, reflecting
a widening split in how different regions view the rules and
responsibilities of the international system.
The underlying causes of this fragmentation are both political
and structural. The return of great-power competition, the rise
of nationalism in many countries, and disputes over control of
new technologies and natural resources have all played a role.
At the same time, global institutions like the UN and WTO have
struggled to respond and have slowly become less effective. As a
result, countries are relying more on national or regional
strategies, rather than working through global systems. What
sets this period apart is how broad and long-lasting these
changes are. The global geopolitical and economic systems may
be approaching a tipping point and, if passed, it is difficult to
predict what the new system would look like. Table 2.1
highlights some of the major changes across the three periods.
TABLE 2.1
Changes in the international system from the Cold War to the present
Factor Theme Cold War (1947–1989) Post Cold War (1990–2011) 2011–2024
Trade Global Trade
Represents 40 per cent
global GDP
Increases to 60 per cent
Remained at 60 per cent for
the past decade
United Nations
Security Council Resolutions
High use of UNSC veto, few
resolutions passed
Decline of veto use, increase
of resolutions passed
Increase in use of veto,
decline of successful
resolutions
Aid Disbursement Increasing Increasing
Shift toward bilateral vs
multilateral disbursements
Emerging Nations
Number of Countries 76 (1947) 172 (1991) 195 (2011)
Material Power of Countries
P5 account for 55 per cent of
global material power
P5 reduces to 50 per cent of
global material power
P5 reduces to 40 per cent of
global material power
Nuclear Weapons
Number of Nuclear Powers 2 (1947) 8 (2005) 9 (2006)
Stockpiles of Nuclear
Weapons
Russia 40,000
US 23,000
Rest of the world 1,500
(1986)
Russia 12,000,
US 10,000,
Rest of the world 700
(1991)
Russia 5,600,
US 5,000,
Rest of the world 1,500
(2023)
Source: IEP
30%
40%
50%
60%
1970 1980 1990 2000 2010 2020
TRADE
AS
%
OF
GDP
Source: World Bank
ECONOMIC FRAGMENTATION
The global economy is significantly more interconnected than it
was during the Cold War era. However, there are signs that the
extent of this interdependence is beginning to plateau. Figure
2.9 shows trade as a percentage of Global GDP from 1970 to
2024. After rising from under 40 per cent at the end of the Cold
War to over 60 per cent by the mid-2000s, it has levelled off and
remained at or below 60 per cent since the end of the Global
Financial Crisis.
FIGURE 2.9
Trade as a percentage of GDP, 1970–2024
Trade as a percentage of GDP has plateaued since the
Global Financial Crisis.
Furthermore, this economic interdependence is increasingly
becoming a source of geopolitical tension, as seen by the
increase in tariffs, trade wars and deliberate policy choices
aimed at decoupling supply chains, particularly in industries
deemed critical for national security.
41.
Trends
39
2
The current movetowards fragmentation has been driven
primarily by strategic considerations and national security
imperatives, rather than purely market-driven adjustments or
shifts in technology and preferences. Several factors are
propelling this trend. Prominent among these are escalating
geopolitical tensions and strategic competition, such as the
China-America tariff war that began in 2018 and the extensive
sanctions imposed on Russia following its invasion of Ukraine.
These events have solidified the perception that economic
dependencies are vulnerabilities that can be strategically
exploited. Furthermore, heightened national security concerns,
amplified by the supply chain disruptions experienced during
the COVID-19 pandemic, have prompted governments and
corporations to prioritise resilience and security of supply for
essential goods and commodities. This has spurred interest in
strategies like reshoring, near-shoring, and "friend-shoring",
which involves relocating economic activities to geopolitically
aligned partner countries.
The resurgence of large-scale industrial policies targeting
strategic sectors such as semiconductors contributes to
fragmentation, as these policies frequently incorporate
protectionist elements or subsidies that distort global trade and
investment patterns. Compounding these factors is the
perceived weakening of multilateral institutions like the World
Trade Organization, whose diminished capacity to manage trade
disputes reduces constraints on unilateral actions. Shifting
public and political attitudes in some nations, driven by
concerns over globalisation and job losses, have also created
political space for more protectionist stances.
The use of trade-restrictive measures has surged globally, with
around 3,000 such measures imposed in 2023, nearly triple the
number from 2019. Restrictions on commodity trade saw a
particularly sharp rise in 2022. Commodity markets themselves
show clear signs of fragmentation, with widening price
differentials for key materials like lithium and coal across
different geographic markets in 2022. For example, Russian coal
traded at a price almost three times lower than Australian coal
in September 2022. Lithium prices surged globally in 2022 due
to a supply-demand imbalance. In China, domestic battery-
grade lithium carbonate prices soared by over 100 per cent in
the first quarter alone, driven by a widening supply deficit and
strong demand from the electric vehicle (EV) sector. This rapid
increase in Chinese prices outpaced those in other regions,
leading to notable geographic price disparities.
Financial flows are also exhibiting increased sensitivity to
geopolitical risk, with some evidence suggesting capital
reallocation towards countries perceived as geopolitically closer
or as safe havens. The declining share of the US dollar in global
reserves and widespread exploration of Central Bank Digital
Currencies could further fragment the international payments
system. If the US dollar declines further it is unlikely that one
currency will dominate as the rising middle power countries will
wish to avoid giving away their independence.
This trend towards economic fragmentation carries substantial
potential costs. Estimates of long-term global GDP losses vary
widely depending on the severity of fragmentation modelled,
ranging from 0.2 per cent to nearly seven per cent. Emerging
markets and low-income countries are generally considered the
most vulnerable, potentially facing disproportionate losses due
to reduced access to technology diffusion, higher costs for
essential imports like food and commodities and limited policy
space to absorb shocks. Fragmentation is also likely to exert
upward pressure on inflation by disrupting efficient supply
chains and reducing competitive pressures.
MILITARISATION
The recent increase in economic fragmentation has been
paralleled by a sharp increase in militarisation. This has been
particularly noticeable in the past three years, following a
period of decline in military focus after the Cold War,
characterised by reduced military spending as a share of GDP
for the majority of countries and smaller armed forces personnel
numbers.
The increase in militarisation in recent years can be clearly seen
when measuring total global military expenditure. Figure 2.10
shows that military expenditure declined in the 1990s, before
rising steadily from the 2000s and reaching an all-time high in
the past year. Global military expenditure reached an estimated
$2.7 trillion in 2024, driven by conflicts like the war in Ukraine.
0
500,000
1,000,000
1,500,000
2,000,000
2,500,000
1992 1994 1996 1998 2000 2002 2004 2006 2008 2010 2012 2014 2016 2018 2020 2022 2024
MILITARY
EXPENDITURE
(CONSTANT
2023
US$
BILLION)
Source: SIPRI, IEP Calculations
All Other Countries China and Russia The West USA
FIGURE 2.10
Military expenditure (constant 2023 US$ billions), 1992–2024
Military expenditure declined in the 1990s, before rising steadily from the 2000s and reaching an all-time high in 2024.
42.
40
Global Peace Index2025 | Measuring peace in a complex world
The growth rate in military spending is also increasing sharply.
The 9.4 per cent increase in spending during 2024 was the
steepest year-on-year rise documented since at least 1988,
higher than the 6.8 per cent increase seen in 2023 and the 3.5
per cent increase in 2022. Military spending per capita
worldwide also reached $334, its highest level since 1990.
Meanwhile, efforts towards nuclear disarmament have
stagnated. The major nuclear powers, primarily the United
States and Russia, who possess the vast majority of warheads,
have seen little progress in stockpile reduction. Indeed, in the
past three years, every state with nuclear capabilities has either
maintained or increased its arsenal. Iran's continued pursuit of
nuclear capabilities, despite the 2015 agreement (from which
the United States withdrew in 2018), remains a significant
factor influencing Middle Eastern geopolitics.
This surge in militarisation is a direct consequence of a
deteriorating global security environment. The ongoing war in
Ukraine serves as a primary catalyst, particularly for the
dramatic spending increases observed across Europe. Similarly,
the war in Gaza and associated regional instability are fuelling
higher military budgets in the Middle East. Underlying these
specific conflicts is the broader context of great power
competition, primarily involving the United States, China, and
Russia. This rivalry prompts significant investments in military
modernisation as these powers seek to deter adversaries and
project influence. Within NATO, the renewed emphasis on the
two per cent of GDP spending guideline, driven by the changed
security landscape, is another significant contributing factor.
The current phase of militarisation is also characterised by
important qualitative shifts, particularly concerning technology
and the global arms trade. Despite soaring expenditure, the
total number of military personnel worldwide has shown a
long-term decline, suggesting a move towards more capital-
intensive, technologically advanced armed forces. Investments
are increasingly channelled into cutting-edge areas such as
Artificial Intelligence (AI), autonomous systems like drones and
unmanned underwater vehicles (UAVs/UUVs), cyber warfare
capabilities, space-based assets, advanced sensors, and
sophisticated missile technology.
For instance, the United States allocated substantial funds in
2024 towards nuclear modernisation and missile defence, while
China is rapidly advancing its capabilities in stealth aircraft,
UAVs/UUVs, its nuclear arsenal, counterspace systems, and
cyber warfare. This technological arms race complicates
traditional methods of assessing military power. When taking
increased military sophistication into account, IEP estimates
that there has been a ten per cent increase in global military
capability over the last decade, despite falls in the armed forces
personnel rate.
COMPETITION FOR INFLUENCE
The final area in which increasing geopolitical fragmentation
can be seen is in increasing competition for influence,
particularly among ‘middle power’ countries seeking to extend
their influence in lower and middle income countries (LMICs).
In the evolving international order, middle powers are emerging
as increasingly significant actors.
While the definition of a ‘middle power’ is debated, it generally
refers to states occupying an intermediate position in the global
power hierarchy, possessing resources and influence below
those of great powers but significantly above smaller states.
This status is often assessed based on factors like GDP,
population size, and military strength, but also on their foreign
policy behaviour. Middle powers frequently favour
multilateralism, diplomacy, and coalition-building, often
carving out specific roles in ‘niche diplomacy’, focusing on areas
like peacekeeping, arms control, or human rights.
In the current climate of US-China rivalry, these middle powers
employ a variety of strategies to protect their interests,
maintain autonomy, and exert influence. Some engage in
'balancing', explicitly aligning with one great power to counter
another, as seen in Australia's strengthened security ties with
the United States through alliances like AUKUS to counter
China's influence. Others pursue 'hedging', maintaining
workable relations with both competing powers to maximise
flexibility and economic benefits while seeking security
assurances, a strategy historically employed by nations like
Indonesia.
The rise in the importance of middle power countries can be
seen by looking at the data on Foreign Bilateral Influence
Capacity (FBIC), which measures the amount of economic,
diplomatic, and military influence one country has over
another. Figure 2.11 charts the number of countries that account
for over ten per cent of foreign influence in five or more
countries. This number has increased significantly over the past
sixty years, rising from five countries in 1960 to 34 in 2023. The
steepest increase in the number of countries with significant
influence began in 2005.
FIGURE 2.11
Countries with significant geopolitical
influence, 1960–2023
The number of globally influential countries has nearly
tripled since the end of the Cold War.
10
20
30
1960
1965
1970
1975
1980
1985
1990
1995
2000
2005
2010
2015
2020
NUMBER
OF
COUNTRIES
Source: University of Denver, IEP Calculations
43.
Trends
41
2
Most of thisincrease in influence has occurred in LMICs. Figure
2.12 highlights the level of influence competition over LMICs
across the world. Influence competition over LMICs largely
revolves around material and strategic concerns, such as access
to key resources, or the ability to exert strong influence on
neighbouring countries. For instance, instability and resource
scarcity in the Sahel region of Africa has driven foreign and
regional actors to vie for control, contributing to a complex and
contested environment. Significant competition for India
revolves around its rising economic and military power, which
has made the country central to Indo-Pacific geopolitics and an
attractive ally to both the United States and China. Foreign
competition for influence in Brazil is driven by its leadership in
Latin America, its economic power, and its strategic role in
global institutions like BRICS. Brazil’s growing importance,
particularly for China and other emerging economies, has
heightened rivalry with the United States and other Western
powers.
FIGURE 2.12
Foreign influence competition in low- and middle-income countries, since 2011
Currently, there are high levels of competition in West Africa, South Asia and Southeast Asia.
While countries often exert influence through increased aid,
trade, or defence agreements, in cases of countries in conflict,
this can manifest through competitive interventions in civil war.
Between 2010 and 2023, the number of internationalised
intrastate conflicts increased nearly threefold. Many of these
conflicts involve large regional or international coalitions
involved in peacekeeping or stabilisation operations. In 2023,
there were 78 countries that were involved in at least one
internationalised intrastate conflict, up from 59 in 2008. In
many instances, the involvement of major powers in intrastate
wars can intensify the conflict and hinder resolution efforts.
This can be seen in the civil war in Sudan, where external
actors, including China, Russia, Iran, Egypt, the United Arab
Emirates, Chad, and Libya are supporting rival militias in their
battle for control of the country. As a result of the violence that
has persisted since 2023, Sudan is now facing the world's worst
refugee crisis, with over 10 million people displaced.
Competition Level
High Competition
Moderate Competition
Low Competition
Not Included
44.
The global economicimpact of violence was
$19.97 trillion in constant PPP terms in 2024,
equivalent to 11.6 per cent of global GDP, or
$2,455 per person.
The 2024 result represents an
increase of 3.8 per cent from the
previous year, largely driven by
a six per cent increase in military
expenditure and a 44 per cent
increase in GDP losses from conflict.
In the ten countries most
affected by violence, the
economic cost of violence
averaged 27.8 per cent of
GDP in 2024, compared to
just 2.5 per cent for the ten
least affected countries.
Afghanistan and Ukraine incurred the
highest economic cost of violence as
a percentage of GDP in 2024. The
economic cost of violence in these
countries was over 40 per cent of GDP.
Expenditure on peacebuilding
and peacekeeping was $47.2
billion in 2024, just 0.52 per
cent of total military spending
in PPP terms. This represents a
decline in real terms of 26 per
cent from $64 billion in 2008.
Military and internal security
expenditure accounts for 73
per cent of the total economic
impact of violence. Military
expenditure accounts for 45 per
cent of the model, or $9 trillion.
Since 2008, the component of the
economic model to experience the
greatest increase was conflict deaths,
whose cost rose by 421 per cent. The
economic impact of conflict deaths, GDP
losses, and refugees and IDPs have each
more than tripled in the last 16 years.
Between 2023 and 2024, the economic impact of refugees
and IDPs rose in 112 countries, with an average increase of
30 per cent, while military expenditure rose in 101 countries,
with an average increase of 15 per cent.
billion
global GDP
42
Global Peace Index 2025 | Measuring peace in a complex world
6%
11.6%
44%
Military Expenditure
2024
GDP Losses
↓ ↓
40%
$47.2
44
Global Peace Index2025 | Measuring peace in a complex world
The Economic Value
of Peace
In 2024, the impact of violence on the global economy amounted to $19.97 trillion in purchasing power
parity (PPP) terms. This is equivalent to 11.6 per cent of global GDP, or $2,455 per person. The total
economic impact of violence increased by 3.8 per cent over the past year.
The global economic impact of violence is defined as the
expenditure and economic effect related to containing,
preventing and dealing with the consequences of violence.
Understanding the economic impact of violence provides a basis
for calculating the economic benefits resulting from
improvements in peace.
Violence and the fear of violence create significant economic
disruptions. Violent incidents generate costs in the form of
property damage, physical injury, and psychological trauma.
Fear of violence also alters economic behaviour, primarily by
reducing the propensity to invest and consume. Expenditure on
preventing, containing, and dealing with the consequences of
violence diverts public and private resources away from more
productive activities and towards protective measures. Violence
generates economic losses in the form of productivity shortfalls,
foregone earnings, and distorted expenditure.
The total economic impact of violence has three components
that represent different ways in which violence impacts
economic activity: direct costs, indirect costs and a multiplier
effect.
The direct costs of violence include the immediate consequences
to the victims, perpetrators, and public systems, including
health, judicial and public safety. The indirect cost refers to
longer-term costs, such as lost productivity resulting from the
physical and psychological effects and the impact of violence on
the perception of safety and security in society. The multiplier
effect represents the economic benefits that would be generated
by the diversion of expenditure away from sunk costs, such as
incarceration spending, and into more productive alternatives.
The economic impact of violence includes many indicators
contained in the GPI, such as military expenditure, conflict
deaths and homicides. However, the model also includes costs
that are not incorporated into the GPI, such as expenditure on
refugees and internally displaced persons (IDPs), losses from
conflict, the economic impacts of suicides and internal security
expenditure.
THE VALUE OF PEACE IN 2024
The economic impact of violence was $19.97 trillion in 2024.
This was a 3.8 per cent increase from the previous year, owing
largely to an increase in GDP losses from conflict, as well as
increases in military expenditure. Figure 3.1 displays the
breakdown of the total economic impact of violence by 15
categories for 2024.
FIGURE 3.1
Composition of the global economic impact of
violence, 2024
Military and internal security expenditure accounts for over
73 per cent of the total economic impact of violence.
The single largest component of the global economic impact of
violence was military expenditure, which totalled $9 trillion, or
45 per cent of the total economic impact. Note that this is an
economic measure of military expenditure that includes a
multiplier effect, as well as spending on veterans’ affairs and
other related costs. For this reason, it differs from other
estimates of global military expenditure.
Internal security expenditure was the second largest
component, comprising 29 per cent of the global economic
impact of violence, at $5.7 trillion. It includes spending on the
police and the judicial system as well as the costs associated
with incarceration.
Table 3.1 gives a more detailed breakdown of the total economic
impact of violence across 15 categories, as well as the change in
the impact from 2023 to 2024.
Source: IEP Calculations
MILITARY
EXPENDITURE
45%
INTERNAL SECURITY
EXPENDITURE
29%
PRIVATE
SECURITY
8%
OTHER
6%
HOMICIDE
6%
SUICIDE
4%
VIOLENT
CRIME
3%
47.
Trends
45
2
TABLE 3.1
Change inglobal economic impact of violence, billions of PPP 2024 US dollars, 2023–2024
The total economic impact of violence increased by 3.8 per cent from 2023 to 2024.
2024 2023 YEAR ON YEAR CHANGE
CATEGORY
DIRECT
COST
INDIRECT
COST
MULTIPLER
TOTAL
ECONOMIC
IMPACT
TOTAL
ECONOMIC
IMPACT
TOTAL
CHANGE
% CHANGE
Military expenditure 4517 0 4517 9034 8494 540 6.4
Internal security expenditure 2859 0 2859 5718 5668 50 0.9
Private security 768 0 768 1536 1516 20 1.3
Homicide 99 945 99 1143 1166 -23 -2
Suicide 1 756 1 758 753 5 0.7
Violent crime 51 515 51 617 622 -5 -0.8
Refugees and IDPs 4 345 4 343 352 1 0.3
GDP losses 0 462 0 462 321 141 43.9
Incarceration 71 0 71 142 140 2 1.4
Fear 0 78 0 78 78 0 0
Conflict deaths 28 0 28 56 52 4 7.7
Peacebuilding 15 0 15 30 32 -2 -6.2
Peacekeeping 8 0 8 16 18 -2 -11.1
Small arms 11 0 11 22 24 -2 -8.3
Terrorism 1 6 1 8 15 -7 -46.7
Globally, the economic impact of military expenditure increased
by 6.4 per cent in 2024, equivalent to $540 billion. The general
trend in military expenditure is rising, with a significant surge
observed over the past few years. Many European countries
have committed to spending more in the near future, due in
large part to the ongoing conflict in Ukraine.37
Expenditure on private security increased by 1.3 per cent.
Private security is the third largest category in the model and
comprises eight per cent of the total. Private security includes
all businesses that provide security services, such as bodyguards
and armed guards both inside and outside of conflict zones.
Homicide is the fourth largest component in the model,
representing six per cent of the global economic impact of
violence, or $1.1 trillion. The economic impact of homicide fell
by two per cent from the previous year. Homicide has been one
of the few categories to show a sustained improvement over the
past 16 years.
Suicide is the fifth largest component in the model, representing
four per cent of the total impact. Last year, the economic impact
of suicide increased by 0.7 per cent. In contrast, the economic
impact of violent crime declined by 0.8 per cent in 2024. Violent
crime comprises acts such as assault and sexual violence. It is
the sixth largest component of the model, representing three per
cent of the total economic impact of violence.
TRENDS IN THE ECONOMIC IMPACT OF
VIOLENCE
In real terms, the overall impact of violence was 12.8 per cent
higher in 2024 than in 2008, as shown in Figure 3.2. Substantial
improvements were recorded between 2010 and 2013, after
which the impact has steadily risen. Since 2008, 100 countries
have recorded deteriorations in their economic impact of
violence, while 61 have improved. The average deterioration was
21.9 per cent, while the average improvement was 52.4 per cent.
48.
46
Global Peace Index2025 | Measuring peace in a complex world
FIGURE 3.2
Trends in the global economic impact of violence, 2008–2024
The economic impact of violence has increased year on year for 11 of the past 16 years.
16
17
18
19
20
2008 2012 2016 2020 2024
CONSTANT
2021
US$
PPP,
TRILLIONS
-5.0%
-2.5%
0.0%
2.5%
5.0%
2008 2012 2016 2020 2024
Source: IEP Calculations
Table 3.2 shows a breakdown of the change in the economic
impact of violence between 2008 and 2024 by category. Costs
associated with conflict deaths, GDP losses from conflict, and
refugees and IDPs each more than tripled.
TABLE 3.2
Change in global economic impact of violence, billions of PPP 2024 US dollars, 2008–2024
ECONOMIC IMPACT CHANGE (2008-2024)
CATEGORY 2008 2024 TOTAL CHANGE % CHANGE
Conflict deaths 10.6 52.2 44.8 421
GDP losses 90.1 462 372 412
Refugees and IDPs 113 353 240 212
Terrorism 10.3 7.3 -3 -29
Peacekeeping 19.7 16.6 -3.10 -16
Military expenditure 7674 9034 1360 18
Suicide 689 758 68.7 10
Fear 72.3 77.7 5.40 7
Homicide 1188 1143 -44.5 -4
Incarceration 135 141 5.8 4
Internal security expenditure 5325 5717 392 7
Small arms 24.2 24.8 -1.4 -6
Violent crime 611 617 6.1 1
Peacebuilding 44.1 30.6 -13.5 -31
Private security 1750 1536 -214 -12
49.
Trends
47
2
ECONOMIC IMPACT BYDOMAIN
The 15 categories of the economic impact of violence can be
grouped into three domains: Armed Conflict, Interpersonal and
Self-Inflicted Violence, and Violence Containment. The relative
long-term trends in the economic impact of violence differ
significantly across these three domains. Table 3.3 shows the
violence categories included in each domain, while Figure 3.3
shows the indexed change in the three domains since 2008. The
Armed Conflict domain has increased substantially since 2013,
while Violence Containment and Interpersonal and Self-Inflicted
Violence have recorded relatively small changes.
TABLE 3.3
Economic impact of violence – domains and categories
There are 18 categories in the economic impact of violence model.
VIOLENCE CONTAINMENT ARMED CONFLICT
INTERPERSONAL AND SELF-
INFLICTED VIOLENCE
Military expenditure Direct costs of deaths from internal violent conflict Homicide
Internal security expenditure Direct costs of deaths from external violent conflict Violent assault
Security agency Indirect costs of violent conflict (GDP losses due to conflict) Sexual assault
Private security Losses from status as refugees and IDPs Fear of crime
UN peacekeeping Small arms imports Indirect costs of incarceration
ODA peacebuilding expenditure Terrorism Suicide
Figure 3.3
Indexed trend in economic impact by domain, 2008–2024
The economic impact of Armed Conflict has almost tripled since 2008.
Violence Containment
Armed Conflict
Interpersonal and Self-Inflicted Violence
0.8
1.0
1.2
1.4
1.6
1.8
2.0
2.2
2.4
2.6
2.8
3.0
3.2
3.4
3.6
3.8
4.0
2008 2009 2010 2011 2012 2013 2014 2015 2016 2017 2018 2019 2020 2021 2022 2023 2024
INDEXED
CHANGE
(2008=1)
Source: IEP Calculations
Improvement
Deterioration
50.
48
Global Peace Index2025 | Measuring peace in a complex world
ARMED CONFLICT
The economic impact of Armed Conflict on the global economy
in 2024 amounted to $900 billion, a 17.8 per cent increase from
the year prior. The Armed Conflict domain includes the costs
associated with violence caused by organised groups such as
national militaries and security forces, militia groups, and
terrorist organisations.
This collective violence includes conflict within and between
states, including militias and drug cartels, violent political
repression, genocide, and terrorism. The three regions with the
highest economic impact from Armed Conflict are sub-Saharan
Africa, the Middle East and North Africa (MENA), and South
America.
Figure 3.4 shows the composition of the economic impact of
Armed Conflict in 2024. GDP losses is the largest component,
accounting for approximately 51 per cent of the economic
impact of the domain, followed by costs associated with
refugees and IDPs, at 39 per cent.
FIGURE 3.4
Composition of the Armed Conflict domain,
2024
GDP losses account for over half of the global economic
impact of Armed Conflict.
INTERPERSONAL AND SELF-INFLICTED
VIOLENCE
The economic impact of Interpersonal and Self-Inflicted
Violence aggregates homicide, violent and sexual assault,
suicide, and the fear of violence. In 2024, the economic impact
of Interpersonal and Self-Inflicted Violence on the global
economy amounted to $2.7 trillion, a 0.76 per cent decrease
from the prior year.
Figure 3.5 shows the composition of the economic impact of the
Interpersonal and Self-Inflicted Violence domain. Homicide
accounts for approximately 42 per cent of the domain's
economic impact, followed by suicide at 28 per cent and violent
crime at 23 per cent.
GDP
LOSSES
51%
REFUGEES
AND IDPS
39%
CONFLICT DEATHS
6%
SMALL ARMS
3%
TERRORISM
1%
Source: IEP Calculations
HOMICIDE
42%
SUICIDE
28%
VIOLENT
CRIME
23%
INCARCERATION
5%
FEAR
3%
Source: IEP Calculations
FIGURE 3.5
Composition of the Interpersonal and Self-
Inflicted Violence domain, 2024
Homicide accounts for more than two-fifths of the economic
impact of Interpersonal and Self-Inflicted Violence.
VIOLENCE CONTAINMENT
The domain of the economic impact of violence model with the
greatest overall cost is Violence Containment. It consists of all
spending which aims to prevent and contain the spread of
violence. In 2024, the economic impact of Violence Containment
on the global economy amounted to $16.3 trillion, a 3.9 per cent
increase from the prior year. Figure 3.6 shows the composition
of the economic impact for this domain.
FIGURE 3.6
Composition of the economic impact of the
Violence Containment domain, 2024
Peacebuilding and peacekeeping are only a tiny fraction of the
economic impact of Violence Containment.
MILITARY
EXPENDITURE
55%
INTERNAL
SECURITY
EXPENDITURE
35%
PRIVATE SECURITY
9%
PEACEBUILDING
0%
PEACEKEEPING
0%
Source: IEP Calculations
51.
Trends
49
2
North and CentralAmerica
Western and Central Europe
Eastern Europe and Central Asia
Middle East and North Africa
Asia-Pacific
South America
South Asia
sub-Saharan Africa
$0 $1,000 $2,000 $3,000
CONSTANT 2024 PPP,
PER PERSON
Source: IEP Calculations
FIGURE 3.7
Per capita containment spending (military and
internal security) by region, 2024
In 2024, North and Central America recorded the highest
per capita cost of violence containment spending globally.
Military expenditure is the largest component of this domain,
accounting for 55 per cent of the total, while internal security
expenditure is the second largest component, at 35 per cent.
Internal security expenditure encompasses all the expenses
associated with the police and judicial system. Private security
accounts for nine per cent of the economic impact of Violence
Containment, while peacebuilding and peacekeeping combined
account for less than one per cent.
The distribution of the economic impact of Violence
Containment varies considerably from region to region, as
shown in Figure 3.7. In 2024, the cost of violence containment in
North and Central America was $3,548 per person, significantly
higher than in any other region. In contrast, per capita spending
in both sub-Saharan Africa and South Asia was less than $500.
Table 3.4 shows the ten countries with the highest military
expenditure as a total, per capita, and as a percentage of GDP.
The United States spends the most of any country annually on
its military, followed by China, which spends less than half as
much. North Korea has the highest per capita spending and has
the highest military spending as a percentage of its GDP.
TABLE 3.4
Military expenditure: total, per capita and as a percentage of GDP, 2024
COUNTRY
MILEX
(TOTAL, BILLIONS)
COUNTRY
MILEX
(PER CAPITA)
COUNTRY
MILEX
(% OF GDP)
United States 949.21 North Korea 9929.15 North Korea 34.38
China 449.85 Qatar 5620.85 Ukraine 17.12
Russia 352.06 Singapore 4161.67 Afghanistan 15.25
India 281.74 Saudi Arabia 3983.91 Algeria 9.13
North Korea 263.11 Israel 3458.80
Palestinian
Territories
9.10
Saudi Arabia 135.30
United Arab
Emirates
3112.91 Saudi Arabia 7.24
Germany 106.81 United States 2747.94 Israel 7.15
Ukraine 102.99 Ukraine 2720.33 Oman 6.71
United Kingdom 91.05 Oman 2572.44 Mali 6.29
Japan 80.25 Kuwait 2485.26 Russia 6.12
52.
50
Global Peace Index2025 | Measuring peace in a complex world
$5,291.75
$4,617.98
$2,884.70
$2,333.52
$1,732.14
$1,389.57
$1,072.81
$648.65
sub-Saharan Africa
South America
Middle East and North Africa
South Asia
Eastern Europe and Central Asia
Western and Central Europe
Asia-Pacific
North and Central America
$0 $2,000 $4,000
CONSTANT 2024 PPP, BILLIONS
Source: IEP Calculations
0%
3%
0%
32%
2%
-1%
-2%
5%
sub-Saharan Africa
South America
Middle East and
North Africa
South Asia
Eastern Europe and
Central Asia
Western and
Central Europe
Asia-Pacific
North and
Central America
0% 10% 20% 30%
PERCENTAGE CHANGE
REGIONAL AND COUNTRY ANALYSIS
There are noticeable regional differences in the economic
impact of violence. In some regions, the Violence Containment
domain, and in particular military expenditure, accounts for
most of the economic impact, while in other regions crime and
conflict are the largest components of the economic impact of
violence.
The economic impact of violence deteriorated for six regions of
the world in 2024 and improved in two as shown in Figure 3.8.
Eastern Europe and Central Asia had the largest deterioration,
at 37 per cent. This is mostly due to increased impact in Russia,
0.7%
44.5%
46.4%
1.2%
7.2%
11.0%
31.5%
48.1%
1.1%
8.4%
5.8%
26.9%
61.2%
1.1%
5.0%
29.0%
52.2%
1.6%
1.6%
15.5% 20.0%
29.6%
18.5%
2.0%
29.9%
3.9%
45.1%
40.1%
0.8%
10.1%
0.7%
44.0%
39.5%
1.0%
14.7%
21.5%
28.8%
18.6%
3.7%
27.4%
0%
25%
50%
75%
100%
Middle East and
North Africa
North and
Central
America
Eastern Europe
and Central
Asia
Asia-Pacific South Asia Western and
Central Europe
sub-Saharan
Africa
South
America
PROPORTION
OF
REGIONAL
ECONOMIC
IMPACT
OF
VIOLENCE
Other Armed Conflict Violent Crime, Homicide
and Suicide
Internal and
Private Security
Military
Source: IEP Calculations
FIGURE 3.8
Total economic impact and change by region, 2023–2024
Ukraine, Kazakhstan and Azerbaijan. In Russia, this
deterioration can be attributed to an increase in military
expenditure, conflict deaths from Ukraine’s incursion into the
Kursk region, and the increasing impact of terrorism. The
increase in Azerbaijan was driven by increased military
expenditure due to increased weapons imports.
As shown in Figure 3.9, the greatest variation between regions
is in military expenditure. It represents 61.2 per cent of the
economic impact for the MENA region, compared to 18.5 per
cent in South America. The proportions of internal and private
security spending also vary between regions, from over 45 per
cent in South Asia to just under 32 per cent in South America.
FIGURE 3.9
Composition of the regional economic cost of violence, 2024
The Middle East and North Africa has the highest relative impact from military expenditure.
53.
Trends
51
2
Table 3.5 showsthe ten countries with the highest economic
cost of violence as a percentage of GDP. The economic cost of
violence for the most affected countries ranged from 16.8 to 41.6
per cent of their GDP. These countries tend to have
combinations of high levels of armed conflict, large numbers of
internally displaced persons, high levels of interpersonal
violence and large militaries.
In these ten countries, the economic cost of violence averaged
27.8 per cent of GDP in 2024. In contrast, among the world’s ten
most peaceful countries, the average economic cost of violence
was equivalent to 2.5 per cent of GDP.
The countries with the highest costs of violence are Afghanistan
and Ukraine. Afghanistan’s high cost can be attributed to high
military spending relative to its GDP, high internal security
costs, and high costs associated with refugees and IDPs.
Countries affected by high-intensity conflict suffer higher costs
from conflict deaths and losses from refugees and IDP, as well
as higher costs from homicide. These countries include Ukraine,
Palestine, Somalia, Burkina Faso, Colombia and the Central
African Republic.
TABLE 3.5
Countries with the highest economic cost of
violence as a percentage of GDP, 2024
There are six countries where the cost of violence is
equivalent to more than 20 per cent of GDP, and in two of
these, it exceeds 40 per cent.
COUNTRY
ECONOMIC COST OF VIOLENCE
(AS % OF GDP)
Afghanistan 41.56
Ukraine 40.92
North Korea 39.14
Syria 33.97
Somalia 24.71
Central African Republic 22.48
Colombia 19.66
Palestinian Territories 19.42
Burkina Faso 18.97
Cyprus 16.75
Average 27.75
54.
52
Global Peace Index2025 | Measuring peace in a complex world
Global Economic Conditions and
Rising Conflict Risk
• Many of the macro-economic adjustments happening
globally are likely to increase the risk of conflict in the near
future.
• In 2024, global GDP growth remained modest at 3.3 per
cent, while inflation stayed elevated at 5.8 per cent,
despite easing from its 2022 peak.
• Sub-Saharan Africa has been the largest recipient of
Official Development Assistance over the past decade, but
recent aid cuts will affect essential services and
development.
• Youth unemployment in the Middle East and North Africa
remained high, at 24.5 per cent in 2023, over ten percentage
points above the global average.
• While total global debt as a proportion of GDP has declined
slightly since 2020, public debt continues to rise, reaching $97
trillion in 2023. Debt in developing countries has been growing
twice as fast as in advanced economies since 2010.
• Debt service is placing increasing pressure on public finances,
with economically developing countries spending an average of
42 per cent of government revenue on servicing debt.
THE GLOBAL ECONOMIC OUTLOOK
The global economy in 2024 was characterised by a
mixture of factors that indicate future risk for both
economic performance and conflict. Countries in the
developing world show the highest levels of increasing
risk. GDP growth decelerated to about three per cent in
2023 and was projected to remain at three per cent in
2024, well below the average prior to the COVID-19
pandemic.38
Inflation hit multi-decade highs in 20239 due to supply
disruptions associated with the pandemic, expansionary
policies and commodity shocks. Globally, inflation in 2023
remained elevated, at around six per cent. Many emerging
markets and conflict-prone countries have suffered even
more extreme inflation. For instance, Sudan and Syria
faced triple-digit inflation in 2024.40
In the Middle East,
price increases of 20 to 30 per cent occurred in countries
like Egypt, Iran and Yemen and have caused consumer
spending to plunge.41
High inflation, especially for food
and fuel, tends to be politically destabilising and can
provoke mass protests.42
Youth unemployment is exceptionally high in some parts
of the world. In the Middle East and North Africa,
joblessness among young people is around 25 per cent.43
In advanced economies, wage gains have not kept up with
inflation for many workers, leading to strikes and wage
disputes.
Trade growth as a percentage of global GDP has stalled,
reversing a 70-year trend. In 2023, global trade expanded
by just 0.2 per cent, the weakest performance outside a
recession in 50 years.44
The worst single year contraction
occurred in 2020 due to the COVID-19 pandemic, with
global trade contracting by 8.9 per cent. Supply chain
disruptions, geopolitical rifts and protectionist policies
have all played a role. The number of government
measures restricting trade has surged in recent years.45
By 2023
there were roughly 2,600 restrictive trade interventions per year,
up from only a few hundred per year pre-2008.46
Governments
are increasingly turning to tariffs, export controls and “friend-
shoring” of supply chains.
Geopolitical tensions have become one of the biggest risks to the
global economy, with wars raging in two regions critical to the
world’s food and energy supply: Eastern Europe and the Middle
East.47
These conflicts have disrupted commodity flows,
prompting export bans and volatility that further strain trade
relations.
Another major concern and potential economic stressor is
known as ‘conflict contagion’. This can occur when one war
destabilises neighbouring states both economically and socially.
For example, the war in Ukraine disrupted trade and energy
supplies in Eastern Europe, raising tensions in countries like
Moldova and causing military mobilisation and skirmishes in
places like the South Caucasus. If global economic conditions
worsen, fragile regions could see existing conflicts escalate or
dormant disputes reignite due to weakening economic and
regional conditions. Several ‘frozen conflicts’ are at risk of
heating up due to growing state fragility.48
One response to insecurity has been higher military spending,
which can strain economies further and create a security
dilemma. NATO countries, reacting to the Russia-Ukraine war,
have boosted defence budgets to levels not seen in decades.49
While this is intended as deterrence, it also diverts resources
from social needs at a time when many European countries are
suffering from internal discontent with the established system.
Many governments are also facing unprecedented debt loads.
Global public and private debt in developing economies reached
206 per cent of GDP by the end of 2023, nearly double the 2010
level and a seven per cent increase from the prior year.50
The
World Economic Forum reports that over 50 developing
countries are spending over ten per cent of their revenues on
55.
Trends
53
2
interest payments, oftenoutstripping what they spend on
education or health.51
About 3.3 billion people live in countries
that allocate more to debt interest than to vital public services.52
Heavily indebted nations are caught in a bind: investors
demand austerity measures to restore solvency yet cutting
subsidies or raising taxes can trigger social backlash. For
example, Kenya in 2023 tried to hike taxes and reduce fuel
subsidies to alleviate its debt crisis, only to face deadly protests
in response.53
With many economies struggling to recover fully from the
pandemic and additional shocks like the Russia-Ukraine war,
the cost-of-living crisis remains a worldwide concern.
Tightening financial conditions are exacerbating debt distress,
especially in lower-income states. Weak growth further limits
governments’ capacity to provide jobs and social support. In
short, a confluence of inflation, austerity and weak growth is
creating the potential for unrest in many societies.
In summary, the global economic outlook in 2025 is one of high
uncertainty and downside risks. Should conditions deteriorate,
such as through the emergence of a new financial crisis or the
spread of geopolitical ‘conflict contagion’, many economies and
societies would find themselves under severe stress.54
REGIONAL ECONOMIC STRESSORS AND
DOMESTIC CONFLICT RISK
Hard economic times have historically been linked to surges in
civil unrest, from bread riots and general strikes to revolutions
and civil wars. When people cannot afford basic necessities or
find employment, grievances multiply against the ruling
authorities. At the same time, governments facing fiscal crises
have and limited options and often resort to repressive
measures or unpopular reforms that further inflame public
anger. While the intensity varies by region, a common thread is
evident: prolonged economic hardship is translating into
political volatility. These risks are especially high in three
regions: sub-Saharan Africa, the Middle East and North Africa,
and South America.
SUB-SAHARAN AFRICA
Sub-Saharan Africa faces converging economic stressors, most
notably rising debt, inflation, youth unemployment and food
insecurity. The region was hit hard by the pandemic downturn
and then by the global commodity inflation of 2022, which
raised import bills for fuel and food. Many African countries
also accumulated large debt levels that have become costlier to
service with rising global interest rates and weaker local
currencies. The result has been a series of debt crises and pleas
for relief. For example, Ghana defaulted on its debt in 2022 and
had to negotiate a loan program with the IMF, Zambia went
into default in 2020, and others like Ethiopia and Nigeria have
very high debt-service burdens. Angola’s debt servicing to
government revenue is over 60 per cent.
Governments under fiscal duress have taken measures that
sparked public anger. In mid-2023, Nigeria’s new
administration removed a long-standing fuel subsidy, causing
petrol prices to triple overnight and triggering protests and a
major increase in cost of living. Kenya’s attempt to raise taxes
and cut subsidies to address debt led to unrest and clashes with
police.55
These incidents echo the ‘structural adjustment’ riots
of the 1980s in Africa, when austerity was often met with
violent demonstrations.
There is a risk that economic grievances translate into broader
anti-government movements. One of the most striking trends in
Africa has been a wave of military coups in the last five years in
West and Central Africa, toppling governments in Mali, Guinea,
Burkina Faso, Niger and Gabon. While each coup has its own
context, a common underlying factor is widespread popular
frustration with failing governance, including the inability of
elected leaders to deliver economic improvement and services.
In countries in the Central Sahel region, insurgencies and
terrorism were the immediate security justifications for the
coups, where the coup leaders themselves exploited public
anger at poverty and corruption.56
Stagnant economies with
high unemployment, regional inequalities and few prospects
created an opportunity for militaries to seize power.
Fragility, conflict, and uncertainty form a vicious cycle in parts
of sub-Saharan Africa.57
Conflict undermines development, and
poor economic outcomes in turn make societies more
vulnerable to conflict and authoritarian interruptions. The new
regimes in Mali, Burkina and Niger have in some cases enjoyed
public support but their countries remain in precarious
economic shape, under sanctions or cut off from aid.
Figure 3.10 illustrates that sub-Saharan Africa remains the
world’s largest regional recipient of Official Development
Assistance (ODA), with countries like Ethiopia, Nigeria and the
Democratic Republic of the Congo all receiving substantial
foreign aid. This aid is crucial for maintaining stability and
supporting essential services like healthcare, education, and
infrastructure.
56.
54
Global Peace Index2025 | Measuring peace in a complex world
FIGURE 3.10
Regional breakdown of ODA inflows, 2014–2023
Sub-Saharan Africa has been the largest recipient of ODA over the past 10 years.
100
150
200
250
300
350
2010 2015 2020
INDEX
2010=
100
Developed countries Developing countries
Source: UNCTAD, IEP Calculations
However, recent significant reductions in aid, most
notably, the US cutting approximately 83 per cent of its
USAID programs to the region in early 2025, pose serious
risks to these fragile states. Even if some of these cuts are
restored, the most optimistic estimates still indicate a 50
per cent reduction from 2023 levels. Such cuts have
already led to the closure of health centres and the
suspension of critical programs, exacerbating
humanitarian crises and threatening the progress made
in development and stability across sub-Saharan Africa.58
The growing level of debt is also potentially fuelling
unrest in Africa. As shown in Figure 3.11, the growth of
debt has been particularly pronounced in developing
countries, outpacing debt growth in developed nations by
a factor of two since 2010. Almost 50 per cent of those
countries are in Africa.
FIGURE 3.11
Public debt growth in developed vs developing
countries, 2010–2023
Public debt in developing countries is nearly twice as high
as in developed countries.
The increase in the level of debt is leading many countries
in sub-Saharan Africa to outlay a higher percentage of
public expenditure on debt servicing, as shown in Figure
3.12. Over 80 per cent of countries in sub-Saharan Africa
spend more than 20 per cent of public expenditure on
debt servicing, the highest percentage of any region in the
world.
0%
25%
50%
75%
100%
2014 2015 2016 2017 2018 2019 2020 2021 2022 2023
PROPORTION
OF
ODA
RECEIVED
Europe & Central Asia
East Asia & Pacific
Latin America & Caribbean
Middle East & North Africa
South Asia
sub−Saharan Africa
Source: OECD
57.
Trends
55
2
FIGURE 3.12
Percentage ofcountries by debt servicing level, by region, 2023
Over 80 per cent of countries in sub-Saharan Africa spend more than 20 per cent of their total expenditure on debt servicing.
Across parts of sub-Saharan Africa, economic stress is
manifesting in different forms of internal conflict. this has taken
the form of street protests and riots against austerity or price
hikes, military coups capitalising on public disillusionment with
economic performance, and in the worst cases, state failure and
civil war where economic collapse both drives and is driven by
conflict.
THE MIDDLE EAST AND NORTH AFRICA
The Middle East and North Africa (MENA) region exemplifies
how economic grievances can ignite social upheaval. The Arab
Spring uprisings of 2011 were precipitated in large part by
economic unrest, including high youth unemployment, soaring
food prices, and lack of economic opportunity.59
In the late
2000s, global food prices jumped to historic levels, contributing
directly to unrest. For example, Egypt, the world’s largest wheat
importer, saw bread prices rise 37 per cent in 2007-2008, and
overall food inflation rose nearly 19 per cent on the eve of the
2011 revolution.60
This was then followed by large-scale
instability in other parts of the region including in Syria, Tunisia
and Libya.
Many MENA countries are once again under severe economic
strain. The pandemic and subsequent commodity shocks hit
hard in middle-income countries like Egypt, Jordan, Tunisia and
Lebanon. Egypt, for instance, saw its tourism revenue dry up
and later its import bill surge. By 2023, Egypt faced an inflation
rate of over 30 per cent, forcing millions into poverty and
prompting intermittent protests.
A similar dynamic has been seen in Lebanon. The country
has been experiencing one of the worst economic collapses
in modern history. Between 2018 and 2023, its GDP
shrank by 40 per cent, and the economic crisis has pushed
over 80 per cent of the population into poverty.61
The 2023
escalation of the conflict between Israel and Hezbollah has
further damaged the economy. The country’s economic
collapse has not yet resulted in open civil war, but it has
led to a breakdown of order and periodic unrest. The
potential for conflict in such a vacuum remains high. In
North Africa, Tunisia is facing increasing food prices, with
chronic food shortages also reported in Yemen, Syria and
Lebanon as of late 2024.62
Youth unemployment is another concern. The youth
unemployment rate in the MENA region was almost 25
per cent in 2023, almost twice as high as the global
average, as shown in Figure 3.13. Youth unemployment in
the MENA region is heavily impacted by political
instability and conflict, with many working in informal
jobs despite a rise in paid employment. Over the past two
decades, structural shifts have largely moved toward
traditional, low-productivity service sectors like trade and
transport. MENA, alongside sub-Saharan Africa, is one of
only two regions projected to see continued youth labour
force growth through 2050, heightening the urgency for
sustainable and decent job creation.63
0
25
50
75
100
sub-Saharan
Africa
South
Asia
Asia-Pacific North and
Central America
Middle East
and North
Africa
Western
and Central
Europe
Eastern
Europe and
Central Asia
South
America
PERCENTAGE
<15 15–20 >20
Source: Debt Service watch, IEP Calculations
58.
56
Global Peace Index2025 | Measuring peace in a complex world
FIGURE 3.13
Unemployment, MENA vs rest of the world, since 2000
Youth unemployment in MENA is more than five percentage points higher than the global average.
The MENA region remains highly vulnerable to civil
unrest and insurgency fuelled by economic hardship. The
current global context of high food prices and debt
servicing is applying pressure on countries that were
already economically fragile and facing existing security
crises.64
SOUTH AMERICA
South America entered the 2020s with a legacy of
economic inequality and periodic debt crises that have
frequently sparked social turmoil. The recent global
inflation wave hit several South American countries hard,
given the region’s history of price instability. In 2023,
Argentina’s inflation rate exceeded 200 per cent,
impoverishing millions and eroding trust in mainstream
politicians.65
The economic pain contributed directly to
political disruption, and in late 2023, voters elected a
government from a new political coalition after losing
patience with other parties’ failure to tame inflation.66
Other countries in the region have seen similar dynamics.
Ecuador and Peru experienced waves of protests in recent
years, partly triggered by fuel price hikes and high living
costs. Chile experienced violent protests in 2019, initially
sparked by a transit fare increase. In Venezuela, an
extreme case, years of hyperinflation under an
authoritarian regime led to a humanitarian crisis and the
exodus of millions of refugees. While mass protests did
occur, the government’s heavy repression largely
suppressed open conflict, leading instead to a slow-
burning social collapse.
Figure 3.14 shows the trend in consumer price index (CPI)
since 2010 in South America. The rising CPI across the
region highlights ongoing economic challenges, including
currency depreciation, high inflation, and governance
limitations in effectively controlling cost-of-living increases.
When commodity prices were high early in the decade, food and
fuel became more expensive. As economic growth slowed,
weaker currencies further increased import costs, compounded
by monetary expansion. Inflation from 2020 to 2024 was driven
by pandemic-related supply chain issues and stimulus packages.
A strong US dollar and higher global interest rates kept regional
currencies under pressure, so imported inflation also played a
role.
10
20
2000 2005 2010 2015 2020 2025
RATE
(%)
Age (Youth, adults): 15-24
Age (Youth, adults): 25+
MENA
World
Source: ILO, IEP Calculations
One promising factor is that foreign debt levels are generally
lower relative to GDP than they were in the 1980s, but the risk
remains that economic pain could escalate into instability.
Governments across the region are trying to curb inflation and
restore fiscal order without igniting mass protests against
austerity. South America’s conflict risk manifests primarily as
social unrest prompted by economic shocks, and those risks are
elevated in the current climate of price instability and slow
growth.
58
Global Peace Index2025 | Measuring peace in a complex world
Methodology at a Glance
The global economic impact of violence is defined as the
expenditure and economic effects related to containing,
preventing, and dealing with the consequences of violence. The
estimate includes the direct and indirect costs of violence, as
well as an economic multiplier. The multiplier effect calculates
the additional economic activity that would have accrued if the
direct costs of violence had been avoided.
Expenditure on containing violence is economically efficient
when it effectively prevents violence for the least amount of
spending. However, spending beyond an optimal level has the
potential to constrain a nation’s economic growth. Therefore,
achieving the right levels of spending on public services such as
military, judicial and security services is important for the most
productive use of capital.
This study includes two types of costs: direct and indirect.
Examples of direct costs include medical costs for victims of
violent crime, capital destruction from violence and costs
associated with security and judicial systems. Indirect costs
include lost wages or productivity from crime due to physical
and emotional trauma. There is also a measure of the impact of
fear on the economy, as people who fear that they may become a
victim of violent crime alter their behaviour.
An important aspect of IEP’s estimation is the international
comparability of country estimates, thereby allowing cost/
benefit analysis of country interventions. The methodology uses
constant prices purchasing power parity (PPP) international
dollars, which allows for the costs of various countries to be
compared with one another. By using PPP estimates, the
analysis takes into consideration the differences in the average
level of prices between countries. For instance, if the US dollar
cost of a basket of goods in country A is higher than the US
dollar cost of the same basket of goods in country B, then one
US dollar will have a lower purchasing power in country A than
in B. Thus, an expense of a certain amount of US dollars in
country B will be more meaningful than a similar expense in
country A. IEP’s use of PPP conversion rates means that the
estimates of the economic impact of violence accurately
captures the true significance of that impact or expense in each
country.
IEP estimates the economic impact of violence by
comprehensively aggregating the costs related to violence,
armed conflict, and spending on military and internal security
services. The GPI is the initial point of reference for developing
the estimates for most variables, however some variables are not
in the GPI, such as suicide, and are calculated separately.
The 2025 version of the economic impact of violence includes 15
variables in three groups, shown in Table 3.5.
The estimation only includes variables of violence for which
reliable data could be obtained. The following elements are
examples of some of the items not counted in the economic
impact of violence:
• The cost of crime to business
• Domestic violence
• Household out-of-pocket spending on safety and security
• Spillover effects from conflict and violence
A unit cost approach was used to cost variables for which
detailed expenditure was not available. The unit costs were
obtained from a literature review and appropriately adjusted for
all countries included. The study uses unit costs from
McCollister, French and Fang for homicides, violent and sexual
crimes.67
The McCollister, French and Fang cost of homicides is
also used for battle deaths and deaths from terrorism. The unit
cost for fear of crime is sourced from Dolan and Peasgood.68
• Direct costs are the cost of violence to the victim, the
perpetrator and the government. These include direct
expenditures, such as the cost of policing, military, and
medical expenses. For example, in the calculation of
homicides for a given country, the total number of homicides
is computed and multiplied by the unit costs estimated by
McCollister, French and Fang. The result is updated and
converted using country specific inflation and exchange
rates.
• Indirect costs accrue after the violent event and include
indirect economic losses, physical and physiological trauma
to the victim, and lost productivity.
• The multiplier effect represents the flow-on effects of
direct costs, such as the additional economic benefits that
would come from investment in business development or
education, instead of the less-productive costs of containing
or dealing with violence. Box 3.1 provides a detailed
explanation of the peace multiplier used.
The term economic impact of violence covers the combined
effect of direct and indirect costs and the multiplier effect, while
the economic cost of violence represents the direct and indirect
costs of violence. When a country avoids the economic impact of
violence, it realises a peace dividend.
61.
Trends
59
2
BOX 3.1
The multipliereffect
The multiplier effect is a commonly used economic concept,
which describes the extent to which additional expenditure
improves the wider economy. Every time there is an injection
of new income into the economy, this will lead to more
spending, which will in turn create employment, further
income and additional spending.This mutually reinforcing
economic cycle is known as the “multiplier effect” and is the
reason that a dollar of expenditure can create more than a
dollar of economic activity.
Although the exact magnitude of this effect is difficult to
measure, it is likely to be particularly high in the case of
expenditure related to containing violence. For instance, if a
community were to become more peaceful, individuals would
spend less time and resources protecting themselves against
violence. Because of this decrease in violence there are likely
to be substantial flow-on effects for the wider economy, as
money is diverted towards more productive areas such as
health, business investment, education and infrastructure.
When a homicide is avoided, the direct costs, such as the
money spent on medical treatment and a funeral, could be
spent elsewhere.The economy also benefits from the lifetime
income of the victim.The economic benefits from greater
peace can therefore be significant.This was also noted by
Brauer and Tepper-Marlin (2009), who argued that violence
or the fear of violence may result in some economic activities
not occurring at all.69
More generally, there is strong evidence to suggest that
violence and the fear of violence can fundamentally alter the
incentives for business. For instance, an analysis of 730
business ventures in Colombia from 1997 to 2001 found that
with higher levels of violence, new ventures were less likely
to survive and profit. Consequently, with greater levels of
violence, it is likely that we might expect lower levels of
employment and economic productivity over the long-term,
as the incentives faced discourage new employment creation
and longer-term investment.
This study assumes that the multiplier is one, signifying that
for every dollar saved on violence containment, there will be
an additional dollar of economic activity.This is a relatively
conservative multiplier and broadly in line with similar studies.
62.
Countries with thehighest risk factors to their
conflicts are the Democratic Republic of the Congo,
South Sudan, Syria, and in the conflict between
Ethiopia and Eritrea. All have current conflicts that
could become substantially worse.
The world is facing a violent
conflict crisis. There were 59
state-based conflicts in 2023,
the highest number since the
end of World War II.
Fewer violent conflicts now end with a peace deal or clear victory. Since the
1970s, the percentage of conflicts that end with a clear victory has dropped
from 49 per cent, to nine per cent, while the proportion of conflicts ending in
peace agreements has fallen from 23 to four per cent.
IEP has identified nine major
factors which increase the
likelihood that conflict will
increase in intensity or severity.
These factors have played a key role
historically in increasing the severity of
conflict, including in the Spanish, Greek,
and Sri Lankan civil wars, the ongoing
conflict in Sudan, and Ethiopia’s recent
Tigray war.
IEP was able to assess the strength of these nine factors for 62 state-
based conflict dyads. Of these 62 conflicts, 22 per cent had at least one
escalation factor with the maximum possible score of five, and all 62 dyads
had at least one escalation factor with a score of at least three out of five,
indicating that it had a significant escalation risk.
Deaths from state-based violent
conflict reached a 32-year high
in 2022. Although the number
of deaths is below levels seen
during the Cold War, the sheer
number of active conflicts
increases the risk of at least one
conflict rapidly escalating.
The risk of conflict escalation can clearly be seen
when looking at the conflict in Kashmir. An April
2025 terror attack in the region sparked reprisals
and halted dialogue, bringing nuclear-armed
India and Pakistan closer to open war.
60
Global Peace Index 2025 | Measuring peace in a complex world
59
The number of internationalised intrastate
conflicts have increased 175 per cent since
2010. Seventy-eight countries were directly
involved in a war beyond their borders in 2023.
countries
78
9
62
Global Peace Index2025 | Measuring peace in a complex world
Overview
The results of the 2025 GPI reveal that global peacefulness continues to decline, with the number of active
conflicts rising across the world. The longer-term trend is even more alarming, with more countries involved in
conflicts outside their borders and fewer wars and violent conflicts ending through negotiated settlements.
The international conflict-management system is overstretched
at precisely the moment geopolitical fragmentation is increasing,
and political appetite for external mediation and peacebuilding
has fallen. Given these conditions, identifying where
peacebuilding can deliver the greatest gains has become even
more crucial.
Identifying where conflict prevention efforts can have the
greatest impact requires an understanding of the factors that
lead to conflicts intensifying. Last year’s GPI identified several of
the key characteristics of war in the 21st
century. It noted that
Ukraine, Gaza and Ethiopia were the world’s three most intense
theatres of war in 2023, yet only a few years earlier Ukraine and
Gaza were classified as low-level conflicts and Ethiopia’s Tigray
war had not begun.
A host of factors, ranging from low GDP per capita to a history
of previous violence, affect conflict onset, duration and
termination. This section extends the analysis from last year’s
GPI, by examining which factors distinguish the wars that
escalate into high-severity or high-intensity conflicts, marked by
exceptionally large numbers of battle or civilian deaths. This
research aims to address the following two questions:
• Why do some conflicts experience periods of extreme violence?
• What makes certain wars more lethal than others?
This section of the report looks firstly at conflict trends in the
21st
century. Secondly, it identifies nine key factors that are
strongly associated with conflict escalation. Thirdly, it looks at
historical examples of conflicts that have escalated, and the role
played by some or all of these key factors. Finally, it looks at the
emerging conflict landscape and assesses the potential for an
existing conflict hotspot to rapidly escalate.
TRENDS IN CONFLICT
The world appears to be at a tipping point, with many smaller
conflicts threatening to erupt into larger scale conflicts and the
resources available to preventing conflict contracting.
However, it should be noted at the outset that although the
number of deaths from armed conflict was at a 30-year high in
2022, the total number of conflict deaths remains considerably
lower than at many points in the post-World War II era, as
shown in Figure 4.1. The steep decline in battle deaths coincided
with the end of the Cold War in 1991. There were more than
200,000 battle deaths in 24 out of the 53 years between 1946
and 1999, compared to just one year so far in the 21st
century.
The average number of deaths per year between 1946 and 1999
was almost 210,000, compared to just under 69,000 per year
between 2000 and 2023. However, the trend is on the rise again,
and given increasing geopolitical fragmentation and the rise in
influence of middle-power countries, there is a real risk of a
return to the level of fatalities seen in the Cold War era.
0
200,000
400,000
600,000
1950 1960 1970 1980 1990 2000 2010 2020
BATTLE
DEATHS
PRIO UCDP
Source: PRIO, UCDP
FIGURE 4.1
Total battle deaths, 1946–2023
Battle deaths are still well below the levels seen in the mid-20th
century.
65.
Trends
63
2
Although the averagenumber of deaths so far in the 21st
century
is much lower than in the preceding 50 years, the total number
of conflicts is now higher than at any point since World War II.
This implies that there is more potential for major conflicts to
erupt.
For example, the Russia-Ukraine War, Israel-Palestine War and
various subnational conflicts in Ethiopia were minor conflicts in
2019. Ethiopia’s Tigray war was not even considered a conflict
prior to 2020, but it quickly escalated to be the deadliest conflict
since the Rwandan genocide. There were 59 conflicts in 2023
where at least one actor involved was a state, as shown in Figure
4.2. This number rises even higher when including non-state
conflicts and instances of one-sided violence, with a further 75
and 42 conflicts respectively.
0
20
40
60
1960 1980 2000 2020
NUMBER
OF
CONFLICTS
Extra-systemic Internationalised Intrastate Interstate Intrastate
Source: UCDP/PRIO Armed Conflict Dataset
The total number of conflicts involving a state has increased by
over 50 per cent since 2010. However, as can be seen in the
above figures, the increase has not been constant across the four
different types of state-based conflicts. A short summary of each
of these types of conflicts is as follows:
• Extra-systemic Conflict: This involves a state battling a
non-state group outside its own territory. Most colonial wars
of independence fall into this category.
• Interstate Conflict: Both conflicting parties are recognised
sovereign states.
• Intrastate Conflict: This type of conflict occurs within a
single country, where the government is fighting against one
or more domestic rebel groups without any foreign military
intervention.
• Internationalised Intrastate Conflict: Similar to
intrastate conflict, but with the significant distinction of
foreign governments participating with troops, supporting
either the government or the rebels.
FIGURE 4.2
Number of state-based conflicts by type, 1946–2023
The total number of state-based conflicts is now higher than at any point since WWII.
There was very little change in the number of interstate and
intrastate conflicts between 2010 and 2023. However, over the
same period the number of internationalised intrastate conflicts
increased by over 175 per cent. Many of these conflicts involve
large regional or international coalitions engaged in
peacekeeping or stabilisation operations. In 2023, there were 78
countries that were involved in at least one internationalised
intrastate conflict, up from 59 in 2008.
There has also been a considerable shift by region, with more
and more middle-power nations across multiple regions
becoming involved in external conflicts. The most striking
example of this is in sub-Saharan Africa, where 36 of the 42
countries in the region were involved in at least one external
conflict between 2018 and 2023, compared to just seven
countries in the region for the period 2002 to 2006.
In the 21st
century, the overall number of conflicts has increased,
but the number of fatalities and intensity of these conflicts has
not increased at the same rate. There are a larger number of
conflicts, many of which now involve some form of external
intervention.
As shown in Figure 4.3, the average number of conflict dyads
per conflict has almost doubled, meaning the average conflict
today involves nearly twice as many rival actor pairings as in the
1950s. A conflict dyad is defined as a pair of opposing armed
actors, such as a government and a rebel group, that are
engaged in conflict. To count as an armed conflict, there must be
at least 25 deaths in a calendar year.
66.
64
Global Peace Index2025 | Measuring peace in a complex world
FIGURE 4.3
Number of conflict pairings per conflict,
1950–2019
The average number of dyads per conflict has almost
doubled since the 1950s.
The increase in the number of dyads per conflict reflects a shift
in the nature of conflict, wherein more armed groups are
involved in a single conflict event. This takes the form of not
only external combatants becoming involved in a civil conflict,
but also multiple rebel groups opposing a government, or even
fighting against each other, all within the same conflict. As one
rebel group is defeated or merges with other groups, new
groups might emerge to continue fighting and prolong the
conflict. This makes solving conflicts much more difficult.
As more groups have become involved in armed conflicts, there
has also been a significant shift in the way conflicts end. Figure
4.4 shows how conflicts have ended for every decade from the
1950s to the 2010s.
The biggest shift that has occurred over this period is the
increase in the percentage of conflicts that end through being
classified as low activity but with no negotiated outcome,
leaving the possibility of further escalation. The number of
conflicts ending in ceasefire has remained steady, which points
towards many conflicts being left unresolved. Coinciding with
this is a decrease in the percentage of conflicts that end through
a clear victory for either the government or the non-state side.
This holds true for both major and minor conflicts, where a
major conflict is defined as one where at least one year resulted
in more than 1,000 deaths. Since the 1970s, the percentage of
conflicts that have ended with a clear victory has dropped from
49 to nine per cent.
1
2
3
4
5
1950s 1960s 1970s 1980s 1990s 2000s 2010s
AVERAGE
DYADS
PER
CONFLICT
Source: UCDP ACD, IEP Calculations
0%
25%
50%
75%
100%
1950s 1960s 1970s 1980s 1990s 2000s 2010s
PERCENTAGE
OF
CONFLICTS
Peace Agreement
Ceasefire
Government Victory
Non-State Victory
Group Ends
Low Activity
Source: UCDP Conflict Termination Dataset, IEP Calculations
FIGURE 4.4
How conflicts end, 1950–2019
Conflicts are now far less likely to end with either some of kind of formal agreement or with one side being clearly victorious.
67.
Trends
65
2
Conflict Escalation Factors
Afghanistan
Brazil
BurkinaFaso
Central African Republic
Colombia
DR Congo
Ethiopia
India
Iraq
Israel
Libya
Mali
Mexico
Myanmar
Nepal
Nigeria
Pakistan
Philippines
Russia
Somalia
South Sudan
Sri Lanka
Sudan
Syria
Ukraine
Yemen
2002 2004 2006 2008 2010 2012 2014 2016 2018 2020 2022 2024
Source: UCDP GED, IEP Calculations
FIGURE 4.5
Monthly conflict deaths in countries with more than 10,000 deaths, 2002–2024
Most conflicts do not escalate rapidly, but some can have substantial increases in deaths in just months.
Although the number of state-based conflicts is now higher than at any time since the end of World War II, and
the number of non-state conflicts is near a record high, not all of these conflicts are equally likely to escalate.
Many relatively deadly conflicts can continue for a long time
without large increases in violence, while others may experience
extreme violence over a very short period. This can be seen in
Figure 4.5, which shows the relative level of monthly conflict
deaths by country from 2002 to 2024. Only countries with more
than 10,000 total deaths in this period are included in the
figure.
The time-series makes clear that many of the world’s deadliest
conflicts simmer for years at a relatively steady pace. Countries
such as Pakistan, the Philippines and Mexico rarely registered
dramatic single-month surges in the past two decades, yet
persistent violence accumulates into heavy tolls. Afghanistan
and the Democratic Republic of the Congo illustrate the same
pattern on a larger scale: long stretches of monthly fatalities in
the hundreds or low thousands, interrupted only occasionally
by sharper peaks.
By contrast, a smaller set of conflicts erupt with brief but
ferocious intensity. Syria’s civil war escalated almost overnight
to become the deadliest conflict in the world in the early 2010s.
Ethiopia’s Tigray war and Russia’s invasion of Ukraine show
similar vertical spikes, with single-month fatality totals higher
than any other country. In Ethiopia’s case, almost all of the
killings occurred in a single year. Such sudden escalations
overwhelm humanitarian systems, trigger mass displacement
and can redraw geopolitical fault lines. Understanding why
conflicts escalate rapidly is thus crucial for preventing such
escalations in the future.
There are many possible factors that contribute to the likelihood
of conflicts escalating in intensity and severity. This section
provides an overview of nine key factors selected from a review
of data and academic literature. These nine factors are outlined
in Table 4.1.
68.
66
Global Peace Index2025 | Measuring peace in a complex world
TABLE 4.1
Conflict escalation factors
Conflict Escalation
Variable
Impact on Conflict Example Conflicts
Urban origin onset
Immediate and potentially existential threat to regime, significant resources within
urban areas, high populations can result in more severe conflicts.
Sudan civil war
(2023-present), South Sudan
civil war (2012-2018), Syrian
civil war (2011-2024).
Accessible terrain
Higher accessibility inhibits actors, especially non-state actors, from hiding and
avoiding direct confrontation with more powerful state forces.
Russia-Ukraine war, Sudan
civil war, Tigray war.
High logistical supply
Warfare is a logistically intensive endeavour. High logistical supply supports the
ability to fight with the significant, overwhelming force associated with the most
violent conflicts.
Syrian civil war, Russia-
Ukraine war, Mexican cartel
wars.
Non-state actor heavy
weapons
The provision of heavy weapons - e.g. artillery, aircraft, etc - gives significant high
lethality capacity to rebel groups who may choose to seek direct confrontation with
government forces.
Tigray war, Syrian civil war,
Sudan civil war, Afghanistan
war, Yemen civil war.
Significant external
support
External actors provide significant military support in forms including arms, logistics,
troops, intelligence, and safe haven, so they have higher capacity to fight more
deadly wars.
Yemen civil war, Sudan civil
war, Syrian civil war, Wars in
Eastern DRC.
Private military
contractors
Private military contractors often have significantly higher warfighting capacity in
terms of training and materials, and are prepared to use significant force to achieve
their contracted terms.
Malian civil war, Iraq War,
Syrian civil war.
High levels of ethnic
exclusion
Higher levels of ethnic exclusion, where one ethnic group dominates for example,
is linked to more severe conflicts where the outcome could be considered more
existential for the excluded or in-power groups.
Myanmar civil war, South
Sudan civil war, Syrian civil
war, Malian civil war.
Fratricidal coercion
Fratricidal coercion is a military strategy where a state or non-state actor enforces
compliance by harshly punishing disobedience and desertion, often with execution,
which leads to higher death tolls as forces are willing to follow even highly deadly
commands.
Russia-Ukraine war, Syrian
civil war.
Conflict
instrumentalisation
Conflict instrumentalisation can escalate the severity of conflict by entrenching
nationalist or ideological narratives over top of existing smaller conflicts, justifying
aggressive policies and mobilising public support for military action, thereby
reducing space for negotiation and increasing the likelihood of sustained or
intensified violence.
Darfur civil war, Eastern DRC
wars, Malian civil war.
The presence of these factors does not guarantee that a conflict
will escalate, nor does the presence of all factors necessarily
make escalation more likely than in cases where only some are
present. Each factor may vary in intensity and interact with the
other factors, as well as with broader socio-economic and
political dynamics. Nevertheless, on average, conflicts in which
these factors are present are more likely to escalate than those in
which they are absent.
GEOGRAPHIC PATH DEPENDENCIES
Recent research shows that conflict intensity is associated with
path dependencies linked to their place of onset. Peripheral
rebellions, far from capitals, tend to be less intense but last
longer. Conflicts sparked by coup attempts tend to be shorter but
much more intense. Conflicts triggered by state disintegration
are likely to be both high intensity and long in duration.70
The geographic setting of conflict onset plays a decisive role in
shaping both severity and duration. Violence that breaks out in
densely populated urban centres, particularly national capitals,
directly threatens the political core of the state and frequently
involves forces with greater organisation and firepower than
insurgencies launched from peripheral regions. Proximity to
powerful institutions and access to well-trained troops, such as
factions of the regular military involved in coup attempts, enable
non-state actors to mount immediate, potentially deadly
challenges to the ruling regime. States respond by mobilising
extreme force, accelerating the pace and lethality of combat.
The reverse dynamic applies where terrain is highly challenging,
or communities are socially and culturally distant from the
centre. Inaccessibility can increase the likelihood of rebellion and
conflict onset and prolong hostilities by impeding government
control and complicating negotiations. However, such
inaccessibility can also restrain large-scale operations and
prevent a conflict from escalating rapidly. Battles in remote
borderlands, mountainous zones or other hard-to-reach areas
rarely endanger a government’s grip on the heartland, reducing
incentives for either side to deploy overwhelming force. Armed
groups based in such locations often lack the material capacity to
sustain high-intensity warfare, further limiting escalation.71
69.
Trends
67
2
Inaccessible terrain isclosely associated with protracted
conflicts, yet it rarely produces the highest casualty counts.
Mountain ranges, dense forests and other hard-to-reach
landscapes provide insurgents with natural strongholds,
encouraging guerrilla tactics that favour small-unit skirmishes
over large, set-piece battles. Recent cases in Myanmar, Nepal
and Afghanistan, as well as the Kurdish struggle across several
Middle Eastern countries, illustrate this pattern. Fighting
stretches on for years or even decades, but monthly death tolls
remain relatively modest compared with the world’s most lethal
wars.
Difficult geography places severe constraints on state forces,
which must overcome steep logistical hurdles to move troops,
ammunition and heavy equipment. The resulting supply
bottlenecks limit the size and frequency of engagements,
dampening overall violence even as they lengthen hostilities.
This dynamic has appeared across conflict types, from partisan
resistance in Nazi-occupied Belarus during World War II to
several modern African civil wars. Rugged terrain, therefore, is a
consistent indicator of long-running warfare but a weak
predictor of the extreme lethality seen in high-intensity conflicts
fought on more accessible ground.72
GROUP DYNAMICS
Ethnic exclusion has been shown to exacerbate the severity of
violence in civil wars. When a government marginalises certain
ethnic groups, it creates deep grievances and a polarised ‘us
versus them’ dynamic. Conflict involving excluded communities
often becomes a life or death struggle, leaving little room for
compromise. Regimes facing rebellion from an excluded group
may respond with extreme brutality, viewing the entire ethnic
community as complicit and effectively framing the conflict in
group-survival terms. Regimes confronting multiple excluded
ethnic groups tend to escalate violence to deter other potential
challengers, and to quickly defeat the insurgency by destroying
its civilian support base
. Governments fighting under such
conditions are more likely to perpetrate genocide or politicide
during a civil war
.73
This reflects a broader pattern wherein
political exclusion heightens conflict intensity by encouraging
indiscriminate violence and collective punishment strategies.
Lacking inclusion, excluded groups also have greater incentives
to fight for some share of power in a zero-sum game, further
fuelling high casualty levels.
EXTERNAL SUPPORT
External involvement is pervasive in high-severity civil wars,
and most modern intrastate conflicts receive some form of
foreign military assistance.74
Across the world, many conflicts
involve an increasing number of external supporters. Direct
military intervention is now the predominant mode of support.
External assistance takes many forms, from arms transfers,
funding and intelligence sharing, to training and the
deployment of combat troops. External support often prolongs
civil wars, as arms or funding for insurgents bolster their
capabilities and delay termination. External military aid tends
to lengthen conflicts by preventing quick victories, unless one
side receives overwhelming backing that enables a decisive win.
Such support also escalates violence, as outside backing,
especially for rebel forces, significantly increases conflict
severity.75
External support is also linked to increased risks of
mass atrocities including genocide.76
However, in some circumstances external support to rebels can
lead to a reduction in conflict intensity, if that support comes in
the form of major conventional weapons. Rebel groups with
these capabilities, but lacking external support, are not
constrained in their behaviour or strategy and will seek direct
confrontation.
External support can also come in the form of private military
and security companies (PMSCs), whose presence is linked to
heightened conflict severity. Both governments and rebel
factions that hire PMSCs effectively inject additional
professional firepower into the conflict, escalating the bloodshed
and destruction.77
Weak-state governments may also contract
PMSCs as a deliberate escalation strategy to recapture territory
from insurgents
. Contractors either substitute for or augment
state forces, enabling major offensives and substantially raising
conflict lethality
.78
Across multiple conflicts, empirical evidence
confirms that civil wars with PMSC involvement experience
significantly higher fatalities, indicating greater severity
,
regardless of which side deploys them.
TACTICS AND IDEOLOGY
Certain military tactics may also lead to much higher battle
deaths in conflict. For example, fratricidal coercion is the
deliberate threat or application of violence by military
authorities against their own soldiers to deter desertion, enforce
discipline and compel obedience in battle. Unlike accidental
friendly fire, it is an intentional, top-down instrument of control
that relies on fear to sustain battlefield performance.
Soldiers from areas with government repression are more likely
to fight to the death due to conditioning towards induced
obedience.79
Regimes which employ fratricidal coercion to
enforce compliance and reduce desertions or retreats generally
see higher death tolls, fewer medals and military honours
awarded, and are less likely to win wars. Regimes and some
non-state actors often employ fratricidal coercion in the form of
blocking detachments, which are special military units deployed
behind the frontline to prevent or block retreat or desertion.80
Additionally, conflict instrumentalisation refers to a school of
thought which argues that minor conflicts can be
instrumentalised by outside actors to advance their own
interests. This can involve co-opting narratives or overlaying
new ideological framings onto existing conflicts which
previously lacked them.81
While instrumentalisation can lead to
minor and major conflicts, it can often escalate levels of
violence, especially where existing conflicts are augmented with
national or transnational dynamics.
70.
68
Global Peace Index2025 | Measuring peace in a complex world
Case Studies
Examining conflicts from the past 100 years demonstrates that, despite shifting geopolitical contexts,
certain drivers consistently propel wars toward higher intensity. To gauge how escalation factors recur
across eras, a cross-temporal analysis was carried out on six intrastate wars that registered major surges
in violence owing to at least one of the nine factors identified above.
The Spanish Civil War (1936-1939) exemplifies the interaction
between extensive external backing, well-supplied non-state
forces and access to heavy weaponry. Foreign intervention not
only magnified the scale of fighting but also foreshadowed the
broader escalation dynamics that would soon engulf Europe in
World War II. The Greek Civil War (1946-1949), often regarded
as the first large clash of the Cold War, combined great-power
involvement with village-level struggles rooted in pre-existing
local rivalries, illustrating how macro and micro factors can
intersect to intensify violence.
The Guatemalan Civil War (1960-1996) offers a contrasting
model of escalation. Conflict lethality surged during the early
1980s after a government coup coincided with shifting regional
and global alignments, enabling a violent campaign against
indigenous communities perceived as rebel sympathisers. The
Sudanese Civil War (2023-present) provides a contemporary
parallel in which a relatively contained dispute in Darfur during
the late 1980s escalated significantly: first into the 2003-2005
genocide and ultimately into today’s nationwide civil war.
The Sri Lankan Civil War (1983-2009) underscores how
prolonged guerrilla conflicts can pivot to high-intensity
conventional warfare when external support shifts and
combatants acquire more advanced capabilities. Finally,
Ethiopia’s recent Tigray war (2020-2022) represents the most
lethal country-year of conflict since the Rwandan genocide,
demonstrating how political fractures within a governing
coalition, combined with many of the same escalation drivers
identified in earlier cases, can propel violence to exceptional
levels. Together, the six case studies confirm that external
assistance, logistical capacity, terrain, and proximity to political
power repeatedly shape whether civil wars escalate.
SPANISH CIVIL WAR (1936–1939)
TABLE 4.2
Spanish civil war escalation factors
Conflict Escalation Variable Present?
Urban origin onset Yes
Accessible terrain Yes
High logistical supply Yes
Non-state actor heavy weapons Yes
Significant external support Yes
Private military contractors Yes
High levels of ethnic exclusion No
Fratricidal coercion Yes
Conflict instrumentalisation Yes
Eight of the nine escalation factors were present in the Spanish
Civil War, which was rooted in Spain’s deep social and political
fissures in the 1930s. It erupted after years of ideological
polarisation during the Second Spanish Republic, as left-wing
reforms and right-wing reactions bitterly divided society. A host
of unresolved issues such as land ownership, church influence,
regional autonomy, and class tensions created the conditions for
war.82
In February 1936, a leftist Popular Front government was
elected, but in July 1936, a group of generals led a coup d’état
against the Republic. The coup only partially succeeded,
splitting Spain between the Republican loyalists and the
Nationalist rebels. Both sides claimed legitimacy, using the
underlying fractures in Spanish society to instrumentalise and
mobilise the whole country. The conflict quickly escalated into
full-scale civil war.83
Unlike many guerrilla insurgencies, the Spanish Civil War was
fought as a conventional war between two organised armies of
considerable size with consistent logistical support that fought
in cities and other more accessible terrain, as well as in
mountainous areas. By 1938, roughly one and a half million
combatants were engaged along mostly stable fronts. This
symmetrical force-on-force warfare produced intense battles
with visible front lines, a dynamic known to be especially deadly
for combatants. The Republican camp, while defending a legally
elected government, was internally divided between
communists and anarchists. The Nationalists, led ultimately by
General Francisco Franco, capitalised on military discipline and
external support.
Crucially, foreign intervention and external support intensified
the conflict: Adolf Hitler and Benito Mussolini sent planes,
tanks and troops to aid Franco, while the Soviet Union provided
arms and advisors to the Republican side and facilitated the
International Brigades of foreign volunteers. These forms of
external support helped turn Spain into a proxy battleground
for competing ideologies. Nazi Germany, for example, used
Spain as a testing ground for new military technology and
tactics, including aerial bombing of civilians in Guernica, where
German condor legions bombed the city in April 1937.84
This
internationalisation of the war escalated its severity and
foreshadowed the wider conflict of World War II.
The Spanish Civil War reached extreme levels of violence both
on the battlefield and against civilians, with two major phases of
bloodshed. The first came early in the war, when chaos and
revolutionary fervour led to large-scale extrajudicial killings in
the rear-guard of both sides. Within the first months,
Republican militias murdered thousands of suspected
Nationalist supporters, clergy, and right-wingers in a period
often termed the “Red Terror”, even as Nationalist forces carried
out systematic massacres of leftists, trade unionists and liberals
in conquered areas, known as the “White Terror”. Civilians in
contested villages often became victims if labelled as enemies by
the controlling faction, a pattern demonstrating that violence
71.
Trends
69
2
against civilians inconventional civil wars is often strategic,
used to punish or eliminate enemy supporters in contested
zones.85
There is evidence to suggest both sides also employed fratricidal
coercion, executing deserters and enforcing repressive coercive
practices within fighting units. While there were no private
military companies in the civil war, there were many non-
Spanish military actors, such as North African troops that
fought with Nationalist forces and German, Italian and Russian
troops that fought for both sides. Additionally, there were
thousands of foreign fighters who fought for Republican forces
under the International Brigades as volunteers.
The second phase of violence came after the end of the war,
when Franco’s regime unleashed a sweeping campaign of
repression to cement its rule. Tens of thousands of Republicans
were executed or imprisoned under brutal conditions. An
estimated 100,000 defeated Republicans were executed in the
immediate post-1939 purge, and many more died from
starvation, disease or abuse in prisons and concentration
camps.86
In total, estimates suggest that about 500,000 people died as a
direct result of the war. Of these, roughly 200,000 were
combatants killed in action. In addition, Nationalist forces
executed approximately 75,000 civilians during the conflict,
while Republican factions are estimated to have killed 55,000.
Around three per cent of Spain’s population perished, and
another seven per cent or more were left wounded or displaced,
making the war one of the most devastating in modern
European history.
GREEK CIVIL WAR (1946–1949)
TABLE 4.3
Greek civil war escalation factors
Conflict Escalation Variable Present?
Urban origin onset No
Accessible terrain Mixed
High logistical supply Yes
Non-state actor heavy weapons Yes
Significant external support Yes
Private military contractors No
High levels of ethnic exclusion No
Fratricidal coercion No
Conflict instrumentalisation Yes
The Greek Civil War was a conflict between the Democratic
Army of Greece (DAG), which was the military arm of the
Communist Party of Greece (KKE), and the Greek government,
royalist and centrist forces, backed by Britain and later the
United States. It was the culmination of bitter divisions sown
during the World War II occupation, when rival partisan groups,
primarily the leftist EAM–ELAS and various right-wing or
monarchist forces, vied for influence. The war’s roots lay in both
internal strife, in the form of a polarised struggle between left
and right, and external Cold War geopolitics. It became the first
major episode of the Cold War.
Greek communist leaders were supported by neighbouring
socialist regimes in Yugoslavia, Albania and Bulgaria. Opposing
them was the Greek National Army, loyal to the Athens
government and the restored King, and aided by British military
presence and massive US military and economic aid under the
Truman Doctrine. The struggle was thus both an ideological civil
war over Greece’s governance and a proxy battleground of
East-West interests. Importantly, the conflict was not a simple
two-sided affair. Local militias and paramilitary bands also
proliferated. Right-wing “Security Battalions” and other
anti-communist gangs persecuted leftist civilians in a “White
Terror” after 1945, while communist partisans targeted
opponents as “collaborators”, deepening a cycle of retributive
violence. These reprisals and purges on both sides set the stage
for open warfare.
Open hostilities began in March 1946. In 1946 and 1947, the DAG
waged guerrilla warfare across the mountainous countryside,
assassinating officials and ambushing government outposts.
Violence against civilians in this period was strategic, with each
side using selective terror to coerce loyalties and obtain local
intelligence.87
Zones of contested authority, such as villages
caught between insurgent and government control, saw the most
intense persecution as informants and rival partisans settled
scores. The national ideological struggle was filtered through
local feuds and vendettas, with village-level politics heavily
shaping who sided with whom, which showed very clear signs of
conflict instrumentalisation.88
By late 1947, the scale of conflict had escalated with the
transformation of the DAG from a hit-and-run guerrilla force
into a more conventional army. Major battles soon followed. In
early 1948, the DAG launched bold offensives and expanded
operations in central and southern Greece. However, this shift to
conventional warfare proved a strategic misstep. The insurgents’
numbers were insufficient to match the increasingly well-armed
National Army. Under US General James Van Fleet’s advisement,
the Greek Army adopted improved counterinsurgency tactics
and gained air superiority. By mid-1948, the insurgents
controlled large swathes of remote highlands, but the cities and
plains remained under government control. The civil war had
thus evolved into a grinding war of attrition, with the DAG
operating from mountain strongholds and across northern
border zones, while the National Army besieged these areas with
superior firepower. Each side’s tactics reinforced the other’s
brutality.89
The war reached its most severe phase in 1948-1949, when
intensified campaigns led to unprecedented bloodshed. After
heavy fighting throughout 1948, including pitched battles in the
Peloponnese and Macedonia, the conflict’s epicentre shifted to
the northwestern frontier. The external dynamics changed in
mid-1948 when Yugoslav leader Josip Broz Tito closed his border
and cut off aid in July 1949 after the KKE sided with the USSR
against Yugoslavia.90
Deprived of its main supply source, the
DAG was now in a precarious position.
Sensing an opportunity to end the war, the Greek government
and its US advisers escalated operations drastically in the
summer of 1949. In a final offensive called Operation Pyrsos in
August 1949, the National Army concentrated overwhelming
force on the last communist strongholds in the Grammos–Vitsi
area. Heavy artillery barrages and continuous air strikes
pummelled the rebel positions. Human losses peaked for both
sides, with one analysis estimating that in this final campaign
the insurgents lost 70 per cent of their remaining strength,
72.
70
Global Peace Index2025 | Measuring peace in a complex world
killed, wounded or captured, and government battle-deaths
tripled relative to earlier averages. On October 16, 1949, the KKE
officially conceded defeat by ordering its fighters to stand down
and evacuate Greece. An estimated 100,000 Greeks had died as a
result of the conflict, and many more were displaced in a nation
of only seven million.
GUATEMALAN CIVIL WAR (1960–1996)
TABLE 4.4
Guatemalan civil war escalation factors
Conflict Escalation Variable Present?
Urban origin onset No
Accessible terrain No
High logistical supply Yes
Non-state actor heavy weapons No
Significant external support Yes
Private military contractors No
High levels of ethnic exclusion Yes
Fratricidal coercion Yes
Conflict instrumentalisation No
The Guatemalan Civil War was a 36-year armed conflict between
successive military-dominated governments and leftist
insurgents. It began in 1960 after a failed revolt by junior army
officers against the US-backed regime, rooted in discontent over
the 1954 coup that ended Guatemala’s brief democratic reform
period. The war’s key actors included the Guatemalan Army
versus various guerrilla groups that later unified as the URNG
(Unidad Revolucionaria Nacional Guatemalteca). Indigenous
Maya civilians were heavily caught in the middle, often accused
of supporting rebels. Throughout the conflict, the military
leadership exercised disproportionate power in politics, and
external actors played influential roles. The war went through
phases of varying intensity: low-intensity counterinsurgency in
the 1960s, increased guerrilla mobilisation and state repression
in the 1970s, peak violence in the early 1980s, and a gradual
de-escalation leading to peace accords in 1996. In total, an
estimated 200,000 people were killed or “disappeared”, the vast
majority indigenous civilians.91
The early 1980s marked the most brutal phase of the war, when
state violence escalated to brutal levels. In 1978, General Romeo
Lucas García’s regime intensified counterinsurgency against
growing guerrilla influence in the highlands, which was mainly
populated with Mayans, targeting not only armed rebels but also
rural communities suspected of abetting them. Repression
surged further after General Efraín Ríos Montt took power in a
1982 coup. Army units, including the elite Kaibil special forces,
systematically massacred villagers, destroyed crops and homes,
and forced survivors into militarised “model villages” or exile.
Notorious operations like Operation Sofía in the Ixil Maya area
exemplified this strategy of annihilation.
According to Guatemala’s post-war truth commission, 81 per
cent of the war’s victims were killed in 1981-1983, with 48 per
cent of all deaths occurring in 1982 alone.92
The violence
explicitly targeted Maya ethnic groups, and the UN-backed
Commission for Historical Clarification later concluded that the
Guatemalan Army committed genocide against four Mayan
peoples, aiming to physically destroy these communities.93
This
genocidal counterinsurgency effectively decimated the guerrillas’
social base and pacified much of the highlands. By 1983 the
insurgency was severely weakened, enabling the military to
initiate a controlled transition to civilian rule in 1985 while
largely preserving its impunity.
Cold War geopolitics heavily shaped the conflict’s dynamics and
the extreme violence of the early 1980s. Guatemala’s military
regimes framed the leftist insurgency as a communist threat,
aligning with the United States’ anti-communist agenda in the
region. The United States had long supported the Guatemalan
Army with training and intelligence. Even when direct military
aid was restricted in the late 1970s, American allies such as
Israel, South Korea and Taiwan provided weapons, and
counterinsurgency techniques honed by the United States in
Southeast Asia were transferred to Guatemala.94
While framed as anti-communist warfare, the violence in
Guatemala had a distinctly racialised character, demonstrating
high levels of ethnic exclusion. The majority of guerrilla recruits
and sympathisers were poor Mayan peasants, reflecting
long-standing indigenous grievances over land, exclusion, and
abuse. Guatemalan military and elite ideology historically
devalued the indigenous population, casting Maya communities
as inferior or inherently disloyal to the nation’s non-indigenous
rulers. The Army’s propaganda described insurgents as guerrilla
terrorists and often implied that the indigenous were either
communists or dupes of communists, effectively marking them
for elimination. This violence arguably stemmed from
‘radicalised security politics’, a mindset in which leaders become
convinced that destroying a perceived ethnic or political bloc is
necessary to save the state. In Guatemala, the national security
doctrine took on a racial dimension: Maya villages were seen as
permanent breeding grounds of subversion. This ideological
fusion of counterinsurgency with ethnic hatred made extreme
violence seem not only justified but necessary.95
The peak of violence in the early 1980s succeeded in crushing
the guerrilla movement and reasserting the military’s control.
Internationally, the Guatemalan Civil War’s darkest phase
highlighted how Cold War imperatives and local racism could
intertwine to produce mass atrocity. The war formally concluded
with the 1996 peace accords, which integrated the URNG into
politics and established the Commission for Historical
Clarification.
SUDANESE CIVIL WAR (2023–PRESENT)
TABLE 4.5
Sudan civil war escalation factors
Conflict Escalation Variable Present?
Urban origin onset No
Accessible terrain Yes
High logistical supply Yes
Non-state actor heavy weapons Yes
Significant external support Yes
Private military contractors No
High levels of ethnic exclusion Yes
Fratricidal coercion No
Conflict instrumentalisation Yes
73.
Trends
71
2
Sudan’s current civilwar, which by some estimates is deadlier
than either the war in Ukraine or Gaza, traces its origins to
earlier national crises, most notably the Darfur conflict and
genocide. The escalation in Darfur stemmed from a convergence
of regional power politics, Arab-Islamic ideological extremism,
resource competition and calculated conflict
instrumentalisation.
Modern violence in the region can be traced to the 1980s, when
longstanding local grievances collided with imported ideologies.
Decades of political and economic marginalisation left both
Arab and non-Arab communities in Darfur neglected by the
central government in Khartoum. During the mid-1980s, Libyan
leader Muammar Qaddafi pursued an expansionist “Arab belt”
strategy across the Sahel, using Darfur as a staging ground in
Chad and arming recruits through his so-called Islamic Legion.
The arrival of these fighters and their Arab-supremacist ideology
ignited Darfur’s first overtly ethnic war in 1987, pitting Arab
militias against the Fur ethnic group as well as other groups.
Local disputes over land and water were recast along racial
lines, and Arab returnees from Libya formed an “Arab Alliance”
that promoted exclusionary dominance. Non-Arab communities
responded by adopting a collective “African” identity,
entrenching polarised narratives that would later fuel mass
violence. By the late 1980s, external radicalisation and resource
stress had militarised identity politics in Darfur, while
Khartoum’s mobilisation of the Janjaweed in the 1990s folded
these militias into Sudan’s wider wars against the Sudan People’s
Liberation Army.
The regime of Omar al-Bashir refined this approach, arming
Arab militias to wage counterinsurgency across Sudan’s
peripheries. When the Sudan Liberation Army and the Justice
and Equality Movement rose in 2003, driven by anger at
Darfur’s exclusion and underdevelopment, the government
authorised Janjaweed auxiliaries to supplement regular forces.
Between 2003 and 2005, these militias, backed by government
air strikes, carried out a campaign that many scholars and the
US labelled a genocide. Hundreds of thousands of civilians were
killed and more than two million displaced as attacks razed
villages, destroyed food stocks, felled orchards and poisoned
wells in a deliberate effort to eradicate the Fur, Masalit, Zaghawa
and other non-Arab communities.
Weak borders with Chad and Libya supplied a steady flow of
arms and fighters, while external allies continued to furnish
Khartoum with weapons despite international embargoes. The
combination of local grievance, racial ideology, state exploitation
and foreign support produced one of the 21st
century’s most
devastating conflicts, laying the groundwork for the nationwide
civil war that began in April 2023 and now threatens Sudan’s
territorial integrity.
0
2,000
4,000
6,000
1990 2000 2010 2020
CONFLICT
DEATHS
Non-state One-sided State-based
Source: UCDP GED, IEP Calculations
FIGURE 4.6
Yearly conflict deaths caused by Darfur conflict dyads, 1989–2024
State involvement greatly increased fatalities in the early 2000s and in the past two years.
Following the 2003–2005 genocide, violence in Darfur subsided
but never ceased. Khartoum moved to formalise its proxy forces,
rebranding the Janjaweed in 2013 as the Rapid Support Forces
(RSF) under the command of Mohammed Hamdan “Hemedti”
Dagalo. A 2017 statute conferred legal status on the RSF, placing
it within Sudan’s security architecture and deploying units as
border guards, yet its field tactics remained as brutal as those of
the Janjaweed. RSF contingents were dispatched against
uprisings in South Kordofan, Blue Nile and the still-volatile
districts of Darfur while simultaneously amassing wealth
through control of gold mines and smuggling routes. External
patrons expanded the group’s reach: the United Arab Emirates
(UAE) and Saudi Arabia recruited RSF fighters for the Yemen
war after 2015, providing both funding and regional stature. By
the late 2010s the RSF had matured into a semi-autonomous
power centre, poised to play a decisive role after President Omar
al-Bashir’s ouster in 2019.
Tensions between the RSF and the Sudanese Armed Forces
(SAF) erupted into full-scale war in April 2023, igniting new
bloodshed in Darfur and across Sudan. Drawing on Darfuri Arab
74.
72
Global Peace Index2025 | Measuring peace in a complex world
networks, RSF units quickly overran most of the region and
renewed attacks on non-Arab civilians. Observers documented
mass killings and village burnings reminiscent of the 2003–2005
atrocities. In the city of El Geneina alone, tens of thousands of
civilians were killed between April and June 2023, in what
independent monitors described as ethnically motivated
violence.
The conflict assumed a proxy dimension as Egypt and Saudi
Arabia backed the SAF, while Khalifa Haftar in Libya, the UAE
and, reportedly, Russia’s Wagner Group supplied weapons and
funds to the RSF. The pattern that was first set in motion two
decades earlier has thus re-merged at a national scale. Local
Arab militias wage unrestricted war on marginalised ethnic
groups, driven by a quasi-independent RSF endowed with
external sponsorship, ample logistics and heavy weaponry, and
stoked by ideological and tribal grievances dating to the 1980s.
SRI LANKAN CIVIL WAR (1983–2009)
TABLE 4.6
Sri Lankan civil war escalation factors
Conflict Escalation Variable Present?
Urban origin onset Yes
Accessible terrain No
High logistical supply No
Non-state actor heavy weapons Yes
Significant external support Yes
Private military contractors No
High levels of ethnic exclusion Yes
Fratricidal coercion Yes
Conflict instrumentalisation No
The Sri Lankan Civil War (1983–2009) began when Tamil
separatists, led by the Liberation Tigers of Tamil Eelam (LTTE),
took up arms against Sinhala-majority rule. The conflict
unfolded in four phases, known as Eelam Wars I–IV, each
punctuated by brief truces.
During Eelam War I (1983-87) the LTTE eliminated rival Tamil
factions and drew India into the fighting. An Indian
peacekeeping force deployed from 1987 to 1990, but it withdrew
without a settlement. Eelam Wars II (1990-95) and III (1995-
2002) brought large battles, including the army’s capture of
Jaffna and the LTTE’s counter-offensives, causing heavy losses
on both sides. A Norway-brokered ceasefire in 2002 allowed the
LTTE to hold parts of the northeast, yet the truce frayed after a
key 2004 split: commander Vinayagamoorthy Karuna defected,
weakening the Tigers and passing intelligence to the central
government in Colombo.
With no political deal in sight, the stage was set for a decisive
end to the conflict. The LTTE was classified as a terrorist
organisation by the US in 1997. The terrorist classification
significantly impacted its foreign revenue.The classification led
to international financial restrictions and a crackdown on
diaspora support, which substantially reduced their funding.
Eelam War IV (2006–09) began when the LTTE resumed
attacks, aiming to secure a favourable stalemate. President
Mahinda Rajapaksa’s government responded by abandoning
negotiations and seeking outright victory. Defence spending
rose to roughly four per cent of GDP, and army strength
expanded from about 120,000 troops in 2005 to more than
200,000 by 2009. Coordinated offensives on multiple fronts
employed overwhelming firepower, while the LTTE struggled
with shrinking manpower, dwindling revenue, forced
recruitment of youths, and a rigid conventional strategy that the
army repeatedly outmanoeuvred.
Eelam War IV was enabled by significant geopolitical shifts and
significant increases in external support for the central
government of Sri Lanka. During the 1980s, India had been
deeply involved in the conflict and remained sensitive to Tamil
civilian suffering due to domestic pressure from Tamil Nadu.
However, in the late 2000s India’s stance evolved, influenced in
part by the terrorist classification of the group. New Delhi also
became more tolerant of Colombo’s offensive, partly to counter
growing Chinese influence in Sri Lanka. By 2007, India was
quietly supporting the Sri Lankan government, deviating from
its earlier calls for negotiations and humanitarian pauses.96
Meanwhile, China and Pakistan emerged as crucial allies to Sri
Lanka. Beijing provided critical military aid, including arms
supplies and about $US one billion in loans, enabling Colombo
to sustain its enlarged war effort. Pakistan – along with Russia,
Libya, and Iran – supplied weapons and expertise as well.97
By early 2009 the Tigers had lost their de facto capital,
Kilinochchi, and were encircled in the Vanni region, signalling
their military collapse and the war’s end. Figure 4.7 shows the
trend in conflict deaths in the civil war from 1989 to 2009,
clearly illustrating how the war escalated in 2008 and 2009.
The closing months of the war were by far the deadliest for
civilians. As the army pushed into the last LTTE-held enclaves,
the government declared several “No Fire Zones” to which Tamil
civilians were encouraged to flee, then subjected those zones to
sustained shelling. The Sri Lankan military repeatedly shelled
hospitals, UN aid posts, and food distribution lines, despite
knowing civilians were concentrated there. The LTTE, on the
other hand, prevented civilians from escaping the war zone,
using them as human shields to slow the army’s advance. In the
final battles around Mullivaikkal (April–May 2009), thousands
of non-combatants were killed each week.
According to a UN review, there are credible allegations that
most civilian deaths in the final phase were due to government
shelling, with tens of thousands of Tamil civilians killed in just a
few months.98
This represented a dramatic increase in civilian
targeting compared to earlier stages of the war. The
government’s intent was to eliminate the LTTE leadership at
any cost. By May 2009, the LTTE’s top commanders, including
its leader Velupillai Prabhakaran, were killed, effectively ending
the war amid what has been described as a humanitarian
catastrophe.
75.
Trends
73
2
0
2,500
5,000
7,500
10,000
1990 1995 20002005 2010
CONFLICT
DEATHS
Source: UCDP GED, IEP Calculations
FIGURE 4.7
Yearly conflict deaths in Sri Lanka, 1989–2009
Violence erupted in 2006 after four years of relatively few conflict deaths.
TIGRAY WAR (2020–2022)
TABLE 4.7
Tigray war escalation factors
Conflict Escalation Variable Present?
Urban origin onset Yes
Accessible terrain Yes
High logistical supply Yes
Non-state actor heavy weapons Yes
Significant external support Yes
Private military contractors No
High levels of ethnic exclusion Yes
Fratricidal coercion Yes
Conflict instrumentalisation No
The Tigray war stands as perhaps the most striking example of
rapid conflict escalation in the 21st
century, with hundreds of
thousands of fatalities recorded in less than a year. The war was
rooted in longstanding political tensions within Ethiopia’s
ethnic federal system.
The Tigray People’s Liberation Front (TPLF) was the dominant
force in Ethiopia’s ruling coalition (the EPRDF) for nearly three
decades. In 2018, mass protests by the Oromo and Amhara
communities led to the rise of Prime Minister Abiy Ahmed,
marginalising the TPLF’s influence in Addis Ababa. Abiy’s early
reforms, including peace with Eritrea and the dissolution of the
EPRDF in favour of a new Prosperity Party, alienated TPLF
leaders. Tensions escalated further in September 2020 when the
Tigray regional government defied a pandemic-related election
postponement and unilaterally held regional polls, which Abiy’s
government declared illegal.
Full-scale war erupted on 4 November 2020. Tigrayan forces
attacked the Ethiopian National Defense Force’s Northern
Command bases in Tigray and looted federal military assets.
Within hours, federal troops, with support from neighbouring
Eritrea, launched a massive ‘law enforcement operation’ in
Tigray. Ethiopian federal forces, allied with Eritrean troops and
Amhara regional militias, advanced rapidly in late 2020. By the
end of November 2020 they had captured key Tigrayan cities,
including the regional capital Mekelle. Despite the federal
army’s initial gains, Tigrayan resistance did not end. TPLF
leaders retreated to the mountains and reorganised their
fighters as the Tigray Defence Forces (TDF), employing guerrilla
tactics.99
In June 2021, the war’s momentum dramatically shifted. The
TDF recaptured Mekelle after routing federal units, forcing
Addis Ababa to declare a unilateral ceasefire and withdraw most
of its troops. Triumphant Tigrayan forces then expanded the war
beyond their region. Between July and November 2021, they
advanced into the neighbouring Amhara and Afar regions, at
one point coming within a few hundred kilometres of the capital
Addis Ababa. The TPLF formed a tactical alliance with other
anti-government groups, including the Oromo Liberation Army.
This phase saw heavy combat and retaliation in Amhara and
Afar; all sides were implicated in atrocities, and hundreds of
thousands of civilians were displaced as the warfront widened.
By late 2021, however, the federal side had regrouped. Bolstered
by foreign-supplied combat drones and mass mobilisation,
Ethiopian forces beat back the Tigrayan advance. In December
2021, the TDF announced a strategic retreat into Tigray, and
Abiy’s government claimed to have averted the immediate threat
to the capital. This set the stage for a tense stalemate. The threat
the TPLF counter-offensive posed to the state is a telling
example of how the later mass violence was incentivised by an
existential threat to the regime.100
76.
74
Global Peace Index2025 | Measuring peace in a complex world
With Tigrayan forces in a fight for survival, casualties mounted
quickly. High levels of violence against civilians were reported,
with as many as 100,000 people being killed in just weeks.
There are reports of large battles involving World War I-style
human wave attacks.101
By late October 2022, Tigrayan defences
were crumbling under the military pressure, Mekelle was
surrounded and cut off. Facing imminent defeat, the TPLF
agreed to enter peace talks. A breakthrough came on 2
November 2022 in Pretoria, South Africa, where Ethiopian
government and TPLF delegates signed a “Cessation of
Hostilities Agreement”, effectively ending the war. The TPLF
agreed to disarm in exchange for restoration of services and
humanitarian access, while Eritrea was expected to withdraw its
forces. This deal took effect on 3 November 2022, exactly two
years after the war’s beginning. The war unleashed one of the
world’s worst man-made humanitarian crises, with combined
conflict and humanitarian deaths being as high as 600,000.102
FIGURE 4.8
Geographic spread of violence in Ethiopia, 2020–2022
Addis Ababa Addis Ababa
Addis Ababa
2020 2021
2022
Active combat diminished in early 2022, and both sides
hesitantly engaged with international mediation efforts. In
March 2022, the federal government announced an “indefinite
humanitarian truce”, allowing limited aid into famine-stricken
Tigray. For several months, open fighting paused, but
underlying issues remained unresolved. By late August 2022,
ceasefire talks collapsed amid mutual recriminations, and
full-scale war reignited.
The conflict’s most violent phase occurred in its final months.
Hostilities resumed on 24 August 2022, shattering the truce.
Ethiopian forces, now openly reinforced by Eritrean troops,
launched a coordinated offensive from multiple fronts. Heavy
fighting erupted along Tigray’s borders, and intense battles
raged throughout the region. By September, Eritrea had
mobilised its reservists to join the assault on Tigray. The
humanitarian situation, already dire, grew catastrophic as
supply lines were again cut. Indiscriminate artillery barrages
and airstrikes hit population centres. By October, the joint
Ethiopian-Eritrean offensive had overrun major parts of Tigray.
The strategic city of Shire fell to federal forces following aerial
bombardment and artillery shelling by Ethiopian–Eritrean
forces to capture the city, along with the towns of Alamata and
Korem.
77.
Trends
75
2
Escalation Hotspots
Figure 4.9shows the likelihood of conflict around the globe at the grid level, which divides the world into
50×50km areas to allow for highly localised conflict prediction. Many of these are already in active conflict,
while others have the potential to become active. Still others, although already in active conflict, have the
potential to become more lethal.
The map shows the likelihood of at least one violent conflict
death being recorded between June 2025 and June 2026. There
are notable conflict hotspots in the Central Sahel, Mexico,
Ukraine, Bangladesh, and the disputed Kashmir region in India
and Pakistan.
FIGURE 4.9
Likelihood of violent conflict in 2025–2026
Ukraine, the Sahel, and Kashmir are all conflict hotspots.
This model, however, cannot predict the timing or magnitude of
conflict escalation. IEP has developed a scoring scale for each of
the nine escalation factors, to better understand whether
conflicts are likely to escalate. The results of this analysis are
presented in Table 4.14 at the end of this section, which lists 62
different conflict-dyads where one of the conflict actors is a
state. Each of the escalation factors is scored from one to five,
where a higher score reflects a stronger presence of that factor.
Of these 62 conflict-dyads, 22 per cent had at least one
escalation factor with the maximum score of five, and eight per
cent had maximum scores for three or more escalation factors.
Every single conflict-dyad had a score of at least three for at
least one of the escalation factors, and 25 per cent had a score of
at least three for five or more factors.
IEP has listed five conflicts below, along with a description of
the risk factors, that have a high risk of substantially worsening.
They are Kashmir, Syria, the DRC, South Sudan and Ethiopia-
Eritrea.
0.25
0.50
0.75
78.
76
Global Peace Index2025 | Measuring peace in a complex world
Kashmir Conflict
100
200
2016 2018 2020 2022 2024
VIOLENT
DEATHS
INDIA MONTHLY VIOLENT DEATHS, 2015-2025
Source: ACLED, conflictforecast.org
India
Pakistan
Nepal
China
Myanmar
Siachen
Glacier
2025 NEIGHBOURHOOD CONFLICT RISK
0.25
0.50
0.75
FIGURE 4.10
Conflict history and escalation hotspots in India
Conflict is highly likely in the Kashmir region over the next year.
Applying the escalation-risk indicators to the Kashmir dispute
finds it has the potential for rapid deterioration. On 22 April,
five gunmen attacked a group of Indian tourists near Pahalgam
in Indian-administered Kashmir, killing 26 and triggering a
sharp rise in India-Pakistan tensions. New Delhi accused
Pakistan’s military or intelligence services of orchestrating the
assault, whereas Islamabad asserted it was not involved. In
response, both governments suspended different types of
bilateral agreements designed to keep tensions under control.
A four-day conflict ensued from 7-10 May 2025 and was the
deadliest escalation between the countries in several years. India
initially launched missile strikes into Pakistan targeting what it
described as terror camps and facilities, later striking Pakistani
airbases and military facilities. Pakistan responded with strikes
of its own across northern India, while sporadic mortar fire and
limited clashes broke out along the Line of Control, the de facto
border between the Indian- and Pakistani-administered parts of
the disputed region of Jammu and Kashmir.103
A renewed confrontation over Kashmir would involve the two
nuclear-armed rivals. Although a deliberate nuclear strike
remains highly unlikely, any conventional campaign confined to
the disputed territory could still inflict heavy battlefield losses
and easily spill beyond the Kashmir region.
The dispute traces back to the 1947 partition of British India,
when a Pakistan-backed tribal incursion prompted Kashmir’s
Hindu ruler to accede to India, sparking the first Indo-Pakistani
war. Armed clashes in 1965 and 1971 again failed to settle the
region’s status, and the 1972 Simla Agreement merely formalised
the Line of Control: India retained the Kashmir Valley, Jammu
and Ladakh, Pakistan administered Azad Kashmir and Gilgit-
Baltistan, and China held Aksai Chin.
A separatist insurgency erupted in Indian-administered Kashmir
in 1989, fuelled by local grievances and support from Pakistan.
New Delhi deployed hundreds of thousands of troops, turning
the Himalayas into one of the world’s most militarised zones.
More than 40,000 people have died since 1989, and crises such
as the 1999 Kargil war and the 2008 Mumbai attacks have
repeatedly heightened tensions between India and Pakistan. A
2003 ceasefire reduced large-scale hostilities, but cross-border
shelling and militant raids still occur.
Tensions rose in August 2019, when India revoked the region’s
semi-autonomous status under Article 370 and split the former
state into two federally governed territories. The move was
enforced with mass arrests, communication blackouts and a
sizeable troop surge, while Pakistan expelled India’s envoy and
suspended trade. Violence and alienation remain. Targeted
killings and insurgent strikes persist, answered by intensified
crackdowns and media restrictions. India now maintains up to
half a million security personnel in Jammu and Kashmir, while
Pakistan fields an estimated 60,000 along the Line of Control,
reinforcing a volatile standoff that runs the risk of escalating
rapidly. Table 4.8 outlines the existing military and police
presence in the region on both sides.
79.
Trends
77
2
TABLE 4.8
Military presencein the Kashmir region
Category India (Jammu & Kashmir) Pakistan (Azad Jammu & Kashmir)
Estimated total troops 470,000 – 500,000+ 30,000 – 60,000
Regular army presence ~210,000 (including infantry, artillery, Rashtriya Rifles)
~30,000–40,000 (including Azad Kashmir
Regiment and X Corps elements)
Paramilitary forces ~130,000 (CRPF, BSF, ITBP, etc.)
A few thousand (Frontier Corps, Rangers, etc.,
depending on need)
Local police ~130,000 (J&K Police and Special Police Officers)
Unknown (police forces exist but are not
militarised at the same scale)
Deployment areas
Across the Kashmir Valley, Jammu region, and Line of
Control (LoC)
Line of Control, Muzaffarabad, urban centres,
strategic passes
Purpose
Counterinsurgency, LoC monitoring, internal security,
civil unrest control
Border security, LoC patrolling, internal security,
protest management
Specialised units
Rashtriya Rifles, National Security Guard (NSG),
Special Forces
Azad Kashmir Regiment, Special Services
Group (SSG – potentially rotational)
Force mobilisation in tensions Increases to ~600,000 during high tensions May increase to ~70,000 or more
Conflict Escalation Factors
Four of the nine escalation factors are present in the Kashmir
conflict. Their potential impact on the conflict is outlined here.
TABLE 4.9
Kashmir conflict escalation factors
Conflict Escalation Variable Present?
Urban origin onset No
Accessible terrain No
High logistical supply Yes
Non-state actor heavy weapons No
Significant external support Yes
Private military contractors No
High levels of ethnic exclusion Yes
Fratricidal coercion No
Conflict instrumentalisation Yes
Logistical Supply Issues
Kashmir has mountainous terrain. The Himalayas and the
high-altitude Siachen Glacier pose extreme logistical challenges
for both India and Pakistan. Each side maintains large forces
along the Line of Control and at remote outposts only reachable
via narrow mountain roads or air, incurring enormous costs to
supply troops with food, fuel and ammunition. Both New Delhi
and Islamabad have poured resources into mountain roads,
all-weather tunnels and air logistics, to sustain their Kashmir
deployments, yet the region’s geography continues to heavily tax
their military supply chains and budgets.
External Support
Militant groups operating in Indian-administered Kashmir have
long benefited from external support, chiefly from Pakistan’s
territory and intelligence apparatus. India has repeatedly traced
major attacks to Pakistan-based organisations like Lashkar-e-
Taiba (LeT) and Jaish-e-Mohammed (JeM), which India
describes as nurtured by Pakistan’s Inter-Services Intelligence in
the past.104
Weapons, training, and infiltrating fighters move
across the Line of Control.
Ethnic Exclusion
Governance in Indian-administered Kashmir over the past
decade has marginalised much of its Muslim-majority populace.
In August 2019, the Indian government revoked Jammu and
Kashmir’s special autonomous status (Article 370) and forced
Kashmiris to fully conform to Indian laws and land policies.
Conflict Instrumentalisation
Both India and Pakistan have frequently used the Kashmir
conflict to serve broader political and strategic objectives. India
has leveraged Kashmir policy to appeal to nationalist sentiment
and bolster its domestic legitimacy. The August 2019 revocation
of Kashmir’s autonomy was presented as fulfilling a long-
standing promise to integrate the nation.105
Pakistan, for its part,
has persistently used Kashmir as a rallying cry to unify its public
and justify its powerful military establishment. Pakistani leaders
raise the Kashmir issue in international forums and state media
to cast India as an oppressor and themselves as guardians of
Kashmiri Muslims.
The conflict over Kashmir has the potential to substantially
escalate or even become a full-blown war. Past triggers like
terror attacks and corresponding Indian strikes on Pakistan
have been controlled and external actors have placed significant
pressure to de-escalate. There is also a substantial risk of
conflicts or increased violence inside India and Pakistan, with
the potential for anti-Muslim violence in India or rebel groups
like Balochistan separatists or the Pakistani Taliban taking
advantage of any conflict between the countries.
80.
78
Global Peace Index2025 | Measuring peace in a complex world
Syrian Civil War
FIGURE 4.11
Conflict history and escalation hotspots in Syria
Violence in Syria spiked in early 2025.
Meanwhile, Türkiye maintains a significant footprint in
northern Syria, where it has historically supported various SNA
factions. Although many of these factions have formally joined
the new Syrian army, Ankara continues to exert influence
through political pressure and strategic coordination. This
dynamic underscores the enduring complexity of foreign
involvement in Syria’s internal affairs.
Adding further volatility are pro-Assad insurgents, who remain
active in several parts of the country. Concentrated primarily in
the Alawite-majority coastal governorates of Latakia and Tartus,
these loyalist forces have carried out attacks against transitional
government units, including coordinated assaults in Hama as
recently as March 2025.107
Their presence poses a direct
challenge to the new order and threatens to re-ignite sectarian
divisions that had begun to recede.
Compounding these challenges is the continued activity of
remnants of Islamic State of Iraq and the Levant (ISIL), who,
despite losing territorial control, remain embedded in the
expansive Syrian Desert (Badiya Al-Sham) and isolated pockets
of the Jazira region. The group persists through guerrilla attacks
and recruitment efforts, sustained in part by the thousands of
radicalised fighters and family members still held in refugee
camps such as Al-Hol and Roj.108
Their ongoing presence
represents a long-term security concern with both national and
regional implications.
Beyond these, a variety of local factions continue to assert
influence, particularly in areas where central authority remains
weak. In Suwayda, for example, Druze militias maintain their
own security arrangements and have engaged in localised
clashes, while cautiously negotiating terms of engagement with
the transitional government. These decentralised power centres
reflect the broader fragmentation that still defines Syria’s
political and security environment.
In Syria, following the collapse of Bashar al-Assad's regime in
December 2024, the political organisation and paramilitary
group known as Hayat Tahrir al-Sham (HTS) quickly assumed
control of Damascus. It declared a caretaker government, later
replaced by a transitional administration led by the group’s
leader Ahmed al-Sharaa. A new constitutional declaration
followed. Despite some international engagement and limited
recognition, authority remains fragmented. The United States,
the United Kingdom and the EU have begun easing sanctions
on the country, conditional on political progress. However,
concerns persist over a lack of broad-based consensus and the
absence of meaningful inclusion in governance structures.
Syria's political and conflict landscape is currently composed of
a patchwork of competing influences and contested territories,
each shaped by evolving alliances and unresolved tensions from
over a decade of war. At the centre of the emerging post-conflict
order is the transitional government and New Syrian Army,
established in January 2025 from the remnants of Hay’at Tahrir
al-Sham (HTS) and elements of the Syrian National Army (SNA).
These forces officially merged under a newly formed ministry of
defence, bringing significant portions of western and northern
Syria - including Damascus - under nominal government
control. However, this authority remains fragile, as the
transitional leadership struggles to consolidate power and
project unified governance across the country.
In the northeast, the Syrian Democratic Forces (SDF) continue
to wield control over vast territories rich in oil and gas. A
landmark agreement signed in March 2025 set out a roadmap
for integrating the SDF into Syrian state institutions and the
national army by the end of the year. While this process is seen
as pivotal for achieving national unity and resource stability, it
is fraught with complications. The SDF’s demands for regional
autonomy and ongoing concerns over ties to the PKK have
created tension and uncertainty around the pace and outcome
of integration.106
0
1,000
2,000
3,000
4,000
5,000
2018 2020 2022 2024
VIOLENT
DEATHS
SYRIA MONTHLY VIOLENT DEATHS, 2015-2025
Source: ACLED, conflictforecast.org
Syria
Türkiye
Lebanon
Jordan
Iraq
0.25
0.50
0.75
2025 NEIGHBOURHOOD CONFLICT RISK
81.
Trends
79
2
The formal integrationof HTS and SNA elements into a new
Syrian Army, alongside the SDF's March 2025 agreement to
integrate, are significant political steps. However, achieving true
operational unification is a formidable challenge. Deep-seated
mistrust between these groups, their divergent command
structures, powerful external loyalties, particularly the SNA's
ties to Türkiye and concerns about PKK influence within the
SDF, and reports of ongoing abuses by some factions suggest
that the new national army is a fragile coalition susceptible to
internal fragmentation and influence by external sponsors.109
The fall of the Assad regime has not heralded an era of peace.
Significant violence persists across multiple fronts. Clashes
between the SDF and Turkish-backed groups in northeastern
Syria during the civil war have led to the displacement of an
estimated 1.1 million people.110
March 2025 witnessed an
escalation of violence in Alawite-majority areas, resulting in
hundreds of fatalities amid clashes and massacres.
External powers are possible destabilising forces in Syria’s
conflict. Türkiye maintains a military presence in the north to
counter Kurdish groups, while Israel conducts airstrikes to
prevent Iranian or Hezbollah entrenchment and views the
HTS-led government as a threat. The US continues counter-ISIL
operations alongside the SDF.
A proposed lifting of sanctions could shift Syria’s economic and
political landscape. Meanwhile, Iran and Russia, though
diminished in influence, still pursue strategic goals through
proxy support and military footholds. These clashing agendas
fuel proxy competition, raising the risk of escalation.
Syria’s fragile stability faces multiple potential flashpoints that
could trigger renewed conflict. Key risks include a breakdown
in the SDF’s integration process, particularly over autonomy
and resource control; a resurgence of the pro-Assad insurgency
in coastal regions; and a major ISIL offensive exploiting current
instability. Additional threats stem from possible Turkish
military incursions, Israeli pre-emptive strikes against perceived
threats, and internal fractures within the transitional
government. A convergence of these events could overwhelm
government capacities, draw in external powers and push Syria
toward further fragmentation or regional conflict.
Conflict Escalation Factors
TABLE 4.10
Syria conflict escalation factors
Conflict Escalation Variable Present?
Urban origin onset Yes
Accessible terrain No
High logistical supply No
Non-state actor heavy weapons Yes
Significant external support Yes
Private military contractors No
High levels of ethnic exclusion Yes
Fratricidal coercion No
Conflict instrumentalisation Yes
Conflict Location
Syria's conflict zones are spread across strategically vital areas,
each carrying distinct risks. Damascus is central to political
control; the Alawite coastal areas are a base for insurgents; the
north is influenced by Türkiye and contested by the SNA and
the SDF; the northeast contains key oil fields and hosts both the
SDF and US forces; and the desert serves as an ISIL refuge.
Southern Syria, bordering Israel, adds further tension. These
overlapping zones, with multiple armed groups in close
proximity, increase the risk of escalation through direct clashes
or retaliatory actions.
Accessibility of Terrain
Syria’s terrain complicates control efforts. The desert allows ISIL
to operate covertly, while mountainous areas like Latakia offer
insurgents defensive advantages. Urban centres present
operational challenges due to dense populations and
infrastructure, often resulting in high casualties and prolonged
conflict. The terrain reduces the effectiveness of the new army
and prolongs insurgencies, making it harder for the transitional
government to assert control nationwide.
Logistical Supply Issues
Conflict has devastated Syria’s infrastructure, creating severe
supply challenges. Border crossings remain unstable, fuel and
currency shortages are acute, and international aid access is
inconsistent. The SDF controls most oil resources, giving it
leverage but also making the region a target. The government's
reliance on fragile supply chains and aid complicates its ability
to maintain control and deliver basic services, exposing
vulnerabilities to attacks on logistics and infrastructure.
External Support for Warring Parties
Foreign involvement shapes Syria's conflict dynamics. The US
backs the SDF and remains active in counter-ISIL operations.
Türkiye supports former SNA elements and engages with the
transitional government, primarily to limit Kurdish autonomy.
Israel carries out airstrikes to deter threats, while Iran and
Russia pursue limited influence and strategic footholds. The
UAE has allegedly armed the SDF. Conflicting interests among
these actors risk triggering escalation and undermine political
stability.
Access to Heavy Weapons
Non-state actors in Syria, including ISIL, the SDF, pro-Assad
insurgents and SNA remnants, possess significant weaponry,
ranging from RPGs to heavy artillery. These arsenals, often
bolstered by foreign support or black-market access, increase
the chance that minor clashes could escalate quickly. This
widespread militarisation undermines disarmament efforts and
complicates efforts to build a cohesive national force.
Ethnic Exclusion
Syria's sectarian divisions continue to fuel instability. Alawite
communities have faced targeted violence, reinforcing
insurgency. Kurds seek autonomy and resource rights, while
Druze groups remain cautious. The HTS-led government's
perceived Islamist tilt deepens minority distrust. Without
meaningful inclusion in governance, these tensions may provoke
further resistance and fragmentation, opening the door for
external interference and renewed conflict.
82.
80
Global Peace Index2025 | Measuring peace in a complex world
Presence of PMSCs (Private Military Contractors)
There is little evidence that private military contractors
(PMSCs) are playing a direct role in Syria’s 2025 conflict. While
Syria once served as a logistical hub for Russian PMSCs like the
Wagner Group, their activities now focus elsewhere.
Fratricidal Coercion
There are no reports indicating that Syrian factions
systematically use fratricidal coercion. While isolated cases may
occur, this is not a defining feature of the conflict. ISIL at its
height was prominently identified as using such practices but it
is not currently reported to do so.
Conflict Instrumentalisation
All major actors in Syria use the conflict to serve broader goals.
Israel aims to counter hostile forces; Türkiye seeks to limit
Kurdish power and manage refugee return; the United States
balances counter-terrorism and regional stability. Internally, the
transitional government and the SDF use their respective
leverage to gain support. These overlapping agendas complicate
peace efforts and make de-escalation vulnerable to strategic
manipulation by internal and external actors.
Syria in 2025 remains highly unstable. The transition after
Assad’s fall has not resolved deep-rooted divisions or halted
violence. The transitional government faces major challenges:
fragmented control, fragile military integration, ongoing
insurgencies and severe economic distress. External powers
continue to exert influence, often at cross-purposes. While
private military contractors and coercion within ranks are not
major escalation drivers, factors like terrain, logistics, sectarian
divides and heavy armament significantly threaten stability.
Without inclusive governance, effective disarmament, and
international alignment, Syria risks further conflict throughout
2025.
Ethiopia–Eritrea Conflict
FIGURE 4.12
Conflict history and escalation hotspots in Ethiopia
Almost a third of Ethiopia is predicted to experience conflict deaths over the next year.
0
1,000
2,000
2016 2018 2020 2022 2024
VIOLENT
DEATHS
ETHIOPIA MONTHLY VIOLENT DEATHS, 2015-2025
Source: ACLED, conflictforecast.org
South
Sudan
Sudan
Kenya
Eritrea
2025 NEIGHBOURHOOD CONFLICT RISK
0.25
0.50
0.75
Djibouti
Ethiopia
Somaliland
Somalia
The relationship between Ethiopia and Eritrea in early to
mid-2025 is characterised by heightened tension, primarily
fuelled by Ethiopia's resurgent ambitions for sovereign access to
the Red Sea, juxtaposed against Eritrea's staunch defence of its
territorial integrity and sovereignty. Ethiopian Prime Minister
Abiy Ahmed has consistently articulated that securing a Red
Sea port is an "existential issue" for his landlocked nation,
citing both historical precedents and pressing economic needs.
Ethiopia's current reliance on Djibouti for approximately 95 per
cent of its trade incurs an estimated annual cost of $1.52 billion,
a significant economic burden that Addis Ababa seeks to
alleviate. This pursuit has led Ethiopia to actions such as a
January 2024 memorandum of understanding with the
unrecognised country of Somaliland for access to the port of
83.
Trends
81
2
Berbera, a movethat, while not directly involving Eritrean
territory, signalled Ethiopia's determination and alarmed
Asmara.111
Eritrea, whose independence in 1993 resulted in Ethiopia losing
its coastline, views its Red Sea ports of Assab and Massawa as
an essential aspect of its sovereignty. A 1998-2000 border war,
which started over territorial disputes in areas such as Badme,
is a reminder of how fragile peace can be. Eritrea continues to
see Ethiopia as a threat to its national security and territorial
integrity.
Military posturing intensified in early 2025. Eritrea initiated a
nationwide military mobilisation in February 2025, reportedly
deploying up to 200,000 conscripted forces to its border
regions, particularly adjacent to Ethiopia's Tigray and Afar
regions. This mobilisation included a missile test conducted off
the strategic port of Assab. Concurrently, Ethiopia deployed its
own troops, including tanks, heavy weaponry and mechanised
units, near the Eritrean border in March 2025, with notable
concentrations in its Afar region, which lies in proximity to
Assab, and in Tigray. Diplomatic exchanges have mirrored this
tension; Eritrea denounced Ethiopia's ambitions as "misguided"
and, in a joint statement with Egypt in March 2025, rejected the
involvement of non-coastal states in Red Sea security affairs.
While Prime Minister Abiy has publicly stressed a preference
for peaceful dialogue to achieve sea access, his government still
sees a seaport as a strategic objective.112
The 2020-2022 Tigray War saw Eritrean forces aligned with the
Ethiopian government against the Tigray People's Liberation
Front (TPLF). Critically, Eritrean forces reportedly remain in
parts of Tigray, including the Irob, Zalambessa and Sheraro
districts, in contravention of the November 2022 cessation of
hostilities agreement. This continued presence is a source of
friction. Ethiopia's internal stability is also a significant factor,
with ongoing political fragmentation within Tigray, notably the
rivalry between TPLF factions led by Debretsion Gebremichael
and Getachew Reda, and a persistent insurgency by Fano
militias in the Amhara region.
Conflict Escalation Factors
TABLE 4.11
Ethiopia–Eritrea escalation factors
Conflict Escalation Variable Present?
Urban origin onset No
Accessible terrain No
High logistical supply No
Non-state actor heavy weapons No
Significant external support Yes
Private military contractors No
High levels of ethnic exclusion Yes
Fratricidal coercion Yes
Conflict instrumentalisation Yes
Conflict Location
The primary locations of potential conflict are concentrated
along the shared border, rather than directly threatening the
respective national capitals, Addis Ababa or Asmara. Key
flashpoints include the Tigray borderlands, encompassing areas
like Badme, the historical epicentee of the 1998-2000 war, and
the districts of Irob, Zalambessa and Sheraro, where Eritrean
troops reportedly maintain a presence. These zones are often
characterised by ethnically mixed populations and unresolved
administrative statuses, rendering them exceptionally sensitive.
Another critical area is the Ethiopian Afar region, which
borders Eritrea's Southern Red Sea Zone and is near to the
Eritrean port of Assab. Ethiopia has concentrated military
deployments in this region. The strategic importance of these
specific border zones lies in their direct connection to the core
grievances of both states: unresolved territorial claims and
historical animosities in Tigray, and the potential fulfillment of
Ethiopia's "existential" sea access goal via the Afar/Assab
corridor.
Accessibility of Terrain
The Ethiopia-Eritrea border presents a diverse and challenging
topography with significant military implications. Much of the
Tigray-Eritrea frontier is characterised by rugged, mountainous
highlands. The Afar region, which extends towards the Eritrean
port of Assab, includes the Danakil Depression, one of the most
inhospitable environments on Earth, featuring extreme heat
and arid desert conditions. While potentially more conducive to
mechanised formations compared to the highlands, the extreme
climate imposes severe logistical and operational burdens,
particularly concerning water scarcity, heat stress on personnel
and equipment, and difficult off-road mobility. Challenging
terrain possibly acts as a limited deterrent against large-scale
offensives.
Logistical Supply Issues
Both Ethiopia and Eritrea face considerable logistical hurdles
that would constrain their capacity to sustain a prolonged, high-
intensity conflict. Ethiopia, as a landlocked country, is
dependent on the port of Djibouti for 95 per cent of its
international trade, incurring substantial annual costs. Addis
Ababa has been actively modernising its military, including its
air force, alongside developing drones to enhance self-reliance.
Recent agreements with Russia for naval development support
and Iran for broader security cooperation also point to efforts to
diversify military partnerships. Nevertheless, maintaining a
major conflict across challenging border terrains, especially
while managing internal security challenges in Amhara and
potentially Tigray, would severely test its logistical
infrastructure.
Eritrea's economy is profoundly strained by decades of
militarisation, its policy of indefinite national service, and
relative international isolation. This economic fragility
significantly curtails its ability to finance and sustain a
protracted war against a considerably larger neighbour. The
Eritrean military's strength lies in its large pool of conscripted
manpower; however, the morale, comprehensive training and
equipment standards of this force may be inconsistent, and
their sustainment in the field presents ongoing challenges.
Furthermore, Eritrea's critical infrastructure, including its ports
of Massawa and Assab, is reportedly in disrepair and would
require substantial investment to be fully operational for
wartime logistics.
84.
82
Global Peace Index2025 | Measuring peace in a complex world
External Support for Warring Parties
Ethiopia has cultivated a diverse array of international partners.
The United Arab Emirates (UAE) has been a significant
supporter, providing substantial financial aid, investment, and
military assistance. Iran signed a memorandum of
understanding with Ethiopia for security and intelligence
cooperation in May 2025 and previously supplied drones during
the Tigray conflict. Russia entered into a naval cooperation
agreement in March 2025 to assist in rebuilding Ethiopia's navy.
Türkiye has also previously supplied military drones to Ethiopia.
For Eritrea, Egypt has emerged as a key regional ally,
particularly given Cairo's longstanding tensions with Ethiopia
over the Grand Ethiopian Renaissance Dam (GERD). Eritrea has
also strengthened ties with Iran, reportedly allowing Iranian
naval vessel activity in its waters and publicly supporting Houthi
maritime actions. This intricate network of external support,
where some nations like Iran and the UAE have varying degrees
of engagement or interests that might touch upon both sides in
different contexts, creates an unpredictable geopolitical
environment.113
Non-State Party Access to Heavy Weapons
There are armed groups within Ethiopia that Eritrea might
support as proxies in the event of an interstate war. Neither
Tigrayan nor Amhara forces that would be potential allies
against the Ethiopian state are believed to have existing heavy
weapons capabilities.
Ethnic Exclusion
Ethnic grievances are deeply embedded in the Ethiopia-Eritrea
conflict matrix. Within Ethiopia, Tigrayan resentment persists
from the brutal Tigray War (2020-2022), fuelled by concerns
over the implementation of the Pretoria Agreement for the
cessation of hostilities, the continued presence of Eritrean and
Amhara forces in parts of Tigray, and internal TPLF
factionalism. Amhara communities harbour grievances
concerning disputed territories with Tigray, and a perception of
being marginalised by the Pretoria Agreement, which
contributes to the Fano insurgency. Eritrea is reportedly
sympathetic to Fano's dissatisfaction with the peace agreement.
Ethnic exclusion and unresolved territorial claims tied to ethnic
identity can provide the backdrop for internal conflict within
Ethiopia.
Fratricidal Coercion
Eritrea systematically employs fratricidal coercion, primarily
through its policy of indefinite national and military service.
This system mandates conscription for a significant portion of
the adult population. Eritrea's reliance on such measures to
sustain its large military has significant implications. While it
ensures a numerically substantial force, this approach likely
negatively impacts troop morale, initiative and long-term
combat effectiveness, consistent with studies on fratricidal
coercion.
Conflict Instrumentalisation
Conflict instrumentalisation is a central characteristic of the
Ethiopia-Eritrea relationship, with both states leveraging the
conflict narrative for domestic interests. Ethiopia primarily
instrumentalises its quest for Red Sea access, framing it as an
"existential" national interest essential for economic survival
and regional influence. For Eritrea, the perceived threat from
Ethiopia is instrumental in justifying its highly militarised state.
85.
Trends
83
2
Government of SouthSudan SSPDF – Sudan People’s Liberation Army –
In Opposition (SPLA-IO)
200
400
600
2016 2018 2020 2022 2024
VIOLENT
DEATHS
SOUTH SUDAN MONTHLY VIOLENT DEATHS, 2015-2025
Source: ACLED, conflictforecast.org
South
Sudan
Uganda
Sudan
Ethiopia
Democratic
Republic of
the Congo
Central
African
Republic
2025 NEIGHBOURHOOD CONFLICT RISK
0.25
0.50
0.75
FIGURE 4.13
Conflict history and escalation hotspots in South Sudan
The conflict in Sudan is beginning to have an impact in South Sudan.
The risk of renewed civil war in South Sudan in early 2025 has
increased. The Revitalized Agreement on the Resolution of the
Conflict in the Republic of South Sudan (R-ARCSS), has
effectively collapsed, leading to a resurgence of widespread
hostilities and a severe political crisis.
Implementation of the R-ARCSS halted in the first quarter of
2025 because of repeated violations from signatory parties and a
significant escalation in armed conflict across multiple states.
The systematic nature of these violations, including high-level
political detentions and renewed military confrontations, points
to the breaches of the peace agreement's core tenets.114
The political environment is characterised by deadlock.
High-ranking opposition members and parliamentarians have
been detained. First Vice President Dr Riek Machar, leader of
the Sudan People's Liberation Movement-in-Opposition
(SPLA-IO), was placed under house arrest in Juba. This action
effectively stopped the power-sharing mechanism central to the
R-ARCSS. National elections, originally scheduled for December
2024, have been postponed to December 2026.
Renewed and widespread military confrontations between the
South Sudan People’s Defence Forces (SSPDF) and the SPLA-IO
have been reported in the states of Upper Nile, Western Bahr
el-Ghazal, Western Equatoria, Unity and Jonglei. Reports
indicate that the SSPDF have used improvised incendiary
weapons and barrel bombs in Upper Nile State, leading to
significant civilian casualties. The military balance has been
further affected by significant defections of senior SPLA-IO
commanders and personnel to the SSPDF. The renewed conflict
has precipitated a humanitarian crisis. Over 125,000 people
have been displaced since March 2025 due to armed clashes and
aerial bombardments, adding to existing large, displaced
populations. An estimated 9.3 million people, nearly three-
quarters of South Sudan's population, require humanitarian
assistance in 2025, with 7.7 million facing acute food insecurity.
The likelihood of further conflict escalation in South Sudan
throughout 2025 is high. The confluence of unresolved political
grievances stemming from the R-ARCSS's collapse, active ethnic
mobilisation, intense elite competition for resources,
particularly oil revenues, and significant external interference
creates a volatile environment. The war in neighbouring Sudan
has exacerbated the situation through an influx of weapons and
combatants, and the involvement of both the Sudanese Armed
Forces (SAF) and Rapid Support Forces (RSF) in South Sudan.
The nation's economic collapse has been primarily driven by
disruptions to oil exports, which is South Sudan's main revenue
source. There has been almost a complete cessation of oil
moving through Sudanese pipelines for export as a result of the
war. The government's inability to pay salaries, coupled with
hyperinflation and soaring food prices, fuels widespread
discontent and desperation among both the civilian population
and security forces.115
86.
84
Global Peace Index2025 | Measuring peace in a complex world
Conflict Escalation Factors
TABLE 4.12
South Sudan escalation factors
Conflict Escalation Variable Present?
Urban origin onset No
Accessible terrain No
High logistical supply No
Non-state actor heavy weapons No
Significant external support Yes
Private military contractors No
High levels of ethnic exclusion Yes
Fratricidal coercion No
Conflict instrumentalisation Yes
Conflict Location
The geographic spread of the conflict in 2025 has been driven by
the strategic priorities of combatants. Clashes are not confined
to isolated areas but are occurring in regions of vital
importance, notably the oil-rich Upper Nile State, Jonglei,
Western Bahr el-Ghazal, Western Equatoria and Unity states.
Fighting has also erupted near the capital, Juba, directly
challenging the government's seat of power.
Accessibility of Terrain
South Sudan's challenging physical geography significantly
influences military operations and contributes to the potential
for protracted conflict. Vast areas, particularly the Sudd
marshlands in the Upper Nile region, are characterised by
swamps, numerous rivers, including the Nile and its tributaries,
and a limited, poorly maintained road network. Seasonal
flooding further exacerbates these conditions, rendering large
areas inaccessible, especially to mechanised forces. Historically,
the Sudd has served as a natural barrier to conventional military
power and a sanctuary for insurgent groups. This difficult
terrain inherently limits the SSPDF's ability to project and
sustain conventional military power across the country. This
makes decisive military victories elusive and increases the
likelihood of sustained, dispersed fighting.116
Logistical Supply
Both the SSPDF and SPLA-IO face severe logistical constraints
in 2025, a factor that shapes the nature of the conflict and
heightens escalation risks. The SSPDF, despite access to state
resources, is hampered by the nation's economic collapse and
dwindling oil revenues, which impacts its ability to pay forces
and maintain equipment. While possessing heavy weaponry like
attack helicopters, the operational sustainment is costly. The
SPLA-IO's logistical situation is marked by chronic shortages of
ammunition, fuel, food and medical supplies. These mutual
logistical weaknesses prevent either side from mounting
sustained, large-scale conventional campaigns, contributing
instead to a low-intensity, high-impact conflict characterised by
localised clashes, raids for resources and prolonged instability,
thereby increasing the risk of continued, albeit fragmented,
escalation.
External Support
External military support is a significant driver of conflict
dynamics and escalation potential in South Sudan. The Uganda
People’s Defence Force (UPDF) deployed armed soldiers and
military equipment to South Sudan from March 2025, ostensibly
to support the government and secure Juba directly, bolstering
its military capabilities. Sudan’s civil war is having spillover
effects, with reports of both the Rapid Support Forces (RSF) and
the Sudanese Armed Forces (SAF) participating in the South
Sudanese conflict, alongside an influx of illegal arms and
combatants.
Access to Heavy Weapons
There is no clear evidence indicating that the SPLA-IO possesses
heavy artillery, armoured vehicles or sophisticated anti-aircraft
capabilities. This does not prevent escalation but shapes it
towards a protracted insurgency model, rather than decisive
conventional battles.
Ethnic Exclusion
Ethnic exclusion remains a potent and central driver of conflict
escalation in South Sudan in 2025. The primary political fault
lines, particularly between President Salva Kiir's government
and Riek Machar's SPLA-IO, are deeply intertwined with the
Dinka and Nuer ethnic identities, respectively. Incidents such as
military operations in Nuer-majority areas and the prominence
of ethnic militias like the Nuer White Army in recent clashes,
underscore the ethnic dimension of the violence. Historical
grievances related to discrimination and violence by both
groups are actively exploited. Ethnic exclusion is not a mere
byproduct but an organising principle of the conflict,
heightening the probability of sustained, identity-based
escalation.117
Conflict Instrumentalisation
The conflict in South Sudan is shaped by the way political and
military elites instrumentalise it to control and distribute power
and resources. The military functions within a large and
complicated patronage system, where loyalty is often tied to
access to resources.118
The current escalation can largely be
understood as a violent renegotiation of the elite pact governing
this resource distribution. The collapse of the R-ARCSS has
removed the political framework for power-sharing, creating an
opening for factions to use force to secure or expand their
control over state institutions and the economic benefits they
confer. The severe economic crisis, triggered by disruptions in
oil production and its export, has intensified this struggle, as
the pool of resources available for patronage has shrunk,
thereby increasing the stakes for elites and their willingness to
resort to violence to maintain or enhance their positions. This
instrumentalisation renders the conflict not solely ethnic in
nature, but also centred on struggles over power and wealth.
With a civilian population already suffering from food
shortages, the ongoing consequences of the conflict could be
devastating.
87.
Trends
85
2
Government of theDemocratic Republic of the Congo - M23
FIGURE 4.14
Conflict history and escalation hotspots in the DRC
The eastern border area of the DRC has experienced a surge in violent conflict in early 2025.
0
500
1,000
2016 2018 2020 2022 2024
VIOLENT
DEATHS
DRC MONTHLY VIOLENT DEATHS, 2015-2025
Source: ACLED, conflictforecast.org
Democratic
Republic of
the Congo
Zambia
Uganda
Tanzania
South Sudan
Central
African
Republic
Angola
2025 NEIGHBOURHOOD CONFLICT RISK
0.25
0.50
0.75
Rwanda
Republic of
the Congo
This year marked a severe escalation in the conflict between the
government of the Democratic Republic of Congo (DRC) and the
March 23 Movement (M23), a rebel group significantly
supported by Rwanda. From late 2024, M23 launched a series of
major offensives across eastern DRC, achieving significant
territorial gains. Key urban centres and strategic locations fell to
the group in rapid succession. The capital of North Kivu
province, Goma, which has a population of over two million
people, was captured around 27 January. This was followed by
the seizure the capital of South Kivu province, Bukavu, which
has a population of approximately one million, on 16 February.
The strategic mining hub of Walikale in North Kivu was taken
on 19 March, representing M23's furthest westward advance in
its campaign. Other critical areas, including the vital road
junction town of Sake, west of Goma, and Masisi town, also
came under M23 control in early 2025.
The scale and speed of these advances suggest a well-resourced
and meticulously planned military campaign, heavily reliant on
sophisticated external backing. Reports consistently indicate
that Rwanda provides M23 with troops, advanced weaponry,
and operational direction, effectively transforming the rebel
group into a formidable proxy force. In areas under its control,
M23 has initiated efforts to establish administrative structures,
including appointing officials and undertaking infrastructure
projects such as road rehabilitation, signalling intent for a
long-term presence and governance.
The intensified conflict has precipitated one of the world's
largest displacement crises. Over 7.8 million people have been
internally displaced within the DRC. The civilian population has
borne the brunt of the violence, with thousands killed. Some
estimates suggest as many as 7,000 people were killed in the
early months of 2025, including an estimated 3,000 during the
M23 attack on Goma. Reports indicate record levels of sexual
violence, widespread hunger, and the destruction of critical
infrastructure such as schools and health centres. Humanitarian
operations are severely constrained by the looting of aid
supplies, direct targeting of displacement sites, attacks on
humanitarian personnel, and restricted access due to insecurity
and the inoperability of key facilities like Goma airport.119
Multiple diplomatic initiatives are underway, though their
outcomes remain uncertain. Qatar and the US have mediated
talks between the DRC and Rwanda, leading to a "declaration of
principles" in April 2025. This framework is intended to be the
basis for a comprehensive peace agreement, which would
include the withdrawal of Rwandan forces from DRC territory
and DRC commitments to address Rwanda's security concerns
regarding anti-Rwanda militias operating in eastern Congo.
Simultaneously, direct negotiations between the DRC
government and M23, also facilitated by Qatar, have progressed
more slowly. A significant development occurred in April 2025,
with a joint statement committing both parties to an immediate
cessation of hostilities, a notable shift from the DRC's previous
refusal to engage directly with M23 leadership. However,
substantial disagreements persist, particularly concerning
M23's demobilisation, disarmament, and potential amnesty for
its members. The viability of these diplomatic tracks is
challenged by a history of failed ceasefires; for instance, a March
2025 ceasefire agreement between the DRC and Rwandan
presidents in Doha had little discernible impact on M23's
continued advances.120
88.
86
Global Peace Index2025 | Measuring peace in a complex world
Overall Likelihood of Further Conflict Escalation
The likelihood of continued, significant violence and instability
in eastern DRC throughout 2025 remains high. While concerted
international diplomatic pressure and ongoing negotiations
might mitigate the risk of a full-scale, regional war, proxy
fighting involving M23, the country’s armed forces, and a
multitude of other armed groups is likely to continue.
Several factors underpin this assessment: M23's demonstrated
and enhanced military capabilities, coupled with its control over
significant territory; the consistent and potent external support,
primarily from Rwanda, that M23 receives; the widely
acknowledged structural weaknesses of the national
government’s armed forces and their reliance on a disparate
collection of allies with varying commitments and capabilities;
the deep-rooted and unresolved drivers of the conflict, including
ethnic tensions, the instrumentalisation of violence for resource
control, and complex regional power dynamics; and the
inherent fragility of current peace processes, which still face
significant hurdles in addressing core contentious issues.
Furthermore, the termination of the Southern African
Development Community (SADC) Mission in DRC (SAMIDRC)
in March 2025, despite its own operational challenges, removes
a layer of regional military presence. This withdrawal could be
perceived by M23 as a weakening of the forces arrayed against
it, potentially creating power vacuums or emboldening the
group to consolidate its gains or attempt further expansion if
government forces and their remaining allies cannot effectively
fill the void.
Conflict Escalation Factors
TABLE 4.13
DRC – M23 escalation factors
Conflict Escalation Variable Present?
Urban origin onset No
Accessible terrain No
High logistical supply Yes
Non-state actor heavy weapons Yes
Significant external support Yes
Private military contractors No
High levels of ethnic exclusion Yes
Fratricidal coercion No
Conflict instrumentalisation Yes
Conflict Location
Operating in and capturing provincial capitals is a direct
challenge to state sovereignty, inevitably provoking government
counter-offensives and heightening the risk of large-scale
engagements. Control over border areas facilitates the flow of
external support for M23, including fighters and material, and
enables cross-border operations, thereby increasing the
possibility of regional spillover. The proximity of M23's
operations to resource-rich zones acts as a powerful incentive
for conflict, as control over these areas translates into significant
financial gain. M23's deliberate focus on these specific types of
locations suggests a calculated approach aimed at maximising
political impact, securing economic lifelines, and ensuring
operational sustainability. This pattern, coupled with efforts to
establish administrative structures, points towards a long-term
strategy for entrenchment, fundamentally escalating the conflict
from a localised insurgency to a severe challenge to the DRC's
territorial integrity.
Accessibility of Terrain
Eastern DRC is characterised by challenging geographical
features, including mountainous areas and dense forests, often
with limited road infrastructure. This difficult terrain influences
the nature and trajectory of the conflict. The terrain complicates
M23's ability to consolidate undisputed control over vast rural
territories and maintain secure supply lines for conventional
defence of urban centres. This dynamic often leads to fluid
frontlines and persistent low-to-mid-intensity clashes in rural
and remote areas contributing to a protracted conflict dynamic
rather than enabling quick, decisive victories for either side.
Logistical Supply Issues
Logistical deficiencies significantly affect government forces.
Government forces face considerable logistical challenges,
having lost control of key highways. In contrast, M23 has
demonstrated a capacity to manage and improve logistics within
its areas of control. The logistical weaknesses of the
government’s forces constrain their operational reach and
combat effectiveness. M23's relative ability to manage its own
logistics, likely augmented by external support from Rwanda, is
crucial for its operational endurance.
External Support for Warring Parties
External support is a critical determinant of the conflict's
intensity and trajectory. M23 receives substantial and decisive
backing from Rwanda. This support includes the direct
involvement of thousands of Rwandan Defence Force (RDF)
troops fighting alongside or embedded within M23 units, de
facto Rwandan operational control over M23 campaigns, and
the provision of advanced weaponry such as tanks, drones and
anti-aircraft missiles, as well as ammunition and financial
benefits derived from the illicit mineral trade.
Government forces, in turn, receive military support from
troops from neighbouring Burundi. The SAMIDRC was deployed
to assist the government’s efforts, but its mandate was
terminated in March 2025 due to its perceived ineffectiveness
and significant operational challenges. European Private
Military Companies (PMCs), employing Romanian and French
nationals, provide the government forces with training, advisory
services, logistical support and assistance with unmanned aerial
vehicle (UAV) operations. The UN peacekeeping mission,
MONUSCO, also offers logistical support in specific instances,
such as the transport of government security personnel. The
DRC government has also reportedly sought military assistance
from Chad.
Access to Heavy Weapons
M23 possesses and has effectively utilised a significant arsenal
of heavy weaponry supplied by Rwanda. This includes armoured
tanks, UAVs, anti-aircraft missile systems, and various forms of
artillery. Access to such weaponry fundamentally alters M23's
89.
Trends
87
2
capabilities, transforming itfrom a typical irregular militia into
a formidable, near-conventional military force. These heavy
weapons enable M23 to engage government forces and their
allied forces on more equal terms, to successfully assault,
capture and hold significant territory, including major urban
centres, and to potentially deter or challenge government air
assets. This enhanced combat power directly fuels military
escalation, as it raises the stakes of engagements and allows
M23 to project force more effectively.
Ethnic Exclusion
Ethnic identity plays a significant role in the conflict. M23 is
predominantly composed of ethnic Tutsis. The group's historical
and current narrative consistently emphasises the protection of
Congolese Tutsi communities from alleged discrimination,
targeted violence and the DRC government's purported failure
to address their grievances. This dynamic can create vicious
cycles of retaliatory violence between Tutsi and non-Tutsi
groups in M23 territory and beyond.
Presence of PMSCs (Private Military Contractors)
Private Military Companies (PMCs), primarily of European
origin and employing Romanian and French nationals, actively
support government forces, providing training and advisory
services to Congolese forces, maintaining aircraft and UAVs.
Conflict Instrumentalisation
The conflict in eastern DRC is instrumentalised by various
actors for multiple purposes, contributing to its intractability
and escalation. Regional powers, most notably Rwanda, use the
conflict to project influence, secure economic interests, and
address their own perceived national security concerns within
the DRC's borders.
The free flowof information
is foundational to peace.
Societies with open,
better information systems
consistently rank higher on
the Global Peace Index.
Reliable information flows support both domestic stability and global
action. Everything from business efficiency to prompt humanitarian
responses rely on up to date and accurate information.
Media coverage of conflict remains
highly unbalanced. In 2023, civilian
deaths in high-income countries
received 100 times more media
articles than a similar number of
deaths in low-income countries.
Trends in the Free Flow of Information
Pillar are mixed. While access to
telecommunications has improved
more than any other indicator in the
Positive Peace Index, press freedom
and information quality have declined.
Civil conflicts are underreported compared to
conflict between countries even when they have
substantially higher numbers of fatalities.
Major power rivalries dominate
headlines. Media reporting on
international affairs focuses
heavily on competitive interactions
between global powers.
While the expansion of telecommunications offers unparalleled
access to information, social media is often accompanied by low-
quality, inflammatory or partisan content, deepening social divides.
90
Global Peace Index 2025 | Measuring peace in a complex world
92
Global Peace Index2025 | Measuring peace in a complex world
Overview
The Global Peace Index ranks countries based on their levels of negative peace, defined as the absence
of violence or the fear of violence.
But the counterpart to this concept is Positive Peace, which
refers to the attitudes, institutions and structures that create
and sustain peaceful societies. High levels of Positive Peace
occur where attitudes make violence less tolerated, institutions
are resilient and more responsive to society’s needs, and
structures create the environment for productive and efficient
society.
The Free Flow of Information is one of the eight core Pillars of
the Positive Peace Index (PPI). It assesses the extent to which
information freely and independently flows within a society,
enabling individuals, businesses and civil society to make
informed decisions. As a composite measure, it comprises three
indicators covering the freedom of the press, the quality of
information disseminated within societies, and the level of
telecommunications infrastructure, which includes the
availability of internet, mobile and broadband technologies.
Taken together, these indicators capture the capacity of a society
to facilitate open, trustworthy and reliable channels of
communication from a variety of different sources.
In the past decade, Free Flow of Information has experienced the
third largest improvement of any Positive Peace Pillar,
improving by 3.3 per cent. This improvement was entirely
driven by the substantial expansion of telecommunications
technologies, which have brought internet and mobile access to
billions of people. Digitised sources of information have also
become more and more central to the global information
environment, displacing much of the space previously occupied
by print media. For example, one dataset focusing on 20 major
news outlets saw the number of digital news stories increase
from about 315,000 to about 1.8 million between 2000 and 2019,
a 471 per cent increase.121
The digitalisation of information sharing, particularly through
the rise of social media, initially held the promise of a global
democratisation of reporting. It was thought that the rising
availability of new information technologies and networks could
bring global attention to developments and challenges in often
overlooked communities and countries around the world.122
Such global attention can prove vital not only for raising
awareness but also for mobilising international responses to
crisis situations, enabling vast improvements in knowledge, and
empowering global business startups and global connectiveness
in ways unimaginable 30 years ago.
This section examines the ways in which this promise of
digitalised information has not been fully realised. While online
information has improved people’s access to knowledge, vastly
improved their efficiency and enhanced their creativity, it has
also amplified the spread of false and inciteful information,
often with the aim of shaping political discourse. Global news
coverage is also highly uneven, with disproportionate coverage
of more powerful countries. The decline of traditional media's
economic models has led to a narrowing of topics and a
reduction in the depth of coverage. This dynamic can be seen in
relation to the world’s conflicts as well as in tensions between
countries, where more geopolitically influential states receive
more global attention than other states.
When deciding how much space to give a conflict, editors
typically weigh a standard set of “news values” such as impact,
proximity to core audiences, prominence of the actors involved,
and the practical ease of gathering material. Russia’s assault on
Ukraine involves a major power, creates direct security concerns
in Europe, affects global food and energy chains and takes place
in locations that are comparatively accessible to foreign
reporters. Those factors raise its perceived relevance for large
Western outlets.
By contrast, the Tigray war in Ethiopia (2020-2022) unfolded
behind internet shutdowns and visa restrictions, in a region
viewed as geographically and culturally distant from many
newsrooms’ primary markets and with fewer immediate
spillovers into those markets. Higher logistical barriers and
lower anticipated audience interest meant fewer correspondents
on the ground and, in turn, less overall coverage. These
divergent professional calculations explain much of why some
wars receive substantially more attention than others.
INFORMATION FLOWS: DIVERGENT TRENDS
IN ACCESS AND QUALITY
Within the Free Flow of Information Pillar, the underlying
indicators have been marked by divergent trends over the past
ten years. As shown in Figure 5.1, the global average score for
telecommunications infrastructure has improved by 35.9 per
cent. This was the largest improvement of any indicator in the
PPI. However, the other two indicators of the Pillar have moved
in the opposite direction. The freedom of the press indicator has
deteriorated by 13.4 per cent over the last decade, the most of
any indicator in the PPI, while quality of information has
deteriorated by 6.9 per cent, the second most of any indicator.
95.
Trends
93
2
FIGURE 5.1
Change inglobal Free Flow of Information
scores, 2013–2023
The Free Flow of Information Pillar has been marked by two
diverging trends on its underlying indicators, with
technological access improving while press freedom and
information quality have deteriorated.
The telecommunications infrastructure indicator is a composite
measure of the rate of internet users and mobile phone and
broadband subscribers across countries. The freedom of the press
indicator is based on an index of measures that include media
independence, concentration of media, journalist safety and the
quality of news infrastructure. The quality of information
indicator focuses on the reliability of information disseminated
by governments through formal and informal channels,
specifically measuring the frequency with which governments
and their agents use social media to disseminate misleading or
false information to their citizens.
Since 2013, the deterioration on the freedom of the press
indicator has been widespread, affecting all regions and
government types. There are 131 countries that recorded
deteriorations on this indicator since 2013, and only 20 that
recorded improvements. Twelve countries recorded no change,
all of which are authoritarian regimes that recorded the worst
possible scores in both 2013 and 2023. Among other government
types, full democracies recorded substantial deteriorations, with
more than 90 per cent of such countries deteriorating, and
nearly 80 per cent of flawed democracies also saw reductions in
press freedom. The most severely impacted countries, however,
were those with hybrid government types, which are those that
combine authoritative and democratic elements. All hybrid
regime countries recorded deteriorations in press freedom in
the past decade.
Trends across the three indicators of the Free Flow of
Information Pillar reflect the divergences in the information
environment. On the one hand, the volume and accessibility of
information has expanded dramatically. Such advancements in
telecommunications have empowered individuals and
communities with tools to connect, learn and participate in
global discourse.
However, the vast amount of information enabled by new
technologies has challenged traditional quality control systems,
allowing misinformation to spread. Some governments and
other actors have taken advantage of this to undermine trust
and promote their political agendas. Governments,
organisations and citizens who are the target of these
misinformation campaigns struggle to find appropriate channels
to counter the narratives. As a result, information quality and
press freedom have declined, highlighting the growing gap
between access and reliability.
This disconnect is reflected in the weakening of the correlation
between some of these indicators. As shown in Table 5.1, the
level of correlation between the indicators of the Free Flow of
Information Pillar and the PPI was strong in both 2013 and
2023. However, there has been a noticeable fall in the
correlation between the PPI and telecoms infrastructure. The
large increases in infrastructure have not been matched with
corresponding increases in Positive Peace.
TABLE 5.1
Correlation between FFI indicators and the
overall PPI
While still significant, the strength of the correlation between
telecoms infrastructure and Positive Peace has fallen.
FFI Indicator
2013
Correlation
2023
Correlation
Change
Free Flow of Information 0.92 0.9 0.02
Freedom of the press 0.66 0.72 -0.06
Quality of information 0.76 0.73 0.03
Telecoms infrastructure 0.91 0.78 0.13
This disconnect is further illustrated by looking at the level of
correlation between the rate and direction of change in these
indicators over time. Figure 5.2 shows the correlation between
changes in telecom infrastructure and changes in the average
scores for quality of information and freedom of the press.
Telecom infrastructure
Free Flow of Information
Quality of information
Freedom of the press
-40 -30 -20 -10 0 10 20 30
% CHANGE
Source: IEP Calculations
96.
94
Global Peace Index2025 | Measuring peace in a complex world
FIGURE 5.2
Changes in telecom infrastructure vs changes in information quality–press freedom, 2013–2023
Improvements in telecom infrastructure have not tended to translate into more freely reported, higher-quality information.
-1
0
1
2
-3 -2 -1 0 1
INFRASTRUCTURE CHANGE
INFORMATION
CHANGE
Source: IEP Calculations
Better Coverage Worse Coverage
Lower
Quality
Higher
Quality
R=-0.1
Improvements on telecommunications infrastructure have been
nearly universal, with only two countries registering
deteriorations since 2013. In contrast, changes in the press
freedom–information quality measure have been more mixed,
with more countries experiencing deteriorations rather than
improvements. This illustrates the contrasting trends on the Free
Flow of Information domain. While access to information has
never been easier, it has also created an environment where
misinformation is easier to spread.
MEDIA REPORTS, ARMED CONFLICT AND
INTERNATIONAL TENSIONS
International news coverage does more than recount events; it
also responds to audience interests. Outlets inform the public
about developments worldwide while satisfying what readers
and viewers want to see. Consequently, the prominence a story
receives depends not only on its tangible impact but also on
what both media producers and consumers consider most
engaging.
While the Free Flow of Information Pillar upholds the
importance for striving for accuracy and neutrality in the
dissemination of information, news stories are inevitably shaped
by editorial decisions about what consumers wish to read and
institutional priorities, which in turn influences public
perceptions.123
Conflicts in less prominent countries, particularly
civil wars, tend to receive less attention than those involving
more prominent countries, particularly if these countries are
involved in interstate conflicts.
This pattern can be seen by looking at the correlation between
media event data and violence and conflict data. Event data is
captured in datasets like the Global Database of Events,
Language and Tone (GDELT), a platform comprising millions of
media records that are assembled and coded in real time to
track global events. Conflict and violence data is captured in
datasets like the Armed Conflict Location & Event Data Project
(ACLED), a data initiative that collects detailed information on
political violence, protest and conflict events across the world.
The comparison of the datasets reveals the disproportionality in
media attention relative to the lethality of conflict.
Figure 5.3 shows the relationship between the number of
conflict-related civilian deaths per country recorded in 2023, as
captured by ACLED, and the volume of news articles associated
with conflict-related events per country, as captured by GDELT.
This figure only includes countries that recorded at least 25
conflict-related civilian deaths in 2023.
97.
Trends
95
2
Ethiopia
Palestine
Burkina Faso
Mali
Ukraine
1K
10K
100K
1M
100 1K10K
CIVILIAN DEATHS
CONFLICT
ARTICLES
Source: GDELT, ACLED, IEP Calculations
Fewer Deaths More Deaths
Less
Coverage
More
Coverage
FIGURE 5.3
Conflict-related civilian deaths vs number of conflict-related articles, by country, 2023
Conflicts in Mali, Ethiopia and Burkina Faso received relatively little press coverage.
There are substantial disparities in news coverage across
countries, and a high number of deaths does not necessarily
translate to a high volume of coverage. The disparity in media
coverage is most pronounced between major powers and less
geopolitically influential countries. For example, of the five
countries with the highest ratio of articles to civilian conflict
deaths in 2023, all but one were highly economically developed
or upper-middle income countries.4
Conversely, conflicts in less
economically developed countries like Ethiopia and Burkina
Faso received very little coverage, even though both had over
20,000 recorded civilian deaths. In the case of Ethiopia, the low
coverage has been in large part by design, as in recent years
there have been far-reaching efforts to restrict information flows
and reporting on violence in the country, as detailed in Box 5.1.
BOX 5.1
Conflict, press coverage and media
blackouts in Ethiopia
In recent years, conflict between Ethiopia’s central
government and regional forces in Tigray, Amhara and
Oromia has repeatedly prompted strict limits on media and
social media coverage of the violence. In February 2023,
government authorities imposed a nationwide block on
major social-media platforms after violent protests spread
across Oromia and parts of Amhara.5
Officials framed the
shutdown as a public-safety measure, because of inciteful
posts leading to violence, but the offshoot was that domestic
journalists reported that the lack of connectivity hampered
real-time verification of clashes and made independent
reporting difficult, requiring newsrooms to rely on second-
hand accounts and official statements.6
A more extensive blackout followed in early August 2023
when fighting intensified between federal security forces
and Fano militia in Amhara Region.The government
ordered telecom operators to suspend mobile and fixed-line
internet as well as voice services in at least 19 cities, cutting
off some 40 million residents from digital communications.7
With these restrictions, local and international media outlets
struggled to report on events.
These restrictions followed a much longer blackout in the
context of the country’s Tigray conflict (2020-2022).When
fighting broke out, authorities declared a regional state of
emergency and swiftly shut down internet, mobile phone
and landline communications in the Tigray region.This was
to impede the rebels’ ability to communicate and mobilise,
and they barred journalists from entering the area.The near
two-year information blockade largely cut Tigray off from the
outside world.
The relationship between country economic development and
the volume of coverage per civilian death is shown in Figure 5.4.
The volume of coverage per death in economically developed
countries is significantly higher than in less economically
developed countries. The median number of articles per death in
high-income countries was 1,663, nearly 100 times more than
the 17.4 articles per death in low-income countries.
98.
96
Global Peace Index2025 | Measuring peace in a complex world
FIGURE 5.4
Median number of articles per conflict-related
civilian death, by country income group, 2023
There were nearly 1,700 articles associated with the
average civilian death in high-income countries, compared
to just 17 in low-income countries.
0
400
800
1,200
1,600
Low
income
Upper
middle
income
High
income
MEDIAN
ARTICLES
PER
CIVILIAN
DEATH
Source: GDELT, ACLED, IEP Calculations
Lower
middle
income
Different types of conflict also result in unequal news coverage.
Table 5.2 shows this discrepancy by comparing the number of
conflict-related articles per civilian death across countries with
the least and most coverage. All five of the countries with the
least coverage per civilian death are experiencing civil conflicts.
Four of the five countries with the worst coverage are in Africa,
suggesting that conflicts in this region receive
disproportionately low media attention regardless of their
severity and impact on civilians.
TABLE 5.2
Countries with the highest and lowest numbers of articles per civilian death, 2023
The average number of articles per conflict-related death ranges from fewer than one in Burkina Faso, compared to more than
14,000 in Russia.
Country
Number of Conflict Articles per
Civilian Death
Primary Conflict Type
Fewest
articles per
death
Burkina Faso 0.6 Intrastate
Ethiopia 0.7 Intrastate
Mali 1 Internationalised Intrastate
Cameroon 1.9 Intrastate
Haiti 2.6 One-Sided Violence / Violence Against Civilians
Most articles
per death
Russia 14,269 Interstate
Azerbaijan 3,742 Internationalised Intrastate
Lebanon 2,372 Extrasystemic
Israel 1,663 Interstate
Iran 1,647 One-Sided Violence / Violence Against Civilians
Source: GDELT, ACLED, UCDP, IEP calculations
0
200
400
600
800
Internationalised
intrastate
Intrastate Interstate
MEDIAN
ARTICLES
PER
CIVILIAN
DEATH
Source: GDELT, ACLED, IEP Calculations
prompting news producers to scale back reporting on these
subjects.8
Civil conflicts, which make up the vast majority of conflicts
globally, garner far less attention than conflicts between two or
more sovereign states, which, in the 21st
century, have become
relatively rare.
Figure 5.5 illustrates the average number of articles per civilian
death for interstate conflicts, intrastate conflicts and
internationalised intrastate conflicts. Interstate conflicts receive
by far the most media attention, with approximately 870 articles
per civilian death. Second are (non-internationalised) intrastate
conflicts, which receive about 37 articles per civilian death,
followed by internationalised intrastate conflicts, with only
about 18 articles per civilian death.
FIGURE 5.5
Median number of articles per conflict-related
civilian death, by conflict type, 2023
Interstate conflicts are associated with by far the most
media coverage, followed by intrastate conflicts and
internationalised intrastate conflicts.
Fatigue bias can also contribute to disparities in conflict
coverage. Repeated exposure to a specific ongoing issue often
causes news audiences to grow tired of it, leading them to avoid
the topic and view its coverage negatively. This fatigue,
particularly in relation to long-term conflicts, may result in
reduced media coverage as audience engagement declines,
99.
Trends
97
2
These patterns arenot unique to recent coverage of conflicts but
reflect enduring trends in how conflicts have been reported.9
For
example, in 2014 the New York Times had much higher levels of
coverage of conflict in Gaza and Ukraine than in Africa. The
2014 Gaza War was the subject of 134 articles in a single month,
while in the first six months of the Russian-Ukrainian War in
2014, Ukraine was on average the subject of more than 70
articles per month.10
In contrast, the civil war in the Central
Africa Republic (CAR) was the focus of only about 4-5 articles
per month in the same year, despite the CAR conflict resulting
in at least twice as many deaths.
This disproportionate media coverage is often a reflection of
relative geopolitical influence but also of the interest of the
viewers. Conflicts involving powerful nations or alliances,
particularly interstate conflicts, carry broad implications for
international diplomacy, security alliances and economic
policies. Conflicts that threaten major trade routes, foreign
investments, valuable resources or stability in economically
significant regions, tend to attract greater media attention. In
contrast, conflicts in regions with less economic influence are
more likely to be overlooked, regardless of their severity or
humanitarian consequences.11
This dynamic holds true even when tensions do not erupt into
open conflict. In the past decade, many powerful countries have
seen a rise in geopolitical tensions with rival powers. Table 5.3
lists the 30 country pairings with the highest volume of
international media reports since 2018. It shows that adversarial
relationships involving major powers dominate the media
landscape. These countries, including Russia, Ukraine, the US,
Israel and China, reflect the focus of the media on events which
speak to global power dynamics.
TABLE 5.3
Most frequently reported interstate event pairings, 2018–2024
Records from POLECAT show that conflictual relations between global powers tend to dominate the international news
coverage on interstate relations.
Actor Country Recipient Country News Item Count Most Common Code
1 Russia Ukraine 20,768 Material conflict
2 Israel Palestine 10,709 Material conflict
3 Ukraine Russia 10,287 Material conflict
4 United States Russia 7,839 Verbal conflict
5 United States China 6,199 Verbal conflict
6 China United States 6,169 Verbal conflict
7 United States Iran 6,162 Verbal conflict
8 Russia United States 5,896 Verbal conflict
9 Iran United States 4,643 Verbal conflict
10 Israel Syria 4,495 Material conflict
11 Palestine Israel 3,764 Material conflict
12 Syria Israel 3,405 Material conflict
13 Armenia Azerbaijan 3,316 Material conflict
14 India Pakistan 2,600 Verbal conflict
15 European Union Russia 2,536 Verbal conflict
16 Pakistan India 2,458 Verbal conflict
17 Azerbaijan Armenia 2,412 Material conflict
18 United Kingdom Russia 2,341 Verbal conflict
19 United States Ukraine 2,091 Verbal conflict
20 United States Venezuela 1,990 Verbal conflict
21 Iran Israel 1,983 Verbal conflict
22 United States Israel 1,883 Verbal conflict
23 Yemen Saudi Arabia 1,780 Material conflict
24 Türkiye United States 1,750 Verbal conflict
25 United Kingdom United States 1,739 Verbal conflict
26 United States United Kingdom 1,714 Verbal conflict
27 Türkiye Syria 1,666 Material conflict
28 Israel Iran 1,641 Material conflict
29 North Korea United States 1,571 Verbal conflict
30 Germany Russia 1,531 Verbal conflict
Source: POLECAT, IEP calculations
100.
98
Global Peace Index2025 | Measuring peace in a complex world
Table 5.3 also conveys how the media portrays interstate
relations by listing the most common type of media-reported
interactions between pairings. These four codes (material
conflict, verbal conflict, material cooperation, and verbal
cooperation) categorise the nature of each event. They denote
whether the engagement is conflictual or cooperative, and
whether it is based purely in words and statements or if it rises
to the level of concrete actions. The balance of these codes
reflects the prevailing dynamics of interstate relationships.
These country pairings are heavily skewed toward competitive
interactions, reflecting a strong focus on rivalries between
countries.
The relationship between Russia and Ukraine, with over 20,000
total records, is by far the most significant in terms of media
coverage in the past six years in the dataset. The number of
reports underscores the severity of the ongoing crisis in
Russian-Ukrainian relations since the 2014 annexation of
Crimea, with tensions escalating dramatically following Russia’s
invasion of Ukraine in 2022. This conflict, involving substantial
geopolitical stakes for Europe, the US and NATO, has garnered
widespread attention not only due to its direct impacts on the
countries involved but also because of the broader implications
for international law, sovereignty and the balance of power in
Eastern Europe.
The Israel-Palestine relationship also features prominently, with
over 10,000 records. This long-standing conflict has received
international attention for decades, but since the Hamas-led
attack on Israel in October 2023, which led to the initiation of
the Israel-Hamas war, the global focus on Israel-Palestine
relations has risen substantially. In addition to the parties
directly involved, the conflict holds great significance related to
regional stability and cultural identity. Media coverage of this
issue not only reflects the persistent tensions but also the
broader interests of the international community in seeing a
resolution that upholds peace and stability in the Middle East.
Reflecting its influence and engagement all around the world,
the US appears as either an actor or recipient country in 13 out
of the 30 pairings, with about 50,000 total records associated
with it. The country’s most common engagements are with
Russia and China, with the majority of them tagged as “verbal
conflict”. These pairings reflect ongoing major-power rivalries.
In the case of US-Russia relations, media reports have focused
on allegations of interference in domestic affairs, cybersecurity
incidents and tensions over arms treaties and military presence
in key regions like Eastern Europe. US-China relations, on the
other hand, centre on trade disputes, technological competition
and territorial claims in the South China Sea.
Beyond these high-profile conflicts, some regional relationships
are also among those that amass the most media reports. For
example, India and Pakistan, with hundreds of reports
categorised as “verbal conflict”, exemplify a longstanding rivalry
influenced by border disputes, nuclear deterrence and divergent
national interests. While the data does not capture events in
2025, the recent eruption of hostilities between India and
Pakistan demonstrates how escalating verbal conflict can help
give rise to material conflict.
These patterns highlight a core issue with the contemporary
information environment: many of the world’s most deadly
conflicts remain underrepresented in global news. Media
coverage often reflects a narrow lens, shaped more by
geopolitical significance than by humanitarian urgency.
The rise of social media and the digital expansion of
telecommunications has undoubtedly improved access to
information, but it has not guaranteed more reliable or
proportionate reporting. Declines in press freedom and
information quality suggest that even as more data circulates,
there is no guarantee of an increase in media quality. This
divergence between access and quality complicates the
relationship between information and peace.
100
Global Peace Index2025 | Measuring peace in a complex world
The GPI was founded by Steve Killelea, an Australian
technology entrepreneur and philanthropist. It is produced
by the Institute for Economics & Peace, a global think tank
dedicated to developing metrics to analyse peace and to
quantify its economic benefits.
The GPI measures a country’s level of Negative Peace using
three domains of peacefulness. The first domain, Ongoing
Domestic and International Conflict, uses six statistical
indicators to investigate the extent to which countries are
involved in internal and external conflicts, as well as their
role and duration of involvement in conflicts.
The second domain evaluates the level of harmony or
discord within a nation; eleven indicators broadly assess
what might be described as Societal Safety and Security. The
assertion is that low crime rates, minimal terrorist activity
and violent demonstrations, harmonious relations with
neighbouring countries, a stable political scene and a small
proportion of the population being internally displaced or
made refugees can be equated with peacefulness.
Six further indicators are related to a country’s Militarisation
—reflecting the link between a country’s level of military
build-up and access to weapons and its level of
peacefulness, both domestically and internationally.
Comparable data on military expenditure as a percentage of
GDP and the number of armed service officers per head are
gauged, as are financial contributions to UN peacekeeping
missions.
The expert panel
An international panel of independent experts played a key
role in establishing the GPI in 2007—in selecting the
indicators that best assess a nation’s level of peace and in
assigning their weightings.The panel has overseen each
edition of the GPI; this year, it included:
Professor Kevin P. Clements, chairperson
Foundation Chair of Peace and Conflict Studies and
Director, National Centre for Peace and Conflict Studies,
University of Otago, New Zealand
Dr. Sabina Alkire
Director, Oxford Poverty & Human Development Initiative
(OPHI), University of Oxford, United Kingdom
Dr. Ian Anthony
Research Analyst, Swedish Defence Research Agency
Dr. Manuela Mesa
Director, Centre for Education and Peace Research
(CEIPAZ) and President, Spanish Association for Peace
Research (AIPAZ), Madrid, Spain
Dr. Ekaterina Stepanova
Head, Unit on Peace and Conflict Studies, Institute of the
World Economy and International Relations (IMEMO),
Russian Academy of Sciences, Russia
Peace is notoriously difficult to define. The simplest way of approaching it is in terms of the
harmony achieved by the absence of violence or the fear of violence, which has been described
as Negative Peace. Negative Peace is a complement to Positive Peace which is defined as the
attitudes, institutions and structures that create and sustain peaceful societies.
GPI Methodology
APPENDIX A
103.
Appendices
101
6
ƒ Number andduration of internal
conflicts
Uppsala Conflict Data Program (UCDP)
Battle-Related Deaths Dataset,
Non-State Conflict Dataset and
One-sided Violence Dataset; Institute for
Economics & Peace (IEP)
ƒ Number of deaths from external
organised conflict
UCDP Georeferenced Event Dataset
ƒ Number of deaths from internal
organised conflict
UCDP Georeferenced Event Dataset
ƒ Number, duration and role in
external conflicts
UCDP Battle-Related Deaths Dataset;
IEP
ƒ Intensity of organised internal
conflict
Qualitative assessment by EIU analysts
ƒ Relations with neighbouring
countries
Qualitative assessment by EIU analysts
ƒ Level of perceived criminality
in society
Gallup World Poll, IEP estimates
ƒ Number of refugees and internally
displaced people as a percentage of
the population
Office of the High Commissioner for
Refugees (UNHCR) Mid-Year Trends;
Internal Displacement Monitoring Centre
(IDMC)
ƒ Political instability
Qualitative assessment by EIU analysts
ƒ Political Terror Scale
Gib
ney, Mark, Linda Cor
nett, Reed
Wood, Peter Hasch
ke, Daniel Arnon,
and Attilio Pisanò. 2021.The Polit
ic
al
Ter
ror Scale 1976-2019. Date Re
trieved,
from the Polit
ic
al Ter
ror Scale website:
http://www.politicalterrorscale.org.
ƒ Impact of terrorism
IEP Global Terrorism Index (GTI)
ƒ Number of homicides per
100,000 people
United Nations Office on Drugs and
Crime (UNODC) Surveys on Crime
Trends and the Operations of Criminal
Justice Systems (CTS); EIU estimates
ƒ Level of violent crime
Qualitative assessment by EIU analysts
ƒ Violent demonstrations
Armed Conflict Location and Event Data
Project (ACLED); IEP
ƒ Number of jailed population per
100,000 people
World Prison Brief, Institute for Criminal
Policy Research at Birkbeck, University
of London
ƒ Number of internal security officers
and police per 100,000 people
UNODC CTS
ƒ Ease of access to small arms
and light weapons
Qualitative assessment by EIU analysts
ƒ Military expenditure as a
percentage of GDP
The Military Balance, IISS, EIU
Estimates
ƒ Number of armed services
personnel per 100,000 people
The Military Balance, IISS
ƒ Volume of transfers of major
conventional weapons as recipient
(imports) per 100,000 people
Stockholm International Peace
Research Institute (SIPRI) Arms
Transfers Database
ƒ Volume of transfers of major
conventional weapons as supplier
(exports) per 100,000 people
SIPRI Arms Transfers Database
ƒ Financial contribution to
UN peacekeeping missions
United Nations Committee on
Contributions; IEP
ƒ Nuclear and heavy weapons
capabilities
Military Balance+, IISS; IEP
ONGOING DOMESTIC
& INTERNATIONAL
CONFLICT
SOCIETAL SAFETY
& SECURITY MILITARISATION
The GPI comprises 23 indicators of the absence of violence or fear of violence.The indicators were originally selected with
the assistance of the expert panel in 2007 and have been reviewed by the expert panel on an annual basis. All scores for
each indicator are normalised on a scale of 1-5, whereby qualitative indicators are banded into five groupings and
quantitative ones are scored from 1 to 5, to the third decimal point.
The Indicators
104.
102
Global Peace Index2025 | Measuring peace in a complex world
WEIGHTING THE INDEX
When the GPI was launched in 2007 the advisory panel of
independent experts apportioned scores based on the relative
importance of each of the indicators on a scale of 1-5.Two sub-
component weighted indices were then calculated from the GPI
group of indicators:
1. A measure of how internally peaceful a country is;
2. A measure of how externally peaceful a country is (its state of
peace beyond its borders).
The overall composite score and index was then formulated by
applying a weight of 60 per cent to the measure of internal peace
and 40 per cent to external peace.The heavier weight applied to
internal peace was agreed upon by the advisory panel, following
robust debate.The decision was based on the notion that a greater
level of internal peace is likely to lead to, or at least correlate with,
lower external conflict.The weights have been reviewed by the
advisory panel prior to the compilation of each edition of the GPI.
MEASURING THE ROBUSTNESS OF THE INDEX
ƒ Robustness is an important concept in composite index
analysis. It is a measure of how often rank comparisons from a
composite index are still true if the index is calculated using
different weightings. For example, if the GPI is recalculated
using a large number of different weighting schemes and
Country A ranks higher than Country B in 60 per cent of these
recalculations, the statement “Country A is more peaceful than
Country B” is considered to be 60 per cent robust.
ƒ IEP finds that the Global Peace Index (GPI) is at the same level
of absolute robustness as the Human Development Index (HDI),
a leading measure of development since it was first constructed
by the United Nations Development Programme in 1990.
ƒ Technically, the robustness of the GPI is measured by the fact
that 70 per cent of pairwise country comparisons are
independent of the weighting scheme chosen. In other words,
regardless of the weights attributed to each component of the
index, 70 per cent of the time the pairwise comparisons between
countries are the same.
The GPI is a composite index of 23 indicators weighted and
combined into one overall score.The weighting scheme within any
composite index represents the relative importance of each indicator
to the overall aim of the measure, in the GPI’s case, global peace.To
fully understand the representative nature or accuracy of any
measure it is necessary to understand how sensitive the results of
the index are to the specific weighting scheme used. If the analysis
holds true for a large subset of all possible weighting schemes then
the results can be called robust. While it is expected that ranks will be
TABLE A.1
Indicator weights on the GPI
Internal Peace 60% / External Peace 40%
INTERNAL PEACE (Weight 1 to 5)
Perceptions of criminality 3
Security officers and police rate 3
Homicide rate 4
Incarceration rate 3
Access to small arms 3
Intensity of internal conflict 5
Violent demonstrations 3
Violent crime 4
Political instability 4
Political terror 4
Weapons imports 2
Terrorism impact 2
Deaths from internal conflict 5
Internal conflicts fought 2.56
EXTERNAL PEACE (Weight 1 to 5)
Military expenditure (% of GDP) 2
Armed services personnel rate 2
UN peacekeeping funding 2
Nuclear and heavy weapons capabilities 3
Weapons exports 3
Refugees and IDPs 4
Neighbouring countries relations 5
External conflicts fought 2.28
Deaths from external conflict 5
Methodological Notes
105.
Appendices
103
6
sensitive to changesin the weights of any composite index, what is
more important in a practical sense is the robustness of country
comparisons. One of the core aims of the GPI is to allow for Country
A to be compared to Country B.This raises the question that for any
two countries, how often is the first ranked more peaceful than the
second across the spectrum of weights.The more times that the first
country is ranked more peaceful than the second, the more
confidence can be invested in the statement “Country A is more
peaceful than Country B”.
To avoid the computational issue of evaluating every possible
combination of 23 indicators, the robustness of pairwise country
comparisons has been estimated using the three GPI domains
militarisation, societal safety and security and ongoing conflict.
Implementing an accepted methodology for robustness, the GPI is
calculated for every weighting combination of three weights from 0 to
1 at 0.01 intervals. For computational expedience only weighting
schemes that sum to one are selected, resulting in over 5100
recalculated GPI’s. Applying this, it is found that around 70 per cent
of all pairwise country comparisons in the GPI are independent of
the weighting scheme, i.e. 100 per cent robust.This is a similar level
of absolute robustness as the Human Development Index.
QUALITATIVE SCORING:
THE ECONOMIST INTELLIGENCE UNIT APPROACH
The EIU’s Country Analysis team plays an important role in
producing the GPI by scoring five qualitative indicators and filling in
data gaps on quantitative indicators when official data is missing.
The EIU employs more than 100 full-time country experts and
economists, supported by 650 in-country contributors. Analysts
generally focus on two or three countries and, in conjunction with
local contributors, develop a deep knowledge of a nation’s political
scene, the performance of its economy and the society in general.
Scoring follows a strict process to ensure reliability, consistency and
comparability:
1. Individual country analysts score qualitative indicators based
on a scoring methodology and using a digital platform;
2. Regional directors use the digital platform to check scores
across the region; through the platform they can see how
individual countries fare against each other and evaluate
qualitative assessments behind proposed score revisions;
3. Indicator scores are checked by the EIU’s Custom Research
team (which has responsibility for the GPI) to ensure global
comparability;
4. If an indicator score is found to be questionable, the Custom
Research team, and the appropriate regional director and
country analyst discuss and make a judgment on the score;
5. Scores are assessed by the external advisory panel before
finalising the GPI;
6. If the expert panel finds an indicator score to be questionable,
the Custom Research team, and the appropriate regional
director and country analyst discuss and make a final judgment
on the score, which is then discussed in turn with the advisory
panel.
Because of the large scope of the GPI, occasionally data for
quantitative indicators do not extend to all nations. In this case,
country analysts are asked to suggest an alternative data source or
provide an estimate to fill any gap.This score is checked by Regional
Directors to ensure reliability and consistency within the region, and
by the Custom Research team to ensure global comparability. Again,
indicators are assessed by the external advisory panel before
finalisation.
106.
104
Global Peace Index2025 | Measuring peace in a complex world
Alternative Source: EIU. Where data is not provided, the EIU’s
analysts have filled them based on likely scores from the set bands of
the actual data.
Definition: This indicator is sourced from the UNODC Survey of
Crime Trends and Operations of Criminal Justice Systems and refers
to the civil police force. Police refers to personnel in public agencies
whose principal functions are the prevention, detection and
investigation of crime and the apprehension of alleged offenders. It is
distinct from national guards or local militia.
Scoring Bands
1/5 2/5 3/5 4/5 5/5
0–199.8 199.9–399.8 399.9–599.8 599.9–799.8 > 799.9
Number of Homicides per 100,000 People
Indicator type Quantitative
Indicator weight 4
Indicator weight (% of total index) 5%
Data source UNODC Survey of
Crime Trends and
Operations of Criminal
Justice Systems
Measurement period 2023
Alternative Source: EIU. Where data is not provided, the EIU’s
analysts have filled them based on likely scores from the set
bands of the actual data.
Definition: This indicator comes from the UNODC Survey of
Crime Trends and Operations of Criminal Justice Systems.
Intentional homicide refers to death deliberately inflicted on a
person by another person, including infanticide. The figures refer
to the total number of penal code offences or their equivalent,
but exclude minor road traffic and other petty offences, brought
to the attention of the police or other law enforcement agencies
and recorded by one of those agencies.
INTERNAL PEACE INDICATORS
Level of Perceived Criminality in Society
Indicator type Quantitative
Indicator weight 3
Indicator weight (% of total index) 3.8%
Data source Gallup World Poll
Measurement period 2024
Definition: This indicator uses a question from the Gallup World Poll
as the basis for perceptions of criminality.The exact wording of the
question is: “Do you feel safe walking alone at night in the city or area
where you live?” IEP calculates the indicator score based on the
percentage of people who answer ‘no’ to this question.
Where data is not available, IEP uses multivariate imputation by
chained equations to create country-level estimates.
Scoring Bands
1/5 2/5 3/5 4/5 5/5
0–19.9% 20–39.9% 40–59.9% 60–79.9% > 80%
Number of Internal Security Officers
and Police per 100,000 People
Indicator type Quantitative
Indicator weight 3
Indicator weight (% of total index) 3.8%
Data source UNODC Survey of
Crime Trends and
Operations of
Criminal Justice
Systems
Measurement period 2022
The information below details the sources, definitions, and scoring criteria of the 23 indicators that
form the Global Peace Index. All scores for each indicator are banded or normalised on a scale
of 1-5, whereby qualitative indicators are banded into five groupings and quantitative ones scored
continuously from 1 to 5 at the third decimal place. The Economist Intelligence Unit has provided
imputed estimates in the rare event there are gaps in the quantitative data.
GPI Indicator Sources,
Definitions & Scoring Criteria
APPENDIX B
107.
Appendices
105
6
Scoring Bands
1/5 2/53/5 4/5 5/5
0–1.99 2–5.99 6–9.99 10–19.99 > 20
Number of Jailed Population per 100,000 People
Indicator type Quantitative
Indicator weight 3
Indicator weight (% of total index) 3.8%
Data source Institute for Criminal
Policy Research at
Birkbeck, University
of London, World
Prison Brief
Measurement period 2024
Definition: Figures are from the Institute for Criminal Policy
Research and are compiled from a variety of sources. In almost all
cases the original source is the national prison administration of the
country concerned, or else the Ministry responsible for the prison
administration. Prison population rates per 100,000 people are
based on estimates of the national population. In order to compare
prison population rates, and to estimate the number of persons held
in prison in the countries for which information is not available,
median rates have been used by the Institute for Criminal Policy
Research to minimise the effect of countries with rates that are
untypically high or low. Indeed, comparability can be compromised
by different practice in different countries, for example with regard to
pre-trial detainees and juveniles, but also psychiatrically ill offenders
and offenders being detained for treatment for alcoholism and drug
addiction.
Scoring Bands
1/5 2/5 3/5 4/5 5/5
0-126.405 126.406-
252.811
252.812-
379.217
379.218-505.624 >505.625
Additional Notes: The data provided by the Institute for Criminal
Policy Research are not annual averages but indicate the number of
jailed population per 100,000 inhabitants in a particular month during
the year.The year and month may differ from country to country.
Ease of Access to Small Arms and Light Weapons
Indicator type Qualitative
Indicator weight 3
Indicator weight (% of total index) 3.8%
Data source EIU
Measurement period March 2024 to
March 2025
Definition: Assessment of the accessibility of small arms and light
weapons (SALW), ranked from 1-5 (very limited access to very easy
access) by the EIU’s Country Analysis team. Country analysts are
asked to assess this indicator on an annual basis, for the period from
March to March.
Scoring Criteria
1 = Very limited access: The country has developed policy
instruments and best practices, such as firearm licences,
strengthening of export controls, codes of conduct, firearms
or ammunition marking.
2 = Limited access: The regulation implies that it is difficult,
time-consuming and costly to obtain firearms; domestic
firearms regulation also reduces the ease with which legal
arms are diverted to illicit markets.
3 = Moderate access: There are regulations and commitment to
ensure controls on civilian possession of firearms, although
inadequate controls are not sufficient to stem the flow of
illegal weapons.
4 = Easy access: There are basic regulations, but they are not
effectively enforced; obtaining firearms is straightforward.
5 = Very easy access: There is no regulation of civilian
possession, ownership, storage, carriage and use of firearms.
Intensity of Organised Internal Conflict
Indicator type Qualitative
Indicator weight 5
Indicator weight (% of total index) 6.3%
Data source EIU
Measurement period March 2024 to
March 2025
Definition: Assessment of the intensity of conflicts within the country,
ranked from 1-5 (no conflict to severe crisis) by the EIU’s Country
Analysis team. Country analysts are asked to assess this indicator on
an annual basis, for the period March to March.
Scoring Criteria
1 = No conflict.
2 = Latent conflict: Positional differences over definable values
of national importance.
3 = Manifest conflict: Explicit threats of violence; imposition of
economic sanctions by other countries.
4 = Crisis: A tense situation across most of the country; at least
one group uses violent force in sporadic incidents.
5 = Severe crisis: Civil war; violent force is used with a certain
continuity in an organised and systematic way throughout
the country.
Violent Demonstrations
Indicator type Qualitative
Indicator weight 3
Indicator weight (% of total index) 3.8%
Data source ACLED
Measurement period 2024
Definition: The indicator reflects the number and severity of violent
demonstrations in a country for a give year. Scores vary from 1 to 5,
with values close to 1 representing infrequent violent demonstrations
and scores close to 5 representing frequent demonstrations with high
numbers of fatalities.The data includes four types of events as
classified by ACLED: "Protest with intervention" (weighted at 1),
"Excessive force against protesters" (weight 2), "Violent
demonstration" (weight 3), and "Mob violence" (weight 4). Note that
this set of event types means that the indicator includes violent
108.
106
Global Peace Index2025 | Measuring peace in a complex world
protests, riots etc, but also protests that were originally peaceful but
were repressed violently by security forces. For each type of event
the number of incidents and the number of fatalities are calculated.
Fatalities are weighted more heavily than the number of incidents, as
a gauge of incident severity. Where ACLED data are not available a
transformation was used to adapt raw data from the Cross National
Time Series (CNTS) data for imputation.
Score interpretation guidance
1/5
Very rare incidents of violent demonstrations, protests are
almost all peaceful.
2/5 A few violent protests, mostly without fatalities.
3/5
A few violent protests or protests repressed violently by
security forces. Some fatalities.
4/5
Frequent protests with violence, with a material number of
fatalities.
5/5
Large number of protests with large number of fatalities.
Number of incidents and fatalities are large by international
and historical standards.
Level of Violent Crime
Indicator type Qualitative
Indicator weight 4
Indicator weight (% of total index) 5%
Data source EIU
Measurement period March 2024 to
March 2025
Definition: Assessment of the likelihood of violent crime ranked from
1 to 5 (very low to very high) by the EIU’s Country Analysis team
based on the question, “Is violent crime likely to pose a significant
problem for government and/or business over the next two years?”
Country analysts assess this question on a quarterly basis.
Scoring Criteria
“Is violent crime likely to pose a significant problem for
government and/or business over the next two years?”
1/5 Strongly no
2/5 No
3/5 Somewhat of a problem
4/5 Yes
5/5 Strongly yes
Political Instability
Indicator type Qualitative
Indicator weight 4
Indicator weight (% of total index) 5%
Data source EIU
Measurement period March 2024 to
March 2025
Definition: Assessment of political instability ranked from
0 to 100 (very low to very high instability) by the EIU’s Country
Analysis team, based on five questions.This indicator aggregates five
other questions on social unrest, orderly transfers, opposition stance,
excessive executive authority and an international tension sub-index.
Country analysts assess this question on a quarterly basis.
Specific Questions:
• What is the risk of significant social unrest during the next
two years?
• How clear, established and accepted are constitutional mechanisms
for the orderly transfer of power from one government to another?
• How likely is it that an opposition party or group will come to
power and cause a significant deterioration in business operating
conditions?
• Is excessive power concentrated or likely to be concentrated in the
executive so that executive authority lacks accountability and
possesses excessive discretion?
• Is there a risk that international disputes/tensions will negatively
affect the economy and/or polity?
Scoring Bands
1/5 2/5 3/5 4/5 5/5
0–20.4 20.5–40.4 40.5–60.4 60.5–80.4 80.5–100
PoliticalTerror Scale
Indicator type
Qualitative
Indicator weight 4
Indicator weight (% of total index) 5%
Data source
Measurement period 2023
Definition: The Political Terror Scale (PTS) measures levels of
political violence and terror that a country experiences in a given year
based on a 5-level “terror scale” originally developed by Freedom
House.The data used in compiling this index comes from two different
sources: the yearly country reports of Amnesty International and the
US Department of State’s Country Reports on Human Rights
Practices.The average of the two scores is taken.
Scoring Criteria
1 = Countries under a secure rule of law, people are not imprisoned
for their view, and torture is rare or exceptional. Political
murders are extremely rare.
2 = There is a limited amount of imprisonment for nonviolent
political activity. However, few persons are affected, torture and
beatings are exceptional. Political murder is rare.
3 = There is extensive political imprisonment, or a recent history of
such imprisonment. Execution or other political murders and
brutality may be common. Unlimited detention, with or
Gib
ney, Mark, Linda
Cor
nett, Reed Wood, Peter
Hasch
ke, Daniel Arnon, and
Attilio Pisanò. 2018. The
Political Terror Scale 2022.
Date Re
trieved, from the
Political Terror Scale
website: http://www.
politicalterrorscale.org.
109.
Appendices
107
6
C The perpetratorsof the incidents must be sub-national
actors. This database does not include acts of state
terrorism.
For all incidents listed, at least two of the following three criteria
must be present:
1. The act must be aimed at attaining a political, economic,
religious or social goal.
2. There must be evidence of an intention to coerce, intimidate
or convey some other message to a larger audience (or
audiences) than the immediate victims.
3. The action must be outside the context of legitimate warfare
activities.
Methodology: Using the comprehensive, event-based Terrorism
Tracker, the GTI combines four variables to develop a composite
score: the number of terrorist incidents in a given year, the total
number of fatalities in a given year, the total number of injuries
caused in a given year and the approximate level of property damage
in a given year.The composite score captures the direct effects of
terrorist-related violence, in terms of its physical effect, but also
attempts to reflect the residual effects of terrorism in terms of
emotional wounds and fear by attributing a weighted average to the
damage inflicted in previous years.
Scoring Bands
1/5 2/5 3/5 4/5 5/5
0-13.479
13.48-
181.699
181.7-
2,449.309
2,449.31-
33,015.949
>33,015.95
Number of Deaths From Organised Internal Conflict
Indicator type Quantitative
Indicator weight 5
Indicator weight (% of total index) 6.3%
Data source UCDP Georeferenced
Event Dataset and
Candidate Dataset
Measurement period 2024
Definition: This indicator uses the UCDP’s definition of conflict.
UCDP defines conflict as: “a contested incompatibility that concerns
government and/or territory where the use of armed force between
two parties, results in at least 25 battle-related deaths in a year.”
Scoring Bands
1/5 2/5 3/5 4/5 5/5
0–23 deaths 24–998
deaths
999–4,998
deaths
4,999–9,998
deaths
> 9,999
deaths
Internal Conflicts Fought
Indicator type Quantitative
Indicator weight 2.56
Indicator weight (% of total index) 3.2%
Data sources IEP; UCDP Battle-
UCDP Georeferenced
Events Dataset
Measurement period 2020–2024
without a trial, for political views is accepted.
4 = Civil and political rights violations have expanded to large
numbers of the population. Murders, disappearances, and
torture are a common part of life. In spite of its generality, on
this level terror affects those who interest themselves in
politics or ideas.
5 = Terror has expanded to the whole population. The leaders of
these societies place no limits on the means or thoroughness
with which they pursue personal or ideological goals.
Volume ofTransfers of Major Conventional Weapons,
as Recipient (Imports) per 100,000 people
Indicator type
Quantitative
Indicator weight 2
Indicator weight (% of total index) 2.5%
Data source SIPRI Arms Transfers
Database
Measurement period 2020–2024
Definition: Measures the total volume of major conventional
weapons imported by a country between 2019 and 2023, divided by
the average population in this time period at the 100,000 people level
(population data supplied by the EIU).The SIPRI Arms Transfers
Database covers all international sales and gifts of major
conventional weapons and the technology necessary for their
production.The transfer equipment or technology is from one
country, rebel force or international organisation to another country,
rebel force or international organisation. Major conventional weapons
include: aircraft, armoured vehicles, artillery, radar systems, missiles,
ships, engines. SIPRI uses a unique pricing system, the Trend
Indicator Value (TIV) that measures military capability.The indicator
raw value is measured as TIV per 100,000 population.
Scoring Bands
1/5 2/5 3/5 4/5 5/5
0-7.233 7.234-
14.468
14.469-
21.702
21.703-
28.936
>28.937
I
Impact ofTerrorism
Indicator type Quantitative
Indicator weight 2
Indicator weight (% of total index) 2.5%
Data source IEP Global Terrorism
Index (GTI)
Measurement period 2020–2024
Definition: Terrorist incidents are defined as “intentional acts of
violence or threat of violence by a non-state actor.” This means an
incident has to meet three criteria in order for it to be counted as a
terrorist act:
A The incident must be intentional – the result of a conscious
calculation on the part of a perpetrator.
B The incident must entail some level of violence or threat of
violence, including property violence as well as violence
against people.
110.
108
Global Peace Index2025 | Measuring peace in a complex world
Definition: This indicator measures the number and duration of
conflicts that occur within a specific country’s legal boundaries.
Information for this indicator is sourced from three datasets from
Uppsala Conflict Data Program (UCDP): the Battle-Related Deaths
Dataset, Non-State Conflict Dataset and One-sided Violence
Dataset.The score for a country is determined by adding the scores
for all individual conflicts which have occurred within that country’s
legal boundaries over the last five years.
Each individual conflict score is based on the following factors:
Number:
• The number of interstate armed conflicts, internal armed
conflict (civil conflicts), internationalised internal armed
conflicts, one-sided conflict and non-state conflict located
within a country’s legal boundaries.
• If a conflict is a war (1,000+ battle-related deaths) it
receives a score of one; if it is an armed conflict (25-999
battle-related deaths) it receives a score of 0.25.
Duration:
• A score is assigned based on the number of years out
of the last five that conflict has occurred. For example,
if a conflict last occurred five years ago that conflict will
receive a score of one out of five.
The cumulative conflict scores are then added and banded to
establish a country’s score.This indicator is two years lagging due to
when the UCDP data is released.
Scoring Bands
1/5 2/5 3/5 4/5 5/5
No
internal
conflict
Combined
conflict
score of
up to 4.75
Combined
conflict
score of
up to 9.5
Combined
conflict
score of
up to
14.25
A combined conflict
score of 19 or above.
This shows very high
levels of internal
conflict.
EXTERNAL PEACE INDICATORS
Military Expenditure as a Percentage of GDP
Indicator type Quantitative
Indicator weight 2
Indicator weight (% of total index) 2.8%
Data source International Institute
for Strategic Studies,
Military Balance+
Measurement period 2024
Alternative Source: When no data was provided, several alternative
sources were used: National Public Expenditure Accounts, SIPRI
information and the Military Balance.
Definition: Cash outlays of central or federal government to meet the
costs of national armed forces—including strategic, land, naval, air,
command, administration and support forces as well as paramilitary
forces, customs forces and border guards if these are trained and
equipped as a military force. Published EIU data on nominal GDP (or
the World Bank when unavailable) was used to arrive at the value of
military expenditure as a percentage of GDP.
Scoring Criteria: This indicator is scored using a min-max
normalisation. Applying this method, a country’s score is based on
the distance of its military expenditure as a share of GDP from the
benchmarks of 0% (for a score of 1) and 8.37% or above (for a score
of 5).The bands, while linear, approximately conform as follows:
1/5 2/5 3/5 4/5 5/5
0-2.092 2.093-4.184 4.185-6.277 6.278-8.37 >8.371
Number of Armed Services Personnel
per 100,000 people
Indicator type Quantitative
Indicator weight 2
Indicator weight (% of total index) 2.8%
Data source International Institute
for Strategic Studies,
Military Balance+
Measurement period 2024
Alternative Source: World Bank population data used if unavailable
from the EIU.
Definition: Active armed services personnel comprise all service
men and women on full-time duty in the army, navy, air force and joint
forces (including conscripts and long-term assignments from the
reserves). Population data provided by the EIU.
Scoring Bands
1/5 2/5 3/5 4/5 5/5
0-657.744
657.745-
1,315.489
1,315.49-
1,973.234
1,973.235-
2,630.98
>2,630.981
Additional Notes: The Israeli reservist force is used to calculate
Israel’s number of armed services personnel.
Financial Contribution to UN Peacekeeping Missions
Indicator type Quantitative
Indicator weight 2
Indicator weight (% of total index) 2.8%
Data source IEP; United Nations
Committee
on Contributions
Measurement period 2021–2023
Methodology: The UNFU indicator measures whether UN member
countries meet their UN peacekeeping funding commitments.
Although countries may fund other programs in development or
peacebuilding, the records on peacekeeping are easy to obtain and
understand and provide an instructive measure of a country’s
commitment to peace.The indicator calculates the percentage of
countries’ “outstanding payments versus their annual assessment to
the budget of the current peacekeeping missions” over an average of
three years.This ratio is derived from data provided by the United
Nations Committee on Contributions Status reports.The indicator is
compiled as follows:
1. The status of contributions by UN member states is obtained.
2. For the relevant peacekeeping missions, the assessments
(for that year only) and the collections (for that year only) are
111.
Appendices
109
6
4/5 54,553–72,737
5/5
States withnuclear capability receive a 5, or states with
heavy weapons capability of 72,738 or in the top 2% of
heavy weapons receive a 5.
Volume ofTransfers of Major Conventional Weapons
as Supplier (Exports) per 100,000 people
Indicator type Quantitative
Indicator weight 3
Indicator weight (% of total index) 4.2%
Data source SIPRI Arms
Transfers Database
Measurement period 2020–2024
Definition: Measures the total volume of major conventional
weapons exported by a country between 2019 and 2023 divided by
the average population during this time period (population data
supplied by the EIU).The SIPRI Arms Transfers Database covers all
international sales and gifts of major conventional weapons and the
technology necessary for the production of them.The transfer
equipment or technology is from one country, rebel force or
international organisation to another country, rebel force or
international organisation. Major conventional weapons include:
aircraft, armoured vehicles, artillery, radar systems, missiles, ships
and engines. SIPRI uses a unique pricing system, the Trend Indicator
Value (TIV) that measures military capability.The indicator raw value
is measured as TIV per 100,000 population.
Scoring Bands
1/5 2/5 3/5 4/5 5/5
0-3.681 3.682-7.364 7.365-11.046 11.047-14.729 >14.73
Number of Refugees and Internally Displaced People
as a Percentage of the Population
Indicator type Quantitative
Indicator weight 4
Indicator weight (% of total index) 5.7%
Data source UNHCR Mid-Year
Trends 2024;
International
Displacement
Monitoring Centre
(IDMC)
Measurement period 2024
recorded. From this, the outstanding amount is calculated for
that year.
3. The ratio of outstanding payments to assessments is
calculated. By doing so a score between 0 and 1 is obtained.
Zero indicates no money is owed; a country has met their
funding commitments. A score of 1 indicates that a country
has not paid any of their assessed contributions. Given that
the scores already fall between 0 and 1, they are easily
banded into a score between 1 and 5. The final banded score
is a weighted sum of the current year and the previous two
years. The weightings are 0.5 for the current year, 0.3 for the
previous year and 0.2 for two years prior. Hence it is a three-
year weighted average.
4. Outstanding payments from previous years and credits are not
included. The scoring is linear to one decimal place.
Scoring Criteria
1/5 0–25% of stated contributions owed
2/5 26–50% of stated contributions owed
3/5 51–75% of stated contributions owed
4/5 75–99% of stated contributions owed
5/5
100% of stated contributions owed
(no contributions made in past three years)
Additional Notes: All United Nations member states share the costs
of United Nations peacekeeping operations.The General Assembly
apportions these expenses based on a special scale of assessments
applicable to peacekeeping.This scale takes into account the relative
economic wealth of member states, with the permanent members of
the Security Council required to pay a larger share because of their
special responsibility for the maintenance of international peace and
security.
Nuclear and Heavy Weapons Capabilities
Indicator type Quantitative
Indicator weight 3
Indicator weight (% of total index) 4.2%
Data source IISS Military Balance+
Measurement period 2024
Methodology: This indicator is based on a categorised system for
rating the destructive capability of a country’s stock of heavy
weapons. Holdings are those of government forces and do not
include holdings of armed opposition groups.
The scoring system incorporates armoured vehicles, artillery,
tanks, combat aircraft and combat helicopters, warships, aircraft
carriers and nuclear submarines. It takes into account military
sophistication, weapons technology, and combat readiness.
Countries with nuclear capabilities automatically receive the
maximum score of five. Other scores are expressed to the second
decimal point, adopting a min-max normalisation that sets the max at
two standard deviations above the average raw score.
1/5 Nil–18,185
2/5 18,185–36,368
3/5 36,368–54,553
112.
110
Global Peace Index2025 | Measuring peace in a complex world
Each individual conflict score is based on the following factors:
Number:
• Number of internationalised internal armed conflicts and
interstate armed conflicts.
• If a conflict is a war (1,000+ battle-related deaths)
it receives a score of one; if it is an armed conflict (25-999
battle-related deaths) it receives a score of 0.25.
Duration:
• A score is assigned based on the number of years out of the
last five that conflict has occurred. For example, if a conflict
last occurred five years ago that conflict will receive a score of
one out of five.
Role:
• If the country is a primary party to the conflict, that conflict
receives a score of one; if it is a secondary party (supporting
the primary party), that conflict receives a score of 0.25.
• If a country is a party to a force covered by a relevant United
Nations Security Council Resolution, then the entire conflict
score is multiplied by a quarter; if not, it receives a full score.
The different conflict scores are then added and banded to
establish a country’s score.
Scoring Bands
1/5 2/5 3/5 4/5 5/5
No
external
conflict
Combined
conflict
score of
up to 1.5
Combined
conflict
score of
up to 3
Combined
conflict
score of
up to 4.5
A combined conflict
score of 6 or above.
This shows very high
levels of external
conflict.
Number of Deaths from Organised External Conflict
Indicator type Quantitative
Indicator weight 5
Indicator weight (% of total index) 7.1%
Data source UCDP Georeferenced
Event Dataset and
Candidate Dataset
Measurement period 2024
Alternate Source: Where applicable, IEP also uses several other
open-source datasets to construct this indicator.
Definition: This indicator uses the UCDP’s definition of conflict as “a
contested incompatibility that concerns government and/or territory
where the use of armed force between two parties, results in at least
25 battle-related deaths in a year”.
Scoring Bands
1/5 2/5 3/5 4/5 5/5
0–24 deaths 25–998
deaths
999–4,998
deaths
4,999–9,998
deaths
> 9,999
deaths
Definition: Refugee population by country or territory of origin plus
the number of a country’s internally displaced people (IDPs), as a
percentage of the country’s total population.
Scoring Bands
1/5 2/5 3/5 4/5 5/5
0-3.034 3.035-
6.069
6.07-9.104 9.105-12.139 >12.14
Relations with Neighbouring Countries
Indicator type
Qualitative
Indicator weight 5
Indicator weight (% of total index) 7.1%
Data source EIU
Measurement period March 2024 to
March 2025
Definition: Assessment of the intensity of contentiousness of
neighbours, ranked from 1-5 (peaceful to very aggressive) by the
EIU’s Country Analysis team. Country analysts are asked to assess
this indicator on an annual basis, for the period March to March.
Scoring Criteria
1 = Peaceful: None of the neighbours has attacked the
country since 1950.
2 = Low: The relationship with neighbours is generally good,
but aggressiveness is manifest in politicians’ speeches or
in protectionist measures.
3 = Moderate: There are serious tensions and consequent
economic and diplomatic restrictions from other
countries.
4 = Aggressive: Open conflicts with violence and protests.
5 = Very aggressive: Frequent invasions by neighbouring
countries.
External Conflicts Fought
Indicator type Quantitative
Indicator weight 2.28
Indicator weight (% of total index) 3.2%
Data source IEP; UCDP Battle-
Related Deaths
Dataset
Measurement period 2019–2023
Definition: This indicator measures the number and duration of
extraterritorial conflicts a country is involved in. Information for this
indicator is sourced from the UCDP Battle-Related Deaths Dataset.
The score for a country is determined by adding all individual conflict
scores where that country is involved as an actor in a conflict outside
its legal boundaries. Conflicts are not counted against a country if
they have already been counted against that country in the number
and duration of internal conflicts indicator.
113.
Appendices
111
6
TABLE C.1
Ongoing Domesticand International Conflict domain, most peaceful to least
GPI Domain Scores
APPENDIX C
COUNTRY SCORE
Iceland 1
Mauritius 1
New Zealand 1
Singapore 1
Uruguay 1
Malaysia 1.008
Ireland 1.028
Switzerland 1.053
Italy 1.053
Botswana 1.055
Belgium 1.07
United Kingdom 1.071
Austria 1.075
Netherlands 1.076
Germany 1.099
Portugal 1.163
Spain 1.168
Bulgaria 1.201
Croatia 1.201
Mongolia 1.201
Namibia 1.201
Costa Rica 1.209
Argentina 1.22
Australia 1.245
Trinidad and Tobago 1.25
Canada 1.254
Denmark 1.254
Jamaica 1.258
Czechia 1.272
Albania 1.403
Chile 1.403
Hungary 1.403
Japan 1.403
Kuwait 1.403
Laos 1.403
North Macedonia 1.403
Qatar 1.403
Slovenia 1.403
Timor-Leste 1.403
Panama 1.411
Greece 1.412
France 1.418
Vietnam 1.421
United Arab Emirates 1.425
Bolivia 1.432
Montenegro 1.443
Latvia 1.446
Paraguay 1.453
Estonia 1.455
Finland 1.455
Lithuania 1.455
Norway 1.455
El Salvador 1.461
Liberia 1.463
Oman 1.475
COUNTRY SCORE
Madagascar 1.476
Saudi Arabia 1.497
Bhutan 1.51
Peru 1.518
The Gambia 1.565
Romania 1.565
Angola 1.567
Senegal 1.582
Sweden 1.589
Cyprus 1.604
Dominican Republic 1.604
Guinea-Bissau 1.604
Equatorial Guinea 1.604
Guyana 1.604
Slovakia 1.604
Turkmenistan 1.604
Taiwan 1.62
Kazakhstan 1.622
Eswatini 1.625
Poland 1.626
Azerbaijan 1.642
Zambia 1.652
Armenia 1.669
Nepal 1.676
Eritrea 1.717
Ghana 1.722
Republic of the Congo 1.725
Sierra Leone 1.748
Cambodia 1.767
Sri Lanka 1.767
Tunisia 1.775
Côte d'Ivoire 1.785
Cuba 1.805
South Korea 1.805
Kosovo 1.805
Uzbekistan 1.805
Malawi 1.806
Mauritania 1.81
Jordan 1.821
Bosnia and Herzegovina 1.833
Uganda 1.834
Thailand 1.835
Honduras 1.836
Algeria 1.859
Lesotho 1.86
Tanzania 1.861
Papua New Guinea 1.867
Gabon 1.879
Indonesia 1.879
Guatemala 1.883
Serbia 1.915
China 1.946
Serbia 1.915
China 1.946
Djibouti 1.989
COUNTRY SCORE
Morocco 2.004
Bahrain 2.007
Georgia 2.012
Kyrgyz Republic 2.017
Tajikistan 2.017
Moldova 2.025
United States of America 2.025
Zimbabwe 2.025
Nicaragua 2.031
Egypt 2.049
Benin 2.064
Mozambique 2.081
India 2.097
South Africa 2.106
Ecuador 2.129
Brazil 2.135
Rwanda 2.145
Guinea 2.175
Philippines 2.182
Belarus 2.208
Venezuela 2.237
Togo 2.308
Libya 2.329
Colombia 2.369
Kenya 2.384
Bangladesh 2.554
Chad 2.581
North Korea 2.61
Central African Republic 2.619
Haiti 2.675
Mexico 2.675
Iraq 2.683
Afghanistan 2.767
Burundi 2.811
Cameroon 2.896
Myanmar 2.917
Pakistan 2.927
South Sudan 2.958
Lebanon 3.051
Israel 3.063
Niger 3.112
Somalia 3.134
Turkiye 3.166
Yemen 3.182
Iran 3.183
Nigeria 3.183
Ethiopia 3.193
Mali 3.251
Burkina Faso 3.311
Palestine 3.344
Syria 3.536
Democratic Republic of the Congo 3.647
Sudan 3.691
Ukraine 4.005
Russia 4.195
114.
112
Global Peace Index2025 | Measuring peace in a complex world
TABLE C.2
Societal Safety and Security domain, most to least peaceful
COUNTRY SCORE
Iceland 1.212
Norway 1.261
Finland 1.269
Japan 1.292
Singapore 1.294
Denmark 1.296
Switzerland 1.332
Qatar 1.4
New Zealand 1.421
Ireland 1.427
Austria 1.454
South Korea 1.454
Slovenia 1.472
Lithuania 1.494
Estonia 1.504
Netherlands 1.508
Australia 1.547
Czechia 1.56
Sweden 1.584
United Kingdom 1.599
Germany 1.621
Portugal 1.625
Latvia 1.633
Croatia 1.643
Kuwait 1.645
Hungary 1.646
Canada 1.654
Belgium 1.678
Slovakia 1.678
Bhutan 1.697
Poland 1.723
Spain 1.724
Greece 1.769
Taiwan 1.77
Oman 1.786
Italy 1.787
Romania 1.801
United Arab Emirates 1.816
Bulgaria 1.914
Serbia 1.923
France 1.934
Indonesia 1.958
Montenegro 1.962
North Macedonia 1.967
Malaysia 1.974
Vietnam 2.014
Armenia 2.033
Albania 2.038
Saudi Arabia 2.041
Ghana 2.135
Jordan 2.138
Kosovo 2.144
Laos 2.155
Timor-Leste 2.158
COUNTRY SCORE
Bosnia and Herzegovina 2.162
Tanzania 2.163
Moldova 2.171
Mauritius 2.173
Kyrgyz Republic 2.176
Kazakhstan 2.182
Uzbekistan 2.183
Algeria 2.209
The Gambia 2.215
Morocco 2.216
China 2.219
Cyprus 2.22
Malawi 2.224
Tajikistan 2.226
Rwanda 2.243
Bahrain 2.254
Cambodia 2.263
India 2.277
Sierra Leone 2.28
Mongolia 2.282
Chile 2.315
Botswana 2.343
Madagascar 2.355
Namibia 2.363
Sri Lanka 2.369
United States of America 2.369
Zambia 2.383
Côte d'Ivoire 2.392
Argentina 2.399
Tunisia 2.406
Nepal 2.412
Thailand 2.413
Azerbaijan 2.414
Costa Rica 2.419
Liberia 2.421
Angola 2.425
Turkmenistan 2.428
Philippines 2.429
Bolivia 2.442
Egypt 2.446
Belarus 2.47
Senegal 2.478
Equatorial Guinea 2.496
Bangladesh 2.504
Guinea-Bissau 2.515
Paraguay 2.528
Dominican Republic 2.538
Georgia 2.54
Uruguay 2.545
Djibouti 2.55
Guinea 2.556
Mauritania 2.59
Republic of the Congo 2.63
Benin 2.649
COUNTRY SCORE
Papua New Guinea 2.671
El Salvador 2.684
Gabon 2.691
Zimbabwe 2.693
Cuba 2.697
Togo 2.7
Guatemala 2.701
Eswatini 2.703
Israel 2.706
Lesotho 2.718
Nicaragua 2.723
Kenya 2.73
Panama 2.74
Palestine 2.756
Peru 2.767
Lebanon 2.779
Jamaica 2.787
Trinidad and Tobago 2.798
Uganda 2.811
Iran 2.814
Mozambique 2.821
Burundi 2.828
Pakistan 2.871
Ethiopia 2.919
Guyana 2.928
South Africa 2.949
Niger 2.961
Cameroon 2.97
Chad 2.971
Libya 3.021
Honduras 3.023
North Korea 3.033
Ecuador 3.041
Russia 3.062
Turkiye 3.114
Mexico 3.151
Ukraine 3.197
Nigeria 3.218
Brazil 3.231
Burkina Faso 3.288
Haiti 3.359
Iraq 3.393
Venezuela 3.409
Mali 3.478
Colombia 3.481
Eritrea 3.512
Somalia 3.542
Syria 3.568
Central African Republic 3.575
Myanmar 3.582
Sudan 3.647
Democratic Republic of the Congo 3.713
South Sudan 3.833
Yemen 3.861
Afghanistan 3.929
115.
Appendices
113
6
TABLE C.3
Militarisation domain,most peaceful to least
COUNTRY SCORE
Iceland 1.019
Portugal 1.194
Malaysia 1.202
Bhutan 1.285
Ireland 1.301
Slovenia 1.305
Moldova 1.312
Austria 1.328
Mauritius 1.365
Indonesia 1.366
Hungary 1.388
Sierra Leone 1.417
Czechia 1.418
Mongolia 1.429
Argentina 1.45
Zambia 1.452
New Zealand 1.453
Rwanda 1.477
Senegal 1.483
Slovakia 1.483
Bosnia and Herzegovina 1.507
Canada 1.529
Guyana 1.531
Uruguay 1.543
Cuba 1.55
Panama 1.552
Montenegro 1.563
Latvia 1.567
Timor-Leste 1.567
Switzerland 1.575
Dominican Republic 1.588
Nicaragua 1.591
Thailand 1.611
Tunisia 1.613
Vietnam 1.613
Peru 1.622
Tajikistan 1.622
The Gambia 1.628
Namibia 1.629
Finland 1.63
Mozambique 1.647
Bulgaria 1.651
Botswana 1.659
South Africa 1.665
Nepal 1.668
Kosovo 1.67
Morocco 1.672
Ethiopia 1.673
Laos 1.679
Madagascar 1.679
Kyrgyz Republic 1.683
Uzbekistan 1.685
Uganda 1.694
Equatorial Guinea 1.695
Eswatini 1.701
COUNTRY SCORE
Benin 1.704
Brazil 1.706
Guatemala 1.709
Philippines 1.709
Bangladesh 1.715
Zimbabwe 1.722
Costa Rica 1.726
Japan 1.728
Malawi 1.731
Haiti 1.751
Kazakhstan 1.756
Ghana 1.758
Croatia 1.759
Colombia 1.762
Tanzania 1.763
Mexico 1.764
Burundi 1.766
Trinidad and Tobago 1.77
Denmark 1.774
Libya 1.781
Liberia 1.782
Georgia 1.786
Taiwan 1.787
Belgium 1.79
Cyprus 1.79
Romania 1.791
Australia 1.799
Estonia 1.801
Somalia 1.811
Eritrea 1.815
Jordan 1.817
Paraguay 1.819
Angola 1.82
Egypt 1.821
Lithuania 1.822
Poland 1.829
Kenya 1.855
Republic of the Congo 1.863
Spain 1.889
Guinea 1.89
Jamaica 1.891
Honduras 1.904
Chile 1.912
Cameroon 1.917
Nigeria 1.917
Côte d'Ivoire 1.923
Serbia 1.939
Turkmenistan 1.939
Turkiye 1.941
Gabon 1.953
Togo 1.96
Ecuador 1.961
Armenia 1.972
Cambodia 1.987
Niger 1.989
COUNTRY SCORE
Germany 1.994
Bahrain 1.995
Azerbaijan 2.007
Singapore 2.011
Albania 2.021
Papua New Guinea 2.022
Sri Lanka 2.026
Chad 2.026
Belarus 2.029
Kuwait 2.034
Iran 2.037
Algeria 2.039
China 2.041
Syria 2.047
Lebanon 2.049
Bolivia 2.068
Lesotho 2.069
South Sudan 2.069
Netherlands 2.07
Oman 2.076
Sweden 2.079
North Macedonia 2.1
Venezuela 2.111
Mauritania 2.115
Democratic Republic of the Congo 2.117
South Korea 2.119
El Salvador 2.119
Central African Republic 2.162
Mali 2.162
Guinea-Bissau 2.18
Burkina Faso 2.19
Djibouti 2.229
Iraq 2.236
Qatar 2.237
Palestine 2.265
Sudan 2.268
Greece 2.303
Yemen 2.313
Italy 2.315
Myanmar 2.326
United Arab Emirates 2.374
India 2.399
United Kingdom 2.491
Pakistan 2.593
Norway 2.619
Afghanistan 2.622
France 2.775
Saudi Arabia 2.816
Russia 3.061
Ukraine 3.11
North Korea 3.132
United States of America 3.145
Israel 3.917
116.
114
Global Peace Index2025 | Measuring peace in a complex world
Endnotes
SECTION 1
1. Fisher, D. (2024). NZDF in crisis – Our Ships Can’t Sail, Planes Can’t
Fly and Soldiers Have Left in Droves.The New Zealand Herald.
https://www.nzherald.co.nz/nz/politics/nz-defence-force-in-crisis-
our-ships-cant-sail-planes-cant-fly-and-soldiers-have-left-in-droves/
YP5RTDCFWBE7FFG23IJIK634UU/.
2. Lee-Frampton, N. (2023). New Zealand Unveils Defense Budget, with
Army in the Lead. DefenseNews. https://www.defensenews.com/global/
asia-pacific/2023/05/18/new-zealand-unveils-defense-budget-with-army-
in-the-lead/.
3. Todorov, S. (2025). Bulgaria’s Constitutional Court Disqualifies Election of
17 MPs. BalkanInsight. https://balkaninsight.com/2025/03/13/bulgarias-
constitutional-court-disqualifies-election-of-17-mps/.
4. Stoyan, N. (2025). Bulgaria’s Anti-Euro Protesters Try to Storm EU
Mission Building. Reuters. https://www.reuters.com/world/europe/.
bulgarias-anti-euro-protesters-try-storm-eu-mission-building-2025-02-22/
5. BBC. (2024). Nagorno-Karabakh Profile. https://www.bbc.com/news/
world-europe-18270325.
6. AJLabs. (2025). Israel-Gaza War in Maps and Charts: Live Tracker. Al
Jazeera. https://www.aljazeera.com/news/longform/2023/10/9/israel-
hamas-war-in-maps-and-charts-live-tracker.
7. Jafarnia, N. (2025). Israel Again Blocks Gaza Aid, Further Risking Lives.
Human Rights Watch. https://www.hrw.org/news/2025/03/05/israel-again-
blocks-gaza-aid-further-risking-lives.
8. UNHCR. (2025). Syria Refugee Crisis Explained. https://www.
unrefugees.org/news/syria-refugee-crisis-explained/.
9. Associated Press. (2025). Syria Swears in New Transitional Government
Months After Assad’s Removal. https://edition.cnn.com/2025/03/30/
middleeast/syria-new-transitional-government-intl-hnk/index.html.
10. Salhani, J. (2025). Lebanon-Syria Border Clashes Reflect New
Realities on the Ground. Al Jazeera. https://www.aljazeera.com/
features/2025/3/24/lebanon-syria-border-clashes-reflect-new-realities-on-
the-ground.
11. WHO. (2025). Eighty Percent of WHO-supported Facilities in Afghanistan
Risk Shutdown by June. https://www.emro.who.int/afg/afghanistan-news/
eighty-percent-of-who-supported-facilities-in-afghanistan-risk-shutdown-
by-june.html.
12. Ani. (2025). Indo-Nepal joint exercise Surya Kiran showcases military
cooperation.The Tribune India. https://www.tribuneindia.com/news/
counterterrorism/indo-nepal-joint-exercise-surya-kiran-showcases-
military-cooperation.
13. EIU. (2025). Uganda Deploys Additional Troops to DRC. https://www.eiu.
com/n/uganda-deploys-additional-troops-to-drc/.
14. SEESAC. (2024).The Western Balkans SALW Control Roadmap by
2030 Endorsed During the EU - Western Balkans Ministerial Forum on
Justice and Home Affairs. https://www.seesac.org/News-SALW/Western-
Balkans-SALW-Control-Roadmap-by-2030-endorsed-during-the-EU-
Western-Balkans-Ministerial-Forum/
15. Edvardsen, A. (2024).The Norwegian Government Proposes a NOK 19
Billion Increase in Defense Spending. High North News. https://www.
highnorthnews.com/en/norwegian-government-proposes-nok-19-billion-
increase-defense-spending.
16. Center for Preventive Action. (2025). Nagorno-Karabakh Conflict. Global
Conflict Tracker. https://www.cfr.org/global-conflict-tracker/conflict/
nagorno-karabakh-conflict#:~:text=Following%20a%20summer%20
of%20cross-border%20attacks%2C%20heavy%20fighting,with%20
hundreds%20more%20Armenian%20and%20Azerbaijani%20
soldiers%20wounded.
17. Eurasianet. (2025). A Peace Treaty is Finalized, but Azerbaijan is
Accusing Armenia of Preparing for War. MSN. https://www.msn.com/
en-us/news/world/a-peace-treaty-is-finalized-but-azerbaijan-is-accusing-
armenia-of-preparing-for-war/ar-AA1BaREW?ocid=BingNewsVerp
18. Patience Atuhaire in Kampala & James Gregory in London. (2023).
Uganda School Attack: Dozens of Pupils Killed by Militants Linked
to Islamic State Group. BBC. https://www.bbc.com/news/world-
africa-65937484.
19. Al Jazeera. (2025). Uganda Deploys Troops in South Sudan as Civil War
Fears Grow. https://www.aljazeera.com/news/2025/3/11/uganda-deploys-
troops-in-south-sudan-as-civil-war-fears-grow#:~:text=Uganda%20
has%20deployed%20special%20forces%20in%20South%20
Sudan,%E2%80%9Csecure%E2%80%9D%20Juba%2C%20the%20
capital%20of%20Uganda%E2%80%99s%20northern%20neighbour.
20. Conflict on Senegal-Gambia border
21. Clavilier, Y. & Gjerstad, M. (2025). Combat Losses and Manpower
Challenges Underscore the Importance of ‘Mass’ in Ukraine. International
Institute for Strategic Studies. https://www.iiss.org/online-analysis/military-
balance/2025/02/combat-losses-and-manpower-challenges-underscore-
the-importance-of-mass-in-ukraine/.
22. Al Jazeera. (2024). Protest Turns Violent as Activist Jailed in Russia’s
Bashkortostan. https://www.aljazeera.com/news/2024/1/17/protest-turns-
violent-as-activist-jailed-in-russias-bashkortostan.
23. IEP. (2025). Global Terrorism Index 2025. https://www.
economicsandpeace.org/wp-content/uploads/2025/03/Global-Terrorism-
Index-2025.pdf.
24. UNHCR. DR Congo Emergency. https://www.unhcr.org/us/emergencies/
dr-congo-emergency#:~:text=In%202025%2C%20due; IDMC. (2024).
2024 Global Report on Internal Displacement (GRID). https://www.
internal-displacement.org/global-report/grid2024/.
25. San, H. (2025). In Myanmar, a Disaster in a War Zone Means a Slow
and Difficult Aid Response.The New Humanitarian. https://www.
thenewhumanitarian.org/news-feature/2025/04/22/myanmar-disaster-
conflict-war-zone-means-slow-difficult-aid-response.
SECTION 2
1. Campbell, C. (2024). How Mass Protests Challenge Bangladesh’s Past-
and Threaten to Rewrite Its Future.TIME. https://time.com/7003130/
bangladesh-student-protests-police-job-quota-hasina-awami-league-
razakars/.
2. Haig, C. S., Schmidt, K., & Brannen, S. (2020).The Age of Mass Protests:
Understanding an Escalating Global Trend. Center for Strategic and
International Studies. https://www.csis.org/analysis/age-mass-protests-
understanding-escalating-global-trend.
3. UNHCR. (2024). Refugee Data Finder. https://www.unhcr.org/refugee-
statistics/.
4. UNHCR. (2024). Mid-Year Trends 2024. https://www.unhcr.org/mid-year-
trends-report-2024.
5. UNHCR. (2025). Syria Situation. https://reporting.unhcr.org/operational/
situations/syria-situation.
6. AP news. (2024). Honduras Plans to Build a 20,000-Capacity
“megaprison” for Gang Members as Part of a Crackdown. https://apnews.
com/article/honduras-prison-crackdown-megaprison-gang-violence-
drugs-64ade5841d6ba79f397f0074b2641667.
7. Atlamazoglou, C. (2025). Russia’s Arms Exports are Going Bust as
Foreign Buyers Bolt and the Ukraine War Chews Through its Weapons.
Business Insider. https://www.businessinsider.com/russian-arms-exports-
drop-amid-war-in-ukraine-2025-3.
8. Nato. (2025). Defence Expenditures and NATO’s 2% guideline. https://
www.nato.int/cps/en/natohq/topics_49198.htm.
9. Bayer, L. & Gray, A. (2025). NATO Won’t Back Trump’s New Defence
Spending Target but Will Raise its Sights. Reuters. https://www.reuters.
com/world/nato-wont-back-trumps-new-defence-spending-target-will-
raise-its-sights-2025-01-10/.
10. European Commission. (2025). Commission Unveils the White Paper for
European Defence and the ReArm Europe Plan/Readiness 2030. https://
ec.europa.eu/commission/presscorner/detail/en/ip_25_793.
SECTION 3
1. Leonhardt, D. (2023). A Turning Point for Military Spending.The New York
Times. https://www.nytimes.com/2023/07/12/briefing/nato-summit.html.
2. 2International Monetary Fund. (2024). World Economic Outlook, April
2024: Steady but Slow: Resilience amid Divergence. https://www.imf.
org/en/Publications/WEO/Issues/2024/04/16/world-economic-outlook-
april-2024.
3. 3International Monetary Fund. (2023). Inflation Peaking Amid Low
Growth. https://www.imf.org/en/Publications/WEO/Issues/2023/01/31/
world-economic-outlook-update-january-2023.
4. 4Dashiell, P. & Wright, R. (2025). Economic Challenges in the Middle
East in 2025. Wilson Center. https://www.wilsoncenter.org/article/
economic-challenges-middle-east-2025.
5. Dashiell, P. & Wright, R. (2025). Economic Challenges in the Middle East
in 2025. Wilson Center. https://www.wilsoncenter.org/article/economic-
challenges-middle-east-2025.
6. Pastor, Manuel. "The IMF, Austerity, and the State in Latin America."
Latin American Perspectives 21, no. 1 (1994): 88–102. https://www.jstor.
org/stable/2633820.
7. Dashiell, P. & Wright, R. (2025). Economic Challenges in the Middle East
in 2025. Wilson Center. https://www.wilsoncenter.org/article/economic-
challenges-middle-east-2025.
8. ThinkTanker. (2024). 5 Major Risks Confronting the Global Economy in
2024. https://www.thinktanker.org/article-posts/5-major-risks-confronting-
the-global-economy-in-2024.
9. ThinkTanker. (2024). 5 Major Risks Confronting the Global Economy in
117.
Endnotes
115
2024. https://www.thinktanker.org/article-posts/5-major-risks-confronting-
the-global-economy-in-2024.
10. ThinkTanker.(2024). 5 Major Risks Confronting the Global Economy in
2024. https://www.thinktanker.org/article-posts/5-major-risks-confronting-
the-global-economy-in-2024.
11. ThinkTanker. (2024). 5 Major Risks Confronting the Global Economy in
2024. https://www.thinktanker.org/article-posts/5-major-risks-confronting-
the-global-economy-in-2024.
12. World Economic Forum. (2024). Global Risks Report 2024. https://www.
weforum.org/publications/global-risks-report-2024/.
13. S&P Global Ratings. (2024). Sovereign Debt 2024: Borrowing Will
Hit New Post-Pandemic Highs. https://www.spglobal.com/ratings/en/
research/articles/240227-sovereign-debt-2024-borrowing-will-hit-new-
post-pandemic-highs-13012884.
14. Feingold, S. (2024). Global Debt Levels Are on the Rise. How Worried
Should We Be? World Economic Forum. https://www.weforum.org/
stories/2024/09/global-debt-crisis-development-chief-economy/.
15. Feingold, S. (2024). Global Debt Levels Are on the Rise. How Worried
Should We Be? World Economic Forum. https://www.weforum.org/
stories/2024/09/global-debt-crisis-development-chief-economy/.
16. Feingold, S. (2024). Global Debt Levels Are on the Rise. How Worried
Should We Be? World Economic Forum. https://www.weforum.org/
stories/2024/09/global-debt-crisis-development-chief-economy/.
17. Feingold, S. (2024). Global Debt Levels Are on the Rise. How Worried
Should We Be? World Economic Forum. https://www.weforum.org/
stories/2024/09/global-debt-crisis-development-chief-economy/.
18. World Economic Forum. (2024). Global Risks Report 2024. https://www.
weforum.org/publications/global-risks-report-2024/.
19. Feingold, S. (2024). Global Debt Levels Are on the Rise. How Worried
Should We Be? World Economic Forum. https://www.weforum.org/
stories/2024/09/global-debt-crisis-development-chief-economy/.
20. Yabi, G. (2024).The Sahel’s Intertwined Challenges. International
Monetary Fund. https://www.imf.org/en/Publications/fandd/
issues/2024/09/the-sahels-intertwined-challenges-yabi.
21. Dashiell, P. & Wright, R. (2025). Economic Challenges in the Middle East
in 2025. Wilson Center. https://www.wilsoncenter.org/article/economic-
challenges-middle-east-2025.
22. Coface. (2025). Sub-Saharan Africa, the First Victim of the USAID
Reduction. https://www.coface.com/news-economy-and-insights/sub-
saharan-africa-the-first-victim-of-the-usaid-reduction.
23. Baragona, S. (2011). 2011 Food Price Spikes Helped Trigger Arab
Spring, Researchers Say.VOA News. https://www.voanews.com/a/article-
2011-food-price-spikes-helped-trigger-arab-spring-135576278/149523.
html.
24. Zurayk, R. (2011). Use Your Loaf: Why Food Prices Were Crucial in the
Arab Spring. Global Policy Forum. https://archive.globalpolicy.org/social-
and-economic-policy/world-hunger/general-analysis-on-hunger/50456-
use-your-loaf-why-food-prices-were-crucial-in-the-arab-spring.html.
25. Human Rights Watch. (2023). World Report 2023: Lebanon. https://www.
hrw.org/world-report/2023/country-chapters/lebanon.
26. Dashiell, P. & Wright, R. (2025). Economic Challenges in the Middle East
in 2025. Wilson Center. https://www.wilsoncenter.org/article/economic-
challenges-middle-east-2025.
27. International Labour Organization. (2024). Global Employment Trends for
Youth 2024. https://www.ilo.org/publications/major-publications/global-
employment-trends-youth-2024.
28. Dashiell, P. & Wright, R. (2025). Economic Challenges in the Middle East
in 2025. Wilson Center. https://www.wilsoncenter.org/article/economic-
challenges-middle-east-2025.
29. Williams College. Federico Finchelstein Lecture: The New Populism in
Latin America and Beyond. https://events.williams.edu/event/federico-
finchelstein-lecture/; Holtzmann, H. & Paque, K. (2024). One Year of
Javier Milei’s Economic Policy. Friedrich Naumann Foundation for
Freedom. https://www.freiheit.org/one-year-javier-mileis-economic-policy.
30. Williams College. Federico Finchelstein Lecture: The New Populism in
Latin America and Beyond. https://events.williams.edu/event/federico-
finchelstein-lecture/.
31. McCollister, K. E., French, M.T., & Fang, H. (2010).The cost of crime
to society: new crime-specific estimates for policy and program
evaluation. Drug and alcohol dependence, 108(1-2), 98–109. https://doi.
org/10.1016/j.drugalcdep.2009.12.002.
32. Dolan, P., & Peasgood, T. (2007). Estimating the Economic and Social
Costs of the Fear of Crime.The British Journal of Criminology, 47(1),
121–132. http://www.jstor.org/stable/23639491
33. Brauer, J., & Marlin T. J. (2009). Defining Peace Industries and
Calculating the Potential Size of a Peace Gross World Product by
Country and by Economic Sector. https://www.files.ethz.ch/isn/126268/
definingpeaceindustrieandcalculatingapeacewgp.pdf.
SECTION 4
1. Siberdt, B. (2024). Why Onset Matters: Warfare, Intensity, and
Duration in Civil War. Journal of Conflict Resolution, 0(0). https://doi.
org/10.1177/00220027241293715.
2. Tollefsen, F. A., & Buhaung, H. (2015). Insurgency and Inaccessibility.
International Studies Review, 17(1), 6-25. https://doi.org/10.1111/
misr.12202.
3. Zhukov, Y. M. (2017). External Resources and Indiscriminate Violence:
Evidence from German-occupied Belarus. World Politics, 69(1), 54-97.
doi.org/10.1017/S0043887116000137.
4. Demir, B., & Uzonyi, G. Excluded Ethnic Groups, Conflict Contagion,
and the Onset of Genocide and Politicide during Civil War. International
Studies Quarterly, 64(4), 857–66. https://doi.org/10.1093/isq/sqaa059.
5. Meier, V., Karlén, N., Pettersson, T., & Croicu, M. (2022). External
Support in Armed Conflicts: Introducing the UCDP External Support
Dataset (ESD), 1975–2017. Journal of Peace Research, 60(3), 545-554.
https://doi.org/10.1177/00223433221079864.
6. Meier, V., Karlén, N., Pettersson, T., & Croicu, M. (2022). External support
in armed conflicts: Introducing the UCDP external support dataset (ESD),
1975–2017. Journal of Peace Research, 60(3), 545-554. https://doi.
org/10.1177/00223433221079864.
7. Nanlohy, S. (2024). Geopolitics and Genocide: Patron Interests, Client
Crises, and Realpolitik. Journal of Global Security Studies, 9(1),
ogad023. https://doi.org/10.1093/jogss/ogad023.
8. Ulrich, P. (2015). Private Military and Security Companies (PMSCs),
Military Effectiveness, and Conflict Severity in Weak States, 1990–
2007. Journal of Conflict Resolution, 61(5), 1046-1072. https://doi.
org/10.1177/0022002715600758.
9. Nicholas, L., & Ulrich, P. (2021).To Escalate, or Not to Escalate? Private
Military and Security Companies and Conflict Severity. Studies in
Conflict & Terrorism, 46(12), 2622-2645. https://doi.org/10.1080/105761
0X.2021.1935700.
10. Arturas, R., Talibova, R., & Zhukov, Y. (2024). Fighting for Tyranny:
State Repression and Combat Motivation. American Economic
Journal: Applied Economics, 16(3), 44–75. https://www.aeaweb.org/
articles?id=10.1257/app.20220085.
11. Jason, L., & Zhukov, Y. (2025). Fratricidal Coercion in Modern War.
International Organization, 79(1), 173–92. https://doi.org/10.1017/
S002081832400033X.
12. Brass, P. R. (1997).Theft of an Idol: Text and Context in the
Representation of Collective Violence. Princeton University Press. https://
doi.org/10.2307/j.ctv143mdk0; Maynard, J. L. (2019). Ideology and
Armed Conflict. Journal of Peace Research, 56(5), 635–649. https://doi.
org/10.1177/002234331982662.
13. Preston, P. (2006).The Spanish Civil War: Reaction, revolution and
revenge. Harper Perennial.
14. Preston, P. (2006).The Spanish Civil War: Reaction, revolution and
revenge. Harper Perennial.
15. Hochschild, A. (2016). Spain in Our Hearts: American in the Spanish Civil
War, 1936-1939. Houghton Mifflin; Whealey, R. (1989) Hitler and Spain:
The Nazi Role in the Spanish Civil War, 1936-1939. https://core.ac.uk/
download/pdf/232564113.pdf.
16. Balcells, L. (2017). Rivalry and Revenge: The Politics of Violence
during Civil War. https://assets.cambridge.org/97811071/18690/
frontmatter/9781107118690_frontmatter.pdf.
17. Preston, P. (2006).The Spanish Civil War: Reaction, revolution and
revenge. Harper Perennial.
18. Kalyvas, S. N. (2006).The Logic of Violence in Civil War. Cambridge
University Press.
19. Mazower, M. (1996).The Origins of the Greek Civil War, and: Children in
Turmoil during the Greek Civil War, 1946-49: Today's Adults, and: Greece
at the Crossroads: The Civil War and its Legacy, and: Stopping the Killing:
How Civil Wars End. Journal of Modern Greek Studies, 14(1), 177-181.
https://doi.org/10.1353/mgs.1996.0003.
20. Kalyvas, S. N. (2006).The Logic of Violence in Civil War. Cambridge
University Press.
21. Nachmani, A. (1990). Civil War and Foreign Intervention in Greece: 1946-
49. Journal of Contemporary History, 25(4), 489-522. https://www.jstor.
org/stable/260759.
22. Commission for Historical Clarification. (1990). Guatemala: Memory
of Silence: Report of the Commission for Historical Clarification,
Conclusions and Recommendations. Human Rights Data Analysis
Group. https://hrdag.org/publications/guatemala-memory-of-silence/.
23. Commission for Historical Clarification. (1990). Guatemala: Memory
of Silence: Report of the Commission for Historical Clarification,
Conclusions and Recommendations. Human Rights Data Analysis
Group. https://hrdag.org/publications/guatemala-memory-of-silence/.
24. Commission for Historical Clarification. (1990). Guatemala: Memory
of Silence: Report of the Commission for Historical Clarification,
118.
116
Global Peace Index2025 | Measuring peace in a complex world
Conclusions and Recommendations. Human Rights Data Analysis
Group. https://hrdag.org/publications/guatemala-memory-of-silence/.
25. Sexton, R. (2020). Counterinsurgency and Genocide in Guatemala;
Reverberations of Vietnam. https://papers.ssrn.com/sol3/papers.
cfm?abstract_id=3522286.
26. Maynard, J. L. (2022). Ideology and Mass Killing: The radicalized security
politics of genocides and deadly atrocities. Oxford University Press.
27. Destradi, S. (2012. India and Sri Lanka's civil war: The failure of regional
conflict management in South Asia. Asian Survey, 52(3), 595-616. https://
doi.org/10.1525/as.2012.52.3.595.
28. Destradi, S. (2012. India and Sri Lanka's civil war: The failure of regional
conflict management in South Asia. Asian Survey, 52(3), 595-616. https://
doi.org/10.1525/as.2012.52.3.595.
29. United Nations Security Council. (2012). Report of the Secretary-
General’s Panel of Experts on Accountability in Sri Lanka.
Security Council Report. https://www.securitycouncilreport.org/atf/
cf/%7B65BFCF9B-6D27-4E9C-8CD3-CF6E4FF96FF9%7D/POC%20
Rep%20on%20Account%20in%20Sri%20Lanka.pdf.
30. Martin, P., & Vaughan, S. (2023). Understanding Ethiopia’s Tigray War.
London: Hurst.
31. Zelalem, Z. (2025). Deadly skies: Drone warfare in Ethiopia and the
future of conflict in Africa. European Council on Foreign Reflations.
https://ecfr.eu/publication/deadly-skies-drone-warfare-in-ethiopia-and-
the-future-of-conflict-in-africa/.
32. Brown, W., Kassa, L., & Zelalem, Z. (2022). How Tigray’s ‘Great War of
Africa’ is Raging Under the Cover of a Media Blackout.The Telegraph.
https://www.telegraph.co.uk/global-health/terror-and-security/how-tigrays-
great-war-africa-raging-cover-media-blackout/.
33. Financial Times. (2023). War in Tigray May Have Killed 600,000 People,
Peace Mediator Says. https://www.ft.com/content/2f385e95-0899-403a-
9e3b-ed8c24adf4e7.
34. Roy-Chaundhury, R. (2025). India-Pakistan Drong and Missile Conflict:
Differing and Disputed Narratives. International Institute for Strategic
Studies. https://www.iiss.org/online-analysis/online-analysis/2025/05/
indiapakistan-drone-and-missile-conflict-differing-and-disputed-
narratives/.
35. Singh, S. (2025). India and Pakistan Are Perilously Close to the Brink.
Foreign Affairs. https://www.foreignaffairs.com/india/india-pakistan-
kashmir-are-perilously-close-brink.
36. Dalton, T., & Kalwani, G. (2019). Might India Start the Next South Asia
Crisis? War on the Rocks. https://warontherocks.com/2019/11/might-
india-start-the-next-south-asia-crisis/.
37. Loft, P., & Mills, C. (2025). Syria After Assad: Consequences and Interim
Authorities 2025. UK Parliament. https://commonslibrary.parliament.uk/
research-briefings/cbp-10161/.
38. Loft, P. (2025). Syria: What Is the Situation Five Months After Assad's
Fall? UK Parliament. https://commonslibrary.parliament.uk/syria-what-is-
the-situation-five-months-after-assads-fall/
39. Al Hakari, M. (2025). Without a Caliphate, But Far from Defeated: Why
Da'esh/ISIS Remains a Threat in Syria in 2025. PRIF Blog. https://blog.
prif.org/2025/04/07/without-a-caliphate-but-far-from-defeated-why-daesh-
isis-remains-a-threat-in-syria-in-2025/
40. Al-Ahmed, S. (2025).The Damascus-SDF Agreement Two Months On:
Fragile Progress or Delayed Collapse? Middle East Institute. https://
www.mei.edu/publications/damascus-sdf-agreement-two-months-fragile-
progress-or-delayed-collapse.
41. International Organization for Migration. (2025) Syrian Arab Republic
Crisis Response Plan 2025. https://crisisresponse.iom.int/response/
syrian-arab-republic-crisis-response-plan-2025.
42. Eritrea Focus. (2025). Ethiopia's Red Sea Aspirations and Eritrea's
Interference in Tigray Heighten War Risks. https://eritrea-focus.org/
ethiopias-red-sea-aspirations-and-eritreas-interference-in-tigray-
heighten-war-risks/.
43. Al Jazeera. (2025). Are Ethiopia and Eritrea Hurtling Towards War?
https://www.aljazeera.com/news/2025/3/25/are-ethiopia-and-eritrea-on-
the-brink-of-war; Plaut, M. (2025). Eritrean Sovereignty and Ethiopia's
Quest for Red Sea Access. https://martinplaut.com/2025/04/17/eritrean-
sovereignty-and-ethiopias-quest-for-red-sea-access/; ACLED. (2025).
Expert Comment: The Possibility of War Between Ethiopia and Eritrea.
https://acleddata.com/2025/03/26/expert-comment-the-possibility-of-war-
between-ethiopia-and-eritrea/; Plaut, M. (2025). A Dangerous Frenemy:
Averting a Showdown Between Eritrea and Ethiopia. https://martinplaut.
com/2025/03/07/a-dangerous-frenemy-averting-a-showdown-between-
eritrea-and-ethiopia/.
44. Lob E. (2025). Iran and Ethiopia Have a Security Deal – Here's Why They
Signed It. Florida International University News. http://news.fiu.edu/2025/
iran-and-ethiopia-have-a-security-deal-heres-why-they-signed-it; Gebru,
T. (2025).The United Arab Emirates Engagement in Ethiopia. https://
www.swp-berlin.org/assets/afrika/publications/policybrief/MTA-PB35_
UAE_Engagement_in_Ethiopia_Gebru.pdf; Lesedi, S., & Military Africa.
(2025). Russia Agrees to Rebuild Ethiopian Navy After France Failed.
https://www.military.africa/2025/03/russia-agrees-to-rebuild-ethiopian-
navy-after-france-failed/.
45. Reconstituted Joint Monitoring and Evaluation Commission (RJMEC).
(2025). Quarterly Report on the Status of Implementation of the
Revitalised Agreement on the Resolution of the Conflict in the Republic
of South Sudan: 1 January – 31 March 2025. https://reliefweb.int/report/
south-sudan/rjmec-report-status-implementation-revitalised-agreement-
resolution-conflict-republic-south-sudan-period-1st-january-31st-
march-2025.
46. Marsden, D. R. (2025). South Sudan's Shaky Peace Is at Risk
of Collapse. Can It Be Saved? Chatham House. https://www.
chathamhouse.org/2025/04/south-sudans-shaky-peace-risk-collapse-
can-it-be-saved.
47. Bachmann, J., & Schouten, P. (2020). Buffering State-making: Geopolitics
in the Sudd Marshlands of South Sudan. Geopolitics, 29(3), 1027–1045.
https://doi.org/10.1080/14650045.2020.1858283.
48. Riak, J. D. C. (2025). Understanding State Dysfunctionality: The Role of
Political Elites in South Sudanese State-crafting and Failure.The Journal
of Social Sciences Research, 11(1), 23-35. https://research.uoj.edu.ss/
publications/sch-socio-economics/understanding-state-dysfunctionality-
the-role-of-political-elites-in-south-sudanese-state-crafting-and-failure/
dokish/1229/.
49. Riak, J. D. C. (2025). Understanding State Dysfunctionality: The Role of
Political Elites in South Sudanese State-crafting and Failure.The Journal
of Social Sciences Research, 11(1), 23-35. https://research.uoj.edu.ss/
publications/sch-socio-economics/understanding-state-dysfunctionality-
the-role-of-political-elites-in-south-sudanese-state-crafting-and-failure/
dokish/1229/.
50. Ali, M. (2025). Mapping the Human Toll of the Conflict in DR Congo.
Al Jazeera. https://www.aljazeera.com/news/2025/3/24/mapping-
the-human-toll-of-the-conflict-in-dr-congo; Dzinesa, G. A., & Rusero,
A. M. (2025). Another Regional Intervention Falls Short in the
Democratic Republic of the Congo.The Global Observatory. https://
theglobalobservatory.org/2025/03/another-regional-intervention-
falls-short-in-the-democratic-republic-of-the-congo/;Huon, P. (2025).
After the Fall of Goma and Bukavu, Where Is DR Congo’s M23 War
Headed? The New Humanitarian. https://www.thenewhumanitarian.
org/analysis/2025/03/20/after-fall-goma-and-bukavu-where-dr-congos-
m23-war-headed; International Medical Corps. (2025). Escalation of
Conflict in Eastern DRC Situation Report 3, April 16, 2025. Relief Web.
https://reliefweb.int/report/democratic-republic-congo/escalation-conflict-
eastern-drc-situation-report-3-april-16-2025.
51. Tyson, K., Ford, Y., & Karr L. (2025). Africa File, May 1, 2025: AU, Turk
Türkiye, and United States Surge to Halt al Shabaab; DRC Peace Talks;
Uganda’s Role in the Eastern DRC. Institute for the Study of War. https://
www.understandingwar.org/backgrounder/africa-file-may-1-2025-au-
turkey-and-united-states-surge-halt-al-shabaab-drc-peace; Al Jazeera.
(2025). DR Congo, M23 Rebels Announce Ceasefire after Peace Talks in
Qatar. Al Jazeera. https://www.aljazeera.com/news/2025/4/24/drc-m23-
rebels-commit-to-pause-fighting-amid-peace-talks.
SECTION 5
1. Rozado, D., Hughes, R., & Halberstadt, J. (2022). Longitudinal Analysis
of Sentiment and Emotion in News Media Headlines Using Automated
Labelling with Transformer Language Models. PLOS ONE, 17(10),
e0276367. https://doi.org/10.1371/journal.pone.0276367.
2. Berman, R. (2017). Social Media, New Technologies and the Middle
East. Hoover Institution. https://www.hoover.org/research/social-media-
new-technologies-and-middle-east.
3. Hoxha, A., & Hanitzsch, T. (2017). How Conflict News Comes into Being:
Reconstructing ‘Reality’Through Telling Stories. Media, War & Conflict,
11(1), 46-64. https://doi.org/10.1177/1750635217727313.
4. These countries are Russia (high income), Azerbaijan (upper-middle
income), Lebanon (lower-middle income), Israel (high income), and Iran
(upper-middle income). Note: Lebanon was also categorised as upper-
middle income until 2022, when its categorisation fell.
5. Amnesty International. (2023). Ethiopians in social media blackout
for second month. https://www.amnesty.org/en/latest/news/2023/03/
ethiopians-in-social-media-blackout-for-second-month/.
6. Issa, K. (2024). Dying to tell the story: How war has affected the work of
journalists in Ethiopia. Journalists for Justice. https://jfjustice.net/how-war-
has-affected-the-work-of-journalists-in-ethiopia/.
7. Internet Society Pulse. (2023). Regional shutdown: Amhara. https://pulse.
internetsociety.org/en/shutdowns/internet-shutdown-in-amhara-region-
ethiopia-august-2023/.
8. Gurr, G. (2022). Does Fatigue from Ongoing News Issues Harm News
Media? Assessing Reciprocal Relationships Between Audience Issue
Fatigue and News. Journalism Studies, 23(7), 858-875. https://www.
tandfonline.com/doi/pdf/10.1080/1461670X.2022.2049453
9. Hawkins, V. (2008). Stealth Conflicts: How the World's Worst Violence is
Ignored. Ashgate Publishing, Ltd.
10. Hawkins, V. (2014). Off the Radar: Stealth Conflicts and the Media. Fair
Observer. https://www.fairobserver.com/region/middle_east_north_africa/
off-the-radar-stealth-conflicts-and-the-media-32071/.
11. Hawkins, V. (2008). Stealth Conflicts: How the World's Worst Violence is
Ignored. Ashgate Publishing, Ltd.
Our research analysespeace
and its economic value.
We develop global and national indices, calculate the economic impact of violence, analyse country level
risk and have developed an empirical framework for Positive Peace that provides a roadmap to overcome
adversity and conflict, helping to build and sustain lasting peace.
Download our latest reports and research briefs for free at:
visionofhumanity.org/resources
122.
JUNE 2025 /IEP REPORT 105
FOR MORE INFORMATION
INFO@ECONOMICSANDPEACE.ORG
EXPLORE OUR WORK
WWW.ECONOMICSANDPEACE.ORG AND
WWW.VISIONOFHUMANITY.ORG
The Institute for Economics & Peace is a registered charitable
research institute in Australia as a Deductible Gift Recipient.
IEP USA is a 501(c)(3) tax exempt organization.
IEP is an independent, non-partisan, non-profit think
tank dedicated to shifting the world’s focus to peace as a
positive, achievable, and tangible measure of human well-
being and progress.
IEP is headquartered in Sydney, with offices in New York,
Brussels, The Hague, Mexico City and Nairobi. It works with
a wide range of partners internationally and collaborates
with intergovernmental organisations on measuring and
communicating the economic value of peace.
9 781763 755055 >
ISBN 978-1-7637550-5-5
@GlobPeaceIndex
GlobalPeaceIndex