LADY SHRI RAMCOLLEGE FOR
WOMEN
THE PLACEMENT CELL
1ST EDITION
BY ALUMNI OF LADY SHRI RAM COLLEGE
PRESENTS
2.
Welcome to thefirst edition of Lady Shri Ram College Consulting Casebook!
This casebook represents hundreds of hours of collective experience, dozens of interviews with recent graduates, and
the generous knowledge-sharing from LSR's extensive alumni network at the world's top consulting firms. Our goal was
simple: create the resource we desperately needed when we started our preparation journey.
As final-year students at LSR, we've just emerged from placement season with offers from firms like McKinsey, Bain,
BCG, and other leading consultancies.
LSR has long held the distinction of having one of the best undergraduate placements, and the highest in Delhi
university. Our alumni occupy impressive positions across the consulting world, from Associates to Partners. This
casebook is made using that strong network of Alumni
Inside, you'll find authentic interview transcripts shared by recent graduates, detailed breakdowns of case frameworks
tailored for undergraduate interviews, and practical advice on how to stand out as a candidate without years of work
experience. What makes this resource different is its specificity, we have added a new section of social cases that
companies asks and have also incuded other strategy questions.
The Placement Cell has enthusiastically worked on this initiative, recognizing its potential to strengthen our already
impressive consulting recruitment statistics. This book is openly accessible to everyone.
Best of luck with your preparation—we can't wait to see where you'll go next!
2
3.
THE AUTHORS
Diya Bhandari
Associate,BCG
Senior Co-ordinator
Vishwa Ambaliya
BD Manager, Cleanmax Energy
Research & Training Head
Sauradeepa Raha
Research & Training Assistant
Coordinator
THE CO-AUTHORS
3
Isha Choudhary Sana Gupta Arushi Goel Ridhima Asija Muskan Rajput Mansi Sharma Kyra Kashyap Khushi Garg
SPECIAL MENTIONS: Dhwani Makhija, Mehak Gupta, Unnati Hirwani, Aarti Rajput, Malavika Anand, Sara Gupta, Sheen Madan, Surbhi Jha, Gulpreet Kaur, Divanshi Gupta
4.
Creating this firstconsulting casebook has been a journey of collaboration, persistence, and discovery. This resource exists today because numerous
individuals believed in our vision of democratizing access to consulting preparation materials specifically designed for undergraduate students.
First and foremost, we're immensely grateful to the extraordinary alumni network who generously shared their time and experiences despite demanding
work schedules. Our deepest appreciation to:
Abhinav Singh, Aditi Das (Accenture), Aditi Maheshwari (BCG), Aiman Fatma (Praxis), Amanpreet Kaur (LEK), Ananya Rath (BCG), Anshika Jain (McKinsey),
Archita Deshmukh (Dalberg), Ashmeet Kaur (McKinsey), Ayushi Agarwal, Celina Srivastav (Accenture), Cherry Nangia (BCG), Dharmin Shah (BCG), Shreya
Kothari, Ayushi Agrawal (Kepler Canon), Gitan Chopra, Gunika Kakkar (McKinsey), Ishita Aggarwal (Kepler Canon), Jannat Dutta, Khushi Bhagel (Accenture),
Khushi Vadhera (Accenture), Kriti Mittal (Bain & Company), Krrish Kohli (BCG), Mitika Singla (ZS), Muskan Mundra (BCG), Nandini Gupta (ZS Associates),
Nehal Baveja, Om Singhal (ZS Associates), Omisha Vaish (BCG), Palak (ZS Associates), Paavni Dewan (Kepler Cannon), Pallavi Mundhra, Paridhi Gupta
(BCG), Pratham Shah (BCG), Prithaa (Deloitte), Rashee Babbar (McKinsey), Rishabh Aggarwal (BCG), Ruhani Bakhru (McKinsey), Ruhani Taneja (Redseer),
Sanskriti Pattnaik (FTI Consulting), Shravani Indurkar (McKinsey), Shoumik Das (McKinsey), Shreya Mahajan, Suhani Agarwal (McKinsey), Tanay Banerjee
(McKinsey), Varnit Pandey (Nation with Namo), Yojna Madan, and Yuvika Agarwal (ICF Consultants), Priyal Vishal (Blackstone), Vidhi Chaudhary, Meemansa
Singh (Meesho), Tanisha Bhatia (Meesho), Sanchita Swami (Everest Group), Aditi Rawat (Houlihan Lokey),
This project would have remained merely an idea without the dedication of our core team. From transcribing interviews to designing frameworks, from
editing content to managing logistics—their collective effort transformed scattered insights into a coherent resource. Our sincere thanks to:
Aarti Rajput, Aisha, Aneesha Malu, Anjali Singh, Anurupa Saha, Apurva Dutta, Arushi Goel, Bhavya Aggarwal, Brinda Thamman, Dhwani Makhija, Divanshi
Gupta, Divyanshi Singh, Esha Gupta, Gulpreet Kaur, Gunjan Arora, Hanshika Maheswari, Isha Choudhary, Janisha Hindocha, Janvi Kothari, J. Durga Shree,
Khushi Garg, Kripa Bhatia, Kyra Kashyap, Malvika Anand, Manreet Kaur, Mansi Sharma, Mehak Gupta, Mishka Narang, Muskan Rajput, Nandita Nair, Nitya
Jain, Priyanshi Gupta, Rashi Yadav, Ridhima, Richa Kumari, Sana Gupta, Sansstuti Aggarwal, Sara Gupta, Shambhavi Gupta, Sheen Madan, Surbhi Jha,
Surbhi Jha, Tanisha Sharma, Unnati Hirwani, and Unnati Bhardwaj.
We're particularly grateful to our faculty advisors who supported this student-led initiative, providing critical guidance while allowing us the autonomy to
create something truly by students, for students. Our Principal- Dr. Kanika Ahuja, Mr. T. Kannan (Convener), Dr. Renu Kaul (Co-Convener), Dr. Shrawan
Kumar Pandey, Dr. Shama Major, Dr. Shiksha Deepak, Mr. Rajeev Yadav, Ms. Vimanshi Solanki, and Dr. Aakansha Sethi. 4
5.
This casebook isdesigned to help you prepare effectively for case interviews.
It includes a range of cases, each accompanied by useful tools and tips to
guide your practice. To get the best out of it, we recommend the following
approach:
Form a Case Group
Try forming a small group with your peers and solve the cases in pairs with
each other where one person can play the role of an interviewer and the other
as the interviewee to frame a real case interview environment. Other members
of the group can observe the process, take notes, and contribute during the
discussion that follows. To find the alternate approaches and better structures,
compare the interviewee’s approach with the solution provided in the book,
once the case is solved.
Solve On The Spot!
We do have the tendency to read the cases rather than solving them on our
own first. However, it takes away from the learning experience we get while
solving them, right after reading the problem statement. Case interviews let us
think constructively, on our feet. By attempting the case live, we learn more
than ever by making mistakes and improving with discussion. A good learning
environment is one where feedback flows freely. Encourage honest and
constructive feedback in your case group. Be open to hearing what you could
improve on and give thoughtful feedback to others. If you're ever unsure, don’t
hesitate to reach out to seniors or mentors who’ve gone through the process
before.
Frameworks- staring point
The frameworks given in the casebook are used to bring structures to your
solutions but you don’t have to be restricted to them, you are not forced to fit
into them to build your solution. You will have your own approaches. Who
knows when your adaptability and your own approaches help you stand out
during the interview.
Case Tools
Each case in this book comes with a set of tools:
Clarifying Questions: A list of must-ask questions before jumping into the
case. These help you scope the problem correctly. You’ll find that similar
cases often share a few of these—but always try to tailor them to the
specific case at hand.
Brownie Points: These are small but sharp observations or facts that not
everyone will think of. Dropping one or two of these during your interview
shows presence of mind, awareness of the world, and creativity. They’re
not essential, but they definitely help you stand out.
5
6.
Questions to avoid
→DONOT ask questions you already know the answer to.
→DO NOT ask questions simply to showcase your intelligence.
→DO NOT ask questions that show a lack of research.
Example: “What does your company do?” - This gives the impression you haven’t prepared.
→DO NOT ask personal or confidential questions.
Example: “Can you tell me how much you earn or how often you get promoted?” - These questions are inappropriate.
→DO NOT ask questions that sound transactional.
Example: “How quickly can I move to a higher-paying role?”
Questions worth asking
→ Ask about things you genuinely want to know, what it’s like to work there, how people grow, and what makes the company culture unique.
→ Try to understand the company’s long-term vision and how your role might align with it.
“How does this role contribute to the company’s broader goals or long-term vision?”
→You are always safe asking about the recruiter’s personal experience (since you would never find that on the website or anywhere else!).
Example: “Can you tell me about some of the projects you’ve worked on?”
“What do you enjoy most about working at [Company Name]?”
Clarify the
Problem
Structure the
Problem
Priorotise
and dive
deeper
Analyze data
and insights
Synthesize
and
Conclude
Recommend
and Defend
Think Goal
What does the client
want?
Think Focus
Which areas are the
most critical ?
Think Patterns
What does the data
reveal ?
Think Clarity
What are the key
takeaways ?
Think Impact
What’s my answer and
can I support it?
Think Framework
“How can I break it
down logically?”
6
7.
Before the Interview
Duringthe Interview
After the Interview
- Review the case thoroughly 2–3 times. - Get
comfortable with all key figures and data points. -
Decide on your case role (e.g., hurried partner or
passive client). - Plan for irrelevant or tricky
queries (e.g., provide dummy data or explain why
the data isn’t available).
- Stay within a 25-minute timeframe – avoid
overextending the session. - Have “curveball”
questions ready to challenge varied thinking
styles. - Don’t just assess problem-solving –
evaluate: → Communication: Are they client-
ready? → Skill: Can they perform the tasks? →
Motivation: Do they seem genuinely engaged?
- Offer clear, constructive feedback – this is
essential. - Share honest input on both strengths
and areas to grow. - Without real feedback,
candidates can’t improve effectively.
KEY ACTIONS AND TIPS
STAGE
Be Precise with the Problem-"Declining" vs.
"flat" profits lead to entirely different
analyses. Nail the problem definition —
vague terms lead to vague solutions.
Use structures as starting points, not rigid
templates. Tailor your approach to the
business context — real-world problems don’t
fit textbook moulds.
Great candidates use structure to stay sharp,
but know when to flex. Over-structuring can
blind you to what actually matters.
Clean, visual notes help you track data,
think clearly, and pivot fast when new
information comes in.
If you hit a wall, don’t freeze. Talk through
your logic, state your assumptions, and show
how you problem-solve under pressure.
Interviewers aren’t grading your memory —
they’re testing your business sense. Be
logical, transparent, and grounded in the
client’s reality.
TABLE: stages along with the key actions and tips for the interview
7
MUTUALLY EXCLUSIVE
COLLECTIVELY EXHAUSATIVE
Idea1 Idea 2
Not Exclusive
Idea 1 Idea 2
Exclusive
Not Exhaustive Exhaustive
Avoids duplication of buckets
Avoids the risk of missing something
Understand the problem
clearly
Segment into Broad
Categories
Sub-divide each category
Cross-Check for MECE-
ness
Prioritize & Hypothesize
The MECE principle (Mutually Exclusive, Collectively Exhaustive) helps
structure information logically where categories don't overlap and
nothing is missing. It's a core concept in consulting that ensures
comprehensive analysis without double-counting.
Mutually Exclusive means each element belongs to only one category,
while Collectively Exhaustive ensures all possibilities are covered.
When applied correctly, MECE frameworks create clean, thorough
problem-solving approaches that consultants rely on for structured
thinking.
MECE Thinking Framework
9
10.
Using a FiveForces analysis, companies can get a clearer picture of how attractive
an industry really is. The Five Forces of Porter helps answer questions like:
How tough is the competition?
Could new players easily enter the market?
Do suppliers or customers have too much power?
Are there products out there that could replace ours?
1. Bargaining Power of Buyers
Buyers can demand better prices or more value when they are few in number,
purchase in large volumes.
2. Bargaining Power of Suppliers
Suppliers have more power when they are few in number, offer unique or high-
demand inputs.
3. Threat of New Entrants
Barriers to entry like economies of scale, brand loyalty, and regulation help protect
existing players.
4. Threat of Substitute Products or Services
Substitutes pose a threat when they offer better price-to-performance ratios or
when customers can easily switch to them.
5. Rivalry Among Existing Competitors
Rivalry intensifies when many firms compete for the same customers with similar
offerings.
Bargaining
Power of
Buyers
Rivalry
among
existing
competitors
Bargaining
Power of
Buyers
Threat of
New
Entrants
Threat of
Substitute
products
or services
FIGURE: Five forces of Porter
10
11.
What is the4P Framework?
The 4Ps of Marketing, also called the Marketing Mix, is a
foundational framework for designing an effective marketing
strategy. It focuses on four key elements that a business can
control to influence customer demand.
The 4Ps are:
Product – What you sell
Price – How much you charge
Place – Where you sell
Promotion – How you communicate value
4P = Tactical Execution Clarity
While frameworks like SWOT or Ansoff look at what and why, the
4Ps help decide how to bring a product to market successfully.
The 4Ps help businesses align their offerings with customer needs,
set competitive prices, choose the right distribution channels, and
craft effective promotions. This clarity ensures smarter decisions
and quicker adjustments in a dynamic market.
PRODUCT :
Features & product
interaction
PLACE :
Location &
Distribution
PROMOTION :
Marketing Channels
& Strategy
PRICE :
Price Strategy &
Profit Margin
FIGURE: Marketing Mix
11
12.
The 3C frameworkfocuses on three core elements: Company,
Customer, and Competitor. It helps answer: What are we good at?
Who are we serving? Who are we up against?
1. Company- This refers to the internal capabilities, resources, and
strengths of a business. It’s about understanding what makes the
organization unique, that is mission, culture, products, value
proposition, and operational efficiencies.
2. Customer- Understanding the customer is key to creating value. This
includes studying their needs, behaviors, preferences, pain points, and
what drives their purchasing decisions.
3. Competitor- it helps identify industry trends, market gaps, and
strategic opportunities. It’s not just about knowing who your rivals are,
but also understanding their strengths, weaknesses, and moves.
By balancing these three elements, companies can build strategies that
are both customer-driven and competitively sound, while leveraging
their internal strengths effectively.
CUSTOMER
COMPETITION COMPANY
FIGURE: The 3C Framework
12
13.
INDUSTRY DIFFICULTY
NAME COMPANY
S.NO.FREQUENCY PAGE NO.
A PROFITABILITY (Framework)
Aviation
Fast Track McKinsey and Co.
1 HIGH 23
18
FMCG
Beer Blunder Kepler Cannon
2 MEDIUM 26
Pharma
Hot Mess BCG
3 LOW 29
Entertainment McKinsey and Co.
4 HIGH 33
Construction
Tile-Tanic LEK Consulting
5 MEDIUM 36
Pharma
Checkmate ZS Associates
6 - 40
Electronics
Tech-nicalities McKinsey and Co.
7 MEDIUM 43
Retail
Houseful, No Return Bain & Company
8 LOW 47
Flopcorn
B MARKET ENTRY (Framework)
Retail
Loo-sing or Winning McKinsey and Co.
1 - 54
Telecom
Who’s There? BCG
2 MEDIUM 59
FMCG
On the Rocks LEK Consulting
3 MEDIUM 64
E-Commerce Accenture
4 MEDIUM 68
Bed & Bath
52
13
14.
INDUSTRY DIFFICULTY
NAME COMPANY
S.NO.FREQUENCY PAGE NO.
Food
Full Plate Accenture
5 HIGH 73
Mining
Digging for Gold Kepler Cannon
6 MEDIUM 77
C MARKET GROWTH (Framework)
Space
The Flight Plan McKinsey and Co.
1 MEDIUM 87
Telecom
Call Me Maybe McKinsey and Co.
2 MEDIUM 90
E-Commerce Bain & Company
3 HIGH 94
Game of Karts
84
D PRICING (Framework)
Farming
Cowculator McKinsey and Co.
1 MEDIUM 101
App
AI, Ay, Captain Kearney
2 LOW 105
Entertainment
Batcoin BCG
3 HIGH 110
Healthcare BCG
4 MEDIUM 114
LifeTax
98
OTT/Entertainment
Kitchen Playbook McKinsey and Co.
7 HIGH 80
14
15.
INDUSTRY DIFFICULTY
NAME COMPANY
S.NO.FREQUENCY PAGE NO.
E UNCONVENTIONAL (Framework)
Finance
Loan Rush BCG
1 HIGH 123
113
Retail
Grocery Dilemma Kearney
2 HIGH 127
Sports
Dominate Praxis
3 LOW 130
Finance McKinsey and Co.
4 LOW 133
Retail
Oil and Gas McKinsey and Co.
6 MEDIUM 140
Silicon Valley
Retail
Espresso Kearney
5 LOW 137
Finance
ATM 2.0 McKinsey and Co.
8 LOW 147
Tourism
App-solutely Lost FTI Consulting
9 LOW 152
Food
Aged Like Fine Wine FTI Consulting
7 HIGH 144
F SOCIAL CASES (Framework)
Energy
Watt Now? Samagra
1 HIGH 163
Social Issue
It Ends With Us Nation with Namo
2 MEDIUM 166
160
Land
Urban Ease McKinsey and Co.
10 HIGH 155
15
16.
INDUSTRY DIFFICULTY
NAME COMPANY
S.NO.FREQUENCY PAGE NO.
Economy Dalberg
4 HIGH 173
SkillUp
Economy
MSMEs Dalberg
5 LOW 177
Healthcare
Bihar Files Samagra
6 HIGH 180
Agriculture
HayDay Dalberg
3 MEDIUM 169
16
G STRATEGY QUESTIONS 183
PRELIMINARY QUESTIONS
PROFITS
REVENUE COSTS
VARIABLECOSTS HIDDEN COSTS
FIXED COSTS
Land
Building
Machinery
Fixed Salaries
Logistics and
Distribution
No.of Units Cost/Unit
Raw Materials
Processing
Packaging
Storage
Marketing
Sales Promotion
After Sales
High Employee Turnover
Currency Fluctuations
Customer Acquisition Costs
Extreme Personalisation
Incentive
Manegement
1. Financial Performance
What is the quantum of profits or losses?
How has the profitability trend been over
recent quarters or years?
Is there a specific time period within
which this issue needs to be resolved?
2. Company-
What products or services does the
company offer?
Which geographies does it operate in?
What are the specific products in its
portfolio?
What does the product mix look like? Has
it changed over time?
What are the company’s main revenue
streams?
3. Industry Context
Is the problem company-specific or
industry-wide?
Who are the main competitors?
What is the company’s unique value
proposition or differentiator?
4. Market and Customer Segmentation
How is the customer segmentation defined
(by region, income, behavior, etc.)
18
19.
For cost-related issuesit helps to draw a process map or break costs into fixed and variable components.
Costs = Number of units × Average Cost per unit
Cost per unit = Fixed Cost + Variable Cost (industry-dependent).
Fixed Costs (doesn’t change with output): Land, buildings, machinery & equipment, fixed salaries, furniture, warehouses, fixed charges, utilities, logistics and distribution.
Variable Costs (changes with output): Raw materials, transportation, processing, packaging, storage, distribution, marketing, sales promotion and after-sales.
Hidden costs: It refers to indirect, non-obvious, or overlooked expenses that do not typically appear under standard fixed or variable cost categorizations but significantly
impact a company’s profitability. These costs often arise from inefficiencies, poor resource utilization, quality issues, human capital challenges, or external operational factors.
COSTS
DEMAND AND SUPPLY
We break down revenue using a mathematical formula :
Revenue= Average Price* Quantity
If quantity sold has changed, we identify whether the problem lies in the demand side or supply side which will help in structuring the case.
Clarifying questions-
1.Have there been any noticeable changes in the target customer base or purchasing behavior?
2.Are there any new entrants in the market?/ Has pricing or products changed relative to competitors?
3.Has there been any change in product categories offered by us or our competitors?
4.Are orders getting delayed or cancelled, a major supply side delivery issue?
5.Are we operating at full manufacturing and delivery capacity or is there any anomaly prevailing in any of these that might affect the overall profits?
For demand side issue- we recommend focusing on customer side and for supply side issue- focus on internal operations.
19
20.
REVENUE (No. ofUnits)
DEMAND SUPPLY
OPERATION AND
LOGISTICS
DISTRIBUTION
PRODUCTION AND
PROCUREMENT
Production Capacity
Utilization Rate
Defect Rate
Efficiency
Capacity
Bottlenecks
Vendor Selection
and Lead Time
Automation Level
Production Cost per
Unit
Cycle Time
Omnichannel
Lead Time to Delivery
Customer Experience
Direct and Indirect
Return and Repair
Production Rate
CUSTOMER MARKET/ENVIRONMENT
Need
Awareness
Affordability
Experience
Perception
Product Fit
Accessibility
Incentives
Network
Effect
Macroeconomic
20
21.
Supplier
Relationship
Cost of Raw
Material
SupplyChain
Stability
VALUE CHAIN
ANALYSIS
Research and
Development
Procurement of
Raw Material
Manufacturing&
Packaging
Warehousing Distribution Sales and
Marketing
After Sales
Services
Technology
Intellectual
Property
Market Research
Cost of
Production
Production
Efficiency
Quality Control
Packaging
Inventory
Management
Storage Facilities
Logistics
Efficiency
Transportation
Distribution
Channels
Order Fulfillment
Capacity
Branding
Promotional
Activities
Market
Segmentation
Warranty and
Repair
Product Upgrade
Customer Service
21
22.
Your client isIndira Gandhi International Airport and the duty free shops on the Airport are facing a decline in revenue.
Analyse the cause of this decline and recommend solutions for the same.
Alright ma'am. I will take a minute to analyse before I ask the preliminary questions.
So I have a few questions before I begin.
1.Are all the duty free shops across all the terminals facing a decline or is it for a specific terminal or specific store like Food outlets or clothing
brands etc?
2.If it’s a fall across all stores, is the decline constant and do we have any quantifiers for the decline?
3.Are the similar stores at the other airports also facing a decline or is it just IGIA?
4.Since how long has the decline been observed and have we taken any measures so far?
So all the duty free shops across all terminals are facing a decline and the rate is somewhat constant for all. Though we don't have any
quantifiers, it has been since the last 5 months and it's specific to IGIA.
Alright. So will it be a fair approach to analyse the customer value chain from entering those shops to exiting?
Could you think of some other approach?
Alright. Since the decline is constant across all stores, is it fair to assume that it’s not a store specific issue rather something related to the airport?
Moreover, are the stores located outside the airport - near the entry and exit gates is also facing an issue?
Yes, it’s fair to assume that the problem is pertaining to the airport and not something store specific. No, the decline is for duty free
stores after the check-in gates. You can go ahead with the case now.
Sure ma'am. I would like to analyse the issue as-
1.Rules and regulations changes restricting the supply of goods to the stores
2.Infrastructural changes with respect to shops- relocation of stores or some other changes not allowing easy mobility
3.Increase in rentals reducing overall revenues
4.Change in airport staff- rude staff now
ROUND
BUDDY
CASE TYPE
PROFITABILITY
INDUSTRY
AVIATION
COMPANY
MCKINSEY & CO
FREQUENCY
HIGH
EASY 22
23.
5. Change intimings- people now can check-in later than earlier not leaving them with much time to visit the stores
6. Overall issues with flights- lesser flights hence overall lesser passengers in the last 5 months
Right, there have been some infrastructural changes at the airport in the past 5 months.
Alright. To analyse it further,
1.The shops are relocated
2.The entry and exit gates are changed
3.The waiting areas are relocated far from those shops
Could you think of some other approach which is making the mobility even faster and accommodating even more passengers at the airport.
Alright. Since more people are accommodated and their mobility is increased, there could be installation of more lifts and elevators or more check-in gates
or some automation at the check-in gates.
Could you think of something beyond the lifts and elevators on similar lines??
I recently visited the airports & there are travelators at certain places which is mostly used by elderly & business people to reach boarding gates as sooner.
Yes, you have identified it well. In the last few months nearly 10-12 walk elevators are installed which make the passengers reach the boarding
gates directly from the check in gates and hence they cannot enter those shops. Could you now think of the recommendations?
Sure, but before that could you tell me if there has been some action taken so far or we have to start from ground 0?
No actions taken so far.
Okay, so i would like to give recommendations on the basis of long term and short term.
For a long term perspective, we can give nodes at the sides of the walkalators allowing people to leave and explore the duty free shops. Moreover, there
can be some walking distance between two walkalators.
For a short term perspective, we can spread some awareness about walking and not relying on lifts and walkalators. Moreover, the duty free shops can
give some discounts or advertise their products extensively at the airport. 23
24.
PROFITS
COST
Store Specific
REVENUE
Airport Specific
Rental
Costs
Numberof
Flights
Regulatory
Changes
Infrastructural
Changes
New Check-in
Rules
More
Checking Gates
Travelators
Lifts Elevators
PRELIMINARY QUESTIONS
BROWNIE POINTS
1.Stores located before or after the
security check?
2.Any change in airport layout or
passenger movement ?
3.Any changes in airline partnerships
or flight frequencies?
4.Any change in the type or nationality
of passengers (e.g. domestic vs
international ratio)?
5.Is the average dwell time of
passengers in the terminal area
reducing?
1.Passengers may prioritize early gate
arrival due to increased automation.
2.Travelators enhance movement but
bypass key commercial areas.
3.Pilot A/B testing for signage and
travelator placement.
4.Partner with airlines to advertise
duty-free products during boarding.
5.Install digital screens on travelators to
engage passengers before stores.
24
25.
You’re a consultantanalyzing profitability issues at a beer manufacturing company. The client suspects there’s a
defect in the supply chain. How would you go about it?
Before diving in, I’d like to ask clarifying questions. When you say profitability is declining, is it because of rising costs, falling revenue, or both?
Good question—it’s primarily a cost issue. Revenues are stable, but margins are thinning.
Got it. And is this a recent change or a longer-term trend? Are the problems concentrated in a particular product line or geography?
The issues started showing up around two quarters ago—so fairly recent. The issue appears across the board—multiple product lines
and regions.
Alright. And lastly—any recent operational changes? New suppliers, tech upgrades, process revamps?
Nothing major. The operations team says nothing has changed, which is why they think it’s a supply chain defect.
Makes sense. In that case, I’d break down the supply chain into key components:
Raw material sourcing--Brewing--Packaging--Warehousing--Distribution--Retail delivery
I’d run a diagnostic at each step to check for inefficiencies or defects.
Sounds good. What sort of problems would you look for at each stage?
Okay,
Starting with sourcing—maybe delays, quality issues, or price volatility in inputs like hops, malt, or packaging material.
In brewing, process inefficiencies—maybe machinery downtime or underutilization.
Packaging could be a big one—damaged cans or incorrect labeling might lead to wastage or recalls.
At the warehousing stage, poor inventory practices could cause overstocking or stockouts.
Distribution might suffer from bad routing or rising fuel costs.
Finally, retail—delays or quality issues might affect shelf availability and returns.
Let’s say the main issue is packaging defects. What would you look into first?
ROUND
BUDDY
CASE TYPE
PROFITABILITY
INDUSTRY
FMCG
COMPANY
KEPLER CANNON
FREQUENCY
MEDIUM
EASY 25
26.
First, the rootcause. Is it machinery, materials, or human error?
The team’s unsure—but they suspect the problem lies in the machinery.
Then I’d check if the machines are outdated, poorly calibrated, or improperly maintained. Any data on defect rates by batch?
Yes. Some batches have a 10–12% defect rate—mostly dents and leakages.
That’s significant. I’d recommend inspecting machines for wear and tear and comparing defect rates by shift—could also be an operator issue. Also, are
these defects detected during in-house QA or at the retail stage?
Mostly at the warehouse—some even post-dispatch.
Then quality checks need tightening—maybe add a final inspection step or automate fault detection. Also, is there supplier variability in the cans?
Yes, we use two vendors. One is cheaper but has slightly inconsistent quality.
That could be it. Switching fully to the more reliable vendor may raise costs short-term, but reduce wastage in the long run. Worth modeling that out.
Fair. How would you estimate the financial impact of fixing the defect?
I'd start with current loss—cost of damaged packaging, labour for rework, product returns & lost sales. Then compare that to the investment needed—new
equipment, staff training, vendor switch. Finally, I’d calculate the potential upside from fewer losses, smoother operations & brand trust recovery.
Makes sense. How would you prevent the issue from recurring?
I would do three things: 1. Install real-time monitoring for packaging machines
2. Audit vendors more regularly
3. Build early-warning systems using defect rate trends.
Also, rolling out a pilot in one plant first before scaling could help catch any blind spots.
Alright, that wraps up the case.
26
27.
PROFITS
Raw Material
Sourcing
COST
REVENUE
Operational
Expenses
Shrinkage
Losses
Marketing
Inventory and
Procurement
Researchand
Development Costs
Brewing
Supply Chain
&Distribution
Warehousing Distribution Retail Delay
Machinery Human Error
Materials
Packaging
Wear
and Tear
Poor Quality
Checks
Low Quality
Vendor
PRILIMINARY QUESTIONS
PRELIMINARY QUESTIONS
BROWNIE POINTS
1.Is the drop in profitability due to
rising costs, falling revenues, or
both?
2.Is this a recent change or has it been
happening over the long term?
3.Are certain product lines or
geographies more affected than
others?
4.Have there been any recent changes
in suppliers, processes, or
equipment?
1.Recommended a pilot rollout in one
plant, demonstrating risk awareness
and implementation maturity.
2.Proposed shift-wise defect rate
analysis to distinguish operator vs.
machine issues.
3.Highlighted defect detection timing
(warehouse vs. post-dispatch) to
address quality control gaps.
4.Inquired about supplier variability,
reflecting awareness of external
operational factors. 27
28.
A leading pharmaceuticalcompany in India is experiencing a decline in revenue despite steady demand from its primary
market, the US. Findings suggest frequent product recalls are causing financial losses. How would you approach this case?
Before diving into solutions, I'd like to clarify the business model and the nature of the issue. Could you share more details about the company’s
operations and product focus?
The company specializes in generic medications, primarily exporting to the US, it also operates in markets like Africa & Southeast Asia.
Have those other markets also experienced revenue decline, or is the issue concentrated in the US?
The revenue decline is primarily in the US market.
Given that demand is steady, the revenue decline must be driven by supply-side challenges. Have there been any recent regulatory changes or
competitive pressures affecting sales?
The FDA has tightened compliance standards competition from other low-cost manufacturers has increased. However, since demand
remains steady, the key issue appears to be product recalls.
Understood. To diagnose this further, I’d like to analyze the product journey step by step. At which stage are recalls happening—manufacturing,
packaging, transportation, or post-delivery in the US?
The recalls occur after delivery in the US, but the root cause could originate at an earlier stage.
That suggests the issue might lie within the supply chain. Let’s systematically check each stage:
Manufacturing & Packaging: Are there any quality control lapses in India?
Transportation & Storage: Could logistical inefficiencies be impacting product integrity?
Distribution in the US: Is there an issue with warehousing or regulatory compliance?
Let’s begin with the manufacturing stage. Are there any lapses in quality control, deviations from good manufacturing practices, or any compliance
flags raised by Indian or US regulators?
The company follows strict manufacturing protocols, and audits haven’t flagged major issues at the manufacturing or packaging units
in India.
ROUND
MANAGER
CASE TYPE
PROFITABILITY
INDUSTRY
PHARMA
COMPANY
BCG
FREQUENCY
LOW
MODERATE
28
29.
That’s reassuring. Thenwe can likely rule out defects originating from the production floor. Let’s move downstream. Can you walk me through the logistics path from
India to the US?
Sure. After production, the drugs are shipped to the US via Dubai, where they are held temporarily in a third-party warehouse before continuing
to the US.
Interesting. Are the medications temperature-sensitive? Many generics can degrade if exposed to fluctuating or uncontrolled temperatures.
Yes, many of the medications are temperature-sensitive and require strict cold-chain maintenance.
That could be significant. Is there any evidence of temperature deviations or mishandling during the Dubai layover?
Yes. Internal investigations recently found that temperature controls in the Dubai warehouse were inconsistent. Some batches were exposed to
higher-than-approved storage temperatures.
That’s a critical insight. In temperature-sensitive pharmaceuticals, even minor deviations can compromise product integrity, potentially triggering recalls
once the product reaches pharmacies or hospitals in the US.
This aligns with the observed pattern—no issues during production, but recalls post-delivery, stemming from compromised product quality due to inefficient
transit practices. Do you track temperature logs across the journey?
We do, but the current system is manual, and discrepancies are often caught too late.
Thank you. Based on this discussion, the root cause appears to be a supply chain vulnerability, specifically: 1. Uncontrolled storage conditions at the
Dubai transit point 2. Lack of real-time temperature monitoring 3. Reactive—not proactive—quality control mechanisms
Yes, really good breakdown of causes. Now what solutions do you suggest for this?
Given this insight, we should focus on optimizing the supply chain. Potential solutions include:
Partnering with a Tier-1 logistics provider that ensures temperature-controlled facilities at every transit point.
Direct shipping routes to bypass high-risk transit points like Dubai.
29
30.
Implementing IoT-enabled temperaturetracking to detect fluctuations in real time.
Renegotiating SLAs with logistics partners to enforce stricter compliance on handling and storage.
Conducting third-party audits to ensure adherence to good distribution practices.
That makes sense. Can you summarize the key takeaways from this discussion?
Absolutely. The revenue decline is primarily driven by supply chain inefficiencies, specifically temperature inconsistencies during transit via Dubai.
1.The revenue drop is not due to demand, but rather frequent recalls caused by product degradation during transit through Dubai.
2.The root issue is inconsistent temperature control, especially in storage.
3.Fixing the logistics—either by improving cold storage, adding tracking, or changing routes/providers—can help reduce recalls, protect revenue, and rebuild
customer trust.
4.A few short-term tests and stricter contracts will help support the long-term changes.
Excellent. That was a structured and comprehensive approach. Well done!
30
31.
PROFITS
COST
REVENUE
Demand Supply
Product
Quality Issues
Regulatory
Changes
Increased
Competition
Manufacturing
Transportation
andLogistics
Inventory Issues
and Stockouts
Packaging
Shipping Warehousing
Poor Stock
Management
Ineffective
Temperature Controls
Security
Issues
Improper Handling
and Stacking
Uncontrolled
Storage at
Dubai Transit
Lack of Real Time
Temperature
Monitoring
Reactive not Proactive
Temperature Control
Monitoring
(In this case,
product recalls)
PRELIMINARY QUESTIONS
BROWNIE POINTS
1.Root cause framing
2.Stepwise Framework Creation
3.Insight on Product Integrity
4.Evidence-Based Diagnosis
5.Strategic, Actionable Solutions
1.Could you share more details about
the company’s operations and
product focus?
2.Have those other markets also
experienced revenue decline, or is it
only in the US?
3.Are there any recent regulatory
changes or competitive pressures
affecting sales?
4.At which stage are recalls happening?
5. Are the medications temperature-
sensitive?
31
32.
Your client isa theatre owner. It has been experiencing a decline in profits and wants you to analyse why?
Thank you for the case statement. I would like to ask some clarifying questions, since when has the client been seeing decline in its profits? Do we
have the magnitude of decline? Additionally, is it only the client’s theatre which has seen the decline in profits or other theatres in the area have
also seen a decline?
The client has been seeing decline in profits for the past 6 months, assume it to be 30%, though the exact number doesn’t matter and
the issue is specific to our client only.
Got it. The decline in profits could be due to increase in costs or decrease in revenue or a combination of the both. Do we have an idea which side
the problem lies?
The revenues have declined significantly, while the costs have remained the same.
Since, revenues have seen a major decline, I’d like to analyse different revenue streams of the theatre. From what I can recall ticket sales, food &
beverages and advertisement revenue are primary sources of revenue. Do we know if the drop is specific to these streams?
Hmm, the footfall hasn’t declined and ad revenue is unchanged.
Got it, so would it be fair to assume fall in revenue is driven by food & beverages or are there any additional sources of revenue that I missed?
Yes, go ahead with analysing F&B segment.
Okay, so revenues are a function of 2 things: i) the number of orders we have ii) the average order value. I would like to delve deeper into
these 2 parameters and understand where the issue lies. Does this sound like a fair approach?
Yes, it does. Go ahead.
Sure. Based on my initial analysis of the revenue. I wanted to examine the number of orders first. However, since ticket sales have
remained stable, this suggests either: i) Fewer moviegoers are buying food (conversion rate decline), or ii) Those who buy are spending less
(lower average spend). Do we have data to validate these assumptions?
ROUND
PARTNER
CASE TYPE
PROFITABILITY
INDUSTRY
ENTERTAINMENT
COMPANY
MCKINSEY & CO
FREQUENCY
HIGH
MODERATE
32
33.
Great inference! Therehas been a drop in conversion rate. Why do you think we have been converting fewer customers than we had intended to?
The conversion rate decline could stem from internal or external factors. Internally, we might have: 1) product issues (quality/variety), 2) price hike, 3)
operational delays (long wait times), (4) poor customer perception. Externally, potential drivers include: 1) shifting consumer preferences (e.g.,
health-conscious choices reducing snack demand) 2) increased competition offering better alternatives.
Just to clarify- prices and product offerings haven’t changed, and we offer online ordering with on-seat delivery to minimize wait times. Yet,
conversion rates are still down. Where would you look next to pinpoint the issue?
I believe consumer preferences haven’t shifted significantly, as competitors aren’t experiencing a similar decline, and footfall has remained stable. This
suggests that customers aren’t choosing competitors over us, they’re simply opting not to buy food at all. Given this, we can likely rule out external factors.
I’d like to explore consumer perception further. Should I move ahead with this approach?
Yes, what factors would you consider to analyse customer perception?
Since external factors are ruled out. To understand customer perception I’d i) Analyze reviews: Look for spikes in negative feedback. ii) Check social media:
Search for viral posts or trends. iii) Conduct mystery shopping: Observe customer hesitations.
Interesting. Six months ago, Google Reviews saw a surge in 1-star ratings. Many mention “unacceptable” snacks. What’s your hypothesis?
This suggests a hygiene related reputational shock, I think it can be due to Food contamination like expired or spoiled food, allergen mishap due to
improper labelling or a viral video scandal.
Actually yes, there was a viral video with 500k views of ants in our caramel popcorn tubs that surfaced like 6 months ago. Can you give
recommendations to resolve this and regain customer trust?
Sure. Short-Term Recommendations- 1. Issue a sincere apology video from leadership, acknowledging the incident and outlining corrective actions 2.
Partner with food safety influencers for transparent kitchen tours, 3. Introduce tamper-proof packaging with hygiene seals.
Long-Term Recommendations- 1. Hygiene Assurance Dashboard to be installed as real-time, digital displays in theatre lobbies 2. Launch a loyalty
program with discounts for repeat buyers. 3. Publish quarterly hygiene reports on social media.
Excellent. We can end the case here. 33
34.
PROFITS
REVENUE
COSTS
DEMAND
Ticket Sales Foodand Beverage
PRELIMINARY QUESTIONS
BROWNIE POINTS
SUPPLY
Advertisement Revenue
Number of orders Average Order
Value
Footfall at food
Counters
Conversion Rate
Internal Factors External Factors
Menu Variety Product Quality Price Hike Operational
Delays
Poor Customer
Perception
Shifting Customer
Perception
Better Alternatives
Bad to Reviews Negative Online Publicity Hygiene Issues
1.Since when has the client been seeing
decline in its profits? Also, do we
have the magnitude of decline?
2. Is it only the client’s theatre which
has seen the decline in profits or
other theatres in the area have also
seen a decline?
3.The profit decline could stem from
rising costs, falling revenue, or both.
Do we know which is the main issue?
1.Analyzed potential drivers using
MECE-aligned buckets, ensuring
thorough root cause identification.
2.Applied structured problem-solving
to pinpoint the core issue
independently.
3.Provided recommendations for
immediate recovery and long-term
brand perception improvements.
34
35.
Your client isa tile manufacturer with a strong presence in North India. They recently expanded into South India, but over
the past 18 months, they have experienced a significant decline in profits there. They want you to identify the reasons for it.
Thank you. To approach this problem, I’d start by breaking down the profitability equation: Profit = Revenue−Cost. I’d like to first clarify whether the
decline is rooted in revenue issues, cost issues, or both. Do we have any insights into which area is more concerning?
Good start. Both revenue and costs have been impacted, but the client is primarily concerned about revenue decline.
Got it. Revenue can be broken down into: Revenue= Price × Units Sold.
Since we’re dealing with a revenue decline, I’d like to understand whether the issue is driven by price-related factors, a decline in units sold, or
both. Is there any indication of a recent price drop or pricing strategy change?
The pricing has remained consistent with their North India operations. The issue is with the number of units sold.
Understood. If the issue lies with the decline in units sold, I’d break this down into demand-side and supply-side issues.
Demand-side, factors affecting customer willingness to buy.
Supply-side, factors affecting availability or distribution of tiles.
Would you like me to explore both avenues, or has the client identified which area is more likely the cause?
The client suspects it’s more of a demand-side problem.
Great. To structure my analysis of the demand-side issues, I’ll use the 4Ps framework:
1.Product – Quality, features, durability, and overall appeal.
2.Price – Affordability compared to competitors.
3.Promotion – Marketing effectiveness and customer awareness.
4.Place (Distribution) – Availability across relevant markets.
Would you like me to investigate these aspects one by one?
ROUND
PARTNER
CASE TYPE
PROFITABILITY
INDUSTRY
CONSTRUCTION
COMPANY
LEK CONSULTING
FREQUENCY
MEDIUM
MODERATE
35
36.
Let’s focus onthe product first.
Sure. When analyzing the product, I’d look at both tangible and intangible attributes. Tangible attributes include things like durability, appearance, and
compatibility with local environmental conditions. Intangible attributes include brand perception and customer trust. Since the client has a strong presence in North
India, I suspect the product may not be performing similarly in South India due to either regional preferences or environmental factors.
Do we have data on customer complaints, product returns, or any quality-related issues specifically in the South?
Yes. There has been a higher incidence of customer complaints regarding tiles cracking prematurely.
Interesting. Premature cracking suggests a quality issue, which could be related to:
1.Issues with the tiles themselves.
2.Poor handling during shipping.
3.The tiles might not be suitable for the South Indian climate.
Since the client’s manufacturing process hasn’t changed, I’d hypothesize that environmental incompatibility could be a factor. South India is known for its
humid climate. Could it be that moisture or heat is impacting the durability of the tiles?
That’s a good observation. Yes, South India’s higher humidity levels seem to be causing the tiles to crack faster.
So, if humidity is the issue, we’re dealing with a tangible product attribute problem. Have we tested how the tiles perform under simulated humid conditions
compared to their performance in North India?
No, we haven’t conducted those tests yet, but that sounds like a useful next step.
I would recommend conducting environmental stress tests to compare how the tiles respond to varying humidity levels. Additionally, I’d explore developing
a moisture-resistant variant of the tiles for Southern markets or applying a specialized coating.
To confirm if this is the sole issue, I’d also want to quickly rule out factors related to distribution, promotion, and pricing. Would you like me to explore those
briefly as well?
Yes, please proceed.
36
37.
For distribution, I’dcheck if there are logistical challenges impacting availability. Are the tiles being delivered on time and in proper condition? For promotion, I’d
assess whether marketing efforts have been localized to appeal to South Indian customers. For pricing, I’d confirm if local competitors are undercutting the client’s
pricing, especially with tiles that are more climate-compatible. Has the client explored these areas already?
The distribution network is efficient, and promotional efforts have been scaled up. Pricing is consistent with competitors. The primary problem appears to
be product quality in humid conditions.
Given our findings, I’d suggest a two-pronged approach:
1.Short-Term Strategy:
Apply a protective coating to existing tiles before sale in South India.
Introduce clear installation guidelines optimized for humid conditions.
2.Long-Term Strategy:
Develop a specialized product line specifically engineered to resist humidity.
Market this new variant aggressively in South India to regain lost market share.
Additionally, I’d recommend conducting field tests in various parts of South India to assess performance under different humidity levels.
Good. You’ve identified the issue and provided actionable recommendations.
37
38.
PROFITS
COST
PRICE
REVENUE
UNITS SOLD
DEMAND SUPPLY
PromotionPlace (Distribution)
Price
Intangible Attributes
Product
Packaging Installation Services
Appearance
Tangible Attributes
Durability (Quality)
Transportation Damage Environmental Incompatibility
Material Composition Surface Coating Installation Process
Brand Perception Customer Trust
PRELIMINARY QUESTIONS
BROWNIE POINTS
Manufacturing Defects
1.Is the profit decline due to lower
revenue, higher costs, or both?
2.Is revenue decline driven by price,
units sold, or both?
3.What specific quality complaints
have been reported in South India?
4.How does product performance
differ between North and South
India, especially durability?
5.Have the tiles been tested for
compatibility with South India's
humid climate?
1.Identifying climate (humidity) as a
key factor early.
2.Proposing stress tests for product
durability.
3.Segmenting issues into tangible vs.
intangible attributes.
4.Offering immediate (coating) and
long-term (new variant) solutions.
5.Benchmarking against local
competitors’ products.
38
39.
Your client isa medical insurance company that has been operating in India for the past 20-25 years. Their profits have
been declining for the past 6 months, and they have asked for your help to improve their situation. How would you go about
solving this problem?
Thankyou for the case! To get the market overview, the magnitude of profits decline and to get insights into whether the problem is industry
specific I would like to ask by what amount the company’s profits have fallen and are other competitors facing similar decline?
Our profits have fallen by 20% & while other competitors are facing similar challenges their declines have been less than ours.
Alright! To understand the company better could you let me know the customer segmentation, are we serving any particular customer or type of
customer to check the risk exposure.
Our primary customers are urban middle to high-income individuals, and we also cater to corporate clients for their employee
insurance policies.
To begin with, I’d like to clarify the cause of the profit decline and to break it down into revenue and cost components. Is the problem primarily due
to a drop in revenue, an increase in costs, or a combination of both?
It’s actually both. Our revenue has fallen around 5% and costs have also increased by 15%.
Thank you for the clarification. Would you like me to focus on the cost aspect since it seems to have seen a more significant change and have more
impact on profitability?
Focus only on the cost part.
The most significant cost for an insurance company is usually the payout to insurers. To identify whether the rise in cost is due to higher claim
payouts, has there been an increase in the same.
Yes payouts have increased significantly
ROUND
PARTNER
CASE TYPE
PROFITABILITY
INDUSTRY
Pharma
COMPANY
ZS Associates
FREQUENCY
MEDIUM
DIFFICULT
39
40.
To break thisdown, insurance payouts can typically be described as: INSURANCE PAYOUT = No. of customers x Average medical expense per visit x No.
of medical visits x Percentage insured; Can you confirm whether any of these factors have seen a significant change recently?
Yes! No. of medical visits have significantly grown post Covid in the eastern region.
These medical visits might have increased either because of Awareness or Affordability or Accessibility.
Focus on the Awareness part.
To analyse whether increase in payouts is a temporary trend or a long term shift, has there been any government initiative or private sector campaigns to raise
awareness in this region?
Yes, the governments of West Bengal, Bihar and other eastern states have taken steps towards Breast Cancer awareness.
The root cause of decline in our profits is the steps taken by the government to spread Breast Cancer awareness which led to more people opting for its
testing & checkups, thus increasing the no. of medical visits and medical expenses. Hence our payout cost has also increased significantly which has led to a
decline in our profits. Am I correct?
Absolutely, so what do you suggest to improve our profitability in this scenario?
I can think of two key strategies to address this issue:
1.Tiered Pricing: We could implement a tiered premium system, where we charge higher premiums for high-risk clients, particularly those who fall into the
high-risk categories identified through awareness campaigns (e.g., breast cancer).
2.Improved Risk Assessment: Strengthening our risk assessment models could help identify clients who might need more personalized policies or preventive
care measures, thereby allowing us to better predict future payouts.
Okay, sounds good! I think we can close the case here.
40
41.
PROFITS
COST
REVENUE
Fraud
prevention cost
Technology
investment
Operational and
administrativecosts
Regulatory cost
Medical Claims
payouts
Percentage
insured
Average medical
expense per visit
Number of
customers
Accessibility Affordability
Awareness
No. of medical
visits
PRILIMINARY QUESTIONS
PRELIMINARY QUESTIONS
BROWNIE POINTS
Media Influence
Govt.
Initaitives
1.By how much has the profit decline
and whether it is exclusive to the
company
2.Customer segmentation to find out
target audience and risk exposure
3.Whether decline is due to cost,
revenue or both
4.Key factors driving higher insurance
payouts- frequency or amounts
5.Any government or private sector
campaigns contributing to increased
claims
1.Finding out the magnitude of profit
decline and checking if the issue is
industry specific or company specific
2.Structuring the analysis by breaking
down profits into cost and revenue
to see which one has more impact
3.Analysing whether the higher
payouts is a short term trend or a
long term shift
4.Recognizing the significance of
external factors, such as government
awareness campaigns
41
42.
Suppose I ama consultant, and you are my client—a laptop supplier that provides laptops to large consulting firms like Bain,
McKinsey, and BCG. Your profits are decreasing, and your margins are declining, but costs have remained the same. What
could be the reason?
Alright, thank you. Would you mind if I take a minute to structure my thoughts?
Sure, take your time.
Firstly, I’d like to understand a little more about the core business. Could you clarify whether you’re a manufacturer, distributor, or reseller of
laptops?
We’re a distributor. We buy laptops in bulk from manufacturers and resell them to consulting firms, bundled with extended warranty and
tech support.
Great, thank you. Do you sell exclusively to consulting firms only, or do you also serve other industries?
Consulting firms are our primary clients, and they account for over 90% of our business.
Understood. Are these long-term contracts or one-time transactional purchases?
Most purchases are transactional, but we have built long-standing relationships with about 10 major firms in this business.
Additionally, wanted to understand a little bit more about the quantum of this decline to diagnose the core problem. For how long have we been
witnessing this decline and is this issue specific to our company only, or are other laptop suppliers facing similar problems?
It has been happening for the last two years. However, our competitors are not facing similar issues. Why do you think understanding
more about the competitive landscape here is relevant to the problem statement?
I was considering the possibility of macro-level issues, such as economic, political, or technological factors, that might be affecting the entire
industry. Since our competitors are not experiencing the same decline, this suggests that the problem is internal rather than industry-wide.
ROUND
BUDDY
CASE TYPE
PROFITABILITY
INDUSTRY
ELECTRONICS
COMPANY
MCKINSEY & CO.
FREQUENCY
MEDIUM
MODERATE 42
43.
Now, I’d liketo start with the analysis. Since profit comprises two key components—costs and revenues—and you have already mentioned that costs have remained the
same, let’s focus on the revenue side. Revenue can be further broken down into:
1. Number of companies we are selling to.
2. Revenue per company.
Has there been a decrease in the number of companies we supply to, or has revenue per company declined?
The number of companies has remained roughly the same, so the decline is due to a drop in revenue per company.
Revenue per company can be broken down further as: Revenue per company = Price per laptop * Number of laptops supplied
Has the number of laptops per company decreased, or has the price per laptop declined?
The price per laptop has decreased.
I can think of a few factors to be considered for the drop in the price per laptop. These include:
1.Product Mix Shift: We may have shifted our product strategy toward selling more entry-level or budget laptops, which carry lower price points compared to premium
models.
2.Discounting and Promotions: Increased use of promotional pricing or volume-based discounts may have brought down the average selling price.
3.Channel Mix: A shift toward third-party distribution or e-commerce platforms, which typically involve lower margins, could be lowering our realized price.
4.Competitive Pressure: Intensified competition in the B2B laptop market may be forcing us to lower prices to remain attractive to clients.
Has any of these factors been impacted in the recent past?
Yes, we have been offering increased discounts per laptop, which has led to declining margins.
That’s helpful. Was this a deliberate pricing strategy shift, or was it driven by competition?
It was a deliberate shift. We introduced uniform discounts across clients to retain business and improve client satisfaction.
Thank you. Offering uniform discounts might have unintended effects on margins, especially if they aren’t linked to volume or client size. Have we noticed if certain
client segments are more sensitive to price than others?
43
44.
We haven’t segmentedclients in that way. The discounts have been flat across all clients, regardless of the size or purchase volume.
Understood. Have we evaluated whether these discounts led to any increase in the number of laptops sold or helped prevent client churn?
No significant change in sales volume or churn has been observed—it seems to have only reduced margins.
To address this issue, we could reconsider how we distribute our discounts. Instead of a uniform discount structure which is affecting our margins, we could focus on:
1.Client Segmentation: Divide clients into large, medium, and small accounts based on historical purchase volumes to offer tailored discounts.
2.Tailored Discounts:
Offer competitive discounts to large clients, as retaining them is critical.
Provide moderate or minimal discounts to small and medium clients, where margins are more vulnerable.
3.Introduce Tiered Incentives:
Create performance-linked discounts or loyalty-based schemes instead of flat rates.
Offer non-monetary incentives like extended support, faster delivery, or bundling services.
4.Review Pricing Strategy Regularly:
5.Monitor margins by client and adjust discount bands based on their impact on overall profitability.
That sounds like a viable approach. We can close the case.
44
45.
DECLINE IN PROFITS
MACROLEVEL ISSUES MICRO LEVEL ISSUES
REVENUE COST
Revenue from company No. of companies
Price of one laptop No. of laptops being supplied
Elasticity Differentiation Price brands Competitor benchmarking
PRELIMINARY QUESTIONS
BROWNIE POINTS
1.Can you clarify the company’s business model—
its key products and target customers?
2.Has the profitability decline affected all suppliers
in the industry, or is it specific to our company?
3.Has the revenue decline been driven by a loss of
clients or by reduced revenue per client?
4.Is the decline in revenue per client due to a drop
in the number of laptops sold or a decrease in
price per laptop?
5.Has there been a change in the company’s pricing
strategy, or have we been offering higher
discounts compared to competitors?
1.Shows structured thinking by identifying if the
issue lies in manufacturing, distribution, or
pricing.
2.Differentiates between industry-wide trends and
company-specific inefficiencies.
3.Breaks down revenue to pinpoint whether the
issue is loss of clients or lower revenue per client.
4.Applies a MECE approach to isolate whether
decline is due to volume or price.
5.Highlights awareness of pricing strategy and
competitive discounting behavior. Small sized (lesser
discounts)
Medium sized (lesser
discounts)
Large sized (continue to
give same discounts)
RECOMMENDATIONS
(Division of discount on basis of company)
45
46.
Our client isan Australian retailer with 10 stores selling home décor, clothing, and footwear. Their cost structure seems
out of line with industry standards. They’re also considering adding toys as a new category. How would you approach this?
Thanks for the context. Just to understand better—is this cost issue present across all stores, or are a few locations responsible for most of the
inefficiency?
It’s a company-wide problem.
Understood. I’d want to look at this in two parts—first, identify what’s driving the cost inefficiency and fix the current structure. And second, evaluate
whether adding toys makes sense strategically and operationally. Does that approach sound good?
Yes, please go ahead.
To understand the cost issue, I’d look at a few areas that could be contributing—starting with inventory and supply chain. Do stores manage their
own inventory, or is there a central system?
Each store manages its inventory independently. There’s no stock movement between stores.
That’s interesting. It likely creates inefficiencies—one store might be overstocked while another runs out of the same product. Without stock sharing
or central oversight, we might be missing out on economies of scale. Do stores also have separate storage or warehousing?
Yes, each store has its own warehouse, and they’re all rented
Are they fully utilized, or is there excess space?
About 20,000 sq. ft. across the chain is currently unused.
That’s a significant amount. Are any stores located close to each other?
Yes, a few operate in overlapping catchments.
That gives us room to consolidate. If we could merge storage for 2–3 nearby stores into one shared facility, we might save on rent and even reduce
ROUND
MANAGER
CASE TYPE
PROFITABILITY
INDUSTRY
RETAIL
COMPANY
BAIN & CO.
FREQUENCY
LOW
HARD
46
47.
logistics redundancies. Butfor this to work, would the client be open to moving inventory across stores when needed?
They would consider it, yes.
Great. Another angle I’d look at is staffing. Have employee levels been adjusted in line with changes in store traffic?
They’re currently overstaffed relative to footfall.
In that case, we could consider reducing peak shift hours or even training employees to work across multiple stores if they’re in close proximity. Some retailers have
also adopted partial automation—for eg, self-checkout kiosks—to reduce fixed labour costs without compromising service. Has the client explored options like these?
Not yet, but they’ve started thinking about it.
Then perhaps this can be phased in starting with low-traffic stores. One more area I’d look at is rent. Are stores in high-rent zones, or are leases up for renewal?
Some leases are due next year. Most rents are fixed, not revenue-linked.
That’s worth revisiting, especially for underperforming stores. Renegotiating leases—or even downsizing retail space where we’re paying for unused square footage—
can meaningfully reduce fixed costs.
Makes sense. Let’s talk about toys now. The CEO wants to use freed-up space to launch a toy category. What’s your take?
That’s an interesting idea. Just to clarify—is this expansion driven mainly by wanting to use idle space, or is it based on a specific customer insight?
Both. Data shows that about 40% of our clothing customers have kids under 12, and we aren’t capturing their toy spending today.
Understood. I’d look at this through a few angles. First, customer fit—will adding toys drive more purchases from our current shoppers, or bring in a new segment? Then
the economics—do toys have good margin and turnover potential? I’d also think about operational complexity—can we support this new category without disrupting
our current setup? From a customer fit angle, do we know where these parents usually shop for toys?
Most of them buy from Amazon or specialty toy stores.
47
48.
That means we’llneed to offer something differentiated to pull them in—maybe not compete purely on price, but offer a curated experience. If our home décor section is
aesthetic and lifestyle-oriented, perhaps we can carry creative, educational, or design-focused toys that match that vibe.
From a supply perspective, can our current vendors support toys?
Only for about 40% of the SKUs we’d want to carry. The rest would require new partnerships.
That adds complexity, so I’d suggest starting with that 40%—SKUs where we already have reliable vendors. We could pilot the toy section in a few stores, ideally those with
strong family footfall, and allocate a small amount of space—say 5,000 sq. ft.—so we’re not taking a big risk upfront. Do we know which stores have the highest family traffic?
Yes, we have that data from our loyalty program.
Perfect. That data can also help us estimate toy demand by looking at customer segments and basket sizes. If we move ahead, I’d want to track three things: are we increasing
basket size among current shoppers, are we attracting new customers, and are toys selling quickly enough to justify the shelf space?
How would you define success?
I’d look for at least a 15–20% uplift in average basket value among toy buyers, and an inventory turnover rate close to 4x a year, which matches our clothing benchmark. We’d
also want to see a positive net margin contribution after accounting for the lower gross margins in toys.
Speaking of margins, toys tend to have 35% gross margin while our core categories average 45%. Would this hurt profitability?
That depends. If we’re using unused space and not adding new fixed costs, the toys don’t need to match clothing margins. But we’d need toys to either lift foot traffic by about
10%, or increase average basket size by around 15%, to maintain overall store profitability. We can model those scenarios using past data—say, if 20% of shoppers with children
bought toys, would it achieve the required uplift?
Got it. What would be your final recommendation?
I’d recommend starting with a 3-store pilot in family-dense locations, using only SKUs we can source from current vendors. If the category delivers both revenue uplift and
acceptable turnover without cannibalizing core sales, we can expand gradually. In parallel, I’d start consolidating warehouse space and rightsizing staff in lower-traffic stores
to clean up the current cost base.
Great, thank you.
Thanks! This was a really interesting case. 48
49.
PROFITS
Overstocking
COST
REVENUE
Operational
Expenses
Shrinkage
Losses
Supply Chain and
Distribution
Inventoryand
Procurement
Rent Marketing
Understocking
High rent
Fixed rent
Revenue-based
rent
Underutilized
excess space
Over-staffing
Under-staffing
No stock
sharing
between stores
Transportation
issues
Damage in
transit
PRELIMINARY QUESTIONS
BROWNIE POINTS
1.Is the cost inefficiency consistent across formats
(clothing, décor, footwear), or skewed toward one?
2.Do all stores follow the same operating model, or is
there variance in staffing, layout, or logistics?
3.What percent of total cost is fixed versus variable—
can we control any part of it in the short term?
4.Has the company benchmarked against other
Australian retailers in similar categories?
5.Is there any seasonal variability in footfall or revenue
that might distort the cost structure?
1.Store-level inventory decentralization causes
inefficiency.
2.Consolidate warehouses for overlapping stores to
cut space and rent waste.
3.Phase in toy expansion with current vendors to
limit risk.
4.Align toy selection with brand aesthetic to stand
out from Amazon and mass retailers.
5.Measure success via basket uplift, turnover, and
margin contribution.
6.Toys can be profitable if fixed costs remain stable,
even with lower margins.
7.Pilot rollout is crucial to test assumptions before
scaling. 49
50.
NEW TOY CATEGORY
Utilizingidle
space
Customer
insights-driven
OBJECTIVE CUSTOMER FIT
OPERATIONAL
FEASIBILITY
Inventory
turnover target
RISKS INVOLVED
Gross margin
comparsion
ECONOMICAL
FEASIBILTY
Brand growth
Response to
competition
Understand toy
purchase
behaviour
Build
differentiated
toy assortment
Assess price
sensitivity of
customers
Bundling or
cross-selling
potential
Loyalty
programs
Shipping/storag
e costs
Return/refund
costs
SKVs from
existing vendors
New vendors
Warehousing
and logistics
Staff training
for handling
toys
Toys have lower
gross margin
New fixed costs
Cannibalization
risk
Brand dilution
risk
50
MARKET ENTRY
SHOULD THEYENTER? HOW TO ENTER?
FINANCIAL ATTRACTIVENESS OPERATIONAL FEASIBILITY MARKET CONDITIONS
Market Expansion
Diversification
Profits
Product-Market-
Fit
Market Size
Growth Rate of
Market
Expected Market
Share
Barriers to Entry
Setting up Value
Chain
Political
Economical
Social
Technological
Legal
Environmental
Joint Ventures
Outsourcing
Brownfield Investments
Acquisitions
Set Up Greenfield Ops
Licensing
A market entry case assesses whether a company should enter a new market by evaluating its
attractiveness, profitability, and feasibility. It involves analysing market size, competition,
customer needs, operational setup, and associated risks. The following formula will help you
get to the expected profits in the market:
Expected profits = (Market size (in units) * % Market Share * Profit/unit) – Fixed costs
PRELIMINARY QUESTIONS
1.What are the client’s products, and in which geographies are they
operating in?
2.What is the client’s primary objective for entering this market — revenue
growth, profit, diversification, or strategic positioning?
3.Are there any constraints we should keep in mind — capital, timelines,
regulatory issues, or brand positioning?
4.Has the client considered or tried entering this market before or any other
similar market?
52
OBJECTIVES
53.
Your client isa Japanese smart toilet manufacturer who wants to enter the Indian market. You have to analyse whether
they should enter the Indian market or not.
Thank you for the case statement. I would like to ask some clarifying questions.
Sure, go ahead!
I’d like to start by trying to understand a little bit more about our client. Is the client manufacturing only smart toilet seats or the entire toilet unit,
including the bowl and other components?
The client primarily manufactures smart toilet seats only, you can ignore other products.
What is the average price of our product and is it a premium category?
Initially our price would be Rs 40,000/seat, would you consider this price as the one that falls in the premium category.
Well, that seems to be a bit higher than the usual toilet seats, am I correct?
Yes, that’s true.
But since this is a new technology, I assume a particular customer segment might be willing to pay a premium. Could you also pinpoint a few key
features that differentiate the client’s product from conventional toilets?
The smart toilet includes features such as automatic flushing, self-cleaning mechanisms and odor control. It is marketed as a luxury
and hygiene-enhancing product.
Okay got it. Also, are we looking at residential sales and targeting households only or commercial properties as well?
Primarily residential, but we are open to exploring hospitality and premium office spaces 2-3 years post launching the product.
ROUND
MANAGER
CASE TYPE
MARKET ENTRY
INDUSTRY
RETAIL
COMPANY
MCKINSEY & CO.
FREQUENCY
MEDIUM
EASY 53
54.
Okay, so Ithink I have enough information to start with. So there are three major categories that we have to assess in order to decide whether the company should
enter a new geography or not. The first category would be market size, then market growth and market share. Would you want me to focus on any specific
category?
Let’s begin with Market Size first.
Sure, before we begin with the estimation of the market size, can I assume the average lifespan of a toilet seat to be 8 years?
Yes, you can.
Okay. So, let us consider the population of India to be 140 crores but toilet seats would be a family product and not an individual product. Considering the
average family size of 4, we have a number of 35 crore households. This is also in tandem with what we had discussed before about targeting residential
properties only at the moment.
Okay, go ahead.
Now we divide these into rural and urban which would be 70% and 30% respectively. Considering the price point, a very small proportion of the rural
population would be willing to buy it. So for the context of this case, is it safe enough for me to ignore that number?
Yes, you can do that.
So coming back to the 10.5 crores urban households (30% of the 35 crore households), I would divide them into the following income levels:
Low Income Group: 15% (1.575 crores)
Middle Income Group: 65% (6.825 crores)
High Income Group: 20% (2.10 crores)
Do the numbers seem fine to you?
Yes!
54
55.
I believe therewould be a 5% penetration rate in the low income group that gives me around 7,85,000; 10% penetration rate in the middle income group that is
around 68,25,000; and 20% penetration rate in the high income group that is around 42,00,000. So a total of 1,18,10,000 would be interested in the product.
Fair enough.
As we discussed earlier, the average lifespan of a toilet seat is 8 years. So, in the first year, 1/8th families would be replacing the smart toilet that means around 14
lacs and assuming the market to grow by 10%, an additional 11 lakh households would be interested in buying the product. That gives a total of 25,00,000 units sold in
a year. Do you want me to calculate the dollar value of the market size too?
Yes, given the large market potential, rising disposable incomes and the trend towards increased awareness about hygiene particularly in urban areas, I
think the market is poised to grow at an even faster rate in the coming years. Moreover, with this market being largely untapped, our client can even have
the first mover advantage if they choose to enter the market right now. Hence, I would recommend going ahead with the proposition.
That makes sense
Thank you, we can close the case now.
55
56.
MARKET ENTRY
Slow uptakedue to cultural
inertia
Feature may not match local
preference
High set up cost
RISKS INVOLVED
High price may narrow
TAM
PRODUCT
POSITIONING
COMPETITIVE
LANDSCAPE
Limited high end
players
Compare price points and
features of incumbents
Investigate international
players’ interest in the
market
PRELIMINARY QUESTIONS
BROWNIE POINTS
1.Are we selling only the smart seat or
the entire toilet unit?
2.What is our price point and target
customer segment?
3.Are we focusing only on residential or
also commercial clients later?
4.Is the product compatible with Indian
bathroom infrastructure?
5.What’s the client's primary goal —
revenue, brand presence, or first-
mover advantage?
1.Suggest starting with metro cities as a
pilot launch.
2.Highlight importance of after-sales
service setup.
3.Mention potential in
hospitality/hospitals in Phase 2.
4.Compare adoption curve to
dishwashers or air purifiers in India.
5.Flag risks of low awareness and
cultural inertia early on.
MARKET GROWTH
Adoption curves of other
luxury bathroom products
Consumer technology
adaption in adjacent
categories
Increased disposal
income
Traditional alternative
comparition
Readiness to
localize product
Product pricing
Value preposition
(luxury + hygiene)
Feature set
Readiness to localize
products
Urbanisation and hygiene
trends
No strong direct
competitor
56
57.
MARKET SIZING
Population =140 Cr
Household= 140/4=35 Cr
Urban
30%
Rural
70%
Low Income 15%
5% Penetration
Middle Income 65%
10% Penetration
High Income 20%
20% Penetration
Gross Total Market Demand=1.18 Cr Households
Annual Replacement and Growth Estimation
Lifespan =8 Years
Additional Demand 10% =11 Lakh Units
Annual Replacement = Total Demand / Lifespan= 14 Lakh Units
Total Net Demand = 25 Lakhs 57
58.
Your client isa major telecom player who wants to enter the home security market. You have to analyse whether they
should enter this market or not.
Thank you for the case statement. I would like to ask some clarifying questions to better understand the problem statement.
Sure, go ahead!
To start, could you help me understand the scope of the home security market? Are we referring to locks, safes, surveillance cameras, motion
sensors or something more?
The client wants to enter the market of digital locks that can be operated using a phone.
Could you tell me more about our client? Are they a premium or mass-market telecom player? Do they have expertise in IoT or smart technology, or
would this be a completely new vertical for them?
The client is a leading telecom provider with strong brand recognition and expertise in mobile connectivity. They have not yet entered
the IoT space but are considering this as a strategic move to diversify revenue.
Are there any legal or compliance constraints around smart locks in India that might impact market entry?
No significant regulatory constraints exist at the moment.
Okay, I believe I have enough context to proceed. To evaluate the client's market entry decision, I’d like to assess three key factors: financial
attractiveness, operational feasibility, and risks involved. Would you like me to prioritize any particular area first?
Let’s begin with financial attractiveness first.
Under financial attractiveness, I would like to analyze expected profits, which can be calculated as:
Expected Market Share * Market Size * Profit per Unit
Let's start by estimating the potential market share.
ROUND
BUDDY
CASE TYPE
MARKET ENTRY
INDUSTRY
TELECOM
COMPANY
BCG
FREQUENCY
MEDIUM
MODERATE 58
59.
To begin, Indiahas a population of 1.4 billion, but for simplicity, I'll round this down to 1 billion. Is this acceptable, or would you prefer to use the more precise figure?
Yes, Let’s proceed with that.
Great. Next, I'll divide this population into urban and rural segments. Since digital locks are more relevant in urban areas, I will assume that 30% of the population is
urban and 70% is rural. This gives us 300 million people in urban areas.
Further breaking down the urban population by economic class, Since, digital locks are a premium product, I assume that demand will primarily come from the rich
and upper-middle-class segments. This gives us 35% of the urban population. Would you agree with this segmentation for the target market?
Yes, go ahead.
I believe 45% of these households are likely to adopt the product, this would give us a potential consumer base of 47.25 million individuals .Should I adjust
this adoption rate, or does it seem reasonable?
No, I think this is fine.
Perfect. Finally, as this is a household product, I will factor in an average household size of 4. This gives us an estimated market size of about 12 million
units (47.25 million ÷ 4).
Great, that seems like a good estimate. Now, if the fixed costs are 10 crores and the profit per unit is Rs. 1000, how many units would the client
need to sell to break even
To calculate this, we simply divide the fixed costs by the profit per unit: 10 crores ÷ 1000, which gives us 1,00,000 units.
How would you assess the operational feasibility?
Operational feasibility is primarily dependent on four factors:
Technology readiness
Supply chain
Go-to-market strategy
Regulatory hurdles
59
60.
Interesting. Let’s divedeeper into tech readiness. They’re a telecom company, not a hardware maker. How could they develop smart locks?
For tech readiness, we have three options:
In-house development provides control but requires extensive R&D and carries high risk. Second, acquiring a startup gets us to market fastest with ready
tech.
Third, partnering with a hardware specialist combines their manufacturing with our connectivity expertise - balancing speed and capability.
Smart. If the client acquire, what’s the #1 thing they should look for in a startup?
Security is non-negotiable. A single breach could tank their reputation. Acquisition target must have-
Military-grade encryption.
A track record of penetration testing.
No past hacking incidents.
Makes sense. Now, how would they price these locks? Their broadband customers are price-sensitive.
They could use tiered pricing:
Premium: standalone, for high-income buyers.
Bundled: Free lock with 24-month 5G plan.
Rental: monthly subscription plan to target younger renters.
That looks comprehensive. What would be your recommendation to the client? Do you think entering the home security market is a good move?
Yes, given the substantial market size, rising urban affluence, and growing consumer interest in smart home solutions, this presents a promising
opportunity. Limited competition and the absence of a dominant player provide our client with the potential to capture significant market share.
With sufficient capital, acquiring smaller existing players can help establish a foothold and scale operations efficiently.
The client’s strong brand image can also be leveraged to accelerate adoption. Given these factors, entering the market would be a strategically sound
decision.
Great, we can end the case here.
60
61.
MARKET SIZE
POPULATION=1 BILLION
URBAN-30%
300 MILLION
RURAL- 70%
RICH
(15%)
UMC
(20%)
LMC
(30%)
BPL
(35%)
35% with 45% adoption rate
300 * 35% * 45% = 47.25 12 Million Units
(47.25 /4 avg household size )
(Population=1.4 Billion)
Taking 1 billion for simplicity
PRELIMINARY QUESTIONS
BROWNIE POINTS
1.What is the scope of the home
security market?
2.Is the client a premium or mass-
market telecom player? Do they have
expertise in IoT or smart technology,
or would this be a completely new
vertical for them?
3.Are there any legal or compliance
constraints around smart locks in
India that might impact market entry?
1.Smart segmentation logic to narrow
down realistic TAM.
2.Sharp identification of security as the
core consumer trust driver in
acquisition decisions.
3.Tailored pricing strategy that captures
diverse consumer personas and
behaviors.
61
62.
MARKET ENTRY
OPERATIONAL FEASIBILITYRISKS
Technological Readiness
Regulartory Hurdles
Supply Chain
GTM Strategy
Partner with Hardware
Speacialist
In House Development
Acquire Startups
Pre Launch
Deal Sourcing
Local Assembling
Research & Development
High Risk
Security
Hereditary Grade
Encryption
No Past Hacking
Track Record of
Penetration Testing
FINANCIAL
ATTRACTIVENESS
Expected Profits = Expected
Market Share * Market Size *
Profit/ Unit
Pricing
Rental
Premium
Bundled
High Income
24 Month 5G
Monthly For
Youngsters
62
63.
Your client isa US based global alcohol brand. You have to decide whether it should enter India or not.
I’ll start with a few preliminary questions. Is the Brand planning to enter a particular alcohol category like whisky, beer, vodka or any other particular
category and what is the goal of the brand behind this move- is it revenue maximisation, long term market presence or something else?
No, there is no particular category and there are no constraints in terms of budget as of now. The company aims to establish a strong
presence in India and capitalize on the growing alcohol market.
Okay, got it. Is there a preferred market entry timeline, or is this a long-term strategic move?
No, there are no constraints on the timeline, just a long-term strategic goal to capture India’s market.
Could you provide an estimate of the current market size of the industry.
You can assume the market size to be $50 billion.
Sure. I’d like to start with my analysis now- I’ll divide the market into 3 categories - whisky, beer, and other categories like vodka, gin, rum, etc. I
believe that whisky might be a preferred category considering the Indian market consumes mostly whisky. Am I right to assume that?
Yes. You can go ahead.
I will allocate percentages to the 3 categories in the alcohol market. I will allot 60% to whisky, 25% to beer and 15 % to the niche categories like
vodka, gin, etc. While beer has significant volume, its margins are relatively lower. The niche categories, including vodka and gin, are primarily
consumed by younger demographics, and the middle-class segment may not be significantly inclined towards them.
That sounds reasonable. You are on the right track.
I’ll start with the regulation and the tax environment. Alcohol is a state subject in India, meaning regulations and tax structures vary by state.
Some states also have prohibition on alcohol like Gujarat. High excise duties and import taxes exist on foreign alcohol brands. To mitigate high
import duties, we can explore bottling operations in India rather than importing finished products or look at partnering with a local manufacturer to
navigate the tax structure more efficiently.
ROUND
PARTNER
CASE TYPE
MARKET ENTRY
INDUSTRY
FMCG
COMPANY
LEK CONSULTING
FREQUENCY
HIGH
MODERATE 63
64.
That makes sense.Let’s move forward.
I’ll go forward with the competitive landscape now. There are two divisions- international and local. International is further divided into three categories-
premium, budget, mid-priced. In premium there is Chivas, budget it is Smirnoff and mid priced there is Budweiser. Several Indian brands also dominate the whisky
and beer market.
Which brand do you think has the highest preference in India?
Based on visibility and consumer behavior, Budweiser appears to be one of the most widely preferred brands.
What do you think the market entry strategy should be?
I’ll start with target market and positioning. Given the high growth and profitability of the Indian whisky market, I propose focusing solely on premium
whisky rather than beer or other alcohol categories. I won't include beer and other categories as the market is very scattered for them. Volume is high but
margins are low.
We can enter premium whisky targeting the urban millennial customers or urban gen Z high income groups. For positioning we can leverage American
heritage and craftsmanship to create a distinct premium brand identity and further differentiate with unique barrel aging, flavours, or sustainability-driven
branding
What can the mode of entry be?
There are a few ways -
1.Direct Import – Bringing in alcohol from the US (High costs due to import duties but maintains full brand control).
2.Bottling in India – Importing the product but bottling it locally (Reduces costs while maintaining brand quality).
3.Distribution or Licensing Agreement – Partnering with an existing Indian alcohol company to distribute the product (Faster entry, but shared revenues
and brand dilution concerns).
4.Joint Venture with a Local Player – Combining resources with a local brand to leverage distribution networks and regulatory expertise.
What do you think is the premium bracket and at which price point do we consider the brand to have a premium identity?
A price range of ₹3,000 to ₹5,000 per bottle can be considered premium.
64
65.
Then we canlaunch around this price range and then maybe increase the price to increase the exclusivity of the brand.
Yes you are on the right track.
Coming to distribution we can start with major markets like Delhi and Maharashtra, where alcohol consumption is high and regulatory frameworks are well-
established.
Suggest some ways to increase the brand awareness or marketing strategies?
For brand awareness we can explore digital marketing, celebrity endorsements, influencer partnerships, tasting events and cocktail led brand workshops
with exclusive launches in high-end bars/ lounges.
What can be some challenges that you can face in the market?
Several challenges could arise:
1. Regulatory hurdles - Navigating the complex and varying state laws
2. High taxation - Managing the impact on pricing and margins
3. Competitive response - Existing players might introduce similar premium products
4. Brand building - Establishing brand equity in a new market with strong local preferences
5. Distribution - Securing reliable distribution channels in a fragmented market
6. Cultural adaptation - Ensuring our brand messaging resonates with Indian consumers
Sounds great. We can close the case!
65
66.
PRILIMINARY QUESTIONS
BROWNIE POINTS
MARKETENTRY DECISION
Direct Import
Bottling in India
Distribution
Joint Venture
Mode of
Entry
Regulations
License
Prohibition
WHISKEY
60%
OTHERS
25%
BEER
25%
1.“Are there specific states or cities the
client is prioritizing for initial entry?”
2.“Is the brand open to local production or
strictly committed to imports?”
3.“Does the client have any experience
navigating India's state-wise excise
regulations?”
Suggest local bottling to reduce import
duties and ease distribution.
Recommend launching in regulation-
friendly, high-consumption states like
Maharashtra and Delhi.
Position around American heritage to
stand out in India’s premium whisky
segment.
Gin
Vodka Rum
Taxes
Import
Taxes
Excise
Bottling
options in
India
Competition
Local
Internationa
l
Mid
Wedge
d
Perm
Unique Barrel
Aging
Sustain ability
driven branding
Flavour
Risks
Regulatory
Competitive
Response
Distribution
High Taxation
Cultural
Adaptation
Brand Building
66
67.
Your client wantsto acquire a bed and bath e-commerce business but is unsure if the market is attractive. We need your help
to figure out how attractive this space actually is.
Understood. Could you tell me a bit more about the client’s background or motivation for entering this space?
Sure. He’s a wealthy individual looking to enter entrepreneurship, but he doesn’t want to build something from the ground up. He’d
rather acquire a running business.
That’s helpful context. Does he have a specific definition of what makes a market attractive? For instance, is he mostly looking at return on
investment, growth potential, or ease of management?
He hasn’t defined it clearly. We’re hoping you can help with that.
Alright. In that case, I’d suggest we assess attractiveness through four lenses:
1.Profitability – Can he make strong returns?
2.Customer Base – Is there potential to build and retain a loyal customer base?
3.Competitive Advantage – Can the business sustain an edge over time?
4.Operational Feasibility – Is this a manageable business for a first-time entrepreneur?
Would you like me to walk through each of these?
Yes, please go ahead.
Starting with profitability, we’d want to understand the size and growth of the bed and bath e-commerce segment. Is the market growing? Are
businesses in this space seeing healthy margins? & how price-sensitive are customers?
That makes sense.
The second area is around the customer base. We’d want to assess whether the business can effectively differentiate itself & capture market
share. That could involve product uniqueness or customer experience.
We’d also look into operational efficiency—how scalable is the business from a logistics and supply chain standpoint? And are there any
meaningful barriers to entry?
ROUND
ASSOCIATE
CASE TYPE
MARKET ENTRY
INDUSTRY
E - COMMERCE
COMPANY
ACCENTURE
FREQUENCY
MEDIUM
MODERATE 67
68.
Third, I’d considerwhether the business can maintain a competitive edge over time. For example, is customer loyalty strong, or do people tend to make one-off
purchases and move on? How hard or expensive is it to acquire traffic online? And is there potential for cross-selling or expanding into related product categories?
And finally, there’s operational feasibility. This is especially important for a first-time founder. Will the business demand constant firefighting, or can it run relatively
smoothly? Is inventory management complex? Is customer service heavy? The goal is to avoid burnout and allow him to focus on growth and strategy.
Do you think, based on this, he should go ahead with the acquisition?
At this point, I’d hold off on giving a recommendation. We’d really need to dig into actual numbers—market data, margin benchmarks, and traffic costs—
before making that decision.
Fair enough. That’s a solid framework. Let’s say your friend owns a bed and bath e-commerce business and wants to grow sales. How would you
approach that?
To help with that, may I ask—do we know where the current sales are coming from? Are they mostly from existing customers or new ones? & What kind of
products are being sold?
We don’t have that detail. The focus is on fabrics, linens, and sheets—no mattresses or furniture and it’s a B2C model
In that case, I’d approach growth in two parts. First, how can we grow within the current business model? And second, are there opportunities to expand or evolve
the model to unlock additional revenue streams?
Let’s start with the current model.
Sure. Within the existing structure, the business can increase average order value through bundling or cross-sell recommendations during checkout. We might also
explore modest price increases if customer willingness to pay supports it.
On the retention side, loyalty programs, email personalization, or exclusive member deals could help boost repeat purchases. And finally, marketing—investing in well-
targeted campaigns across Instagram, Google, and possibly even niche home décor influencers—can bring in new customers.
That’s helpful. What about expanding the model?
68
69.
We could lookat moving into B2B by supplying to boutique hotels, hospitals, or Airbnb hosts who need consistent, bulk orders. That would diversify the revenue
base and create more predictable cash flow.
Another route would be product line expansion—adding towels, duvets, or even light bedroom furniture. That increases the average basket size and keeps
customers coming back for more of their home needs.
Where do you think the current low sales are coming from?
Given what we’ve discussed and the focus on growing the business, my guess is the main issue lies in customer acquisition. In e-commerce, especially in this
category, standing out and getting traffic can be expensive and competitive.
Go on
To bring in more customers, I’d focus on building awareness through targeted ads, social content, PR placements, and possibly even collaborating with micro-
influencers. We can drive conversions using first-time discounts, referral incentives, or time-limited offers.
The website experience also needs to be optimized—clean design, fast loading, strong social proof, and a smooth checkout flow. And once we get people in,
email sequences and retargeting ads can bring them back.
Great. That was very clear and practical. We can end the case here.
69
70.
PRELIMINARY QUESTIONS
BROWNIE POINTS
1.Whatdefines market attractiveness for
the client—financial returns, ease of
operations, growth potential, or
something else?
2.Does the client have any prior experience
in e-commerce or retail operations?
3. Is the client open to operational
involvement or looking for a hands-off
investment?
4.What is the budget range for this
acquisition?
5. Is the client targeting domestic markets
or open to international sales?
Structuring "market attractiveness"
into a 4-part framework: prof itability,
customer base, competitive edge, and
operational feasibility
Thinking beyond numbers—factoring
in customer loyalty, defensibility, and
ease of running the business
Offering scalable, low-cost growth
strategies like personalisation, referral
programmes, and content marketing
Considering B2B expansion (hotels,
hospitals, Airbnb hosts) to diversify
revenue
COMPETITIVE
LANDSCAPE
OPERATIONAL
FEASIBILITY
Size Prices Growth
Changes wrt demand
Stable
Premium Normal
MARKET ENTRY
PROFITABILITY CUSTOMER BASE
Product Supply chain constraints
Time
Differentiation
Branding Customer Experience
Expansion Expenses
Short term Long term
Inventory
management
Customer
service
Barriers
70
71.
Current Business NewBusiness
Average order value Price Retention Expansion
Grow Sales
Loyalty programmes Avail personalisation Exclusive member deals Marketing
Instagram
Google Home decor
Services Boutique Hotels Airbnb Hospitals
Towels Light Bedroom furniture
71
72.
Your client isRawal Kachoriwala, a well-known street food brand in Jaipur. They are planning to expand into Delhi. Analyse
the feasibility and suggest a strategy.
Thank you. Just to clarify, is the primary objective of this expansion focused on growing revenue, enhancing brand visibility, or spreading risk across
markets?
The main aim is to grow revenue while preserving the authenticity of the brand.
Understood. Do we have any insights into the existing demand for Rajasthani snacks, particularly kachoris, in the Delhi market?
There is no concrete data, but anecdotal evidence indicates there is a healthy appetite, especially in areas with Rajasthani populations
and a strong street food culture.
That’s helpful. Would you like me to consider only large competitors like Haldiram’s and Bikanervala, or should I include local vendors as well?
Please include both. Street food vendors are widespread and relevant competition in this space.
Noted. Has the client indicated whether they’re leaning towards a premium offering, or is a mass-market strategy also on the table?
They are open to both and want to understand which would be more feasible and scalable in Delhi.
Thanks. I’ll start by estimating the potential market size. Delhi’s population is approximately 30 million. Assuming 60% are within the 18–50 age
group and open to street food consumption. Based on personal experience I would say that half of them eat street food weekly. Of these, I would
like to assume that 15% prefer kachoris if that’s reasonable?
Yes, go ahead.
Assuming an average of 2 kachoris per visit and 4 visits per month, that’s roughly 10.8 million kachoris sold monthly. I would like to also assume that
the price to be ₹30. A 5–10% market share gives us a first-year revenue of ₹19–39 crore.
That’s a solid estimate. What risks do you foresee in this expansion?
ROUND
PARTNER
CASE TYPE
MARKET ENTRY
INDUSTRY
FOOD
COMPANY
ACCENTURE
FREQUENCY
HIGH
MODERATE 72
73.
Sure, so Iwould like to categorise these risks in the following:
1. Marketing Risk
People in Delhi may have different taste preferences. This can be handled by doing small pilot tastings and actively gathering local feedback before
scaling.
2. Operational Risks
Supply chain disruptions can happen, so sourcing ingredients from both Jaipur and local suppliers would help maintain consistency.
Quality might vary without standard processes. Setting up a central kitchen could help ensure everything tastes the same across outlets.
3. Competitive Risk
There’s strong competition from brands already in the market. To stand out, limited time offers and highlighting the brand’s heritage story could attract
attention.
4. Legal/Regulatory Risk
Navigating food safety and local regulations can be tricky. Having a legal team that understands Delhi’s food laws would make things smoother.
Well-considered. What would your final recommendation be?
I would recommend a phased entry. The first six months could focus on cloud kitchens or pop-up stalls in high-footfall areas to test the market. Based on
learnings, flagship stores could be launched in key locations like Connaught Place or Gurgaon in Year 1–2. In the longer term, a franchise model and
packaged product strategy would allow scalable expansion while maintaining operational control.
Thank you, we can close the case here. Good approach
73
74.
PRELIMINARY QUESTIONS
BROWNIE POINTS
60%(18 Million)
18-50 Year Age Group
DELHI’S POPULATION
(30 Million)
40% (12 Million)
Non 18-50 Year Age Group
50% (9 Million)
Eat Street Food Weekly
50% (9 Million) Do Not
Eat Street Food Weekly
15% (1.35 Million)
Prefer Kachori
85% (7.65 Million)
Do Not Prefer Kachori
1.35 Million customers x 2 Kachoris Per Visit x 4 Visits Per Month = 10.8 Million Kachoris Sold Monthly
Average Price of a Kachori = Rs. 30
Monthly Revenue Potential = 10.8 x Rs. 30 = Rs. 3.24 Cr
Annual Revenue Potential = 3.24 x 12 = Rs. 389 Cr
Assuming 5-10% Market Share = (0.05 x 389, 0.10 x 389) = Rs. 19-39 Cr
1.What is the client’s primary goal —
revenue, brand, or diversification?
2.Is there existing data on consumer
preferences for Rajasthani snacks in
Delhi?
3.Should competition analysis focus only
on organised players or also include
informal vendors?
4.Has a decision been made on
positioning — premium, mass-market,
or both?
5.Is there an expected budget or
investment limit for initial expansion?
Factoring in both premium and mass-
market positioning
Recognising the value of a centralised
kitchen for quality control
Providing a structured top-down market
sizing
Suggesting phased expansion with
flexibility for scale
Addressing consumer adoption risk with
pilot tastings
Identifying dual sourcing to stabilise
supply chain early on 74
75.
Market Risk
Marketing OperationalCompetitive
Taste preferences
Small pilot testing Gathering local feedback
Supply chain disruptions Quality issues
Central Kitchen Taste standardization
Limited Time Offers Highlighting brand heritage story
Legal/Regulatory
Food safety Local Regulations
75
76.
Your client isa mining and metal company that wants to enter different industries. How would you go about evaluating its
options?
Sure, I’d like to begin with a few preliminary questions. First, what are the company’s core capabilities? Is it financially constrained or
technologically limited?
The company is financially strong, and technology is not a barrier. It’s currently a market leader in India and is gaining presence in the
U.S.
Alright. And is there any constraint on the customer segment or the number of sectors they’re looking to enter?
No specific customer segments. The goal is to capture a large market share, and for now, you can assume they’re exploring just one
new sector
Understood. To further tailor my approach, where does the company currently operate across the value chain?
Can you draw the value chain first?
Sure, the value chain for a mining and metal company typically includes:
R&D →Exploration →Inbound Logistics →Refining →Outbound Logistics →Distribution →Sales & Marketing →After-Sales Services
The company operates from R&D to distribution.
Got it. Based on that, I’d look at two broad avenues:
1.Horizontal expansion into related metals or products within the same industry.
2.Diversification into new industries that align with the company’s strengths and long-term global trends.
Since we’re discussing new industries, I’ll focus on diversification.
That’s reasonable. What industries would you consider for diversification?
ROUND
PARTNER
CASE TYPE
MARKET ENTRY
INDUSTRY
MINING
COMPANY
KEPLER CANNON
FREQUENCY
MEDIUM
MODERATE 76
77.
I would prioritizeindustries that meet three key criteria:
High growth potential
Operational or resource synergy with mining/metals
Long-term strategic relevance
One strong candidate is the renewable energy sector
Can you elaborate on why renewable energy?
It complements their existing resource-heavy operations, has global demand tailwinds, and aligns with sustainability goals that are gaining regulatory and
investor focus.
Plus, governments globally are incentivizing renewables, making it a policy-aligned play as well.
Fair enough. Within renewable energy, what specific opportunities would you explore?
I would recommend exploring biofuels. Here’s why:
1.India is a global leader in biofuel production
2.The International Biofuel Alliance recently signed between India, the U.S., and Brazil shows long-term geopolitical support
3.It's less capital intensive than solar/wind infrastructure and leverages supply chain/logistics strengths of the client
4.By 2040-2050, biofuels are expected to be fully mainstream — early entry now = first-mover advantage
Makes sense. How would you suggest the company enters this space?
There are a few options:
1.JV with an AgriTech or energy company for quicker access to biofuel expertise
2.Greenfield investment if control is a priority
3.Acquisition of a small but promising biofuel startup to fast-track entry and gain IP
4.They can start with pilot projects in key Indian states and gradually expand.
Great insights. We can close the case here
77
78.
PRELIMINARY QUESTIONS
BROWNIE POINTS
1.Whatare the company’s core
capabilities? Is it financially
constrained or technologically
limited?
2.Is there any constraint on the
customer segment or the number
of sectors they’re looking to enter?
3.Where does the company currently
operate across the value chain?
The candidate proactively mapped
out the entire mining & metals
value chain
Framed biofuels as a first-mover
opportunity that aligns with 2040-
2050 projections—showing
awareness.
INDUSTRY
Risks
Operational effeciency
Country
In Curerent
Business Model
Marketing
attractiveness
Competition
4Ps
cost
segmentation PESTEL
Industry
Wear
and Tear
Poor Quality
Checks
Low Quality
Vendor
Financial Attractiveness
Growth
percentage
Currency
Fluctuations
Barriers to entry
Market
Size
Price (-vc)
Market Share Costs
Electroni
cs
Automobile
Percentage demand
in each
Weighted Average
for total demand
Percentage Growth
pf Industries
Demand by Industry
MARKET
SIZE
Margins
Percentage
Growth
India
Demand
Global
78
79.
Jio wants tolaunch an India-based cooking show. How should they go about this?
I understand the problem statement, but I have some preliminary questions.
Go ahead.
What is the objective behind this?
To become the most watched app in India, basically to grow their viewership.
Are there any budgetary or time constraints that should be kept in mind?
There are no constraints on budget. However, they do want to launch within the next six months.
Is there any specific audience that they are catering to?
They will mostly cater to households. And because it's a cooking show, they are targeting women a little bit more than men.
Are there any other firms that are getting into this?
No other firms are getting into this if it’s executed within the six-month timeline. Otherwise, other firms might also try to get in.
Since they want to become the most watched app, will it be like Jio Cinema, which is only OTT-specific, or are they targeting TV as well in some
form?
This is a good question. No, it won’t be OTT-specific; they’ll try targeting TV audiences as well.
ROUND
MANAGER
CASE TYPE
MARKET ENTRY
INDUSTRY
ENTERTAINMENT
COMPANY
MCKINSEY& CO.
FREQUENCY
HIGH
MODERATE 79
80.
Okay, market entrycan be broken down into:
· Financial feasibility
· Operational feasibility
· Assessing the risks involved
Do you want me to focus on any specific segment?
Focus on financial feasibility.
So, we'll be estimating the revenue that can be generated.
Instead of revenue, estimate the viewership that they can get, the number of households that can be targeted, etc.
Then I’ll start with the estimates.
Population of India = 1.4 billion or 1400 million people
Now, segregating using a very basic 70-30 split, with 70% of people living in rural India and almost 30% living in urban India,
Population in urban areas = 400 million (approx.)
Population in rural areas = 1000 million (approx.)
Dividing these by 4 (= the average household size), we get 100 million households in urban areas and 250 million households in rural areas.
Further breaking it down according to income in urban areas,
· Upper-income households (approximately 20%)
· Middle-income households (approximately 50%)
· Lower-income households (approximately 30%)
Is it fair for me to assume that penetration will be much less in lower-income households in urban areas? Can we eliminate the 30%?
Yes, that's fair.
Okay, so 100 million households in urban areas, 20% upper-income households, 50% middle-income households, that gives 20 million households in the upper-income
group and 50 million households in the middle-income group. Assuming that there are two TVs per household in the upper-income urban group and one TV per
household in the middle-income urban group, it will give us 40 million for upper-income and 50 million for middle-income. 80
81.
And now, inrural areas, there are 250 million households in total. Assuming a filter of 10%, 30% and 60% for upper-income, middle-income and lower-income
households respectively. Assuming that there's 1 TV per household in the upper-income group, there are a total of 25 million. In the middle-income group, which was
30% of these 250 million households in rural India, you assume that there are 75 million households and then 0.5 TVs per household, so 37.5 million in total. I will be
ignoring the lower-income households from this guesstimate, considering the fact that TV penetration rate there will be low.
Now, coming back to urban areas,
· 20 million households in the upper-income group with two TVs per household
· 50 million households in the middle-income group with one TV per household
Totaling that gives 90 (40+50) million, and assuming approximately 50% of them would want to watch cooking shows (since the target is women), and out of them,
approximately 40% would want to watch a cooking show by Jio (because it has a market pull).
90 x 50% x 40% = 18 million is the estimated viewership in urban areas approximately
But the assumptions for rural areas still looks a little bit aggressive to me and I would like to tweak it a little.
Yeah, sure, the number for rural areas looks a little bit aggressive to me as well.
In rural India, there were 25 million households in the upper-income group and 75 million households in the middle-income group. Instead of taking one TV and 0.5 TV,
respectively, I will take 0.5 TV in the upper-income group for rural India and 0.25 TV per household in the middle-income group.
Changing the calculations a little bit:
· 25 million x 0.5 TVs per household = 12.5 million households, so approximately 10 million (upper-income)
· 75 million x 0.25 TVs per household = 18.75 million households, so approximately 20 million (middle-income)
Now, totaling this gives us 30 million. Assuming a penetration rate of 60% in watching cooking shows. The propensity of women in rural India to watch these cooking
shows might be higher as compared to urban areas since they have more free time. Also, maybe 50% of them would be inclined to watch a cooking show by Jio.
30 x 60% x 50% = 9 million is the estimated viewership in rural areas
And summing up the estimated viewership in rural and urban areas gives us, 9 + 18 = 27 million. Therefore, the estimated viewership for this show is 27 million.
Good estimate. The case ends here. 81
82.
Urban (30%)
400 million
India’sPopulation = 1.4 B
Rural (70%)
1000 million
100 mn. households 250 mn. households
Upper
(20%)
Middle
(50%)
Lower
(30%)
Upper
(10%)
Middle
(30%)
Lower
(60%)
20 Mn. x 2 TV
= 40 million
50 Mn. x 1 TV
= 50 million
25 Mn. x 0.5 TV
= 12.5 million
75 Mn. x 0.25 TV
= 18.75 million
Cooking show penetration = 60%
= 18 million (app.)
Jio specifically = 40% Jio specifically = 50%
18 million
9 million
27 million
Cooking show penetration = 50%
= 45 million
ESTIMATE VIEWERSHIP
OBJECTIVES
MARKET ENTRY
Women and
Households
RISKS
Grow
viewership
FINANCIAL
ATTRACTIVENESS
OPERATIONAL
FEASIBILITY
OTT + TV
Launch in 6
months
No . of
Viewers
Revenue per
viewer
Done on next
page
BROWNIE POINTS
1. Adjust assumptions when unrealistic.
2. Segment households by income, TV access,
gender, and gender based habits (cooking
shows)
3. quick in math; using different estimates
4.Focus on viewership, not revenue.
82
MARKET GROWTH
Mergers
INORGANIC ORGANIC
Acquisition
JointVenture
Partnerships
Revenue/User No of User
No of
transaction/user
Revenue/Transaction
Cross Selling
Loyalty Programs
Discount
Bundling
Upselling
Existing Markets New Markets
Increase Volume Increase Price
No of
transaction/user
Revenue/Transaction
Culture and
Contextual Fit
Assess Tech and
Media Penetration
Increase Product
Mix
Increase Customer
Base
Language and
Communication
Cultural Norms
Local Practises
Business
Consumer
Behaviour
Preferences
84
85.
No.Of Users
EXISTING
MARKETS
NEW MARKETS
Geographical
Expansion
Business
Integration
DomesticInternational
Value Chain Analysis
Internal Quantitative
External
Cash Flows
ROI/ Hurdle Growth
Diversification
85
1. What is the average growth rate of the
industry? How does the client compare?
2.What is the expected timeframe for achieving
the growth target?
3.Are there any budgetary, operational, or
resource constraints to keep in mind while
suggesting solutions?
4. Is the company aiming for growth in existing
markets or new markets?
5.How saturated is the current market, and
what’s the competitive landscape like?
6.Why is the client targeting growth? Is it to
satisfy investors, stay competitive, or meet
internal goals?
7. Is there a particular timeline for achieving a
set percentage of growth or is there flexibility?
PRELIMINARY QUESTIONS
Market growth cases focus on identifying ways
a company can increase its revenue, user base,
or market share. Growth can be organic—
through pricing, product expansion, or
customer acquisition—or inorganic, such as
mergers, acquisitions, or partnerships. These
cases test your ability to find practical, scalable
solutions tailored to the company’s context.
To solve them, it’s important to analyze both
internal factors (like product mix and
customer segments) and external factors (such
as industry trends or competition).
86.
So your caseis about growth in aerospace manufacturing, particularly around commercial aircraft in India. How would
you approach this?
Just to clarify- when we say "aerospace manufacturing" here, are we talking about building specific components, assembling aircraft, or producing
full commercial airplanes?
The focus is on assembling and manufacturing full-passenger aircrafts in India.
Got it. So basically we’re trying to step into the commercial aircraft space in a big way. Right now, India’s got some experience with defense-
related manufacturing, but this is definitely a different game. So are we assuming this as starting afresh, like a greenfield initiative, or are we
building up from existing infrastructure, maybe from the defense side?
There’s some base from defense manufacturing, but commercial aircraft is a bit different, so yeah, it’s kind of a fresh push.
Makes sense. And just to understand the intent, is the goal here mostly to meet domestic demand, or are we aiming to become an export hub
down the line?
For now, let’s assume domestic focus, with future potential to scale for exports.
Got it. Also, is this being driven more by the private sector, or is the government playing a central role in pushing this?
It’s expected to be a public-private effort, government support, but private execution
Okay, but before diving into ideas, I’d like to structure my thoughts around three things: first, where we currently stand, second, who the key players
are, and third, what steps we could take to grow. Is that alright?
Yes, go ahead.
Okay, so talking about India’s current position in the commercial aerospace industry, their market presence is still pretty new. In general, it’s tough
ROUND
BUDDY
CASE TYPE
MARKET GROWTH
INDUSTRY
SPACE
COMPANY
MCKINSEY & CO.
FREQUENCY
MEDIUM
LOW 86
87.
to enter, thereare super high entry barriers, long timelines, and the tech needs to be really precise. So if we want to be a serious player here, we’ll need help from big
global companies who are also the key players of this industry like Boeing, Airbus or Lockheed, we would also require government backing, and a local ecosystem that
can actually build and support full aircraft manufacturing.
Any country you’d look to for inspiration?
Brazil comes to my mind. Example of Embraer shows how it grew because of strong government-industry coordination and a clear export vision. China’s another
example, they started with partnerships and now have COMAC. I think India could take a hybrid approach, borrow China’s aggressive policy push but with Brazil’s
focused, midsize aircraft strategy to begin with.
Alright, that was a good walkthrough. Thanks.
87
88.
AIRCRAFT MANUFACTURING GROWTH
STAKEHOLDERROLES
EXISTING CAPACITY
Global
Benchmarks
Global OEM
Partnerships
Policy Push
Skill to Talent
Development
Vendor Ecosystem
Developement
Blended Finance
Models
Brazil
(Embraer)
China
(COMAC)
PRELIMINARY QUESTIONS
BROWNIE POINTS
GROWTH ENABLERS
Global
OEMS
Government Higher
Educational
Institutions
Private
Indian Firms
Experience in defence
manufacturing but
minimal in commercial
aviation
Lacks depth in aerospace
specific infrastructure
and specified workforce
Limited Integration
with global supply
chains
1.What is the main focus here - specific
parts, final assembly, or full product
manufacturing?
2.Are we starting fresh with a new setup, or
building on top of existing infrastructure
or capabilities?
3.Is the goal mainly to serve domestic
demand, or are we also aiming for export
opportunities down the line?
Showing structured thinking early on and
aligning the approach with the case context.
For example, breaking it into current
landscape, key players, and growth levers. This
signals clarity, confidence, and real-world
awareness.
88
89.
89
A leading telecommunicationsand IT services company has been experiencing stagnated growth over the past few years.
Your task is to analyze the reasons behind this and recommend a strategy to accelerate growth over the next five years.
Just to clarify- leading telecommunications and IT services company has been experiencing stagnated growth over the past few years and they
want our help in identifying the reasons?
Yes correct, you may start
Got it. I would like to understand the company better, What is the company's core competency – telecom infrastructure, IT services, or both
equally?
The company started as a telecom infrastructure provider but has gradually expanded into IT services. Currently, telecom services
account for about 65% of revenue while IT services contribute 35%. Their core strength remains in network infrastructure, though they've
been working to build capabilities in cloud solutions and managed services.".
Makes sense. And has the company made any major investments, acquisitions, or shifts in product focus recently? Are we looking to grow
organically, inorganically, or both?
Yes, they acquired a mid-sized cloud services provider two years ago for $300 million, but integration has been slower than expected.
The company is open to both approaches
Got it. I would start with a structured approach, analyzing the company’s current situation, market segmentation, and industry trends before
developing a strategic recommendation. To begin, could you provide more details about the company’s revenue-generating products and its
market presence?
Sure. The company has three major product categories catering to different customer segments. It operates in multiple geographies
but primarily focuses on mass-market telecommunications and SaaS-based products. Over the past five years, its growth has remained
in the 6-7% range, which is relatively slow. What insights do you derive from this?
ROUND
BUDDY
CASE TYPE
MARKET GROWTH
INDUSTRY
SPACE
COMPANY
MCKINSEY & CO.
FREQUENCY
MEDIUM
LOW
90.
The stagnation suggeststhat the company’s core revenue segment has matured. I would categorize the customer base into three segments:
Segment A: Mass market (60% of revenue, 6-7% growth)
Segment B: Large enterprises (30% of revenue, 8-9% growth)
Segment C: Niche businesses (10% of revenue, 15-20% growth)
From this breakdown, it’s clear that the company has heavily relied on Segment A, which is growing slowly, while Segment C has high potential but remains
underinvested. Would you like me to validate this hypothesis with additional data points?
That’s a solid analysis. Let’s move on to industry trends. What challenges and opportunities do you foresee?
Key industry trends include:
1.Digital Transformation & Automation: Customers are shifting toward more specialized IT solutions.
2.Increased Competition: Emerging tech startups are offering innovative, cost-effective solutions.
3.Evolving Customer Preferences: Large enterprises and niche businesses demand tailored solutions rather than generic offerings.
These trends suggest that the company must adapt its strategy to focus on high-value, customized solutions. Would you agree?
Yes. Given these insights, what strategies would you recommend to accelerate growth?
I propose a three-pronged approach:
1.Increase Customer Acquisition- Expanding sales efforts toward high up growth segments (B & C) and building strategic partnerships with niche industry players to
establish credibility.
2.Enhance Revenue per Customer- We should upsell and cross-sell premium solutions to existing customers and offer customization to improve retention and
increase pricing power.
3.Optimize Customer Mix- It’s crucial to shift the strategic focus from Segment A to Segments B and C and to develop industry-specific solutions to cater to evolving
customer needs.
90
91.
Interesting. How wouldyou assess the financial impact of this strategy?
I would conduct:
Revenue Projections, to estimate growth over a 3-5 year period based on market penetration and wallet share.
Market Share Analysis, to measure potential gains in Segment C and its contribution to total revenue.
Sensitivity Analysis, to assess risks and rewards of shifting resources toward higher-growth segments.
Good approach. Before we wrap up, what potential risks might arise from this shift, and how can they be mitigated.
Potential risks include:
1.Revenue Volatility: Moving away from Segment A might impact short-term revenue stability. Mitigation: Implement a phased transition while maintaining core
offerings for mass-market customers.
2.Execution Risks: Expanding into new segments requires specialized expertise. Mitigation: Invest in hiring domain experts and leveraging strategic partnerships.
3.Competitive Threats: Startups might respond aggressively to our shift. Mitigation: Differentiate through innovation and value-added services.
Excellent analysis. To conclude, how would you summarize your recommendation?
The company must pivot toward high-growth segments while maintaining a stable revenue base. By focusing on customer acquisition, revenue enhancement, and
optimizing its customer mix, the company can achieve sustainable long-term growth over the next five years.
Great job! Thanks for your insights.
91
92.
PRELIMINARY QUESTIONS
BROWNIE POINTS
1.Arethere specific geographies where
growth has stagnated more than others?
2.Is the company’s brand perceived
differently across customer segments (A,
B, C)?
3.What internal capabilities or resources
does the company have that could be
leveraged for growth?
1.Identifying Segment C (niche businesses) as
high-potential and underinvested
2.Using industry trends to link customer needs
with strategy (e.g., demand for tailored IT
solutions)
3.Shifting focus from revenue-heavy to growth-
heavy segments thoughtfully, not abruptly
4.Proposing upselling/cross-selling and product
customization to increase wallet share
5.Backing strategic shift with clear financial tools:
revenue projections, sensitivity & market share
analysis
IT SERVICE COMPANY GROWTH
EXISTING CHANNELS NEW CHANNELS
(Net Growth 6%)
(60% Revenue,
6-7% Growth)
(30% Revenue,
8-9% Growth)
(10% Revenue,
15-20% Growth)
Under-
Invested
Heavy
Reliance
Medium
Reliance
Niche
Business
Mass
Market
Large
Enterprises
Market
Segmentation
Current
Growth
Expansion
Areas
Emerging
Technology
(AI, Cyber-
security)
Automated AI
Solutions
Cost Effective
and Niche
Business
Tailored
Solutions
Optimise
Customer
Mix
Increase
Customer
Acquisition
Enhance
Revenue
Financial
Feasibility
Revenue
Projections
Market Share
Analysis
Sensitivity
Analysis
Revenue
Volatility
Execution
Risks
Competitive
Threats
Risks
92
93.
Your client isFlipkart, India's leading e-commerce marketplace. They aim to decisively outperform their main competitor, Amazon
India, within the next 2-3 years. The client wants a comprehensive strategy to increase their market share and solidify their position as
India's dominant e-commerce platform.
Thank you for the case. To ensure I understand the objective clearly, is the client looking to surpass Amazon in specific metrics like market share,
revenue, customer base, or overall brand perception?
What do you think would be most relevant for an e-commerce platform looking to establish dominance?
I believe market share expansion would be the primary objective, especially given the significant growth in the e-commerce industry post-COVID.
This would encompass several components including customer acquisition, order volume, and gross merchandise value. India's e-retail sector has
seen accelerated growth, particularly with increasing adoption in Tier 2 and Tier 3 cities.
That's correct. The e-retail industry has indeed seen substantial growth post-COVID. Previously, consumers in Tier 2-3 cities were
hesitant to shop online. What factors do you think have contributed to this change?
I'd attribute this shift to several factors:
1. Social trends - Fashion trends and product launches reach physical stores in smaller cities much later than they appear online, creating an
incentive to shop digitally 2. Competitive pricing - E-commerce platforms can offer better prices due to reduced overhead costs 3. Product variety
- Online platforms provide access to a wider range of products than local stores 4. Logistics improvements - Faster delivery even to remote areas
has improved the customer experience
For example, trendy fashion items might take months to reach physical stores in smaller cities, whereas online platforms offer immediate access.
Let's break this down further. What factors influence a user's decision to download and use an e-commerce app?
The key factors would include:
1. Need awareness - Recognizing the app solves a shopping need 2. App store reviews and ratings - Social proof of quality 3. Peer
recommendations - Hearing positive experiences from friends and family 4. Ease of use - User-friendly interface and navigation 5. Marketing
promotions - Special offers and discounts for new users
You're missing an important practical consideration that affects many users in India.
ROUND
PARTNER
CASE TYPE
MARKET GROWTH
INDUSTRY
E-COM
COMPANY
Bain & Co.
FREQUENCY
HIGH
MODERATE 93
94.
Storage availability onphones could be a significant factor. Many users in India have budget smartphones with limited storage capacity, which affects their decisions
about which apps to keep installed.
Exactly. Although smartphone affordability has increased and storage capacity has improved, it remains a consideration. Let's talk about delivery
capabilities. What observations do you have about Flipkart versus Amazon in this area?
From my observation, Flipkart has several advantages in delivery:
1. Post-lockdown recovery - Flipkart resumed deliveries earlier than Amazon in many cities 2. Delivery speed - Flipkart often provides faster delivery times, especially in
Tier 2 and 3 cities 3. Distribution network - Flipkart has built a more extensive network in India, particularly in non-metro areas 4. Hyperlocal delivery - Flipkart's quick
commerce initiatives have expanded rapidly
Returns are another critical aspect of e-commerce. Did you know that approximately 25% of product value is returned? This is sometimes due to
exploitation of return policies.
That's a significant percentage. The standard 30-day return window might be exploited by some customers who use products temporarily and then return them. Could
Flipkart adjust their return policies to address this?
This is actually government-mandated. What other solutions might help reduce returns without changing the policy window?
Flipkart could implement several measures:
1.Defect verification - Require photos of defects before accepting returns
2.Delivery confirmation - Have delivery personnel verify product tags and packaging integrity
3.Improved product information - Provide more accurate descriptions, sizing guides, and images to reduce expectation mismatches
4.Distribution network optimization - Ensure products arrive in perfect condition by improving handling
5.Return fees for non-defective items - Implement nominal fees for returns that aren't due to product defects
Good suggestions. Now, let's assume Flipkart successfully surpasses Amazon but begins to face market saturation. How could they sustain growth?
94
95.
To sustain growthbeyond market saturation, Flipkart could pursue several strategies:
1. New segment expansion - Enter adjacent markets like OTT streaming (similar to Amazon Prime Video) 2. Regional specialization - Focus on region-specific products
and services tailored to local preferences 3. Enhanced customer engagement: - Loyalty programs like Flipkart SuperCoins - Personalized shopping experiences -
Gamification elements that increase time spent on the platform 4. Vertical integration - Developing private label brands across categories 5. International expansion
- Enter new markets beyond India 6. Social commerce - Integrate social media features and community-based shopping
Great discussion. This is how we solve real-world cases. Did you enjoy it?
Absolutely. It was interesting to explore the various dimensions of e-commerce competition and think through concrete strategies for market leadership.
Great. That concludes our case.
95
96.
PRELIMINARY QUESTIONS
BROWNIE POINTS
1.Specificmetrics for
"outperforming" (market share,
revenue, customers)
2.Geographic focus (urban vs.
rural, specific regions)
3.Timeline expectations and
milestones
4.Available resources and budget
constraints
5.Current competitive advantages
to leverage
1.Understanding the importance of
smartphone storage in app adoption
2.Recognizing the distinct shopping
behaviors in Tier 2-3 cities
3.Acknowledging the high return
rates and their impact on
profitability
4.Identifying the role of fashion in
driving e-commerce adoption
5.Considering post-dominance
strategies for sustainable growth
FLIPKART MARKET GROWTH
ORGANIC INORGANIC
Number of Customers Revenue Per Customer
Distribution
Competitive
Pricing
Product
Variety
Faster
Delivery
Tier 2-3 City
Customers
App
Dowanloads
Awareness
App
Reviews
Peer
Recommendations
Ease of Use
Promotions
Mobile Storage
Delivery
Speed
Vast
Distribution
Network
Hyperlocal
Delivery
AOV Returns
New Segment
(OTT)
Localised
Products
Loyalty
Programs
Increase
AOV
Add New
Brands
Defect
Verification
Delivery
Monitoring
Distribution
Optimisation
Return
Fees
Decrease
Returns
96
PRELIMINARY QUESTIONS
PRICING
Internal External
ReturnBased
Cost Based
Fixed (rent, salaries,
machinery)
Variable ( raw
materials, shipping,
packaging)
Profit Margin (
Markup, added over
total cost)
Market Forces
Value Based Competition
Willingness to
pay
Perceived Value
Differentiation
ROI Target
Capital
Investment
Profit Objectives
Benchmarking
Price Parity
Market
Positioning
Demand Supply
Seasonal
Macrotrends
1.Pricing cases are used to assess how a
specific product or service is priced and
different factors that influence the price.
2.It involves identifying whether the pricing
be influenced by the internal factors which
stems from the goals of the company, costs
involved and how the company operates or
external factors which could be economic
factors, demand of the product/service,
competitor pricing, region and the scale of
operations etc.
Total Cost= Fixed
Cost + (Variable Costs
X Units)
Price= Variable Cost
per unit + (Total
Fixed Cost)/ Units to
recover fixed costs
Price= Total Cost +
Desired Return/
Estimated Units
BROWNIE POINTS
1. What is the company's current business
focus and long term goals?
2. What are the key features, lifecycle, and
benefits of the product/service?
3. Is the primary objective of the company
maximizing profits, increasing market
share, or something else?
4. What does the competitive landscape
look like for this product/service?
98
99.
COST BASED
Fixed costswhich are not influenced by level of output and variable costs are those costs which are
influenced by the output-
When to use-
Low product differentiation
Cost sensitive market
Calculating floor price
Clarifying Questions -
1. What are the total fixed costs (rent, salaries, machinery) and variable costs (raw materials, packaging,
shipping) per unit?
2.What profit margin or markup percentage do we aim to add over the total cost?
3.Are there any hidden costs or overhead allocations we should consider?
4.How do changes in volume of production affect per-unit cost?
5.How sensitive is our pricing to fluctuations in variable costs?
RETURN BASED
This is influenced by the financial goals of the company, ROI target is used to ensure returns over time.
When to use-
High Capital investments involved (Return on Capital Investment)
Benchmarking internal profits
Clarifying Questions -
What is our target ROI or profit objective for this product/service?
What is the capital investment made, and over what time frame are we expecting returns?
How many units need to be sold to recover fixed costs and meet our ROI goal?
What is the estimated demand at the proposed price point?
Are there alternative investments with better or safer returns we should compare this against?
Internal Factors External Factors
99
VALUE-BASED
This is influenced by the utility derived from the product or service to the consumers and how they perceive it
When to use-
Unique product or offering personalised experience
High benefit or premium product where customer is willing to pay more
Clarifying Questions -
What is the customer’s willingness to pay for this product/service?
How does the perceived value compare to competing products?
What unique value proposition or differentiation does this offering provide?
How price-sensitive are customers in this segment?
Are there emotional or brand-driven factors affecting perceived value?
COMPETITION BASED
Analyzing how competitors are offering the product or service and how that impacts the pricing objective for the
company’s product/service
When to use-
Crowded markets with similar offerings
Price sensitive consumer base
Clarifying Questions -
Who are our main competitors and what are their prices?
What is the price-quality positioning of our competitors?
Are there industry benchmark prices or price ranges for similar products?
What is our desired market position (premium, mid-range, economy)?
Are there any pricing wars or aggressive price-cutting practices in the market?
MARKET FORCES
It is influenced by consumer preferences and demand
When to use-
Driven by external shifts such as festivals, inflation, location, climatic changes etc.
Clarifying Questions
What is the current demand-supply situation in the market?
Are there seasonal effects or cyclical trends influencing pricing?
What are the macroeconomic trends (inflation, taxes, regulations) that might impact pricing?
How does customer purchasing power fluctuate in this market?
Are there any upcoming events or disruptions (new entrants, regulations) likely to affect market dynamics?
Internal factors of deciding the pricing are influenced mainly by the costs involved in making the product
and revenue goals and expectations.
100.
CASE TYPE
PRICING
Cowculator
COMPANY
ROUND
MCKINSEY &CO.
MANAGER
INDUSTRY
FARM
EASY
Your client is a farmer based in Haryana, he has a cow that he wants to sell and wants to know how to price it. How will you
go about it ?
Can I get some more details about the breed of the cow and if it is healthy.
The cows breed is Gir, and it is healthy.
Since we have to price this cow, there could be four standard pricing approaches and we also have to consider a fifth option, how this cow will
play into the barter system that is primarily present in these villages.
Can you elaborate on the barter system ?
Villages are generally tight-knit communities where the people would generally exchange goods for goods or favors, for example a farmer could
give crop waste like husk or straw as fodder for a cow and get some milk in return, would you like me to start my analysis with such a system ?
Excellent point! However, for this situation we would not consider such interactions. What else do you think could be done to price it?
I can think of four approaches to price the cow, a cost-based approach that would allow us to calculate expenses (feed, care, breeding) to
determine break-even or replacement cost, a competitor/market based approach which would give us a benchmark by analysing recent sale
prices of similar cows in local auctions or farms, an income based approach based on future earnings (milk, calves) and finally a value-based
approach which would be
pricing the cow based on intrinsic worth (e.g., breed rarity, genetic superiority, or sentimental value)
Please go ahead with all four, starting with the cost-based approach
To start with cost-based pricing, I'd need to understand two things: First, how much did the farmer originally pay for the calf, and second, what
are his annual expenses to maintain the cow - things like fodder cost, veterinary care, and any labor costs?
He bought it as a calf 4 years ago for ₹20,000. Annual expenses are around ₹30,000.
FREQUENCY
MEDIUM
100
101.
Cowculator
So over 4years, that’s ₹1.2 lakh in upkeep plus the ₹20,000 initial cost—₹1.4 lakh total investment. With a 10% margin, a break-even price would be around ₹1.5–1.55
lakh. That’s a useful floor, but to assess if this is viable, I’d want to benchmark it against the market. What are similar Gir cows selling for in the region?
On average, 5-year-old Gir cows go for ₹1 to ₹1.2 lakh. If they yield more than 10L of milk per day, they can fetch 10–15% more.
So high-yielding cows might touch ₹1.3–1.4 lakh. That puts our cost-based price on the higher side of the market range, which means we’d need to justify the premium—
either through productivity or other value indicators. Should I continue with the income-based approach?
Yes, go ahead.
Let’s say the cow produces around 10 liters of milk per day and milk sells for ₹40/litre. Assuming 300 productive days in a year, that’s ₹400/day, or ₹1.2 lakh annually in
milk revenue. If she remains productive for another 5 years, that’s ₹6 lakh in topline income. Deducting 50% for operating expenses, we’re left with ₹3 lakh in net
earnings from milk. If she also produces a calf every year, and each sells for ₹25,000–₹30,000, that’s an additional ₹1.25–1.5 lakh. So total income potential is about
₹4.25–4.5 lakh. Based on this, pricing her at ₹1.5–1.8 lakh would be justifiable for a buyer looking at ROI.
That’s a solid estimate. What about value-based pricing?
That would depend on intangible factors. Does the cow have a noteworthy lineage, any awards, or consistently healthy calves?
Yes, she comes from a prize-winning bloodline, her health is excellent, and her calves are usually top performers at local fairs.
That significantly boosts perceived value. In livestock markets, elite bloodlines and proven health records can fetch 15–25% premiums. If average cows go for ₹1.2 lakh,
she could reasonably be priced at ₹1.6–1.7 lakh. Especially for breeders or dairy businesses looking to improve their herd, the added genetic value is a real incentive.
Why would someone pay that premium in a rural setting?
101
102.
Because this cowisn’t just a production unit—it’s a premium genetic asset. For serious dairy farmers, her pedigree means better offspring, more predictable milk
yield, and lower health risks. Additionally, owning a cow of such lineage carries prestige, especially in tight-knit farming communities. It’s like owning a “trophy asset”
that also generates returns.
Well reasoned. No further questions—this covers it.
Cowculator
102
103.
PRELIMINARY QUESTIONS
BROWNIE POINTS
CostBased Income Based
Competitor Based Value Based
Bought (4 years ago) = Rs 20,000
Annual Expenditure = Rs 30,000
Over 4 Years -
30000*4= 1,20,000
Total Amount Spent on Cow = 1,20,000 +20,000= 1,40,000
Cost Based Value Based
Considering 10 % Profit Margin
Pricing cows to cost based = Rs 1.50 Lakh - Rs 1.54 Lakh
Assuming Price of Milk= Rs 40 /Litre
Income Earned from Cow =10 * Rs 40 * 300= 1.2 L annually
(assuming 300 productive days )
(assuming 10L of milk a day )
For 5 years
= Rs 1.2 L * 5 = Rs 6 L
Profit from milk (after 50% operating margin)= Rs 6 L * 0.5 =Rs 3 L
Earnings from calf
(assuming 1 each year and priced Rs 25 k- Rs 30k and
for 5 years ) =Rs 1.25 L -Rs 1.5 L
Total Earning Potential = Rs 4.25 L - Rs 4.5 L
Cowculator
1.What breed is the cow?Is the cow
healthy?
2.How this cow will play into the barter
system that is primarily present in
these villages.
3.For cost based pricing- how much did
the farmer originally pay for the calf,
and second, what are his annual
expenses to maintain the cow - things
like fodder cost, veterinary care, and
any labor costs?
4.What are similar Gir cows selling for
in the region?
5.Does the cow have a noteworthy
lineage, any awards, or consistently
healthy calves?
1.Smart inclusion of the barter system as
a potential pricing lens, showing
sensitivity to village economies and
localized trade behaviors, even though
it wasn’t used.
2.Use of Income pricing method going
beyond standard pricing framework.
3.Positioning of the cow as a “trophy
asset” by linking award-winning
lineage to ROI, health, and social
prestige. 103
104.
CASE TYPE
AI APP
COMPANY
ROUND
INDUSTRY
KEARNEY
PARTNER
TECHNOLOGY
MODERATE
AI,Ay, Captain
A leading online learning platform is launching a new AI personalized learning subscription. The objective is to determine
the optimal pricing strategy that balances accessibility, revenue max & profitability while maintaining a 60% gross margin.
That’s Great. Can you please elaborate on the Pricing strategy of the platform that has been followed so far?
Historically, the company has followed a fixed pricing model but is now considering a tiered pricing structure for this product.
What is the customer preference? Do they want an affordable option or are they ready to pay more?
Some users want an affordable option, while others are willing to pay significantly more for premium AI-driven features.
This is a compelling challenge. I’d approach it by analyzing four key dimensions:
Who are our target users, and how price-sensitive are they?
What’s the perceived value of AI-powered learning?
How are similar offerings priced, and where do we want to position ourselves?
How do different pricing models affect revenue, margins, and customer acquisition?
This structure works. Let’s begin with customer segmentation. How would you break down potential users?
I’d segment users based on demographics, learning behavior, and willingness to pay. Key segments could be:
• Casual Learners – Price-sensitive users who take occasional courses.
• Students & Early-Career Professionals – Willingness to invest in skill-building but budget-conscious.
• Corporate & Enterprise Clients – Higher willingness to pay for professional development at scale.
• High-Engagement Users – Individuals willing to pay a premium for extensive personalization, AI-driven recommendations, and exclusive content.
Interesting. Based on this, would you propose a specific pricing structure? And how would you go about determining the right price points
for each tier?
FREQUENCY
LOW
104
105.
AI, Ay, Captain
I’dpropose a three-tier approach—but before defining specific price points, I’d recommend grounding the pricing in a few steps:
First, we need to ensure the pricing allows for a 60% gross margin. Let’s assume the average cost/user (content delivery, AI engine usage) is around $4/month for the
Basic plan, increasing to $12/month for more advanced AI features in the Pro tier, & possibly $40/month per seat for Enterprise with integrations and reporting tools.
With a 60% margin target, we’d want to price the:
Basic Tier at minimum $10/month ($4 cost →$6 profit = 60% margin)
Pro Tier at minimum $30/month ($12 cost →$18 profit = 60% margin)
Enterprise Tier at $100/month per seat ($40 cost →$60 profit = 60% margin)
But we still need to validate whether users perceive this as fair value.
Looking at competitors:
Coursera Plus charges ~$59/month with AI summaries and tracking tools.
LinkedIn Learning offers subscriptions around ~$39/month.
Platforms like Skillshare and MasterClass range from $15–$25/month.
Given that, and factoring in the added value of personalization through AI, we can position Basic competitively, keep Pro at a premium for AI differentiation, and
Enterprise with flexible pricing depending on scale.
That’s a thoughtful build-up. How would you define the tiers now?
Based on cost, margin targets, perceived value, and competitors:
105
106.
AI, Ay, Captain
BasicTier ($10/month) – Access to standard courses, limited AI features.
Pro Tier ($30/month) – Personalized learning paths, advanced analytics, progress tracking, priority support.
Enterprise Tier (~$100/user/month) – Custom plans for companies with bulk licensing, advanced reporting, and platform integrations.
This setup meets both margin goals and aligns with market expectations.
Great. Let’s assume a base of 100,000 potential users. How would you forecast revenue under this model?
Sure, I’d forecast by estimating adoption rates across tiers:
Basic Tier – Let’s assume 60% adoption →60,000 users × $10/month = $600,000/month
Pro Tier – 30% adoption →30,000 users × $30/month = $900,000/month
Enterprise Tier – 10% from companies, averaging 5,000 seats at $100/month = $500,000/month
Total Monthly Revenue = $600K + $900K + $500K = $2 million
Annual Revenue = $24 million
At 60% margin, profit = $14.4 million annually
Would you like to run a sensitivity analysis for different adoption scenarios?
I’d be happy to if needed—shifting adoption percentages or pricing slightly can help stress-test the revenue model. But even at moderate variance, this structure is likely
to balance accessibility with profitability while supporting future scale.
No need—this is well thought out. Excellent work! Strong structure, analytical depth, and creativity in pricing models. Thanks for your time!
Thank you! I really enjoyed the discussion.
106
107.
PRELIMINARY QUESTIONS
BROWNIE POINTS
AI,Ay, Captain
Pricing Structure
Target Users Value of AI
powered Learning
Price
Benchmarking
Pricing Models
Price Sensitive Not sensitive
Revenue Margin Customer
Acquisition
Casual Learners Students & early
career professionals
Corporate &
enterprise clients
High Engagement
Users
1.Who are the target customer segments,
and how price-sensitive are they?
2.What are the competitive pricing
benchmarks in the market?
3.What features should be differentiated
across pricing tiers?
4.How does pricing impact revenue,
margins, and customer retention?
5.What risks exist, and how can they be
mitigated?
1.Using A/B testing insights to justify a
tiered pricing model.
2.Considering alternative monetization
strategies like freemium, usage-based
pricing, and early-bird discounts.
3.Performing revenue simulations to
ensure financial feasibility.
4.Highlighting cannibalization risk and
the need for careful rollout strategies.
107
108.
AI, Ay, Captain
PricingStructure
Cost $12/ Month
$4/ Month
$40/ Month
Pro Plan
Cost/ User
Basic Plan
Enterprise
Integrations
Pro = $30/month
Basic = $10/ Month
Enterprise= $100/ month
Cost + Profit
Potential Users =
100,000
30%
$900,000/m
60%
$600,000/m
10%
$500,000/m
$2 Million * 12 =
$24 Million
108
109.
Star Sports isintroducing bidding for a broadcast of a series like IPL. It is like a mini-IPL with 10 overs & 100 delivery, called
the 100. BCCI is in charge of it. Consider the factors that will account for your bidding & how much you should bid exactly.
Thank you for presenting this case. To understand the bidding strategy for Star Sports, I'll need to evaluate various factors that influence the
broadcast value of this new cricket format. Let me start by asking a few clarifying questions.
Will this tournament include only Indian players or international players as well?
No. All the cricket-playing countries.
Will the broadcast rights be for India only or worldwide?
Worldwide.
What is the expected duration of the tournament?
Similar to the IPL, around two months.
Do we already have information about confirmed sponsors ?
Why don't you consider that while structuring it?
Are there any benchmark bids from competitors we should be aware of?
There is no particular competitive amount, we just want to check our financial feasibility.
I’ll structure my approach to determine the optimal bid amount for Star Sports. I'll analyze this using four key dimensions: Viewership Potential,
Revenue Streams, Cost Structure and Strategic Value.
Let me start with the revenue streams to understand the potential return on investment (ROI).
ROUND
PARTNER
CASE TYPE
PRICING
INDUSTRY
ENTERTAINMENT
COMPANY
BCG
FREQUENCY
HIGH
MODERATE 109
110.
Can you listthe sources of revenue?
For revenue streams, I'll categorize them into three main buckets:
Subscription Revenue-
1.Incremental subscriber acquisition
2. Premium subscription tier opportunities
3.Pay-per-view potential in select markets
Advertising Revenue-
1.In-match ad spots (between overs and wickets)
2.Pre/post-match show sponsorships
3.Digital platform ad integration
4.Stadium perimeter advertising
Sponsorship & Licensing-
1.Title sponsorship
2.Team/jersey sponsorships
3.Highlight rights licensing
4.Content syndication opportunities
The revenue streams are satisfactory. Can you look at the cost factors?
For the cost structure, I'll divide it into two main categories:
1.Direct Costs- Production Costs, Camera crews and equipment, Commentary team, Production staff, Technical infrastructure, Digital streaming platform costs &
International feed distribution
2.Indirect Costs- Opportunity Costs, Displacement of other programming, Resource allocation trade-offs & Scheduling conflicts with other properties
Now, calculate the potential bid amount based on Expected Value (EV) analysis
, 110
111.
Expected Revenue Calculation:
SubscriptionRevenue: Assuming 10 million additional subscribers at ₹ 2 premium = ₹ 20 million
Advertising Revenue: 60 matches × 3 hours per match × 15 ad spots per hour × ₹ 10,000 per spot = ₹ 27 million
Sponsorship & Licensing: Title sponsor: ₹ 15 million, Team sponsorships: ₹ 10 million
& Licensing: ₹ 8 million
Total Expected Revenue: ₹ 80 million (₹ 8.5 Crores)
Expected Costs:
Direct Costs: Production=₹ 15 million and Broadcasting= ₹ 10 million
Indirect Costs: Opportunity costs= ₹ 5 million and Risk contingency= ₹ 5 million
Total Expected Costs: ₹ 35 million
Net Expected Value: ₹ 80M - ₹ 35M = ₹ 45 million (₹ 4.5 Crores)
Okay. Do you have any recommendations?
Based on my analysis, I recommend that Star Sports bid up to ₹ 45 million for the broadcast rights of "The 100" tournament. This represents the expected value of the
opportunity. However, I would further refine this recommendation with three strategic considerations:
1.Market Positioning Factor: I would add a 10-15% premium (₹ 4.5-6.75 million) if securing this property helps Star Sports maintain market leadership against
emerging competitors.
2.Portfolio Diversification: The bid should be adjusted based on how this new format complements Star Sports' existing cricket portfolio. If it attracts a different
demographic or fills a seasonal gap, a higher bid may be justified.
3.Long-term Rights Value: Consider the potential for multi-year rights deals. If the first year proves successful, subsequent years could generate higher returns
through established viewership and brand recognition.
Therefore, my final recommendation is to bid between ₹ 45-50 million, with a maximum ceiling of $52 million if the strategic value is exceptionally high. A bid higher
than this would likely lead to financial losses based on our analysis.
Thank you. We can close the case.
111
112.
PRELIMINARY QUESTIONS
BROWNIE POINTS
BIDAMOUNT
COST
REVENUE STREAMS
Advertisement
s
Sponsorships Indirect
Subscription Boosts
Production
Staff
Production
Costs
Technical
Infrastructure
Direct
Opportunity
Costs
Displacement of
Other Programs
Resource Allocation
Trade-offs
Premium
Subscription
Pay per
view
Incremental
Subscriber
Acquisition
Title
Sponsorship
Team/Jersey
Sponsor
Highlights
right
Licensery
Content
Syndication
In Match Ad
Spots
Pre/Post
Match Show
Sponsorships
Stadium
Parameter
Advertising
Digital
Platform Ad
Integration
Digital
Streaming
Platform Costs
1.“Is this a one-time event or a
recurring annual league?”
2.“Will Star Sports have exclusive
broadcast and digital rights
globally?”
3.“Will matches be held in India or
across international venues?”
4.“Are there confirmed teams or
franchises, or is the structure still
evolving?”
1.“This short-format league caters
perfectly to Gen Z’s quick-viewing
habits and OTT preferences.”
2.“Owning early rights allows Star to
shape the narrative and dominate a
new cricketing sub-format.”
3.“Positioning it as an off-season
property avoids IPL overlap and
smoothens revenue cycles.”
112
113.
A biotech firmhas developed a pill with unprecedented potential. You’ve been brought in to help them price it.
Let’s begin.
Understood. Before diving into structuring, I’d like to ask a few clarifying questions to better scope the case— What is the nature of the pill’s
impact—are we talking about life extension, cure, or something else?
It grants permanent immortality when taken consistently over a period.
Interesting. Is it a single dose or recurring? Is the pill safe and already approved, or is it in experimental phase.
Weekly intake for one full year—so 52 doses total and it’s been approved for release in the Indian market
Do we have exclusive rights or are competitors expected? And Lastly, are there any constraints on where it will be sold?
It’s a complete monopoly. Patented. No competitors. It’s going to be offered globally.
Perfect. I have enough to begin. I’ll structure this using three broad filters to arrive at the most rational pricing: cost-based feasibility,
perceived value, and strategic impact. I’ll also layer in societal constraints and risk variables.
Alright, go on.
Now, starting with the cost-based pricing, what is the variable cost per pill that we're spending? What is the fixed cost on R&D expenditure?
The manufacturing cost is $10 per pill. The R&D expenditure is $1 billion.
Over how many years are we planning to retrieve this R&D expenditure or the invested amount? Were there any other expenses?
We have to recover the cost over two years. There were additional costs of capital and manufacturing & machinery of around $10 billion
and $200 million, respectively.
C
ROUND
BUDDY
CASE TYPE
PRICING
INDUSTRY
HEALTHCARE
COMPANY
BCG
FREQUENCY
LOW
DIFFICULT 113
114.
I am encounteringan issue. Unless we know the number of pills or the population that we are sending it to, cost-based pricing is a little bit difficult.
Yes, I agree. But can you craft an equation out of this?
Yes. I am assuming $10 per pill to be the cost and considering the number of pills we’ll sell to be X. Therefore, (10X)*52 = the variable cost per pill. The fixed cost per
pill is $10 billion divided by X. Total cost = variable cost + fixed cost = 52.10X + (10,000,000,000/X).
Good. But pricing something like immortality based on cost seems… limited, don’t you think?
Cost tells us viability, not value. So I’d like to explore willingness-to-pay using value-based proxies. Now, I’ll begin with the value-based approach, but I need a
proxy for that. I am considering life insurance, which is the amount that you value your life at. Taking insurance of $1M premium with a cost of 15 per month, 15 x 12 x
50 (assuming you take the insurance for 50 years) =$9000 . Therefore, $9000 can be an estimated price of the pill that a person would be willing to pay.
Let’s challenge that. Do people actually value life rationally? And is insurance the right proxy?
Fair point. Rational proxies miss emotional behaviour. So I’d look at stress-price behaviour, particularly in crisis moments. Take COVID-19: during the early vaccine
shortage, the pries of vaccines rose to $200/ dose and an average adult needed 3 doses. This accounts to a total of $6000. similarly considering the black market,
the immunity boosters costed around $1000/ bottle and medicines were around 2000 (basic) and emergency pills were as high as 50,000. The oxygen cylinders (due
to acute shortage and demand) costed around 10,000. Consider the multiplier during stress to be 10x (adjusted of inflation), the pricing becomes
(10000+52000+6000+1000)*10x. So I believe value based pricing would give us more accurate price point
Let’s say a government decides to mass produce it illegally. What’s your contingency?
We’ll need IP controls. I’d recommend three protective levers:
1.Blockchain-based pill verification—each weekly dose is authenticated, so duplication fails
2.Geographic digital fencing—manufacturing relies on closed-loop smart robotics
3.A licensing model for governments: we price national access at $5B per country under diplomatic treaties
4.This prevents rogue access and keeps power aligned to those who pay—and negotiate
114
115.
This prevents rogueaccess and keeps power aligned to those who pay—and negotiate.
You’re thinking like a strategist. But pricing a premium pill is exclusive. Doesn’t that break global balance?
It absolutely could. Which is why I’d propose a hybrid three-tier strategy:
Tier 1: Ultra-Elite Access
Assuming 10,000 individuals in India in the ultra elite population
This buys time, funds global regulation, and avoids overpopulation shocks
Tier 2: Government Licensing
Offering sovereign rights to 20 governments for a set period of time to gain revenue from licensing
This grants nations ethical control over domestic distribution.
Tier 3: Time-Delayed Global Rollout
After a decade of governance, open controlled access via lotteries or public health programs can also be incorporated.
his balances exclusivity, ethical inclusion, and future scalability.
Couldn’t the company just sell to three billionaires for $10B each and be done?
Yes, but that approach weaponizes the product. The backlash could include national bans, cyberattacks, or global war. Immortality is power. Power concentration of
that scale has historically triggered revolutions.
The blended model creates a diffusion of access—containing destabilization while still generating trillions in long-term value.
That’s a strong insight. We can close the case.
115
116.
PRELIMINARY QUESTIONS
BROWNIE POINTS
CostBased Income Based
Competitor Based Value Based
Cost Based Value Based
Lifetax
FIXED COSTS
R&D Costs - $1B
Capital Investment- $10B
Machinery - 200 M=.2B
Total Fixed Cost(adding all)- $11.2B
VARIABLE COSTS
Manufacturing Cost per Pill- $10
Manufacturing Cost per Pill- 52*$10=$520M=$.5B
Total Variable cost- $0.52X B
Number of Pills sold- X
Cost per pill = (Manufacturing cost + Fixed cost)/X
= $0.52B+ (11.2 B /X)
Cost of $1M Premium insurance = $15/
month
Assuming that the average insurance life is
for 50 years,
Total cost=
15* 50* 12 = $9000
$9000 is this the cost people will be willing
to pay
1.What are the costs of manufacturing
and R&D?
2.How long does the company intend to
recover the R&D expenditure?
3.What is the target market size, and is
there any price sensitivity across
demographics?
4.Is there a regulatory framework for this
product, and are there risks of illegal
production or distribution?
1.Asked clarifying questions about the
product and approval status.
2. Proposed cost-based pricing using
fixed and variable costs.
3. Introduced value-based pricing using
proxies like insurance and healthcare
costs.
4. Challenged purely cost-based
valuation, citing emotional and market
proxies.
5. Suggested a hybrid tiered pricing
model balancing exclusivity and
accessibility. 116
Stress Based
Value Based
Three Tier Pricing
Urban Elite Time Delayed Global
Govt Licensing
10,000 People 20 Government
Benchmarking it with covid 19 pandemic
and then using the multiplier (adjusted of
inflation)
Oxygen cylinders=$100
medicines= $20 (basic like paracetamol) and
$500 (emergency like remdesivir)
Vaccines= $2/dose*3 doses= $60
Immunity booster= $10/bottle
Multiplier=10x
Pricing= (100+520+60+10)*10
= $6900
Unconventional cases aretypically open-ended, ambiguous, and don’t align with standard business frameworks like profitability or market entry. These cases require a balance
of structured problem-solving, creativity, and adaptability. Example: “You are required to improve the literacy rate of your state.”
There’s no single correct answer—what matters is how clearly and logically you approach the problem. Such cases can not be approached via the structured frameworks and
dont have a single straight forward solution
WHAT MAKES THESE CASES DIFFERENT?
Lack of defined metrics or goals- the goals or objectives are not specificed usually by the interviewer. Hence, the interviewers try and test how varied can an individual
think and if he/she can come up with the right set of questions to narrow down the problem statement.
No fixed path or “correct” framework- There is always an attempt to test ‘Thinking out of the box’ and test logic rather than mechanically following a defined framework
Broader social or conceptual themes (e.g., education, sustainability, policy change)
PRELIMINARY QUESTIONS TO ASK
Before building your structure, reduce ambiguity by asking 2–3 high-level questions to clarify scope and constraints:
What is the specific end objective? (e.g., “Improve literacy by how much, and within what timeline?”)
Is there a target segment or geography? (e.g., children, adults, tribal areas, rural vs. urban?)
Are there any resource constraints? (e.g., budget, political restrictions, time, availability of teachers or infrastructure)
Has anything been done already? (e.g., existing programs, partnerships, public initiatives?)
How will success be measured? (e.g., literacy rate increase, enrollment numbers, exam scores?)
These questions will help define the scope and guide your structure in the right direction.
THINGS TO KEEP IN MIND
Frame the problem as a simple mathematical formula where ever possible (e.g., Literacy Rate = Literate Population / Total Population)- your ability to deal with numbers
always gives you points and then use the qualitative approach to explore the problem further.
If the case is too broad, ask to narrow it down to the most relevant area or “bucket”. Bucketing (grouping related themes) is critical. Organize your structure under clear
categories like infrastructure, access, policy, and awareness and try to make these buckets as MECE as possible.
Don’t begin until you’re confident about the context and objective- ambiguity can derail your case
118
119.
PROCESS
Pre Post
Stakeholder
Resource Availability
Planning&
Documentation
Training &
Communication
During
Step by Step
Mapping/ Process
Flow
Time & Cost Analysis
Quality Control
Bottlenecks
Output Quality
Feedback Loop
Error Resolution
Data tracking &
Improvement
Abstract Case Framework
For high-level or conceptual problems (e.g., improving quality of life, increasing public awareness)
Process-related Framework
Best for operational or step-wise problems (e.g., redesigning a government workflow or education delivery)
ASK THE 5 W’S
Where What By Whom When Why
119
120.
RESOURCE - CONSTRAINT
Identifyresource
types
Measure current
capacity
RESOURCE
EVALUATION
OPERATIONAL
FEASIBILITY
Inventory
turnover target
LEVERAGE
Gross margin
comparsion
ALLOCATION
MAPPING
Compare with
demand
Spot gaps
Set decisions
criterias
Rank by impact
Drop low
Priorities &
Impact
Reallocate &
Outsource
Adapt to changes
Set KPIs &
Monitor
Automate & cut
costs
Resource Constraint Framework
Ideal when dealing with limitations in funding, manpower, or time
120
121.
POLICY/ GOVERNANCE
Short/Long
Term Goals
Isit about
inclusion, access,
economic
growth, etc.
OBJECTIVE PROCESS IMPROVE
INPUTS
Delivery
Channels
Feedback Loop
Awareness/
Communication
Coordination
between
departments
Operational,
Social &
Structural
Problems
Suggest policy
tweaks
Stakeholders
(Gov., Public, NGOs)
Resources (Budget,
Infrastructure, Manpower
Legal & Institutional Set
Up
Policy/Governance Framework
Suited for cases involving regulations, stakeholder alignment, or government intervention
121
122.
We have apublic sector bank as our client. They wish to digitize their loan sanctioning process. How would you approach this?
Thank you for the case, before jumping into solutions, I’d like to ask a few clarifying questions to better understand the situation and the bank’s
objectives. Is that okay?
Yes, go ahead.
What’s driving the need for digitization here? Is it primarily about improving efficiency, reducing costs, expanding outreach or are there multiple
priorities at play?
Efficiency is the main goal. The current process is very manual and leads to long turnaround times. But yes, increasing accessibility,
especially in rural areas, is also important. And naturally, they need to comply with regulations.
Got it. And to understand the operational side, is the loan process fairly standardised across branches, or are there local variations that
complicate things?
There’s a standard framework, but a lot of branches introduce their own extra steps, which leads to inconsistency.
That makes sense. Could you give me a quick overview of how the current process works?
Sure. Customers submit physical documents, bank staff manually verify them, then forward them to a central team for approval. If
approved, funds are disbursed manually, and repayment schedules are discussed in person and tracked manually as well.
Understood. It sounds quite labor-intensive and leaves room for delays. Is the goal to fully automate this process right away, or are they
considering a phased approach?
A phased approach. They want to automate document verification, risk assessment, and loan tracking first, but keep human oversight
for approvals.
ROUND
BUDDY
CASE TYPE
UNCONVENTIONAL
INDUSTRY
FINANCE
COMPANY
BCG
FREQUENCY
HIGH
EASY 122
123.
That’s a sensiblepath. Are there any particular budget or timeline constraints I should be aware of?
Moderate budget. They’re aiming for an initial rollout in the next 12–18 months.
Alright, given this is a process digitization challenge, I’d start by mapping the end-to-end loan sanctioning journey to identify key bottlenecks and opportunities for digital
interventions.
I’d break the process into four broad stages: i) Customer onboarding ii) Document processing and verification iii) Approval and fund disbursement iv) Repayment
and monitoring.
Would you like me to prioritize any particular stage first?
Let’s begin with document processing. That’s where most delays happen.
Perfect. I’d approach this in three parts: i) document collection, ii) verification, and iii) digitizing the workflow itself.
Okay, take me through all three at a high level.
Sure.
For document collection, I’d replace paper applications with digital forms through a portal or mobile app. Integrating Aadhaar-based e-KYC can instantly reduce
paperwork and verify identities.
In verification, we could use OCR and NLP tools to extract data from bank statements, tax returns, etc., automatically populating application fields. Then layer a risk engine
to flag inconsistencies — for example, if declared income doesn’t match submitted proof.
Lastly, for workflow digitization, I’d suggest a centralized dashboard for loan officers to track the real-time status of each application. Introducing automated service-level
agreements (SLAs) would help too — for instance, if a file isn’t processed in 24 hours, it sends a reminder or escalation.
Interesting. What risks do you see with this plan?
A few risks I’m able to foresee with this plan are-
Employee resistance — staff might see automation as a threat. Early communication and training would be important, repositioning their roles towards exception
handling and relationship building.
Data security — moving sensitive data online adds risks. Encryption, secure cloud storage, and maybe blockchain for audit trails would help.
Legacy systems — integrating new tools with existing core banking software could be tricky. Middleware and APIs could act as connectors, minimizing disruption. 123
124.
Good points. Ifyou had to prioritize, what would you implement first?
I’d recommend a phased rollout starting with quick wins:
Phase 1 (Quick Wins) : Digital forms and e-KYC — low effort, high impact, could be live within 3 months.
Phase 2 (Mid-Term) : Introduce OCR and automated verification — medium complexity, achievable in 6 months.
Phase 3 (Long-Term) : AI-based risk models — more advanced, valuable in reducing defaults, with a 12-month horizon.
This way, the bank can show early results, build confidence, and gradually manage change across the system.
Great work, let’s end the case here.
124
125.
PRELIMINARY QUESTIONS
BROWNIE POINTS
CLASSIFICATIONOF OBJECTIVES
EFFICIENCY ACCESSIBILITY COMPLIANCE INSURANCE
Understanding current process
Sanctioning Value Chain
Onboarding Processing Approval Monitoring
Document
Collection
Verification Workflow
Digitification
Employee
Resistance
Data Security Legacy System
Quick Win Min Term Long Term
1.What key challenges does the PSU face in
loan sanctioning?
2.Is the focus on efficiency, cost reduction,
accessibility—or all three?
3.What are the major steps in the current loan
process?
4.Are these steps standardized or branch-
specific?
5.Is the bank seeking full automation or partial
digital enhancement?
6.Are there any budget or timeline constraints?
1.Asked targeted questions to understand
challenges, process, and constraints.
2.Mapped loan process to identify pain points.
3.Aligned with bank’s preference for gradual
automation.
4.Suggested OCR/NLP, e-KYC, AI risk
models—kept human checks.
5.Flagged resistance, legacy systems,
cybersecurity—offered solutions (upskilling,
APIs).
6.Phased rollout: digital forms + e-KYC (3
months), AI (12 months).
7.Highlighted ROI: 50% faster onboarding,
70% fewer manual checks.
8.Covered rural access (mobile) and
compliance (blockchain audits).
125
126.
A leading grocerychain in Europe has observed a surge in customer complaints and a decline in footfall at its urban
locations. The company seeks your help to identify the root causes of this trend and develop a strategic response
Understood. Has this been linked to any external factors—like increased competition, pricing changes or an economic slowdown?
No, nothing major externally.
Got it. When did this start? And is it happening across all locations or just a few?
It started about six months ago and it’s only affecting urban stores.
That’s helpful. Since there’s no major external disruption, I’d look at three areas—what’s going wrong operationally, how customer behaviour might be
changing, and whether there are broader trends at play. Shall we start with operations?
Yes, let’s do that.
I’d begin with the complaints. Are customers mainly upset about product availability? Checkout times? Cleanliness? Or service quality?
Most complaints are about product unavailability. But the supply chain team says there have been no disruptions.
Interesting. That points to a store-level problem—either poor stock handling or shrinkage. Have you checked shrinkage rates in these stores?
Yes, there’s been a big increase in shrinkage at urban locations.
That could be due to theft, either internal or external, or just poor tracking. I’d want to understand if employee turnover has gone up or if there are security
blind spots. Any insights from in-store footage?
CCTV shows a sharp rise in self-checkout theft.
ROUND
PARTNER
CASE TYPE
UNCONVENTIONAL
INDUSTRY
RETAIL
COMPANY
KEARNEY
FREQUENCY
HIGH
MODERATE 126
127.
That’s becoming acommon issue. I'd recommend two things:
Technology upgrades – Use AI-driven cameras, barcode verification, and weight sensors to spot discrepancies.
Behavioural nudges – Place staff near kiosks, do random receipt checks, and offer small rewards for honest self-checkout use.
Is management open to making changes, or is self-checkout a fixed part of the model?
They don’t want to remove it but are open to tech and behavioural solutions.
Then there's definitely scope to reduce losses without hurting customer convenience.
Let’s move on. What else could be driving the drop in footfall?
I’d look at whether people are shifting to faster or more convenient options—like grocery delivery apps or discount chains. Also, has there been any recent bad press or
online backlash? And are customers seeing better value elsewhere?
Surveys say people mention “better alternatives” but don’t say exactly where they’re going.
Then it’s worth benchmarking what nearby competitors are offering. Are discount stores pulling people in? Are delivery services cutting into foot traffic? Once that’s clear,
the chain can decide whether to tweak pricing, improve product mix, or double down on in-store experience.
Makes sense. Can you wrap this up?
Sure. My recommendation is:
1.Curbing self-checkout theft – Deploy AI-powered monitoring, increase employee presence, and use subtle deterrents.
2.Enhancing store experience – Improve inventory tracking, reduce out-of-stock instances, and audit store-level replenishment.
3.Understanding competitive shifts – Conduct detailed market intelligence to determine where customers are migrating and adjust pricing, assortment, or convenience
factors accordingly.
Excellent summary. Well-structured and thoughtful. We can end it here.
127
128.
PRELIMINARY QUESTIONS
BROWNIE POINTS
GROCERYCASE
INTERNAL
MARKETING
EXTERNAL
Store Cleanliness and
Experience
Stock
Availability
Checkout
Experience
Internal
Theft
Supply Chain
Functioning
Supply Chain
issues
Staffing
Issues
Inventory
Management
Shrinkage
Operational
Inefficiencies
Shoplifting
ACCESIBILITY
CUSTOMER
PERCEPTION
OPERATIONAL
FACTORS
Increased
Competition
Pricing Changes
Economic Down
Turns
Store level
issues
1.Are the issues concentrated in certain
cities or types of urban stores?
2.What specific complaints are being
logged most frequently by customers?
3.Is shrinkage affecting certain product
categories more than others?
4.Have there been any changes to staffing
or store layouts in recent months?
5.Are customers switching to online
platforms, and do we have data on that?
1.Recognizing that supply chain stability
doesn’t guarantee in-store availability.
2.Highlighting self-checkout theft as a
growing industry challenge and suggesting
technology-driven deterrents.
3.Understanding the impact of changing
customer convenience preferences.
4.Providing balanced recommendations that
consider feasibility, risks, and customer
experience.
5.What are the key levers to improve store
experience while balancing operational
costs? 128
129.
India has neverreally been a strong basketball nation internationally. But now FIBA has given us a wildcard entry to the 2028
Olympics. The Ministry of Youth Affairs want a full-fledged plan to make the team competitive. How would you go about it?
That’s honestly such an exciting challenge. I’d break it down into a few big buckets—like scouting the right talent, setting up quality training, upgrading
infrastructure, giving players enough international exposure, and then making sure there’s strong financial and institutional support. But the most
logical starting point would be talent. Without the right players, nothing else really moves. Would it be okay if I begin with that?
Go ahead. India doesn’t really have a basketball pipeline like the U.S. or Europe. How do you plan to find these players?
Yeah, that’s a big gap. I’d look at three kinds of talent pools.
1.Domestic leagues—so the INBL, UBA, college tournaments, even state-level competitions. There’s raw talent there that’s often under-coached.
2.I’d actively scout Indian-origin players abroad—NCAA athletes, maybe someone playing in Europe or even the G-League.
3.This might sound ambitious, but I’d try identifying multi-sport athletes—those with the physicality and coachability, and then fast-track their
transition to basketball.
We’d back this with data—look at shooting %, defensive stats, efficiency ratings & rely on on-ground scouting. It has to be both numbers & instincts.
Fair enough. Let’s say you’ve got your core squad. What next?
Once we have the team, the training has to be super intentional. I’d divide it into three phases.
First phase would be a domestic boot camp for basic skills say in Bengaluru, which already has a decent basketball culture.
Then comes international exposure. I'd want the team playing in smaller European leagues or second-division circuits—maybe even scrimmaging
with G-League reserve teams.
Finally, in the year leading up to the Olympics, we go into simulation mode—friendlies against top 20 teams, replicating Olympic conditions, and
tightening systems.
Sounds intense. Now, training needs facilities. Would you build from scratch or work with what’s available?
Time and money are both limited, so I’d say optimize. We can definitely upgrade existing facilities—like the ones in Bengaluru or Delhi. Just adding
analytics cameras, motion tracking, and better recovery equipment can do wonders.
I also think we can get creative—like a mobile training unit that goes city to city to conduct high-performance camps. And maybe we experiment with
virtual coaching tools too—AI-led form corrections, remote feedback. A full-blown academy is the dream, but that’s a post-2028 project.
ROUND
MANAGER
CASE TYPE
UNCONVENTIONAL
INDUSTRY
SPORTS
COMPANY
PRAXIS
FREQUENCY
MEDIUM
MODERATE
129
130.
Makes sense. Butthere are risks. What could go wrong?
Definitely a few big ones. First, player retention. Some of the best athletes might just drop out for better-paying opportunities. We’ll need to make the program
attractive—good salaries, brand endorsements, and clear post-career support.
Second, injuries. The training load will be high, especially for athletes not used to such intensity. So recovery protocols, physiotherapy, load management—all of
that becomes non-negotiable.
And finally, public interest. Basketball’s still a niche in India. But we can build buzz—collaborate with sports influencers, push cool behind-the-scenes content,
maybe even a docuseries. That could help bring in sponsors too.
This was quite a comprehensive take. If you had to summarise the entire plan in a few lines, how would you do it?
Sure. We start by finding the best possible talent—both from India and the global Indian diaspora. Then we train them across three phases—domestic development,
overseas exposure, and pre-Olympic fine-tuning. Instead of building everything new, we upgrade what we already have. We secure international exposure by
joining leagues, organizing friendlies, and building global partnerships. And we back it all with strategic funding, brand-building, and long-term vision.
If we execute this right, we won’t just show up at the 2028 Olympics—we’ll compete.
Fantastic. Really well done!
130
131.
PRELIMINARY QUESTIONS
BROWNIE POINTS
GOAL:MAKE BASKETBALL TEAM
COMPETITIVE FOR 2028 OLYMPICS
Scouting the right
talent
Quality Training Infrastructure Intentional Exposure
Financial & Institution of
Support
Domestic Leagues
Indian origin players in
abroad
Multi Sport Athletes
Upgrade the existing
ones
Mobile Training Unit
Domestic Bootcamp
Intern Exposure
Simulation Mode Virtual Coaching
Tools
PHASE 1
PHASE 2
PHASE 3
Partnership with
international organisations
Host a mini tournament for
international players in India
as well
1.What is the specific goal for the 2028
Olympics—qualification, medals, or
simply strong representation?
2.What are the key strengths and
weaknesses of the current talent pool
(age, skill level, geographic spread)?
3.How does basketball’s popularity and
infrastructure in India compare to
global competitors?
4.What is the budget allocated by relevant
sports authorities, and how flexible is it?
1.Highlighting the importance of
grassroots programs for building a
pipeline of talent over the years.
2.Proposing a tailored training program
accounting for player strengths (e.g.,
agility, shooting, stamina) specific to
the Indian talent pool.
3.Suggesting collaboration with
international coaches and mentors to
bridge the skills gap effectively.
4.Breaking down preparation into short-
term (qualification) and long-term
(sustained excellence) goals.
5.Considering marketing and popularity-
building initiatives to boost national
support and funding for the program.
131
132.
A Middle Easterncountry is planning to build a brand-new city& position it as a global tech & innovation hub- basically
their version of Silicon Valley. How you’d approach this, starting with- how would you ensure the city is financially
sustainable?
Before we dive in, may I ask- is this city going to be entirely government-funded in its early phases, or are private investors already involved?
It’s primarily government-led for now, but private investment will play a larger role as the project progresses.
Got it, thank you. And is there a specific timeline we should keep in mind here? is this more of a 5–10 year goal or something designed to unfold
over a few decades?
Think long-term. They want to start strong, but this is definitely a 20–30 year vision.
Understood. In that case, for long-term financial sustainability, I’d look at two things: what it costs to run the city, and how we make sure it
generates enough revenue to cover those costs. Since we’re building from scratch, it’s important to design both sides with intention.
Makes sense. Let’s talk about expenses first. What kind of outflows are we looking at?
I’d divide the expenses into a few major buckets, just to keep things structured:
People-Related Services: Things like healthcare, education, public safety, and the consistent supply of water and electricity. These are
essential for any functioning city and especially critical if we want to attract skilled global talent.
Infrastructure and Urban Development: That includes building roads, public transportation systems, utilities, and digital infrastructure. We’d
also need to think about urban housing, offices, and even recreational spaces to support quality of life.
Administrative and Operational Costs: This would cover everything from government salaries and digital governance systems to maintaining
public services and policy enforcement.
Got it. Now, where’s the money coming from?
We’d need a diversified revenue model. The city can’t just depend on one-or-two income streams.
Traditional taxation would be the first lever with income tax, corporate tax, and property tax as the sources. But for a city like this, which is being
built with a very forward-looking vision, I think there’s an opportunity to get creative.
ROUND
PARTNER
CASE TYPE
UNCONVENTIONAL
INDUSTRY
FINANCE
COMPANY
MCKINSEY & CO
FREQUENCY
LOW
MODERATE 132
133.
I like thatyou brought in geography as a strategic asset. So we’ve established the city can sustain itself financially. Now how would you even begin
building something that could compete with the likes of Silicon Valley?
It’s a huge ambition, but with the right sequencing and intentional design, it’s possible. First, you attract companies and talent. Second, you make sure they want to stay
and grow there.
Let’s focus on the first one. How would you bring in companies and people to what is essentially an empty space right now?
You need to make the city a magnetic and that means both infrastructure and incentives. Here's how I'd approach it:
1. Build Essential Infrastructure First: I'd actually suggest that government institutions be among the first to move in. If you can establish strong public institutions
and essential services early, it makes it easier for the private sector to follow. Then come co-working spaces, incubators, and residential areas.
2. Offer Strategic Incentives: Tax breaks for companies that invest in R&D, for example, subsidized office space, fast-track licenses for startups. Things that reduce
friction and make companies say, “Hey, this is worth exploring.”
3. Non-Monetary Benefits: Access to university partnerships, a thriving research environment, or exclusive government contracts. These can sometimes be more
valuable than direct funding.
4.Global Talent Strategy: Relax visa requirements for tech workers, offer relocation support, and build an international school system so families can move with
ease. Innovation follows talent.
And once you’ve got companies in, how do you keep the momentum going?
That’s where we shift gears from attraction to endurance. I’d focus on two areas- funding and regulation.
Like land leasing, since the government would likely own large tracts of land in a new city, leasing land to corporations or international universities could generate
recurring revenue. There’s also the strategic geographic angle.
Many Middle Eastern countries sit at the crossroads of global trade. That location can be monetized by positioning the city as a logistics and aviation hub, charging for
transit, freight movement, and air traffic. Eastern countries have strategic geographic advantages. That brings in revenue through trade, customs duties, and airport-
related services.
133
134.
Second, smart regulatorysafeguards. For example:
Restricting foreign ownership above a certain threshold—maybe 49%—in critical innovation sectors, to prevent early sellouts of high-potential companies.
Structuring deals around joint ventures rather than full acquisitions, especially in the early years, so that local players retain control and learn from
international partners.
Implementing policies that prioritize local hiring and IP development.
You’re covering both the carrot and the stick here, which is smart. One last question: if you were briefing the country’s leadership tomorrow, how
would you summarize your plan?
I’d keep it simple and visionary. I’d say: We’re not just building a city, we’re building a platform for innovation that’s rooted in the region’s strengths. We’ve ensured
financial sustainability through diversified and future-facing revenue streams. We’ve laid down the infrastructure and created incentives that make it
attractive for top global talent and tech firms to call this place home. And we’ve built in long-term guardrails through strategic funding and regulation, to
ensure that what we’re building lasts. We’re not copying Silicon Valley, we’re building something better: a new model for innovation rooted in resilience, vision,
and regional leadership.
Thanks, that wraps up the case.
First, a strong funding ecosystem. That could mean:
- Creating a sovereign innovation fund which would be government-backed but independently managed to provide early-stage funding to promising startups.
- Partnering with global VCs and offering co-investment opportunities to encourage them to set up regional offices in the city.
- Encouraging corporate venture arms from big tech firms to invest locally.
134
135.
PRELIMINARY QUESTIONS
BROWNIE POINTS
GOAL:BUILD A FINANCIALLY SUSTAINABLE
TECH CITY
Revenue (Taxes
Land leasing
Logistics)
Expenses
Attract companies and talent Retain and grow ecosystems
Build essential
infrastructure
Strategic incentive Non-monetary benefits Global Talent Strategy Funding ecosystem Regulatory
safeguards
Government
Infrastructure
Incubators
Housing
R&D Tax Breaks
Fast Track License
Research Partnerships
Exclusive Contracts
Visa Revaluation
International Schools
Corporate VCs
Co-investment
VCs
Ownership
Caps
Joint Venture
Structure
Local Hiring
People Services
Administration
Infrastructure
1.Is the city being primarily
funded by the government,
or are there private
investors?
2.is this a 5–10 year plan or a
longer-term vision?
3.Do we know where this city
is being built — is it near the
coast, in a desert, or near
existing urban areas?
1. structured thinking, creative
revenue ideas like land leasing,
and a phased approach to
growth.
2.Balancing incentives with
smart regulation showed
foresight
3.The final summary positioned
the city as a bold, original
innovation hub—not just a
Silicon Valley replica.
135
136.
There are twoadjacent coffee shops selling the exact same artisanal coffee. Yet, one charges ₹300 and the other ₹600.
Assuming no locational or operational advantages, how would you explain this price difference?
Interesting. Just to clarify a few things before diving in—can you describe the coffee shops a bit? Are they both standard cafés or do they follow a
more third-wave, artisanal coffee experience?
They both sell artisanal coffee.
Got it. Are they located in similar environments I.e. same foot traffic, visibility, accessibility?
Yes, they’re right next to each other and have been around for the same time.
Okay, helpful. Do they target different customer segments or have a different brand positioning?
No major difference. You can also ignore broader town demographics for this.
Alright. Do they differ in food offerings, portion sizes, or special add-ons like customisation or blends?
No, you can assume the food offerings and coffee menu are the same.
Okay, so at face value, the product and positioning seem identical. In that case, I’d like to explore this using what I call the “4E Framework”:
Essence, Experience, Ease, and Equity—each uncovering a different type of perceived value that might justify a price premium.
Sounds good--go ahead
Starting with Essence, which covers the product and its core appeal—taste, quality, and whether it satisfies a specific customer want. Since you
mentioned the product is the same, there's no clear differential here.
Next is Experience, which I’d break down into external constraints and innate customer experiences—both of which influence how the
customer interacts with the brand beyond the product itself.
ROUND
PARTNER
CASE TYPE
UNCONVENTIONAL
INDUSTRY
RETAIL
COMPANY
KEARNEY
FREQUENCY
LOW
DIFFICULT 136
137.
Let’s dig deeperinto experience.
Sure. I’d first separate experience into physical and intangible factors. Physical includes tangible aspects like the size of the café, seating arrangement, waiting
time, charging stations, and availability of restrooms.
Then we have intangible experience, where I’d apply the Five Senses Framework—a way to understand how ambiance can shape perceived value. For example:
Sight: The ₹600 café may have better lighting, premium decor, and an overall Instagram-worthy vibe.
Smell: It might smell more inviting due to freshly brewed beans, better ventilation, or even the absence of oil smells from nearby food stalls.
Hearing: One café might play relaxing jazz, while the other has loud pop music, not ideal for business meetings or reading.
Touch: Comfier seats, plush couches, warmer indoor temperature—all contribute to comfort.
Taste can be excluded here since the coffee is the same.
Interesting. What else?
Now under Ease, I’d consider friction points in the customer journey—for instance:
One café might offer seamless digital payments (UPI, credit card), while the other insists on cash.
Maybe one uses digital QR-code menus while the other sticks to printed ones—this could either be a plus or a minus depending on customer preferences.
Charging ports at tables, quicker order processing, or better queue management could all contribute to a smoother experience.
Very thorough. What’s the last “E”?
Equity, or brand perception. This is where irrational pricing becomes rational—because price becomes a proxy for brand identity. Even if the product is the
same, if the ₹600 café is associated with influencers, exclusive events, or premium aesthetics, people perceive it as aspirational. Think of it like Starbucks vs. your
local third-wave café—they may source beans from the same roaster, but the price reflects the story, not just the coffee.
Fair point. That was an excellent breakdown. No further questions.
137
138.
PRELIMINARY QUESTIONS
BROWNIE POINTS
4-EFRAMEWORK
ESSENCE EQUITY
EASE
EXPERIENCE
Product of Core Appeal i.e
taste, quality, want satisfaction
SAME
Can’t be the reason
BRAND
PERCEPTION
FRICTION
POINTS
Queue management,
Seamless payments etc.
TANGIBLE
FACTORS
INTANGIBLE
FACTORS
Seating,
waiting time,
charging
station,
restrooms
Sight
Hearing
Touch
Smell
Taste
Five sense’s
Framework
1.standard cafés or do they follow a
more third-wave, artisanal coffee
experience?
2.located in similar environments—
same foot traffic, visibility,
accessibility?
3.target different customer segments or
have a different brand positioning?
4.differ in food offerings, portion sizes,
or special add-ons like customisation
or blends?
1.Identifying the Right frameworks
to be used
2.Elaborating the customer
experience using the senses
approach
138
139.
ABC Oil &Gas has commenced operations for extracting oil and gas from satellite fields in Rajasthan. Evaluate the various
power generation sources available for the extraction process considering suitable factors.
I'd like to understand the problem statement better. ABC Oil & Gas needs to determine optimal power generation sources for their extraction
operations in Rajasthan. Let me clarify some key details.
Go ahead.
What's the scale of ABC's operations in Rajasthan? How many satellite fields and what's their daily extraction volume?
They operate 5 satellite fields with 1,000 barrels of oil equivalent (BOE) per day per field. Each field operates for approximately 75 days
before evacuation.
What are the power requirements for extraction operations?
Each satellite field requires approximately 2 MW of continuous power.
Are there any existing power infrastructure or grid connections near these fields?
No, these are remote locations without grid connectivity. Any power solution needs to be self-contained.
What's the geographical terrain and climate like in these areas?
Mostly desert with high solar radiation (5-6 kWh/m²/day), moderate wind speeds (5-7 m/s), and temperatures ranging from 5°C in
winter to 50°C in summer. Water resources are scarce.
I'll structure my approach by evaluating conventional and renewable power sources:
1.Conventional (diesel generators, natural gas generators)
2.Renewable (solar, wind, hybrid systems)
For each, I'll analyze CAPEX, OPEX, reliability, mobility, environmental impact, and implementation timeline.
Let me start with diesel generators. What's the approximate cost of diesel generators for 2 MW per field?
ROUND
BUDDY
CASE TYPE
UNCONVENTIONAL
INDUSTRY
OIL & GAS
COMPANY
MCKINSEY & CO
FREQUENCY
MEDIUM
DIFFICULT 139
140.
Sounds good, A2 MW diesel generator setup would cost approximately ₹1.5 crore ($200,000) per field.
What's the current price of diesel in Rajasthan?
Diesel costs approximately ₹90/liter for industrial use.
Let me calculate the OPEX:
2 MW diesel generator consumes about 500 liters/hour
Operating 24 hours/day = 12,000 liters/day
At ₹90/liter, daily cost = ₹10.8 lakh/day
For 75 days = ₹8.1 crore per field
With 10% maintenance costs = ₹8.91 crore total OPEX
For natural gas generators, could they use their own produced gas for power?
Yes, approximately 15% of their gas production could be allocated to power generation. Each field produces about 0.5 million cubic feet of gas per
day.
A 2 MW gas generator costs about ₹1.8 crore per field but would consume 480,000 cubic feet/day, exceeding their 15% allocation (75,000 cubic feet/day). They
would need additional gas supply.
For solar power, what would be the CAPEX for a 2 MW solar installation?
A 2 MW solar installation costs approximately ₹9 crore ($1.2 million).
With 5-6 kWh/m²/day in Rajasthan:
2 MW × 5.5 hours/day = 11 MWh/day
But operations need 48 MWh/day
Battery storage for 37 MWh would cost?
About ₹18.5 crore ($2.5 million) per field. That's ₹27.5 crore total for solar + storage.
Let me analyze a hybrid solution:
1 MW solar (₹4.5 crore) + 1 MW diesel (₹75 lakh)
Solar: 5.5 MWh/day, Diesel: 42.5 MWh/day
140
141.
75-day diesel cost:₹4.05 crore + maintenance: ₹40.5 lakh
Total hybrid cost: ₹9.71 crore per field
For mobility between fields, are the diesel generators portable?
Diesel generators are fully portable. Solar systems can be moved at 20% of initial CAPEX per move. Wind systems cost 40% of CAPEX to relocate.
What about the implementation timeline?
Diesel generators: 1 week. Solar: 6-8 weeks. Hybrid: 7-9 weeks.
Based on this analysis, I recommend:
1.Short-term: Deploy diesel generators for immediate operations
2.Medium-term: Transition to hybrid solar-diesel solution for future fields
3.Additional recommendations:
Implement energy management system (5-8% additional savings)
Negotiate volume-based diesel contracts
Explore mobile solar solutions for oil field operations
This approach balances reliability, cost-effectiveness, and operational flexibility while providing a path toward reduced emissions and long-term savings.
Thanks, we can close the case here.
141
142.
PRELIMINARY QUESTIONS
BROWNIE POINTS
Conventional
1.Scaleof operations?
2.Power requirements?
3.Grid connectivity?
4.Geographic conditions?
1.Considering mobility between
fields
2.Analyzing implementation
timeline
3.Energy management system
inclusion
Hybrid
Renewable
CapEx: ₹9 Cr
Energy Generated:
11MWh/day
Battery Storage Cost:
₹18.5 Cr
Wind
Solar
Power Generation for Oil Extraction
Diesel Generator Natural Gas Generators
OpEx (CapEx +
Battery Cost):
₹27.5Cr
Low Operating Cost
6-8 Week Timeline
CapEx: ₹1.5 Cr
CapEx: ₹8.91
Cr/Field
Reliable, Portable
High Emissions
High Cost
1 Week Timeline
CapEx: ₹1.8 Cr
Not feasible
without
external gas
supply
Inadequate in
house gas
production
CapEx: ₹5.25 Cr
OpEx: ₹4.45 Cr
Moderate
Emission
Balanced Cost
7-9 Week
Timeline
142
143.
Let’s discuss whyolder wine tends to be more expensive than newer wine. How would you approach this question?
Thank you for the problem statement. I’d like to ask a few clarifying questions first. Are we speaking about consumer-facing retail prices, or are we
also considering auction markets and producer pricing when it comes to wine?
Let’s focus on consumer retail pricing—what someone might pay at a store, restaurant, or from a private seller.
Got it. And are we focusing on everyday wines or premium segments?
Primarily premium wines, where age makes a meaningful price difference.
I’d like to start with my analysis now. I’d approach the problem statement by breaking it down into demand-side factors, supply-side dynamics,
the economic implications of the time value of money and certain cultural and behavioural factors.
That sounds like a solid approach. Let’s begin with demand.
Absolutely. On the demand side, wine—especially older wine—is viewed as a luxury good. For affluent consumers, the age of wine is often
associated with refinement, prestige, and exclusivity, making them willing to pay a premium. There's also strong demand from the HORECA sector
—Hotels, Restaurants, and Catering—where older wines are not just products, but a part of the overall customer experience, often priced at a
substantial markup to reflect that added value.
That aligns with what we see in the market. How about on the supply side?
On the supply front, the quantity of a particular vintage is fixed once it has been bottled. Over time, this supply only shrinks—some bottles are
consumed, others may be damaged or lost—so older vintages become increasingly scarce. This scarcity naturally drives up price. Moreover, in the
case of renowned vineyards or exceptional harvest years, suppliers often enjoy strong pricing power due to the reputation and demand attached
to those labels.
Good. You also mentioned the time value of money. Could you elaborate on that?
ROUND
MANAGER
CASE TYPE
UNCONVENTIONAL
INDUSTRY
FOOD
COMPANY
FTI CONSULTING
FREQUENCY
HIGH
DIFFICULT 143
144.
Definitely. Holding ontoa bottle of wine for 10, 20, or even 30 years involves significant opportunity costs. Distributors, collectors, or wineries could have sold
that inventory earlier and reinvested the proceeds elsewhere. Instead, they choose to wait—often tying up capital and taking on risk. The eventual price of the
wine compensates for that wait. It reflects not only the lost revenue over the years, but also the rising cost of money, inflation, and the need to earn a return
over time.
That’s a good point. What about the cost of storing the wine over time?
That’s another important driver. Proper wine storage requires strict temperature and humidity control, as well as protection from light, vibration, and theft.
These are not negligible costs—especially over decades. Wine cellars or professional storage facilities charge premiums to ensure bottles remain in optimal
condition. The longer a wine is held, the more expensive it becomes to maintain. So, the final price reflects not just scarcity or demand, but also the real and
ongoing effort to preserve its quality.
Interesting. You also mentioned cultural and behavioural factors—how do they come into play?
Yes, wine isn’t just an economic good—it holds emotional and symbolic value. Older wines are often tied to specific years that carry personal or historical meaning
—weddings, anniversaries, or even landmark global events. For many, buying a vintage from a particular year is about nostalgia or legacy. On the behavioural side,
consumers are heavily influenced by scarcity bias—we tend to place more value on things that are rare. There's also a storytelling aspect: a bottle from a famous
château, aged to perfection, becomes not just a drink but an experience. That cultural resonance boosts willingness to pay far beyond the liquid in the bottle.
Interviewer: That’s a well-structured analysis. If you were to summarise, what are the core drivers behind the higher price of older wine?
Interviewee: Certainly. The key drivers are:
Demand Factors: Luxury perception, willingness to pay among high-income consumers, and consistent demand from HORECA businesses seeking to
elevate their offerings.
Supply Factors: Fixed and declining availability of older vintages, along with the pricing power of producers with strong reputations.
Time Value of Money: The cost of storing, insuring, and forgoing earlier revenue—all of which contribute to the premium associated with older wines.
Cultural and Behavioural Factors: Emotional attachment to specific vintage years, symbolic value for personal or historical milestones, scarcity bias driving
perceived exclusivity, and the storytelling appeal that transforms aged wine.
Excellent breakdown. Thank you for walking me through your thought process.
144
145.
PRELIMINARY QUESTIONS
BROWNIE POINTS
1.Shouldthe focus be purely
economic, or would you like
cultural and historical elements
factored in as well?
2.Are we discussing wine globally,
or focusing on a specific region
or market segment?
3.Is the objective to understand
consumer behaviour, pricing
strategy, or value chain
economics more deeply?
1.Structuring the answer across
demand, supply, and economic
rationale added clarity and depth
2.Citing the role of the HORECA
sector reflected real-world
commercial awareness
3.Bringing in the time value of
money showed strong business
acumen and financial
understanding
4.Highlighting both scarcity and
brand reputation as pricing
drivers demonstrated nuanced
thinking
OLDER WINE COSTS MORE
Consumer
Reatil Pricing
Auction
Pricing
Supply Demand
Shrinking
supply that
cannot be
replenished
fast
Scarcity
of vintage
wines
stored,
lost or
consumed
Storage
costs for
long times
Time
value of
money
Percieved as
luxury good
Prestige
and
exclusivity
Price
markup by
hospitality
sector
Emotional value Symbolic value
Weddings
Anniversaries
Global events
Historical Significance
Scarcity bias
Cultural Resonance
145
146.
You live ina hypothetical world. Can you brainstorm as many use cases as you can for an ATM. Additionally, don’t limit
yourself to the current financial use cases. Be as creative as possible.
Certainly. Just to clarify a few things before I begin—should I assume it to be limited to one specific region, or can I consider global applicability?
You can think globally. Just list as many use cases as you can.
Understood. I’d like to understand a little bit more about the level of technology in this world. Is this just a slightly smarter version of what we have
now, or are we talking about this world having futuristic tech in terms of super-fast internet, sensors and advanced usage of AI, or should I assume
it to be closer to today’s tech?
Let's go with pretty advanced tech. Think a step or two beyond what we have now.
Sure, are there any particular constraints I should keep in mind, such as infrastructure limitations or user base restrictions?
No constraints at all.
That’s helpful. And is there any particular end-user you’d like me to focus on—individuals, businesses, or governments?
You’re free to consider all types of users.
Understood. I’ll begin by classifying the use cases into two primary categories: financial and non-financial. Within the financial category, I’d
further divide use cases into transaction-related and non-transaction-related functions. To make the structure more precise, I’ll break down
transaction-related use cases into core banking, investment and insurance, and emerging digital payments. For the non-transaction-related
category, I’ll divide it into sunrise and sunset sectors, based on their growth trajectory and evolving relevance.
Under investment and insurance, users could invest in financial products like fixed deposits, recurring deposits, or SIPs in mutual funds directly
from the ATM interface. They could also compare, purchase, or renew micro-insurance products, life insurance, or health policies. These terminals
could provide policy recommendations tailored to the user’s financial profile using integrated AI modules.
ROUND
BUDDY
CASE TYPE
UNCONVENTIONAL
INDUSTRY
FINANCE
COMPANY
MCKINSEY & CO
FREQUENCY
LOW
DIFFICULT 146
147.
In the emergingdigital payments bucket, ATMs in this advanced tech world could double up as physical gateways for digital finance ecosystems. Think of features
like UPI QR code generation and scanning for instant peer-to-peer payments, smart NFC-based retail checkout, or crypto-asset transactions. These ATMs might
enable the buying and selling of cryptocurrencies, provide real-time exchange rate conversions, and, in select locations, function as blockchain validator nodes or
crypto mining pods powered by renewable energy sources.
1.Non- Transaction Related
Moving to non-transactional financial use cases, I’ll start with the sunrise sectors. In this space, ATMs could go far beyond banking. For instance, they could be used
for EV battery swapping or charging management—where a user could pay for, monitor, or reserve a battery swap from an integrated kiosk, or even initiate solar-
based charging sessions. In urban settings, ATMs might provide virtual tours of museums or tourist sites, acting as immersive cultural access points. They could serve as
interactive government portals, where citizens could access welfare schemes, view pension updates, or digitally verify documents through facial recognition and
biometric scans. Additionally, they could become hubs for financial literacy, offering AI-powered tutorials in regional languages or even gamified simulations of
saving and investing.
Meanwhile, under sunset sectors, which are gradually declining but still relevant in some regions, ATMs could support services like legacy DVD or book rentals in rural
areas, landline bill payments, and even serve as archives of coal or mineral rights data for public access. These kiosks might help communities transition by offering
digitized records of pension or provident fund claims or connect to human assistance via remote video calls for services that require a personal touch.
Sounds good. Could you break down non-financial use cases in a similar manner.
For non-financial uses, I’ll divide them into business-related and personal uses, with subcategories of ticketing and non-ticketing related use cases under business-
related.
Business related use cases:
1. Ticketing
For businesses, especially in high-traffic or travel-heavy areas, ATMs could serve as kiosks for ticketing—issuing train, bus, or airline tickets, metro card top-ups, or
event bookings for concerts and exhibitions. In tourist-heavy regions, they might facilitate local tourism ticketing or provide entry passes to museums and galleries.
147
148.
2. Non-Ticketing:
On thenon-ticketing side, ATMs could function as public digital authentication portals for accessing government services. They could collect feedback from citizens,
offer biometric verification, or help people book appointments for passports, taxation, or social welfare services. Businesses might also use ATMs as smart vending
stations—distributing SIM cards, PPE kits, or office supplies—particularly in locations with limited storefronts. Crowdsourced fundraising kiosks or public information
terminals could add another layer of civic engagement.
Do the same for personal use cases too.
Personal use cases could be further broken down into indoor/ home related use cases and outdoor/ community related use cases.
1. Indoor/ Home Related:
Indoors, they might be adapted as smart home control panels—allowing users to monitor energy usage, order groceries automatically through integrated inventory
systems, or print personal documents securely. In gated communities, they could work as digital notice boards or secure lockers for parcel collection with OTP-based
access.
2. Outdoor/ Community Related:
Outdoors, their utility expands further—they could function as phone charging spots or even clean water dispensers in low-resource areas. There’s also great potential in
healthcare and government outreach. Imagine telemedicine booths in rural zones equipped with diagnostic tools, video conferencing for doctor consultations, or even
basic medical screening. These could drastically improve access to care. Similarly, ATMs could act as access points to government helplines or public grievance systems.
This is quite comprehensive. Would you like to expand on any category?
I believe I’ve covered a fair range of both financial and non-financial areas. But I’d be happy to elaborate further on any category you’d like.
That won’t be necessary. This was well thought out. We can close the case here.
148
149.
PRELIMINARY QUESTIONS
BROWNIE POINTS
Financialuses
ATM USE CASES
Transactional Non- transactional
Core banking Investment Digital Payment Sunrise
sectors
Sunset
sectors
UPI
Crypto
NFC retail
checkout
Block chain
Cash withdrawal
and deposit
Domestic money
transfer
International
remittance
processing
Utility bills
Cheque book
deliveries
Top up cards
FDs, RDs
SIPs in
mutual
funds
Insurance
AI tailored
financial
profile
1.Level of technology in this world
2.Any particular constraints, such
as infrastructure limitations or
user base restrictions
3.End-user to focus on—
individuals, businesses, or
governments?
1.Clear classification into financial and
non-financial, then subdivided further
2.Linking applications to real-world sectors
like healthcare, renewable energy, and
government services
3.Thoughtful integration of both existing
and future-use cases (e.g. smart homes,
crypto, EVs)
4.Inclusion of sunrise and sunset industry
applications demonstrated
macroeconomic awareness
5.Asking high-quality clarifying questions
to scope the problem accurately
6.Maintaining a balance between creativity
and practical relevance
EV charging
Solar energy
credits
Interactive
government
portals for
financial
literacy
DVD rentals
Landline
bills
Data
archives
Records of
pensions or
PFs
149
150.
Non- financial uses
ATMUSE CASES
Business Uses Personal Uses
Ticketing
Non- ticketing Indoor
uses
Outdoor
uses
Trains or metros
Events
Smart home
control
panels
Digital notice
board for
communities
Secure
lockers
Phone charging
spots
Government ID
Biometric
Verification
Book
appointment
Vending station
Information
terminal
Clean water
dispensers
Telemedicine
Public grievance
systems
150
151.
Your client isa startup that has built an anti-tourism travel app. The idea is to help people avoid crowded tourist destinations
and instead discover hidden, lesser-known spots. While the app had strong initial funding & hype, user adoption &
engagement have been low. Your task is to help us figure out why?
Alright, before I dive in, I just want to clarify a couple of things. Who exactly is the app targeting right now? Are we going after adventure travelers,
digital nomads, maybe even locals looking for more authentic weekend escapes?
It’s mostly geared toward individual travelers- people who want to explore beyond the typical tourist checklist. That includes adventure
seekers and those actively looking to avoid crowds.
Got it, also, do we know what kind of adoption issues we’re seeing? Is it low download rates, or do people download and then stop using the app?
Most users do download the app, but they tend to disengage within a few days. We also ran some user surveys. The main feedback was
that people either don’t find enough unique recommendations or feel the suggested locations are far from where they are.
Okay, Based on what you've said, I’d like to explore the problem across three main areas- market fit and target audience, user experience, and
value proposition, and finally, marketing and awareness. I can start with market fit if that works?
Yes, let’s begin there. How would you assess whether we’re targeting the right users?
To assess market fit, I’d first want to look at whether the users we’re attracting are aligned with what the product is designed for. So I’d break it
down by understanding-
1.who these users are
2.what kind of travel personas they represent
3.whether their needs are being met by the app.
Second, I’d want to compare the app’s offering to existing alternatives like Google Maps, TripAdvisor, or even Reddit and niche travel blogs.
What’s the specific gap this app fills that others don’t? Finally, user feedback would be very important, both from survey data and app analytics
to see where drop-offs are happening and whether it’s about poor content, usability, or value. Do we have any data?
Yes, we do have survey and usage data, as I mentioned. Most people say the app doesn’t show enough unique or useful
recommendations, and some complain the places it suggests aren’t practical to visit.
ROUND
MANAGER
CASE TYPE
UNCONVENTIONAL
INDUSTRY
TOURISM
COMPANY
FTI CONSUTING
FREQUENCY
LOW
MODERATE
151
152.
Right, so thecore issue seems to be the recommendation engine. If people are leaving the app because the content doesn’t feel relevant or accessible, then
we’re not delivering on the main promise. It might not be a market fit issue as much as a value delivery one. Users expect hyper-local, meaningful suggestions. Right
now, either the recommendations are too obscure or just not aligned with what users want.
That’s a fair take. Let’s assume you’re right. How would you go about fixing the recommendation engine?
To improve it, I'd want to make sure we’re capturing user preferences in a meaningful way. Are we allowing users to set filters for accessibility, distance, or type of
experience? The current algorithm might be too generic or rigid.
Also, are we collecting enough real feedback from users on the quality of the suggestions? One option is to add features like tagging or letting users rate locations
as “worth it,” “hidden gem,” or “too hard to reach.” That way we start refining the pool of recommendations based on crowd insight filters.
Are you open to incorporating user-generated content or social elements?
Possibly, yes. But let’s say the company doesn’t have the budget right now for expensive AI integrations. What could we do on a tighter budget?
If budget is tight, I’d take a more community-driven approach. First, we could crowdsource hidden spots from locals and micro-influencers. This wouldn’t require
a large tech overhaul, just good outreach and curation. We could also gamify content contributions to give users points or badges for discovering and reviewing
lesser-known places. That builds both content and engagement. A city-based forum or recommendation thread could also work, where users post and vote on tips.
It’s lightweight, and it builds the kind of social proof and trust that Google or TripAdvisor can’t offer for niche spots.
Nicely structured. One final thing: what risks do you see in this approach?
A few, definitely. First is scaling content curation. If we rely on user contributions, quality control becomes a challenge. Not every “hidden gem” will be worth
visiting.
Second, it might be tough to get users to actively contribute they might just want to consume content, not build it.
Finally, we’ll be competing with apps people already use by default like Google Maps, so we need to differentiate clearly. One way to mitigate that is to position
ourselves not as a direct competitor but as a niche tool that offers a more intentional, off-the-beaten-path travel experience.
Excellent thinking! That wraps up the case.
152
153.
PRELIMINARY QUESTIONS
BROWNIE POINTS
Marketing& Awareness
Market Fit to
Target Audience
Locals
Adventure
Travellers
Budget
Conscious
Travellers
Map vs Google
Maps,
Tripadvisor
Location Too
Obscure or
Inaccessible
High Initial
Downloads but
Low Retention
No Practical
Locations
Feedback
User Personas
Mainpoints &
Alternatives
Anti Tourism App Adoption
User Experience
& Value Proposition
Organic
Growth
Targeted
Campaign
Influencer
Collab
Channel
Effectiveness
Positioning
Niche Appeal
No Personalised
Prefernce Based
Recommendations
Lack of
Testimonials,
Reviews for
Locations
Insights From
Locals
&
Microinfluencers
Missing
Bad Location
Curation
Features
Gamification
Promoting
Community
Building& Forums
Engagement
Mechanics
Recommendation
Engine
Content Quality
No Travel Agency
Partnership
1.Who exactly is the app targeting right
now? Are we going after adventure
travelers, digital nomads, maybe even
locals looking for more authentic
weekend escapes?
2.Do we know what kind of adoption
issues we’re seeing? Is it low download
rates, or do people download and then
stop using the app?
1.Structuring the analysis by breaking
it down into market fit, user
experience, and marketing.
2.Offering cost-effective alternatives
like crowdsourcing and
gamification.
3.Considering long-term
sustainability by addressing user
trust and community building.
4.Recommending risk mitigation
strategy
153
154.
You have beenallotted a government-owned plot of land in a market area similar to Kamla Nagar. Your task is to determine
the optimal use of the land.
Thank you. To start, I’d like to better understand the characteristics of the land. Could you tell me the approximate size and shape of the plot?
It’s a 1,000 square meter rectangular plot, located near a busy stretch of the market with consistently high footfall, especially during
weekends and holidays.
Got it. That’s a sizeable and strategically located plot. Could you clarify if there are any zoning laws or government-imposed restrictions that I
should be aware of?
There are no strict restrictions, but the government prefers that the project supports the commercial activity of the area and benefits
the broader public.
Understood. One more thing I’d like to clarify before diving in—do we know how the plot is being used currently, if at all?
It’s currently unused and partially encroached by a few informal vendors and illegal parking spots. There's no permanent structure on it.
That helps. Lastly, do we know the demographic profile of the area—who visits or shops here the most?
Predominantly college students, young professionals, and middle-income families. There are three colleges nearby, and a metro station
within walking distance.
That’s a helpful starting point. Here’s how I’d like to approach the case:
Framework: LAND as a Living Asset
I’d like to approach this case using a framework built around the word LAND where each letter stands for:
L – Local Demand & Demographics
A – Alternatives & Gaps
N – Net Value Proposition (Commercial + Social)
D – Design & Delivery Feasibility
ROUND
ASSOCIATE
CASE TYPE
UNCONVENTIONAL
INDUSTRY
LAND
COMPANY
MCKINSEY & CO
FREQUENCY
HIGH
MODERATE
154
155.
Sounds interesting. Let’shear your thoughts.
Starting with Local Demand & Demographics:
Given the high footfall, presence of students, and the mix of formal and informal retail, I’d want to conduct quick demand mapping—either through surveys or observing
user behavior.
But based on general trends in such markets, the pressing needs are often:
1.Parking – Most shoppers and vendors rely on two-wheelers and cars, but there’s no structured space.
2.Curated retail or food courts – Especially for students seeking clean, budget-friendly, air-conditioned spaces.
3.Public utility zones – Like toilets, rest areas, or green sitting spaces.
4.Waste management nodes – Kamla Nagar-like markets often struggle with visible waste accumulation.
What option would you prioritize based on this?
I’d lean toward a hybrid use—specifically a multi-level parking facility with a student-friendly food and retail court on the upper floor(s) because it solves congestion
(parking), supports the local economy through a food/ retail outlet and caters particularly to the footfall of students that come to Kamla Nagar.
Could you give me an estimate of the revenue that you’d be able to generate using this option.
Sure, Assuming that:
1 parking spot = 25 sq. m
1,000 sq. m plot - up to 40 cars at ground level
Add 1 more level = 80 total spaces
₹30/hour × 8 hours/day × 70% occupancy = ₹13,000/day →~₹4 lakh/month
For the upper floor:
10 stalls × ₹20,000/month = ₹2 lakh/month rental income
Add vendor commissions, food court margins - another ₹1 lakh/month potential
So, total revenue would be approximately ₹7 lakh/month. The CAPEX associated with the store basis my understanding would be anywhere between ₹1.5 to 2 crore. So,
we'd be able to Break-even within 3–4 years if occupancy is stable. 155
156.
Okay, good. Whatabout feasibility and risks associated?
Definitely. That brings me to the risk mitigation strategy that I’d like to follow here:
Operational: Minor clearing and leveling needed. Build in phases to minimize disruption.
Stakeholder alignment: Offer informal vendors subsidized stalls in the food court to reduce resistance.
Regulatory delays: Engage local municipal authorities early and consider a PPP model.
Tech: Use smart parking sensors and QR-based food ordering to modernize experience.
I’d also conduct a sensitivity analysis for revenue under different footfall and occupancy scenarios.
That’s a solid approach. Would you have done anything differently if starting over?
Yes, if I were to revisit the case, I would’ve initially asked a few more preliminary questions to determine whether there is any seasonality in footfall (festivals, admission
season, as that would impact our calculations for the break even point. Additionally, I would have also liked to know if there has been any past attempt at formal
development on the plot and why it didn’t work out.
These would help me rule out non-starters and propose a solution with higher stakeholder buy-in and fewer surprises during implementation.
Great, thank you. We can close the case here.
156
157.
PRELIMINARY QUESTIONS
BROWNIE POINTS
LAND
UnderstandingFootfall
Patterns
Identifying User
Segments (Students,
Professionals , Families)
Pinpoint Needs (Parking,
Food Courts, Hygiene)
L - LOCAL DEMAND
AND DEMOGRAPHICS
Options: Parking,
Food Court, Retail
Hub, Public Space
Identify Gaps in
Current
Infrastructure
A - ALTERNATIVES
AND GAPS
Revenue Estimation:
Parking:
80 slots x Rs 30/hr x 8
hrs/day x 70% =
Rs. 4 lakh/month
N - NET VALUE
PROPOSITION
Operational
(Phased Build)
Stakeholder
(Subsidised Stalls)
Regulatory
(Early Engagement)
Tech
(Smart Parking,
QR Order)
D - DESIGN AND
DELIVERY FEASIBILITY
Retail/Food:
10 Stalls x Rs. 20000/
month =
Rs. 2 lakh/month
Commission
Rs. 1 lakh/month
Total Revenue
Rs. 7 lakh/month
CAPEX
Rs. 1.5 - 2 Crore
Breakeven
3 - 4 Years
1.Creative Framework (LAND) with a
structured breakdown
2.Back-of-the-envelope numbers to
ground recommendations
3.Stakeholder awareness and mitigation
strategies
4.Reflections and how to course-correct
with better initial discovery
1.Could you tell me the approximate size
and shape of the plot?
2.Could you clarify if there are any zoning
laws or government-imposed restrictions
that I should be aware of?
3.Do we know how the plot is being used
currently, if at all?
4.Do we know the demographic profile of
the area—who visits or shops here the
most?
157
GOVERNMENT
RESPONSE
SOCIAL ISSUE FRAMEWORKTREE
ROOT CAUSE
MACROECONOMI
C CONTEXT
PHENOMENON
Types of Failures
Target Segment
Expected vs
Achieved Results
Time Bound Targets
Met?
Societal Norms
Economic Barriers
Political Instability
Legal Issues
Technological Gaps
Environmental
Constraints
Goals + GDP Growth
Employment Creation
Productivity
Awareness Campaigns
Legal Reforms
Recent Guidelines
Social Issue Case
Begin by defining the issue — type of
social failure, affected population,
and gaps between expected and actual
outcomes.
Uncover root causes such as social
norms or economic barriers. Link the
issue to macro indicators like
employment or GDP.
Understand government responses
like campaigns and legal reforms,
with stakeholders including citizens,
NGOs, and civil society.
Approach: Prioritize actionable,
culturally feasible interventions
backed by economic logic, ensuring
clear socio-economic impact.
Approaching a Social Case: What Are They Looking For?
When tackling a social case, evaluators expect structured thinking, clarity in identifying the problem, an understanding of macro and micro linkages, and actionable solutions. The idea is
to logically break down the issue, identify stakeholders, and address constraints while staying realistic and impactful.
We have categorized all social cases into 3 buckets- Social Issue cases, Government Policy cases & Macroeconomics social cases
159
160.
SOCIAL CASE FRAMEWORK
DEFINETHE
OBJECTIVE
OF THE
CASE AND
SET GOALS
POLICY
New Policy
Amended/
Ongoing
Policy
TARGET
BENEFICIARIES
Demographic
Focus
Geographic
Focus
KEY
COMPONENTS
Stakeholders
Implementation
Mechanism
Budget
Allocation
Infrastructure
IMPACT
MEASUREMENT
Number of
People
Benefitted
Socio-economic
Improvement
Monitoring
Tools (Surveys,
etc.)
CONSTRAINTS
Legal
(Regulatory
Hurdles)
Economic
(Budget
Limitation)
Political
(Policy Shift,
Elections)
Technological
(Access,
Literacy)
Geographical
(Terrain,
Remoteness)
Government
Bodies
NGOs
Private
Sector
Central
State
PPP
Physical
Digital
Top-Down
Bottom-Up
Centralised
Decentralised
GOVERNMENT POLICY SOCIAL CASE
APPROACH
Start by setting clear policy
objectives, whether new or amended.
Identify target beneficiaries by
demography and geography.
Map out stakeholders, budget
structure (central, state, PPP),
infrastructure needs (physical,
digital), and implementation models
(top-down, bottom-up).
Measure impact through beneficiary
numbers and socio-economic
improvements while addressing legal,
financial, political, and technological
constraints.
Approach: Test policy for feasibility
and inclusivity, recommend scalable,
cost-effective models with measurable
impact and aligned incentives.
GOVERNMENT POLICY SOCIAL
CASE
160
161.
Focus on nationalpriorities like GDP
growth, employment, and
productivity.
Analyze both demand (consumption
patterns, purchasing power) and
supply (production, exports, capital,
infrastructure).
Stakeholders include government,
private sector, MSMEs, financial
institutions, and NGOs.
Account for constraints like budget
limits, regulations, socio-cultural
barriers, and technology.
Approach: Identify sectoral gaps,
suggest productivity reforms, and
strengthen market linkages to drive
macro-level outcomes.
MACROECONOMIC SOCIAL CASE
MARKET FOCUS
OBJECTIVE
GDP Growth
Employment
Generation
Increase in
Productivity
Target Sectors
Demand
Market Demand
Patterns
Consumption
Trends
Purchasing
Power
Production
Capacity
Capital
Exports
Technology
Infrastructure
Supply
STAKEHOLDERS
Government
and Policy
Makers
Private Sector
Financial
Investment
MSME/
Startups
NGOs
CONSTRAINTS
AND ENABLERS
Budget
Regulations
Social/ Cultural
Factors
Labour
Infrastructure
and Technology
MACROECONOMIC SOCIAL
CASE
161
162.
You are aconsultant working with the government of a Sub-Saharan African country that aims to achieve 100% rural
electrification by 2030. Currently, 60% of rural households are still unelectrified. Help them reach their goal.
Okay, before proceeding further, I would like to clarify what is the current energy mix in rural areas- how much is grid-connected versus
decentralised?
Currently, only 10% of rural electrified areas are connected to the central grid. The majority- 90% depends on decentralized renewable
energy sources, with solar technologies being the most prevalent.
Okay, is the government placing greater emphasis on economic development climate sustainability?
The government’s current strategy focuses on environmental sustainability and rapid implementation.
Understood. Are there any notable constraints in terms of budget, geography, or private sector engagement?
Yes. The geographical landscape is diverse, including mountainous and densely forested regions, which creates logistical challenges.
While financial resources are limited, the government is open to leveraging blended finance mechanisms and encouraging private
sector engagement.
Thank you, I have a fair idea about the situation now. My approach would be structured around three core considerations.
First, I would categorize rural households based on population density, their proximity to existing grid infra & complexity of the terrain.
Second, I would assess the suitability of different electrification models, namely grid extension, mini-grids & solar home systems
Third, I would undertake a cost-benefit analysis to evaluate scalability, long-term financial viability, and potential revenue generation.
Okay, sounds good. You may proceed further.
Let’s say we have 10,000 rural villages left to electrify. I’d begin by forming a hypothesis based on geography. I’ll make some assumptions :
Around 30% of these villages are close to the existing power grid. For these, grid extension could be a feasible solution.
About 40% might fall into a mid-range distance where villages are relatively clustered so this setup might be more suitable for mini-grids.
The last 30% are in remote or scattered locations, where extending infrastructure could be very challenging. For these, Solar Home Systems
(SHS) would probably be the best fit.
ROUND
PARTNER
CASE TYPE
SOCIAL
INDUSTRY
ENERGY
COMPANY
SAMAGRA
FREQUENCY
HIGH
Easy 162
163.
Sounds like agood approach.
Do we have any data on the per-unit cost of these interventions?
Yes. Grid extension costs about $1,200 per household. A solar hybrid mini-grid comes in at around $900 per household. SHS is the most affordable,
costing between $300 and $400 per household.
Great, that helps clarify things. Based on these numbers, I’d recommend a hybrid electrification model that aligns with the geography of the villages.
Go ahead.
1.For the 30% of villages near the grid, I’d go ahead with grid extension, leveraging existing infrastructure.
2.For the 40% that are more clustered but farther out, mini-grids seem ideal for balancing cost and scalability well.
3.For the remote 30%, SHS is the most practical as it's of the lowest cost and doesn't require heavy infrastructure, which makes it ideal for scattered households.
We could also prioritise electrifying economic hubs first (e.g. rural markets, schools, clinics) to drive demand and support livelihoods.
But, the SHS providers are struggling with loan repayments from rural customers. How would you de-risk the model?
I’d look at Pay-as-you-go (PAYG) systems linked to mobile money, bundle SHS with income-generating appliances (e.g. irrigation pumps) as an example of
productive use financing. Risk would be shared between public and private sectors, using donor funds to underwrite initial risk for SHS firms.
That is a well-structured approach. We can close the case.
163
164.
PRELIMINARY QUESTIONS
BROWNIE POINTS
1.Whatis the current energy mix in
rural areas?
2.Is the government prioritizing
economic development or climate
sustainability?
3.Are there constraints related to
geography, budget, or private
sector participation?
4.Do we have per-household cost
data for different electrification
models?
1.Segment villages by density,
terrain, and grid proximity.
2.Match electrification models
(grid, mini-grid, SHS) to each
segment.
3.Make structured assumptions to
build a logical approach.
4.Address financial risks through
PAYG and blended finance.
5.Bundle SHS with productive-
use appliances to support
repayment.
100% RURAL ELECTRIFICATION BY 2030
STAKEHOLDERS VILLAGE SEGMENTATION
Government
Private Players
Donors
Verification
Clustered,
Mid-Distance
Remote &
Scattered
Near Grid
Grid Extension Mini-Grids Colar Home
Systems
DERISK PRIVATE SECTOR
PARTNERSHIP
Pay 6 SHS Productive Use Appliance Blended Finance Donor Gurantees
Gurantees to Derisk
IMPACT MEASUREMENT
Increase in Household
Electrification
Number of Prodcutive Use
Appliances Adopted
Revenue from Energy
Enablers 164
165.
The government ofDelhi has reported that cases of harassment have increased by 28% over the past two years. They already
have CCTVs in place, helplines, and even police patrolling during peak hours. How would you navigate this issue?
Thanks. I’d like to clarify a few things before structuring my thoughts. Are we assuming that the increase in reported cases is due to a real rise in
harassment, or could it be a result of better reporting and increased awareness?
It is likely to be a mix of both. There’s been more reporting due to social media campaigns, and there may be a rise in incidents post-
COVID-19 due to economic strain and crowding, especially in transit points.
Got it. Are we focusing only on women, or should we also consider non-binary individuals or other marginalized groups?
The primary focus is on women, but feel free to mention solutions that could help others too.
Got it, thank you. I’d like to look at this across three key areas:
1.Environment Design – making public spaces feel safer and more responsive.
2.Behavioural Interventions – changing how people act and respond in these spaces.
3.Institutional Responsiveness – improving how the system handles complaints and supports victims.
Sounds good. Please go ahead.
Starting with the environment, harassment often happens in spaces that are too crowded, too isolated, or poorly lit. I’d suggest identifying these
"hotspots" using police data, Google mobility trends, and even an app where women can tag places, they feel unsafe. Once we know the trouble
areas, we can try things like:
Setting up small stalls in isolated spots to increase natural surveillance.
Creating color-coded zones in transit areas with more seating, help buttons, and signs showing it’s a designated “safe” area.
Using smart lighting that automatically brightens when foot traffic increases or during late hours.
How would you ensure these solutions are cost-effective?
We can integrate these design changes into areas where infrastructure upgrades are already planned. For example, if the city is modernizing
metro stations, we can include these elements as part of the existing budget, minimizing additional costs. Some of the interventions, like kiosk
placement, are low-cost but can have a high impact.
ROUND
PARTNER
CASE TYPE
SOCIAL
INDUSTRY
SOCIAL ISSUE
COMPANY
NATION WITH NAMO
FREQUENCY
MEDIUM
MODERATE 165
166.
Sounds good. Moveto the next.
Next is behavioral change to change the social environment. Harassers often act because they think no one will stop them. I’d suggest:
Audio messages in crowded areas reminding people that harassment is a crime, and bystanders should speak up.
Training local vendors, auto drivers, and shopkeepers to act as “safety champions.” They can wear visible tags or have QR codes women can scan to ask for
help.
How would you make sure these ideas actually work?
We can test them out in select locations. We can also talk to people and observe how they react to the changes. Lastly, institutional support really matters. To address
this, I recommend:
Setting up QR-coded micro-reporting stations in metros and buses where women can anonymously submit harassment reports.
Training female police officers to respond in a trauma-informed manner.
Developing a real-time dashboard for local police, transport authorities, and gender departments to track reports by location, time, and nature of complaints.
You’ve covered a lot of initiatives focused on design, behaviour, and systems. Thank you for the thoughtful approach. We can close the case.
166
167.
PRELIMINARY QUESTIONS
BROWNIE POINTS
1.Isthe increase in reported due to a
real rise in harassment, or could it
be a result of better reporting and
increased awareness?
2.Are we focusing only on women,
or should we also consider non-
binary individuals or other
marginalized groups?
1.Highlighting the difference
between actual increase vs.
better reporting.
2.Integrating low-cost, high-
impact solutions like pop-up
kiosks and smart lighting.
3.Suggesting a flexible system
based on different areas and
local cultures.
WOMEN SAFETY
OBJECTIVES ROOT CAUSE ACTION TAKEN STAKEHOLDERS
Address Gaps Reduce Harassment
Institutional
Behavorial
Spatial
Street Based
Transit Based
Focus Area
Police
Local Vendor
General Public
Govt Institution
Women
Environmental
Decision
Behaviour Institution
Setting up Stalls
by Police
Color Coded
Zones
Smart Lights
Training Local
Vendors
Audio Messages
Training Female
Police
QR Code Micro
Reporting
Real Time
Dashboard
167
168.
You’re advising thegovernment of a newly independent nation in Southeast Asia. They want to develop the
economy with a strong focus on agriculture. How would you approach this?
Thanks! Before diving into a structured approach, I would like to ask a few contextual questions to understand the landscape better.
Of course, go ahead.
First, what kind of economic model is this government aiming for more market-driven or centrally planned?
It’s a mixed economy for now, with the government playing an active early role.
Got it! That allows space for reform-led growth. What about demographic indicators literacy, rural-urban distribution, and employment trends?
The literacy rate is low. About 70% of people live in rural areas, most engaged in subsistence farming.
Thanks, that’s helpful. Could you tell me about the land— how fertile is it, and what are the main crops?
The land is moderately fertile. Key crops include rice, maize, and some sugarcane. There’s potential to diversify further.
Noted. Is the country landlocked or coastal?
It’s a peninsular country with solid access to the sea.
Perfect that gives us a strong logistical edge. Based on what you've shared, I'd like to approach this case step by step. First, I’ll define the objective
clearly, then break it down into demand and supply side levers, identify key stakeholders, and highlight any constraints we should be mindful of.
Sounds good. Go ahead.
Would you like me to focus Primarily on supply side or demand side levers?
Let's go ahead with supply side
ROUND
FINAL
CASE TYPE
SOCIAL
INDUSTRY
AGRICULTURE
COMPANY
DALBERG
FREQUENCY
MEDIUM
DIFFICULT 168
169.
Thanks! Starting withthe supply side, the focus would be on strengthening the production ecosystem so that farmers have the tools, incentives, and resilience to shift
from subsistence to surplus. I’d cluster this under three main buckets:
1. Land and Input Reforms
Land redistribution or legal titling where applicable
Ensuring affordable access to quality inputs like seeds, fertilizers, and credit
Public investment in irrigation, rural roads, and warehousing
2.Farmer Training & Extension Service, given the low literacy rates, typical top-down training won't stick.
Using audio-visual tools and local dialects.
Partnering with NGOs and SHGs to train farmers on-ground.
Creating peer-led “model farmer” networks—farmers trust farmers
3. Productivity Boost & Crop Diversification
Encouraging mechanization through rental services.
Shifting toward high-value, low-water crops like spices, medicinal plants, tropical fruits.
Promoting climate-resilient practices: crop rotation, organic inputs.
Fair enough. But many small farmers are risk-averse. What kind of support systems would you put in place to make this transition feel safe for them?
Great question. I’d propose a multi-layered safety net:
Crop insurance schemes tailored for diversified crops.
Input subsidies in the early years for seeds and training.
Assured procurement at minimum support prices for select cash crops.
Well structured. Could you suggest some long term reforms?
For the long term, focus should be on efficiency of Agriculture and Rural Diversification.
Improving agricultural efficiency through modern technology, better farming practices, and optimal use of resources (water, land, labor) will help maximize yields and
ensure sustainability. 169
170.
Moving beyond agricultureand investing in other sectors like agro-processing, local industries, tourism, and services will create alternative sources of income for rural
populations.
Makes sense. Can you suggest some measures to ensure that?
Efficiency in Agriculture:
Establishing local water management committees to oversee small-scale, sustainable irrigation systems. This ensures more efficient use of water resources and
reduces dependency on external infrastructure.
Encouraging the formation of farmer cooperatives that can collectively purchase high-quality seeds, fertilizers, and tools at a lower cost, improving accessibility
and reducing input costs.
Introducing low-cost, organic soil enhancement methods such as composting, mulching, and crop rotation to improve soil health and reduce dependency on
chemical fertilizers, leading to more sustainable farming practices.
Creating rural tourism experiences that highlight farming practices, local culture, and natural beauty, attracting visitors and creating jobs in areas like hospitality,
local guiding, and small-scale farming experiences.
Really comprehensive. Now if you had to list your Top 5 Priorities for the first five years, what would they be?
1. Land and input access reforms
2. Public investment in irrigation and storage
3. Farmer-centric training programs
4. Pilot agro-processing clusters
5. Foundational work for export logistics and maritime infrastructure
Very clear and structured. we can end the case here, thank you.
170
171.
PRELIMINARY QUESTIONS
BROWNIE POINTS
AgriculturalDevelopment
Strategy
OBJECTIVES
MARKET FOCUS
STAKEHOLDERS CONSTRAINT &
ENABLERS
Economic
Development
Agriculture
GDP Growth
Infrastructure
Development
Employment
Generation
Crop
Diversification
Land and Input
Reforms
Police
Regulations
Productivity of
Labour
Infrastructure &
Technology
Social Factors
Productivity of
Land
Financial
Institutions
Private Sector
Government of
Policy Makers
Financial
Institutions
MSMEs & NGOs
Demand Supply
Market Access
Consumption
Trends
Purchasing
Power
Institutional
Support
Land and Input
Availability
Production
Efficiency &
Distribution
Labour
Productivity &
Capacity Building
1.What kind of government system
are we looking at — is it market-
oriented or more centrally
planned?
2.Does the country have access to the
sea or is it landlocked
3.How fertile is the land, and what
crops are currently grown?
4.What about the country’s
demographics — things like
literacy rate, rural-urban
distribution, and labor force?
1.Tailor recommendations to the
socialist economy
2.Leverage geographic advantage
3.Address low literacy with
targeted farmer training
programs
4.Identify long-term need to
diversify the rural economy
171
172.
Your client isthe Government of India. You’ve been hired to design a national-level program that prepares the youth for
future jobs.
Alright. Before jumping into solutions, I'd like to understand a bit more—what exactly do we mean by “future jobs”? Are we referring specifiy to tech
jobs or are we looking at a broader landscape?
Good question. The government is referring to jobs that are expected to emerge or expand rapidly over the next 10–15 years—so this
includes AI, robotics, clean energy, digital services, modern agriculture, healthcare delivery, etc. Basically, sectors that are not yet fully
mainstream but will define the economy soon.
Understood. And are we targeting school students, college grads, dropouts—who exactly is this program aimed at?
We’re targeting Indian youth between 15 and 30. That would include school students, recent graduates, as well as those currently
unemployed or in informal work.
Okay, and is there any fixed timeline by which this program should show outcomes?
There’s no immediate deadline, but the idea is to start now and build a scalable, impactful model that shows measurable outcomes in
2–3 years.
Great. I’d now like to break this down a bit to better frame my structure.
Go ahead.
I believe we can break this down into a simple impact formula:
Future-Ready Youth = Access to the program × Relevant skill-building × Conversion into job/gig/entrepreneurship opportunities
Looks good. Let’s take them one by one. Start with access.
Sure. When it comes to ensuring access, there are a few levers we can work with:
ROUND
BUDDY
CASE TYPE
SOCIAL
INDUSTRY
ECONOMY
COMPANY
DALBERG
FREQUENCY
HIGH
MODERATE 172
173.
1.Digital Access
Government candistribute learning kits—basic tablets, data plans, or access to common service centers in villages.
Mobile-first platforms in regional languages would help reach Bharat’s youth.
2. Physical Touchpoints
Revamping existing infrastructure like ITIs, community centers, or post offices into Skill Hubs.
Evening and weekend batches for those already working.
3. Awareness and Inclusion
Using influencers, teachers, and panchayat members to spread awareness about the initiative.
Special focus campaigns for women, NE youth, tribal areas, and people with disabilities
Would you prioritize any group in the initial phase?
Yes. I’d start with high-unemployment zones and groups that are otherwise left behind—rural women, dropout youth, and tier 3 city aspirants.
Makes sense. Let’s assume they’re now onboard. What are you teaching them?
This brings us to the next part—Relevant Skill Building. I’d divide this into four key buckets:
1.Core Technical Skills- AI/ML, digital marketing, green energy tech, drone operation, app development.Skilled trades like EV maintenance, solar panel
installation, or healthcare tech.
2.Meta Skills-Digital literacy, tool fluency (e.g., Excel, Canva, GPT tools).
3.Soft Skills- Interview readiness, communication, etiquette, collaboration and multilingual training to help with customer-facing roles.
4.Life & Career Skills- Financial literacy, mental well-being, career goal setting.
How do you keep students engaged in such a large-scale curriculum?
I’d keep it very practical. Projects over theory. Peer-led modules. And localized examples—say, teaching Python using cricket data or Excel through budgeting a
wedding.
That’s clever. Alright, they’ve learned the skills. Now what?
173
174.
Now comes thethird piece—Conversion to Employment. That’s where we ensure the skilling actually leads to income.
1.Jobs- Building a centralized AI-enabled job and gig platform tailored to their skills, mandating industry partners to hire a % from this program like CSR quotas and
conducting hybrid job fairs every quarter at the district level.
2.Freelancing- Teaching how to build a Fiverr/Upwork/Instagram profile and support with digital tools, payment access, and marketing tips.
3.Entrepreneurship- Providing seed grants for micro-entrepreneurs—like drone service startups or vernacular YouTubers and having Incubation pods at district level
with mentoring and credit access.
That sounds ambitious. That was well-thought through and very structured. Let’s pause here.
174
175.
PRELIMINARY QUESTIONS
BROWNIE POINTS
PREPARINGYOUTH FOR CAREER READINESS
ACCESS TO THE
PROGRAM
Digital Access
Physical
Touch-points
Awareness
and Inclusion
Core Technical
Skills (AI, ML)
Meta Skills
Soft Skills
Life Skills
RELEVANT
SKILL BUILDING
Jobs
Freelancing
Entrepreneurship
CONVERSION TO
JOB/GIG
1.What do we define as “future jobs”
only tech or a broader scope?
2.Who is the target audience—
students, graduates, unemployed
youth?
3.Is there a fixed timeline to see
impact?
4.What geographies or demographics
are we prioritizing initially?
1.Framed solution as: Future-Ready
Youth = Access × Skills ×
Opportunity.
2. Suggested vernacular, mobile-first
platforms and ITI repurposing for
access.
3. Grouped skills into technical, meta,
soft, and life categories.
4. Proposed localized, practical learning
methods.
5. Linked training to outcomes via AI
matching, freelance support, and rural
micro-entrepreneur pods. 175
176.
Why were MSMEs,in particular, disproportionately impacted by the COVID-19 crisis when compared to larger
firms? Analyze the underlying challenges.
Good afternoon, and thank you for the opportunity. MSMEs were hit harder due to a mix of structural weaknesses and COVID-specific shocks.
Many operated with limited working capital and poor access to formal credit. Lockdowns disrupted their operations and labour supply, and unlike
larger firms, most couldn’t shift online due to the digital divide.
That makes sense. Would you consider these factors to be primarily pre-existing, or were they a direct result of the pandemic?
I believe the pandemic acted as a stress test. Most of these issues like limited formalization, poor digital penetration, and financial exclusion were
systemic and predated COVID. However, the crisis intensified their consequences and accelerated the need for structural reform.
In your assessment, which sub-sectors or business types experienced the greatest disruption?
The level of impact varied significantly by sector. Hospitality, retail and textile were hit hardest due to their dependence on physical footfall. I read
this in a report and found it interesting that MSMEs that supported healthcare, e-commerce logistics, and sanitation services saw relatively low
impact, and even growth, due to pandemic-driven demand shifts.
Assuming limited fiscal space, how would you recommend we prioritize which MSMEs to support?
Budgetary constraints is a big problem and i believe a structured and equitable prioritization way is necessary to ensure that MSMEs prosper. I
would consider four dimensions:
1.Revenue Disruption: Prioritizing firms that lost over 50% of income during the peak disruption.
2.Employment Intensity: Focusing on firms that support high numbers of workers per unit of capital.
3.Recovery Viability: Targeting businesses with a clear path to rebound, given short-term support
4.Geographic Vulnerability: Directing resources towards districts with a high concentration of MSMEs and high COVID-19 severity.
That sounds comprehensive. There was a lot of buzz around Development Finance Institutions (DFIs) during COVID as a way to help
MSMEs survive the pandemic. What role can DFIs play in the recovery of the MSME sector?
ROUND
PARTNER
CASE TYPE
SOCIAL
INDUSTRY
ECONOMY
COMPANY
DALBERG
FREQUENCY
LOW
MODERATE 176
177.
I can vividlytrace the discussion around that over newspapers. As per my knowledge, DFIs can play a catalytic role through few key levers:
1. Credit Enablement: Providing low-interest, collateral-light loans, issuing partial credit guarantees, and extending emergency working capital through NBFCs and
fintechs.
2. Digital Transformation Support: Offering grants or co-investment for digital onboarding such as e-commerce integration or digital payment adoption.
3. Capacity Building and Financial Literacy: Conducting training programs in vernacular languages on topics such as cash flow management, formal bookkeeping,
and digital tools.
4. Policy Advocacy: Engaging with regulatory bodies to simplify compliance norms, reduce tax burdens (e.g., GST)
You are right. Suppose we’re focused specifically on MSMEs in the textile sector. How would you contextualize these interventions for that segment?
In textiles, a cluster-based approach would be effective in my opinion. This could include digitizing order processing at the cluster level, building shared logistics
infrastructure, offering working capital loans tied to confirmed purchase orders, and enabling partnerships with urban retail brands.
Your recommendations are sound. But in your view, are MSMEs aware that these schemes and supports even exist?
Awareness is a major challenge and many are not sound with these facilities. There exists significant information asymmetry, particularly for micro and informal
businesses. Communication channels tend to be top-down, often delivered in English or urban-centric formats, which exclude large segments of the MSME
population. Furthermore, there is a legacy of mistrust toward formal institutions due to previous experiences with red tape or loan rejections.
How would you recommend we overcome these barriers?
A ground-up communication strategy is essential. This could involve localized outreach using vernacular media (community radio, local cable, and WhatsApp
channels). and collaborations with SHGs, NGOs, and trade associations who already have trust capital.
Last question from my end; in your view, what would long-term success look like?
I believe in the long run, success of MSMEs would not be measured by mere survival. It would mean MSMEs operating with resilience; formally integrated, digitally
capable, and connected to value chains. An entrepreneur in a Tier-3 town should feel confident accessing a digital loan, selling across the country, and employing
more workers with stability and dignity.
That was a thoughtful and well-structured discussion. Thank you for your time. 177
178.
PRELIMINARY QUESTIONS
BROWNIE POINTS
ROOTCAUSES SECTORAL IMPACT
Low
Disruption
Limited
Working
Capital
Poor
Formal
Credit Access
Low
Digital
Penetration
Structural
Weakness
Supply
Chain
Issues
Liquidity
Crunch
Demand
Collapse
COVID
Specific Shocks
High
Disruption
Retail,
Hospitality,
Textile
E-commerce,
Edtech,
Healthcare
Financial
Digital
Transformation
Capacity
Building
Policy
Advocacy
INTERVENTION
IMPACT OF COVID-19 ON MSMEs
1.What data is available on MSME
performance during the pandemic (e.g.,
revenue loss, employee retention)?
2.Are there existing government schemes,
or are we designing new ones?
3.What is the budget for this
intervention, and are there regional
priorities?
4.Are there specific industries MSMEs
should focus on?
1.Highlighted structural weaknesses (e.g.,
financial exclusion, poor credit access)
explaining MSMEs' pandemic impact.
2.Sectoral impact analysis (e.g., hospitality,
textiles) helped prioritize sectors needing
support.
3.Prioritized geographic targeting and
vulnerable groups (e.g., rural women,
informal workers).
4.Suggested cluster-based approaches for
sectors like textiles to enhance scalability.
5.Focused on digital transformation and
financial literacy for long-
term resilience.
178
179.
The Government ofBihar has observed a steady rise in mortality rates over the last five years, especially in rural areas.
Most of these deaths are preventable; linked to infections, childbirth complications, or unmanaged chronic illness. How
would you begin tackling this?
Thanks for the case. To frame the problem properly, I’d like to clarify a few points. Has the rise affected specific age groups ; say, infants or elderly
more than others?
Are particular districts or regions contributing disproportionately?
And has there been any recent change in how health services are delivered?
Good questions. The increase spans all age groups but is most pronounced in rural districts. Infrastructure hasn’t changed much;
hospitals still exist but doctor absenteeism has gone up, and many have moved to private practice. A few large districts seem to
account for much of the increase.
Got it. I’d approach the issue by exploring three dimensions; service supply, healthcare access and demand, and external or policy-related
disruptions.
Starting with the supply side, I'd look into how functional the facilities really are. Are doctors present? Are nurses and equipment available? And
what’s motivating or demotivating the public health staff?
Interesting. For context; around five years ago, a district leader introduced a controversial accountability policy. Government doctors
had to wear bright green tags saying “Sarkari Naukar”, and publicly record their bathroom breaks. That aligns with the timing of the
mortality spike. Does that shift how you think about the problem?
That adds a new layer. What may have been framed as transparency might have felt demeaning. It could have driven good doctors out of the
system. Especially if salaries were delayed and support was missing, this kind of symbolic policing can really damage morale.
Fair take. Let’s move to the patient side. How are you thinking about the demand or access challenges?
Even if facilities exist, people may not trust or use them. If public clinics are seen as unreliable, families might delay care, rely on informal providers,
or skip treatment altogether. Geography plays a role too - villages far from roads or without ambulance access might have no realistic options
during emergencies.
ROUND
FINAL
CASE TYPE
SOCIAL
INDUSTRY
HEALTHCARE
COMPANY
SAMAGRA
FREQUENCY
HIGH
MODERATE 179
180.
Let’s say thehealth ministry asks you to stabilize mortality in six months. You can’t hire 500 doctors overnight. What’s your move?
I’d start by activating community health networks - ASHA workers, midwives and equip them with better tools, like teleconsultation support.
Second, I’d deploy mobile clinics with predictable rotations, even if only weekly. And finally, I’d set up emergency referral channels ; perhaps tie-ups with local
transporters for ambulance substitutes.
And what if the mobile clinics stop during monsoons?
I’d decentralize further ; train community volunteers in symptom recognition, stock basic meds with trusted locals, and rely on mobile phones to escalate serious cases.
The idea is to build micro-systems that can operate even when formal ones stall.
You’re visiting a village. A woman says her mother died from a diabetic episode because there was no ambulance. She says, We don’t expect anything
from the sarkar anymore. What do you say?
I’d say: “I’m deeply sorry. No one should have to go through that. If you're open to it, I’d like to understand more ; what could’ve helped, and what support you still
need”
People don’t need speeches. They need someone who listens and stays.
That’s a thoughtful response. Thanks. I appreciated your clarity and empathy. Best of luck with what’s ahead.
180
181.
PRELIMINARY QUESTIONS
BROWNIE POINTS
RISEIN
NATURAL DEATHS
RISING MORTALITY RATE
RISE IN
PREVENTABLE DEATHS
Policy Disruption
Service Supply
Availability of Doctors Equipment
Delayed Salaries
Led to Reduced
Motivation
Reliability
Geography
Healthcare Access
1.Which age groups and regions
are most affected by the rising
mortality rates?
2.Has there been any change in
health service delivery (e.g.,
doctor absenteeism, policies)?
3.What resources and budget are
available to tackle this issue?
4.Are there any existing
community health structures,
like ASHA workers, that can be
leveraged?
1.Explored service supply by
questioning functional facilities,
doctor availability, and staff
motivation.
2.Considered policy impact (e.g.,
"Sarkari Naukar" accountability
policy) and its effect on doctor
morale and retention.
3.Addressed demand-side issues like
trust in public health services and
geographic barriers to access.
4.Community health networks and
clinics for quick, decentralized
response in emergencies.
181
182.
Below is acomprehensive list of common strategy questions that recruiters frequently pose during interviews beyond
traditional case studies. These questions often take the form of situational prompts or puzzles designed to assess your
analytical thinking and problem-solving capabilities under pressure. Firms have distinct preferences for certain question types,
which are noted alongside each entry to help candidates prepare more effectively for specific target companies.
QUESTION DIFFICULTY
COMPANY
S.NO.
LSR with its strong legacy, is considering expanding into the engineering department.
Given its history and current positioning, how would you assess the feasibility and approach
the implementation of this new department
Everest Group
1
If you were to have 8 slices of a cake but with 3 cuts, how would you go ahead?
Nomura
2
A woman uses a fake ₹1000 note to buy ₹200 worth of goods. The shopkeeper gives her
₹800 change using money from a neighbor. When the note is found fake, he repays the
neighbor ₹1000. What is the total loss?
You're on a game show with 3 doors—1 hides a car, 2 hide goats. You pick Door A. The host,
knowing what's behind each door, opens Door B to reveal a goat. You can stick with A or
switch to the remaining door. To win the car, should you switch? Why?
Blackstone
3
A cardboard has no cost value and you put a 1000 rupees note on the box, what would be
the enterprise value
Houlihan Lokey
4
182
183.
QUESTION DIFFICULTY
COMPANY
S.NO.
India hasa taxation system for alcohol that varies for states. You are the head & are sitting
across Nirmala Sitharaman. How will you convince her about a unified tax system?
If you were to discontinue any beer from Ab InBev’s product line, which one would you and why?
AbinBev produces energy drinks and non-alcoholic beverages. If I consume them, which is your
favourite & if not, why?
Ab InBev
6
UAE bank wants expat-focused features. A A bank in the UAE plans to launch specialized
banking services for the expat population. What would be your strategy to assess the feasibility
and design a solution tailored to this demographic
Kepler Cannon
7
Meesho's short video commerce platform is seeing a drop in orders. Analyze the entire user
journey from app entry to checkout, diagnose issues such as CTR and video content relevance,
and conduct a root cause analysis for declining saree sales and a 15% drop in grocery
Sales/DAU in Nagpur.
Meesho
8
Chart the energy generation patterns of a solar power plant versus a coal-based extraction
plant over the course of a day. What key factors would you consider in this comparison?
You have two identical ropes & a lighter. Each rope takes 60 minutes to burn completely when lit
from one end, but they burn non-uniformly—some parts may burn faster than others. You cannot
cut the ropes or use any additional tools. Task: Measure exactly 45 minutes using only the ropes
and the lighter.
Clean Max
5
183
184.
Creating LSR's first-everConsulting Casebook has been quite the rollercoaster. What began as late-night
conversations within the placement cell union has somehow materialized into the pages you're holding. We won't
pretend this journey was perfect - there were disagreements, missed deadlines, and moments when we
questioned if this was worth pursuing at all.
Remember that the consulting world can feel intimidating, but at the end of the day, it's just problem-solving with
structure. Some of you will breeze through case interviews, while others might need more practice - both are
completely fine. This casebook isn't about guaranteeing success; it's about giving you a starting point and the
confidence to take that first step. When you do succeed, stay grounded. Help those coming after you. Share your
knowledge freely. The LSR community thrives when we lift each other up.
So use this casebook. Mess up. Learn. Try again. And when you're sitting across from that interviewer who seems
determined to watch you fail, remember that we've been there too – sweaty palms, racing thoughts and all.
Whatever happens, you'll be okay. Take care of yourself. And for god's sake, remember to eat during the
placements week.
We're rooting for you,
The Casebook Team LSR.
184


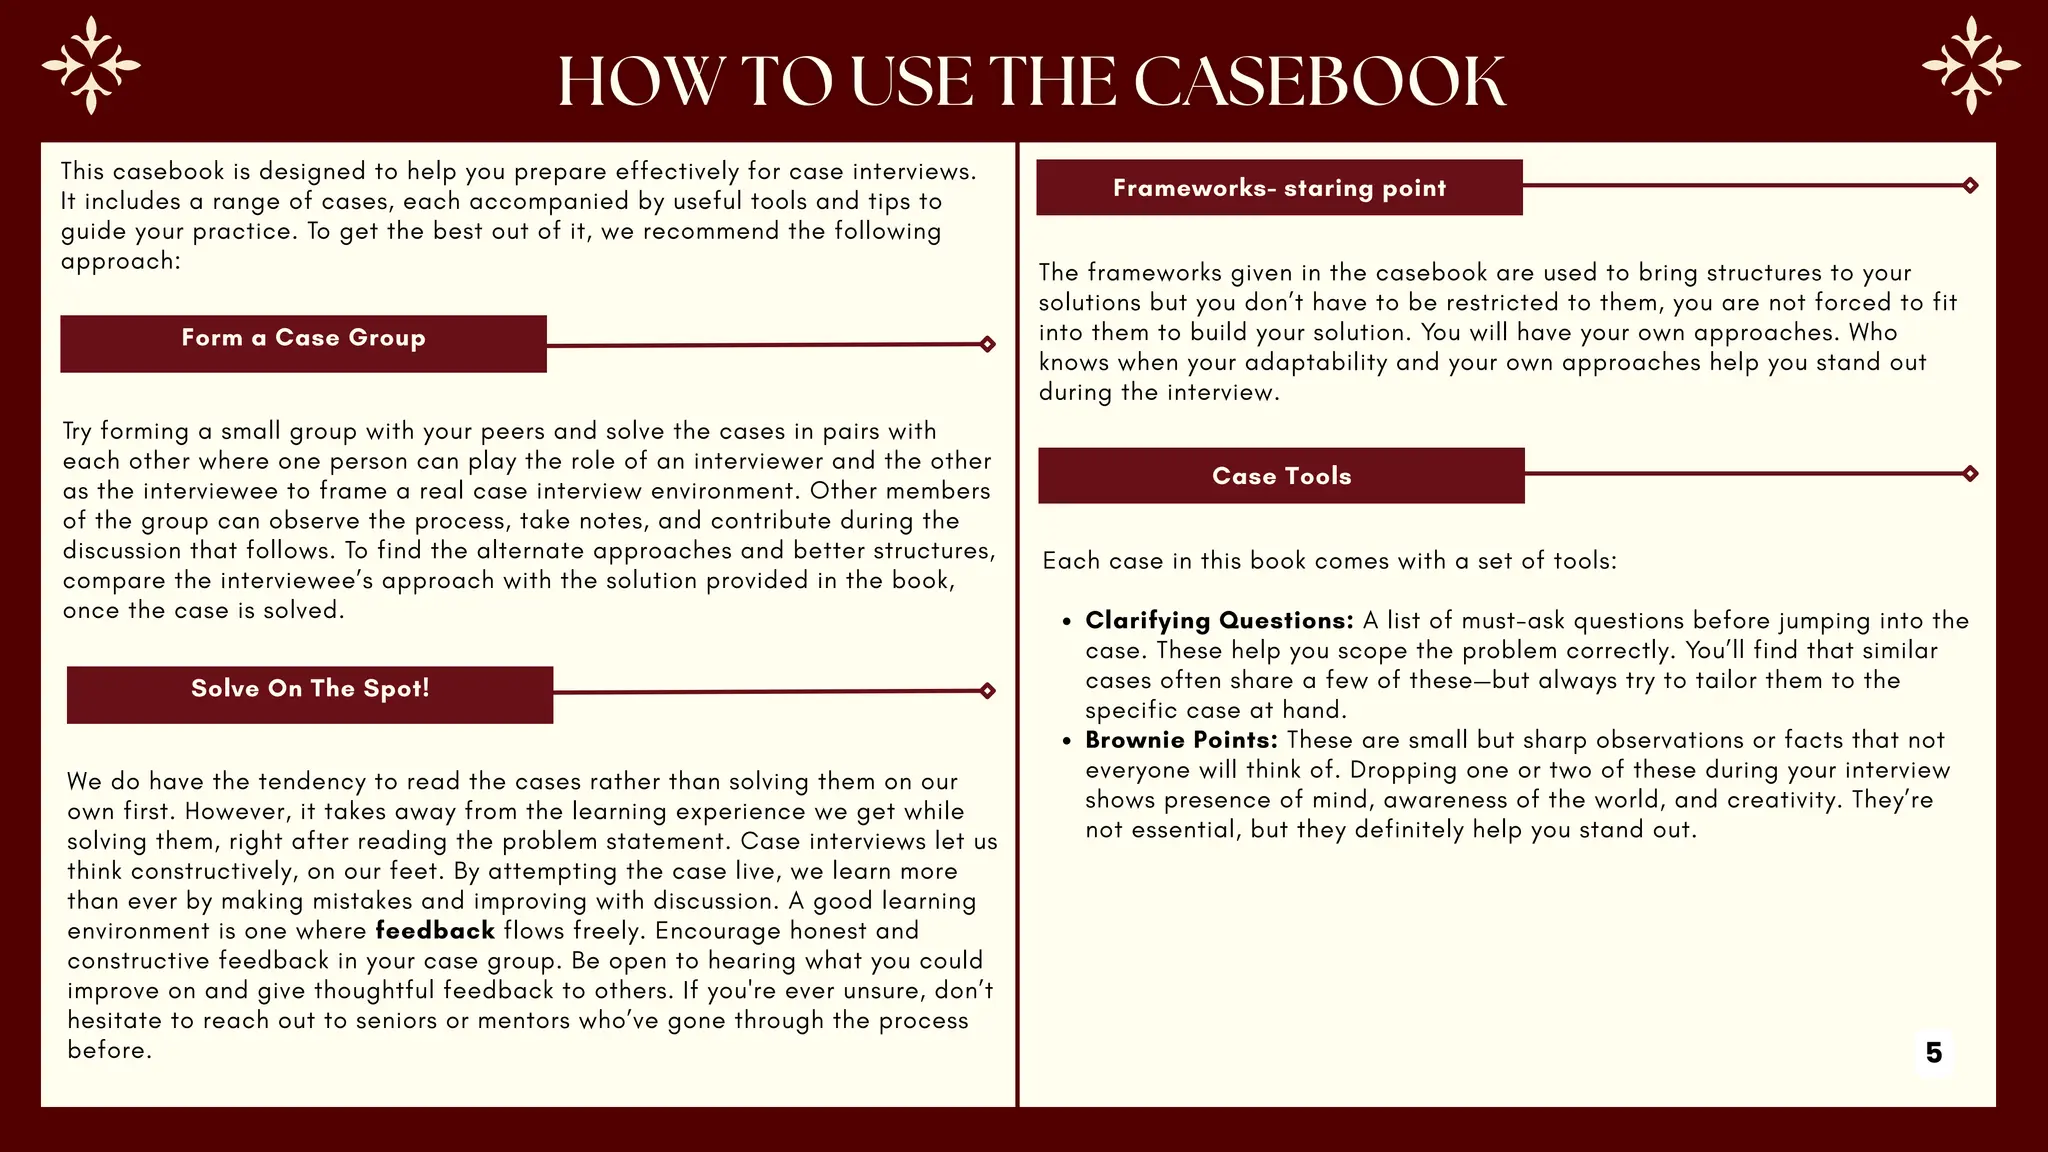
![Questions to avoid
→DO NOT ask questions you already know the answer to.
→DO NOT ask questions simply to showcase your intelligence.
→DO NOT ask questions that show a lack of research.
Example: “What does your company do?” - This gives the impression you haven’t prepared.
→DO NOT ask personal or confidential questions.
Example: “Can you tell me how much you earn or how often you get promoted?” - These questions are inappropriate.
→DO NOT ask questions that sound transactional.
Example: “How quickly can I move to a higher-paying role?”
Questions worth asking
→ Ask about things you genuinely want to know, what it’s like to work there, how people grow, and what makes the company culture unique.
→ Try to understand the company’s long-term vision and how your role might align with it.
“How does this role contribute to the company’s broader goals or long-term vision?”
→You are always safe asking about the recruiter’s personal experience (since you would never find that on the website or anywhere else!).
Example: “Can you tell me about some of the projects you’ve worked on?”
“What do you enjoy most about working at [Company Name]?”
Clarify the
Problem
Structure the
Problem
Priorotise
and dive
deeper
Analyze data
and insights
Synthesize
and
Conclude
Recommend
and Defend
Think Goal
What does the client
want?
Think Focus
Which areas are the
most critical ?
Think Patterns
What does the data
reveal ?
Think Clarity
What are the key
takeaways ?
Think Impact
What’s my answer and
can I support it?
Think Framework
“How can I break it
down logically?”
6](https://image.slidesharecdn.com/lsrcasebook2024-25-250814165911-7b627cd0/75/LSR-CASEBOOK-2024-25-pdf-very-nice-casbook-6-2048.jpg)
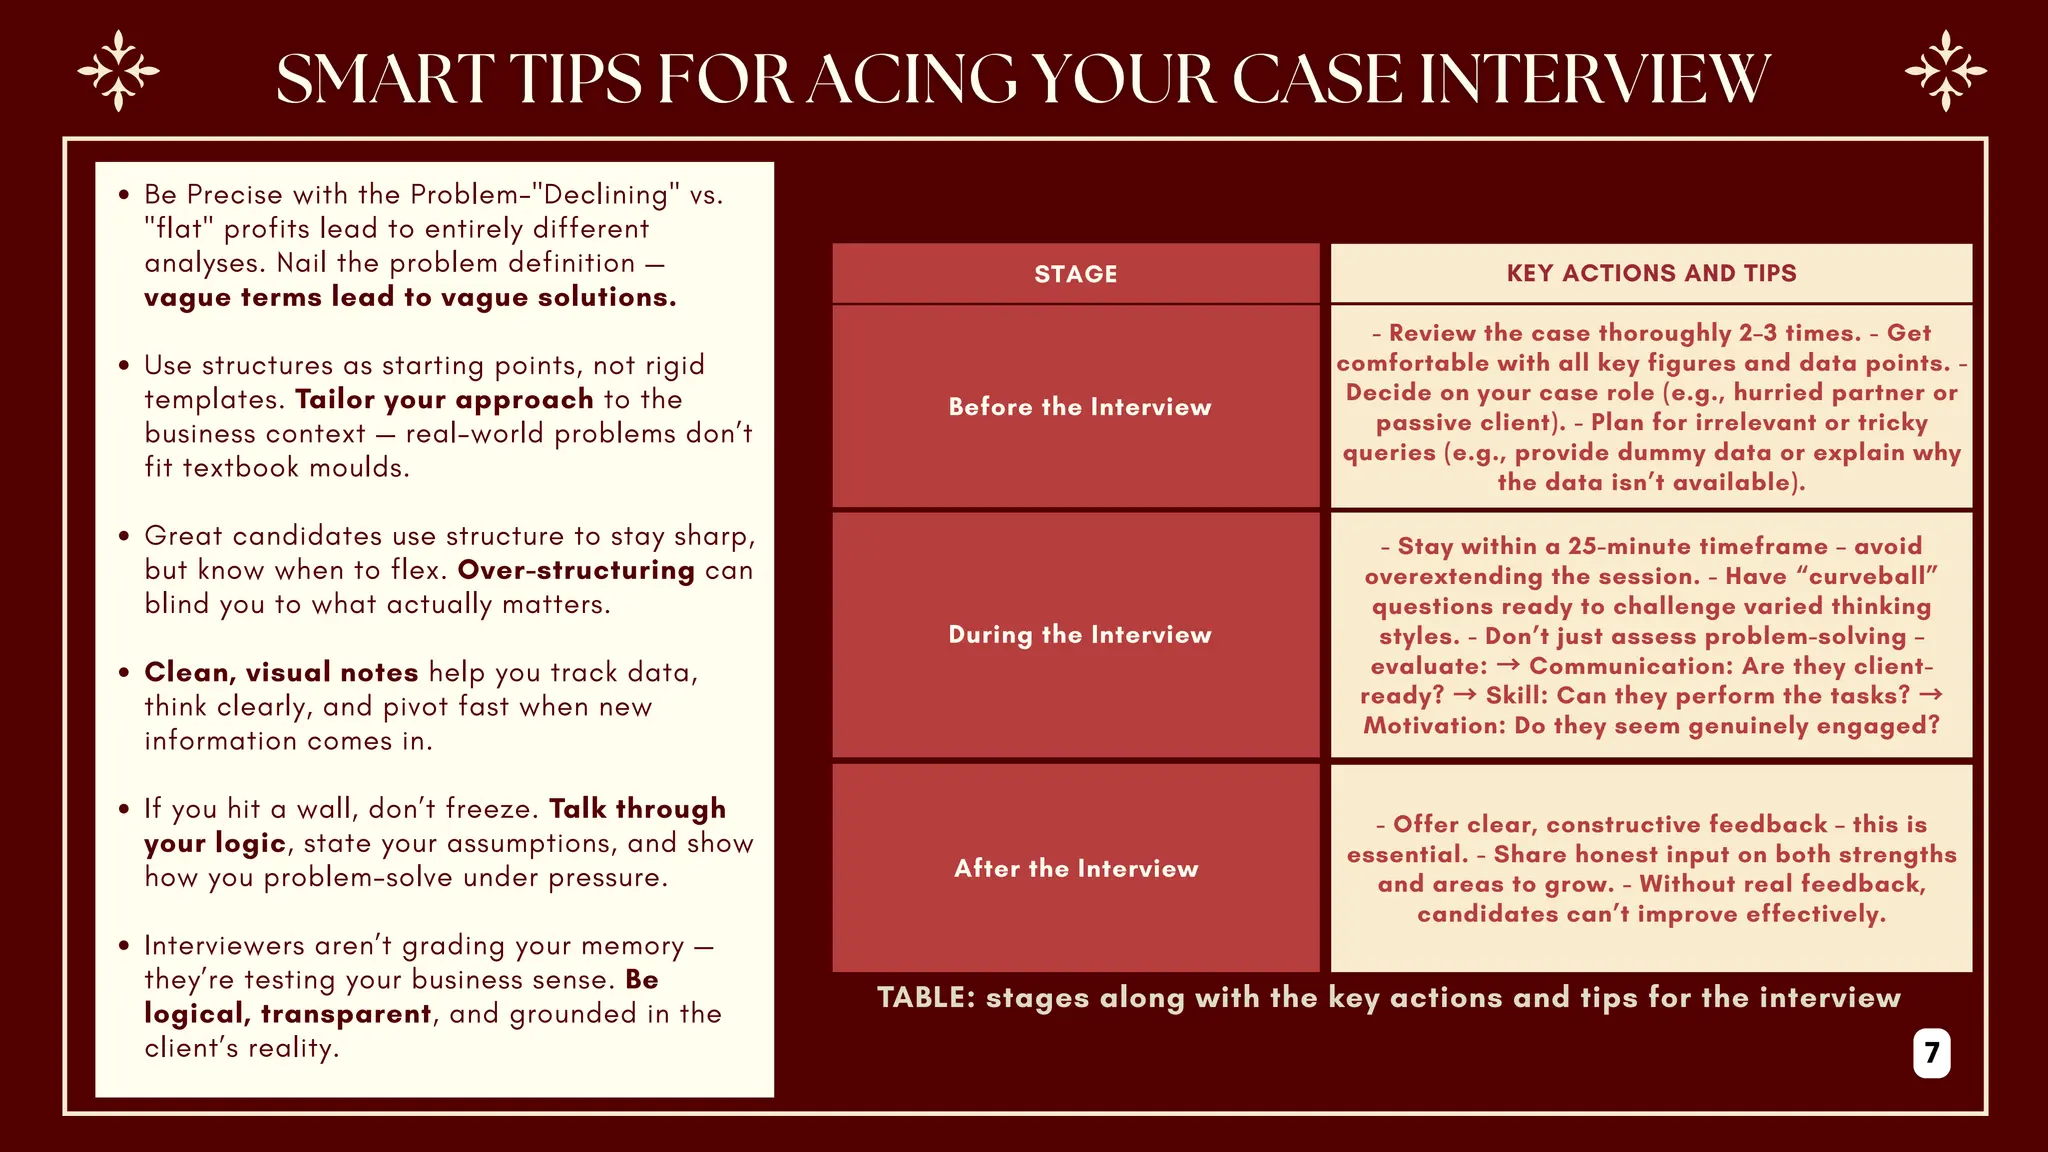

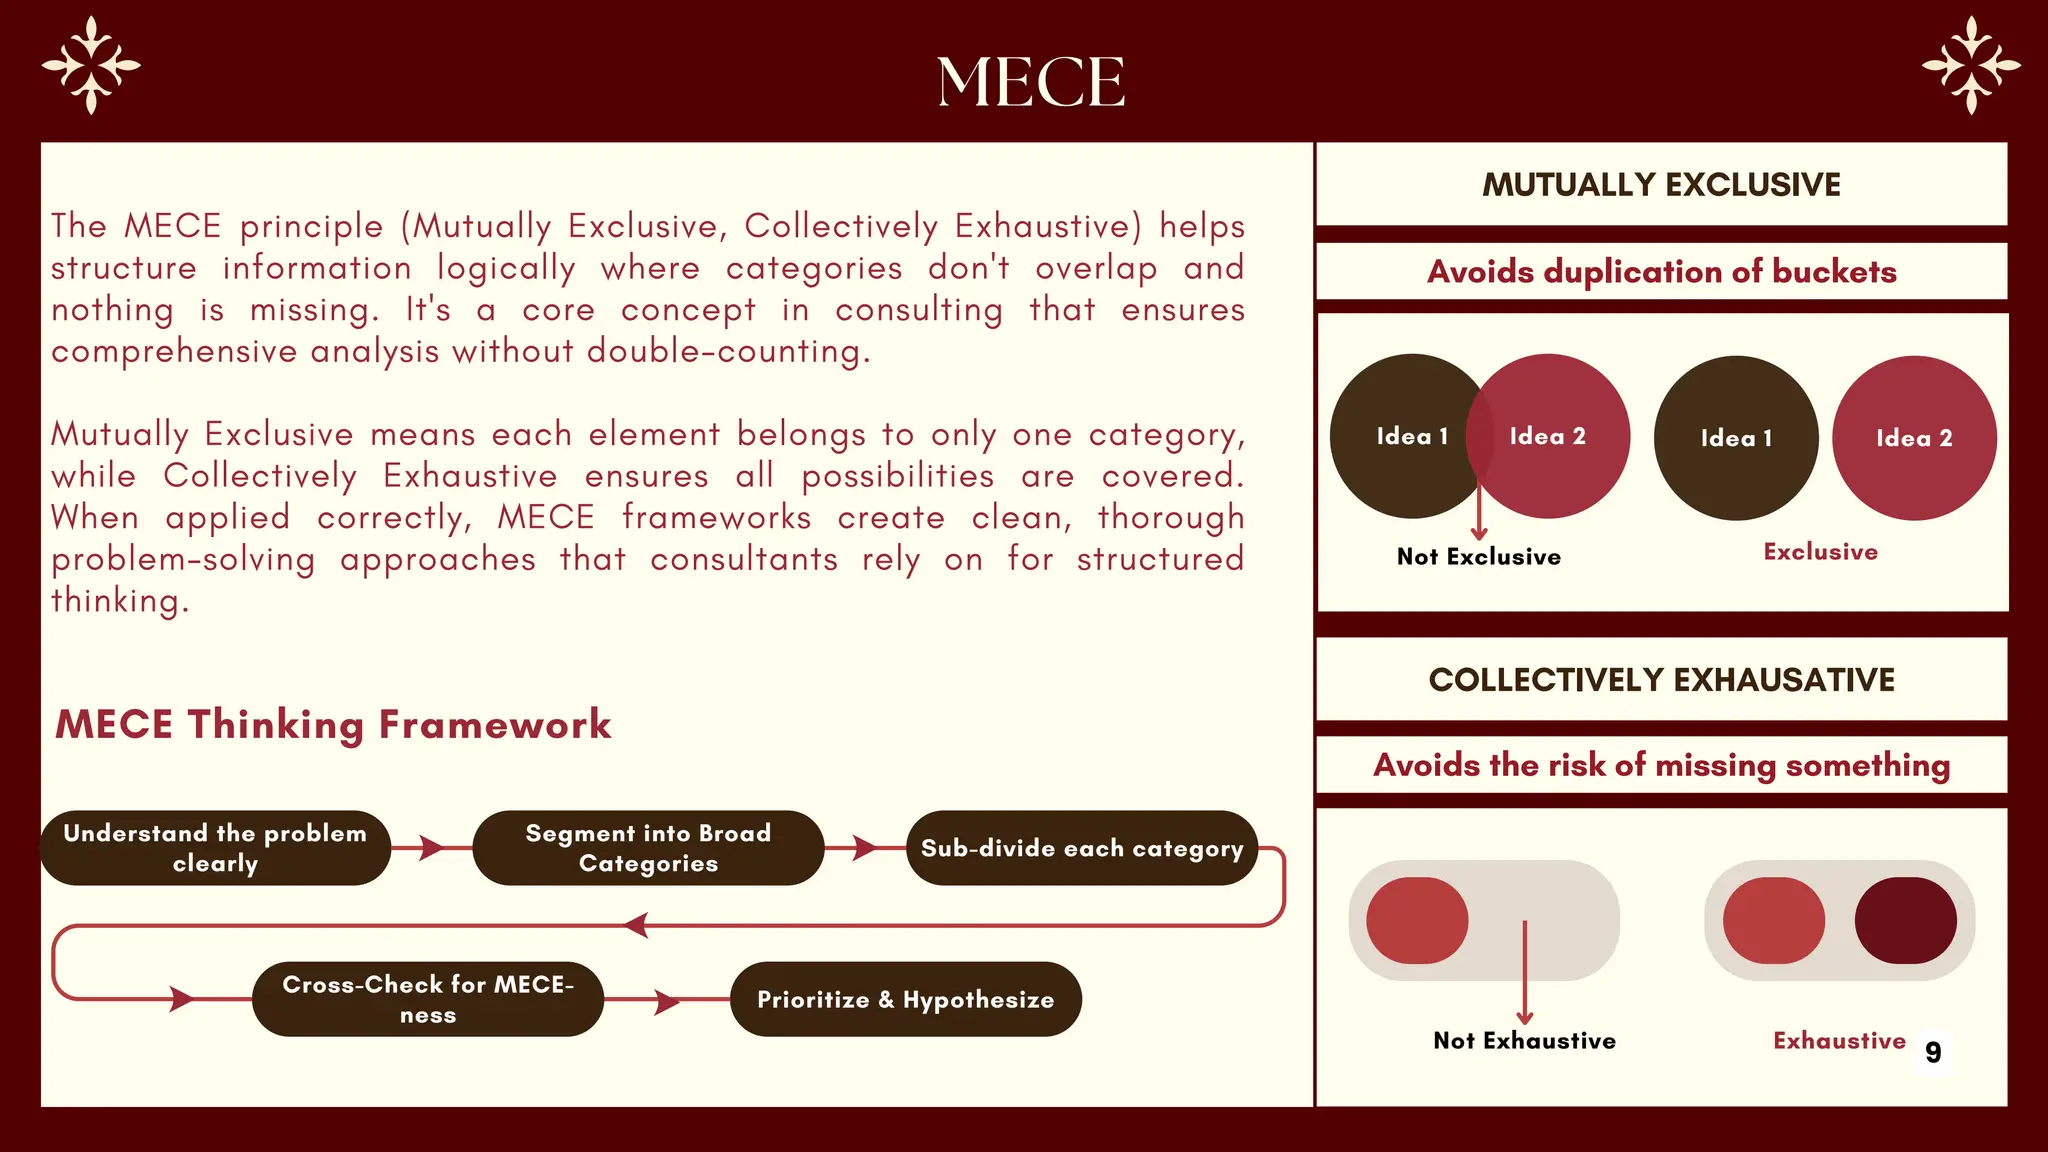
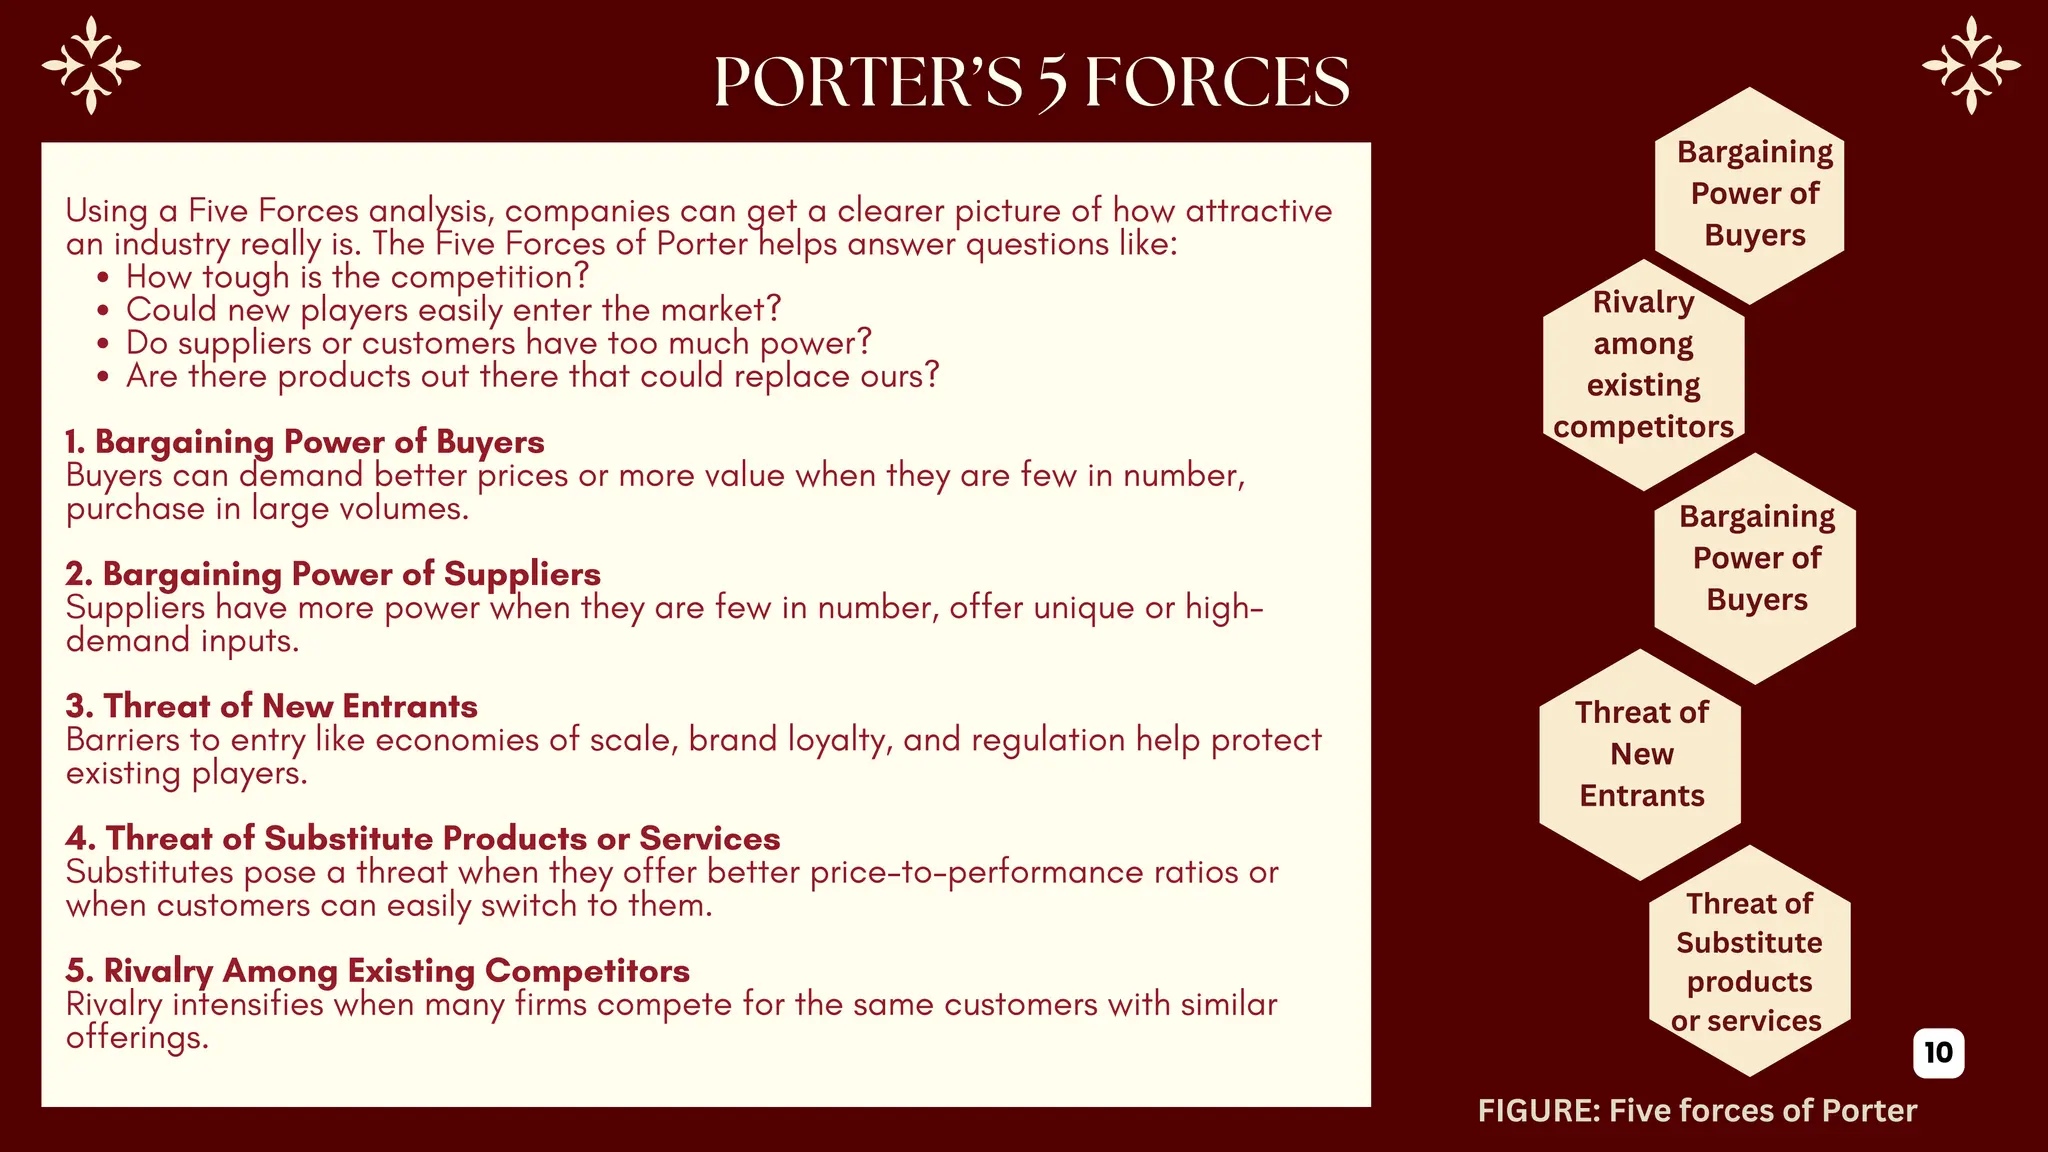
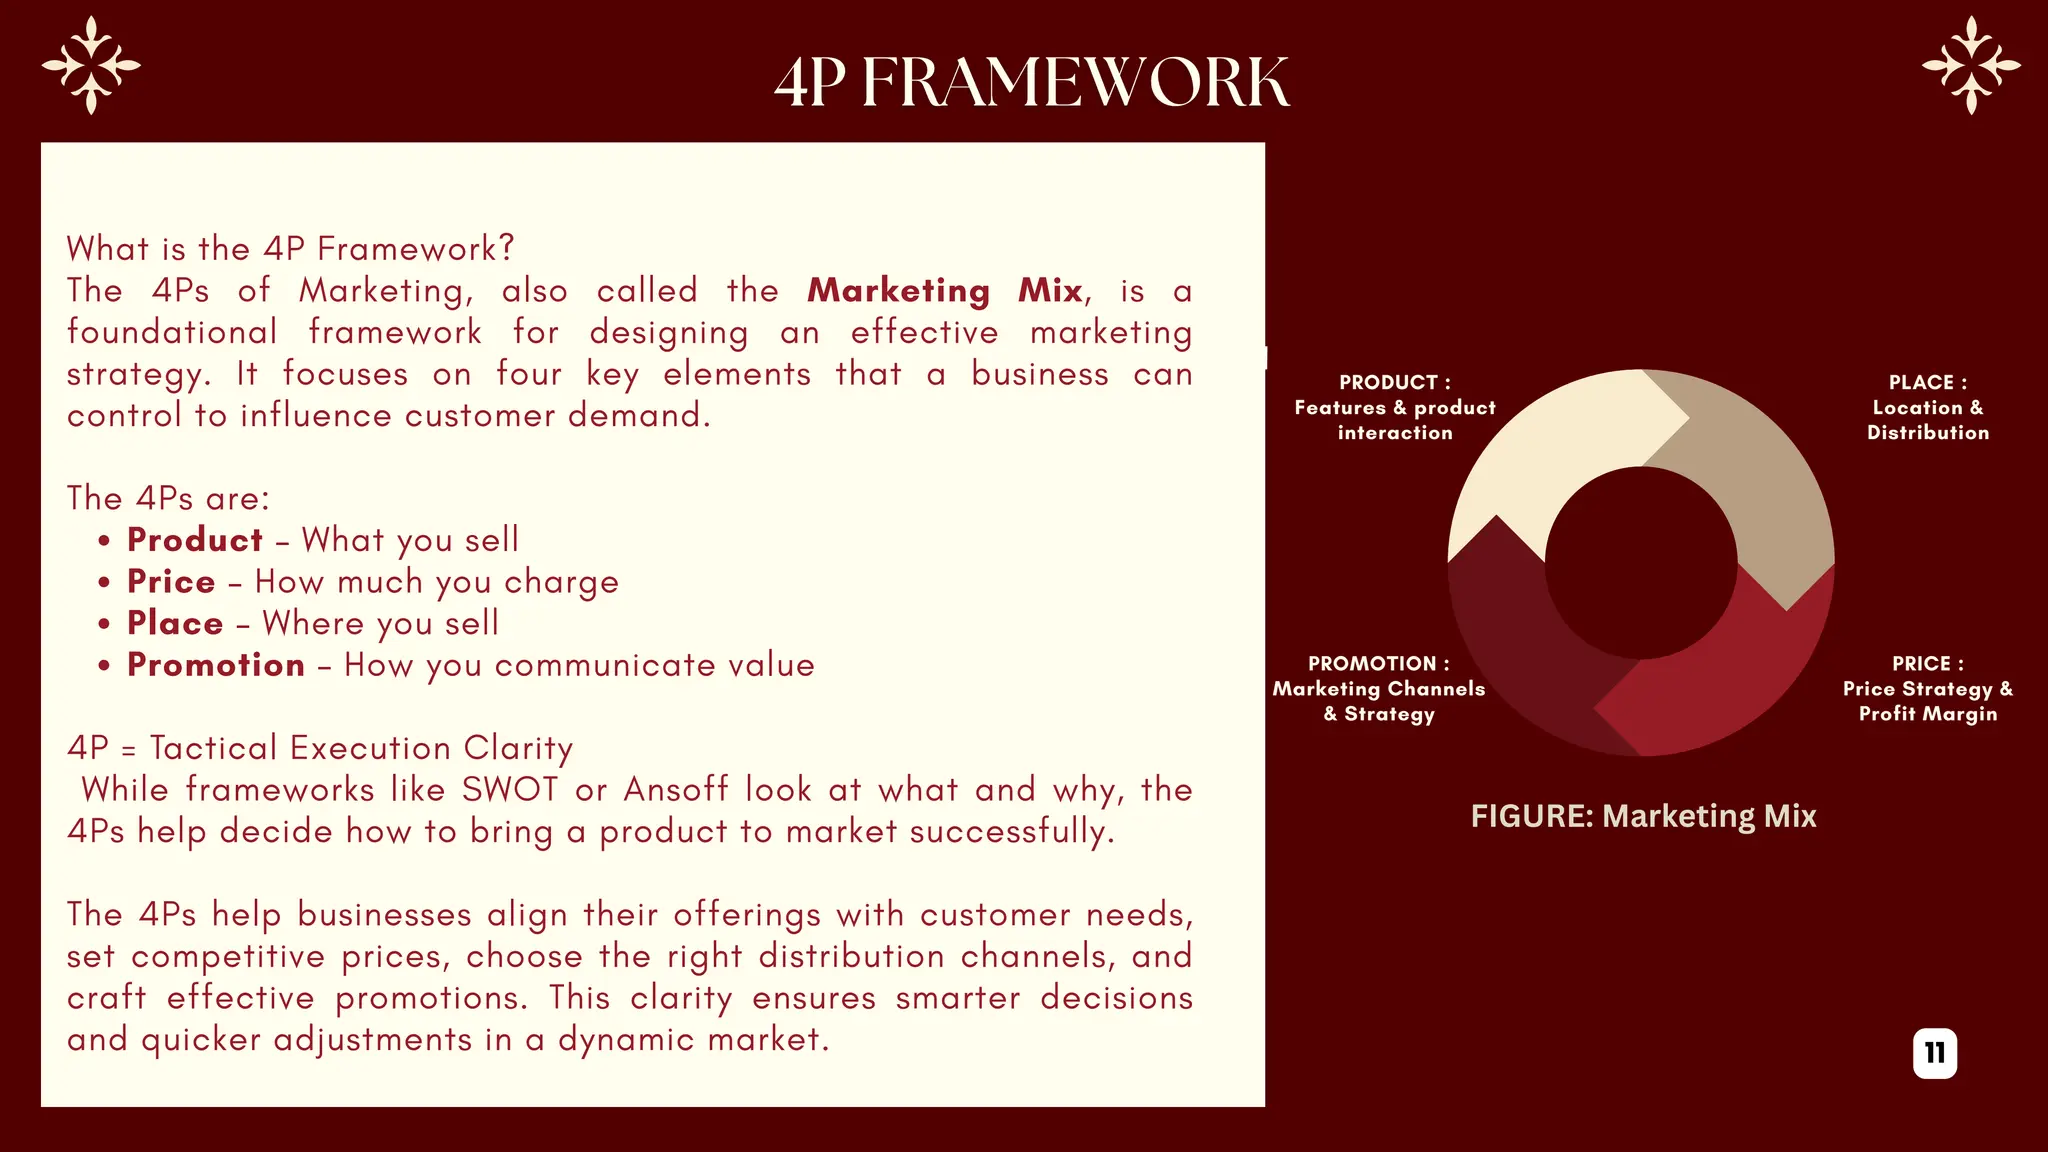
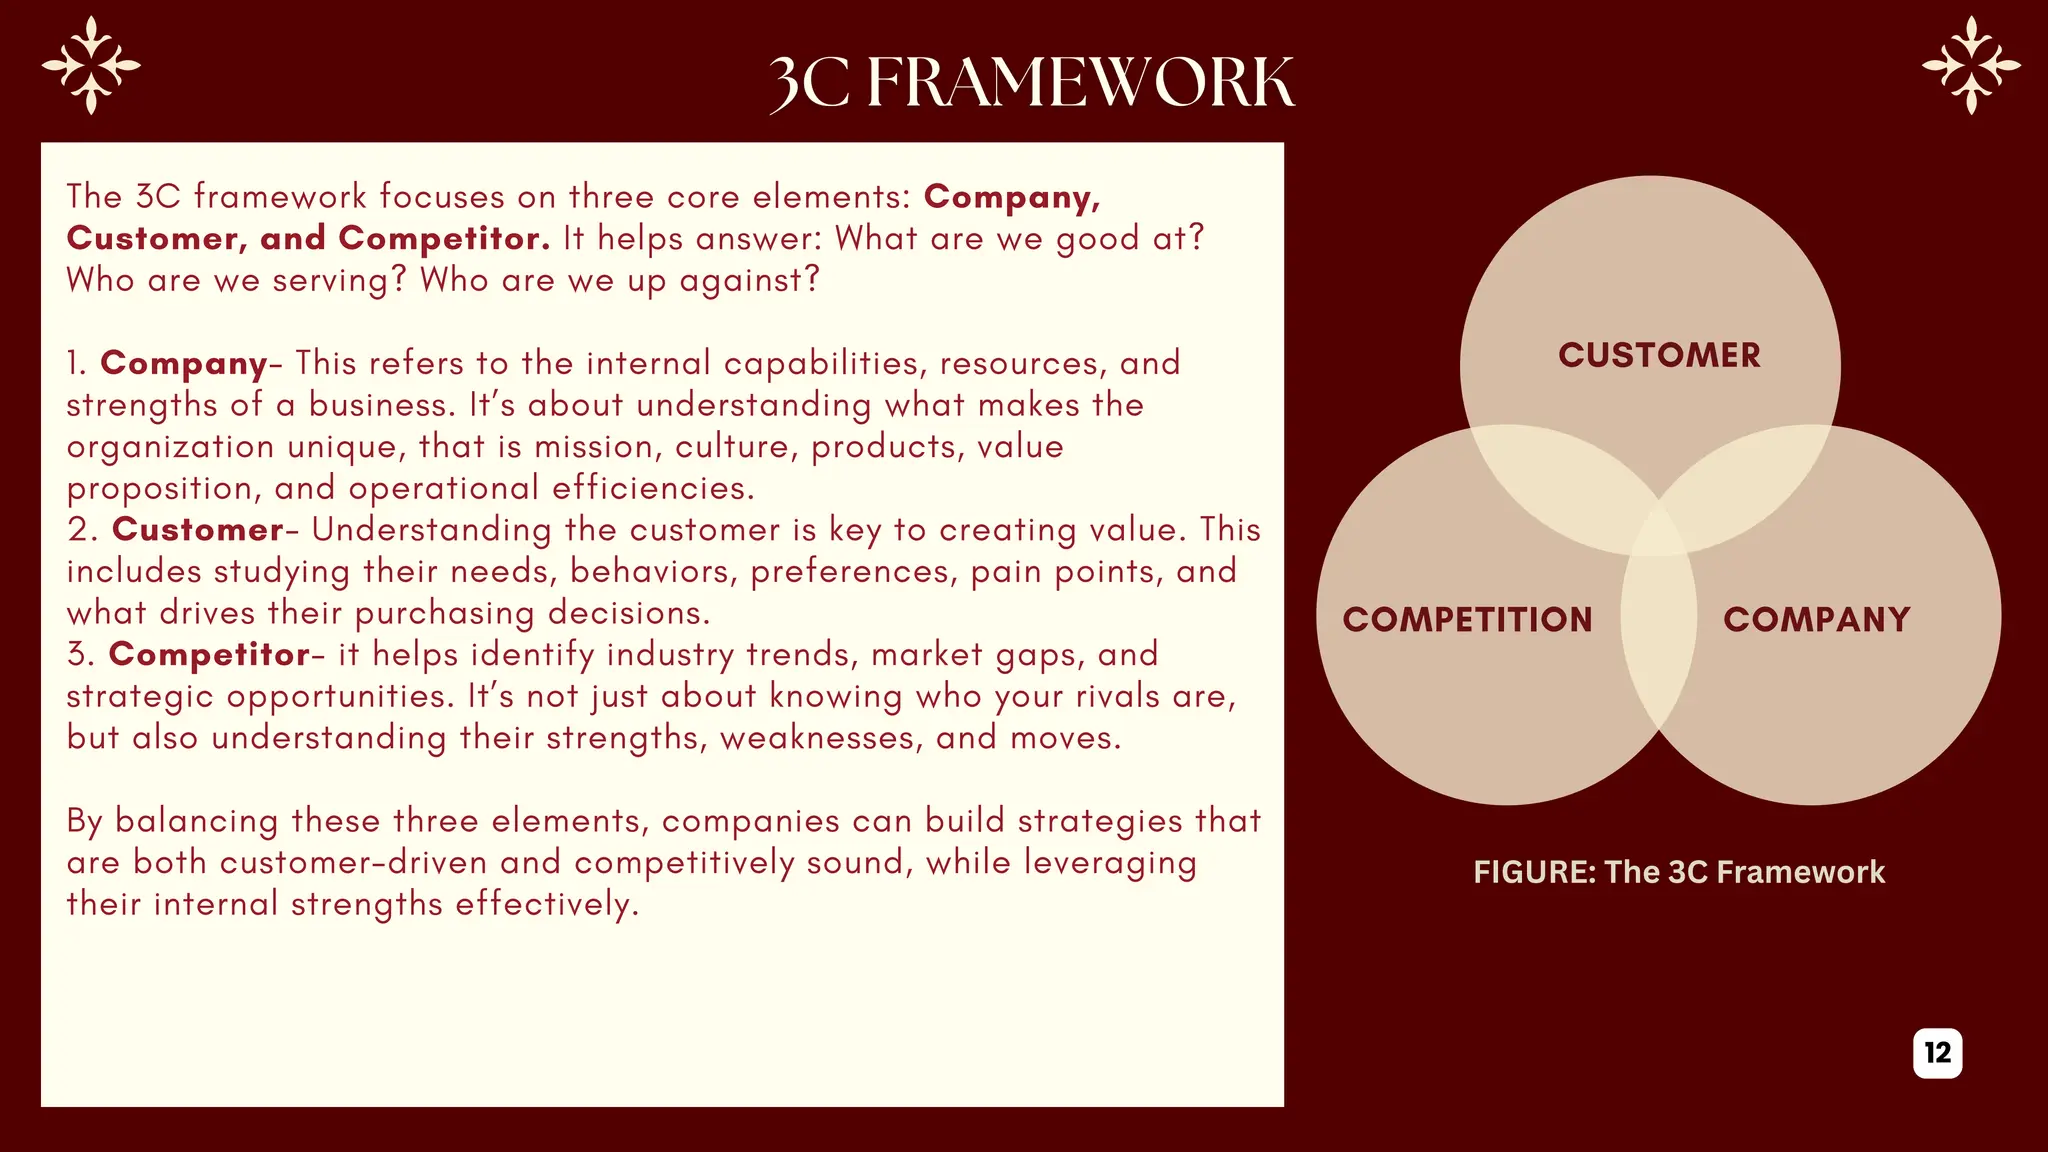
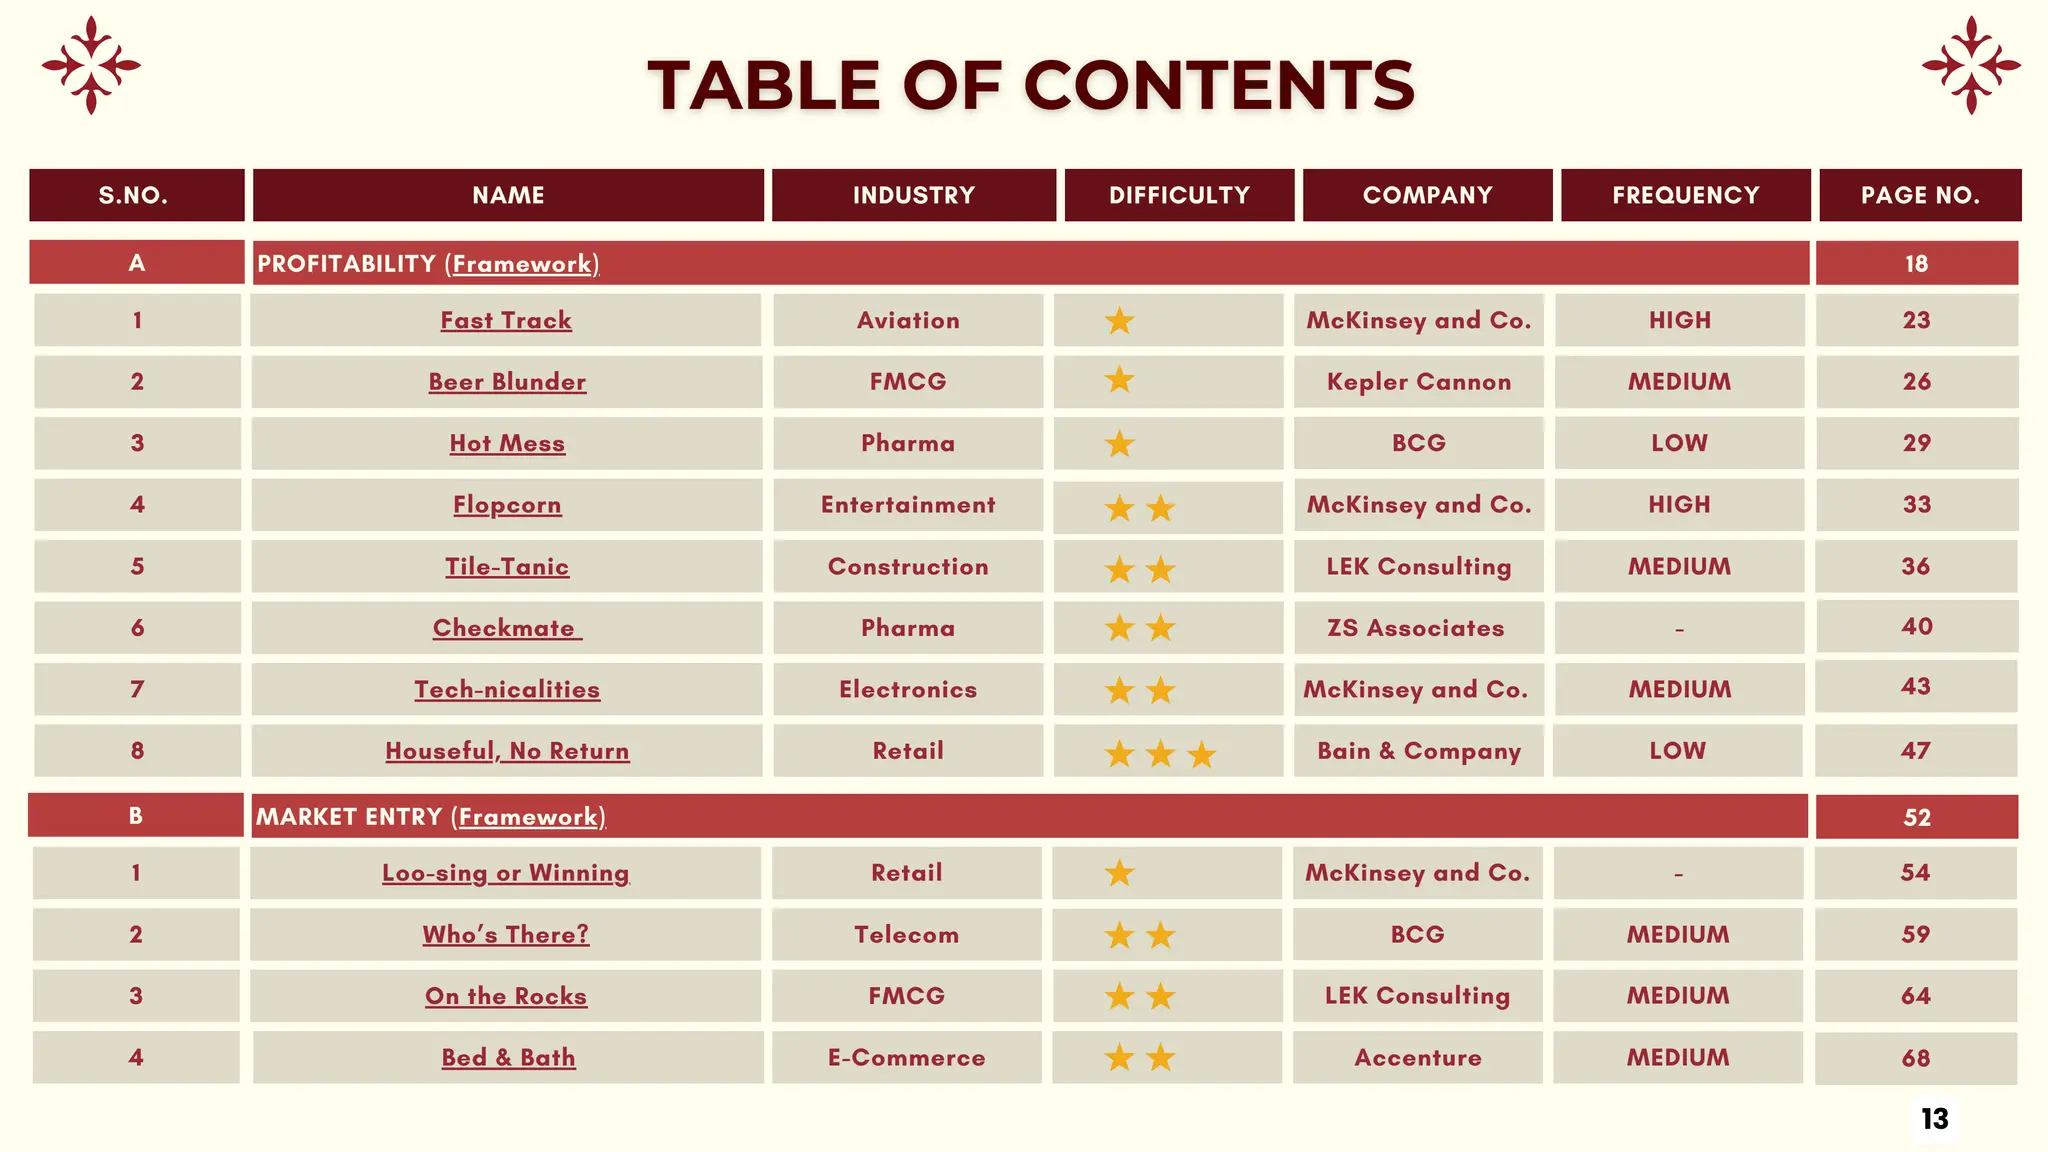
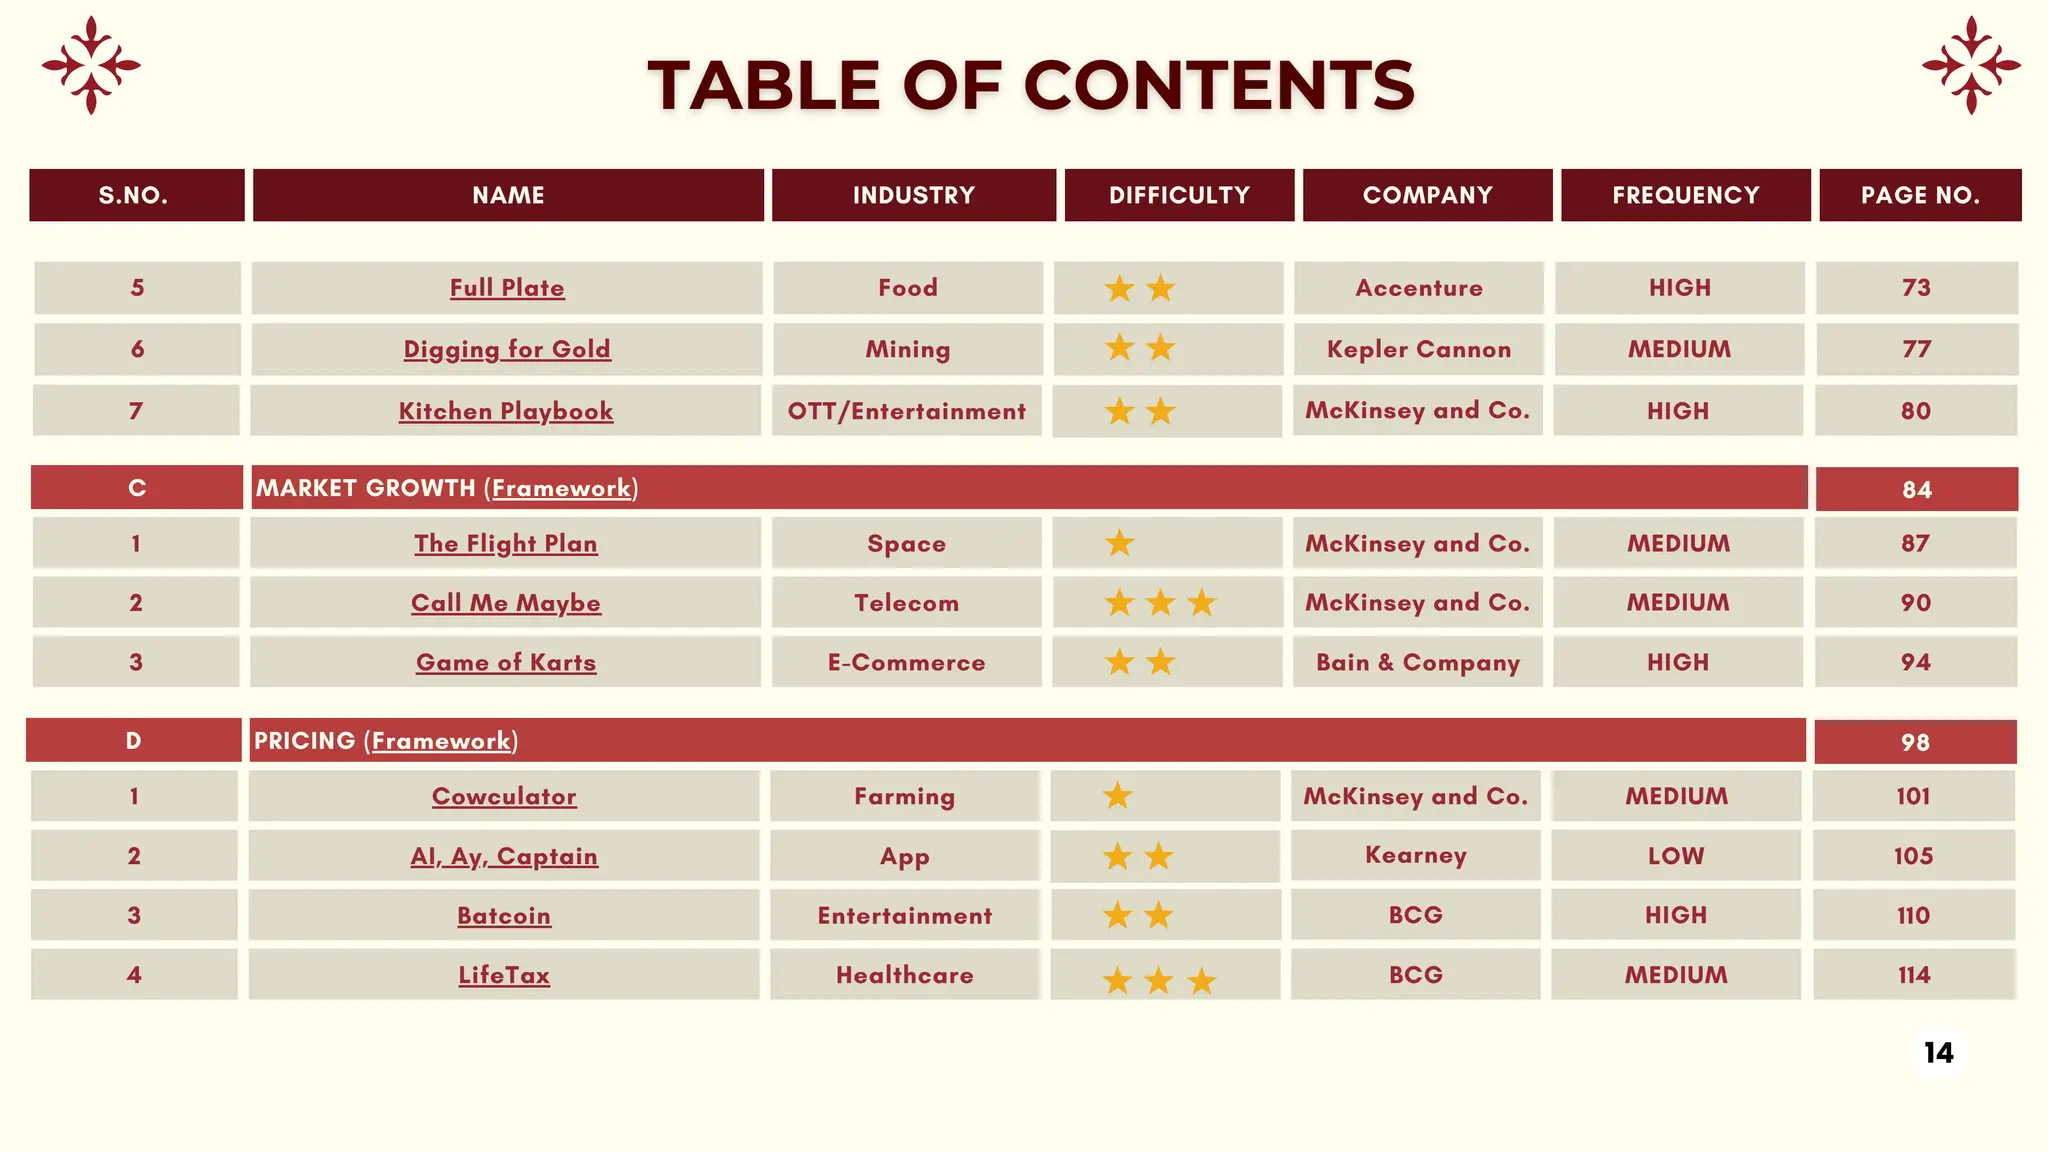
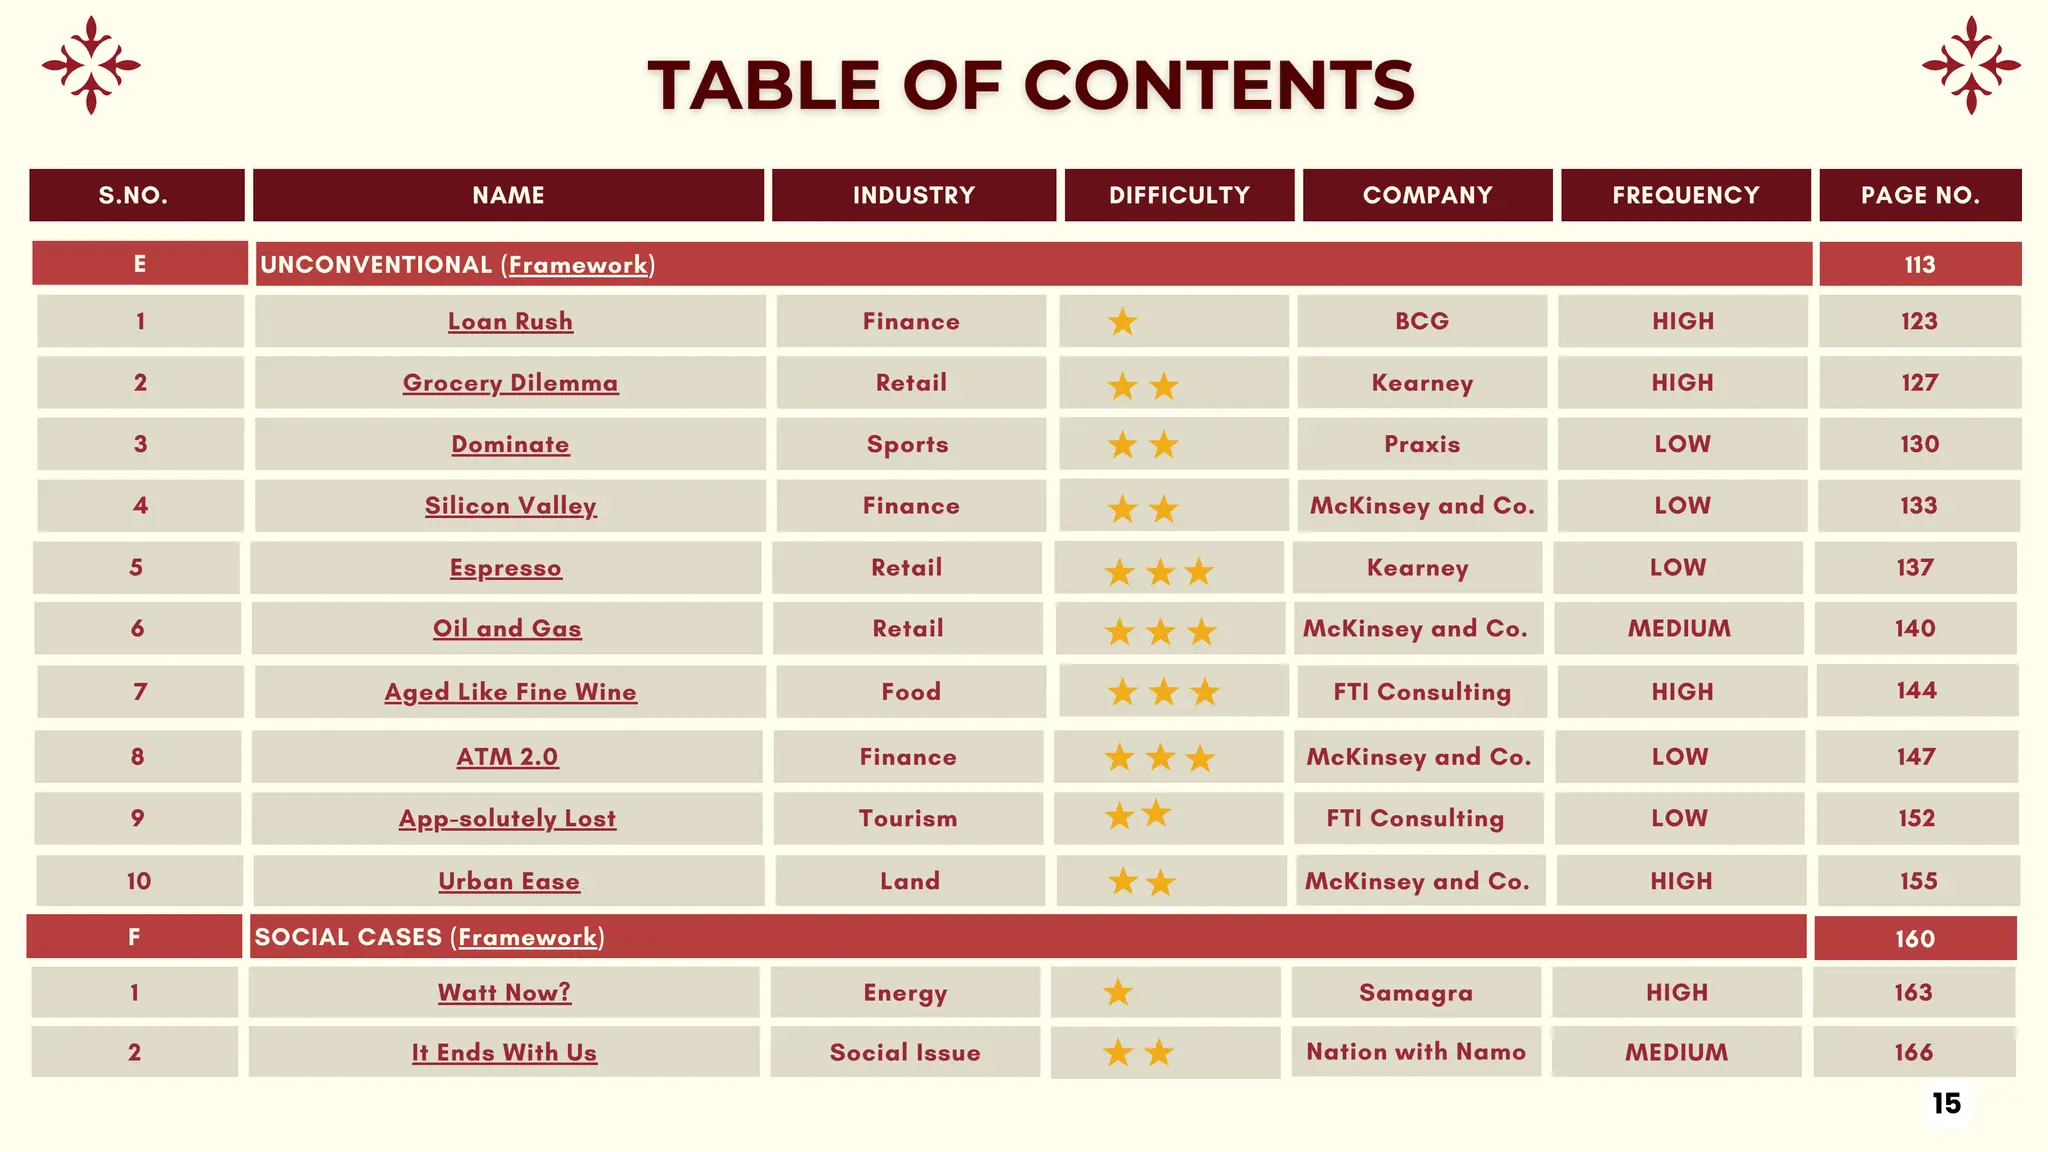
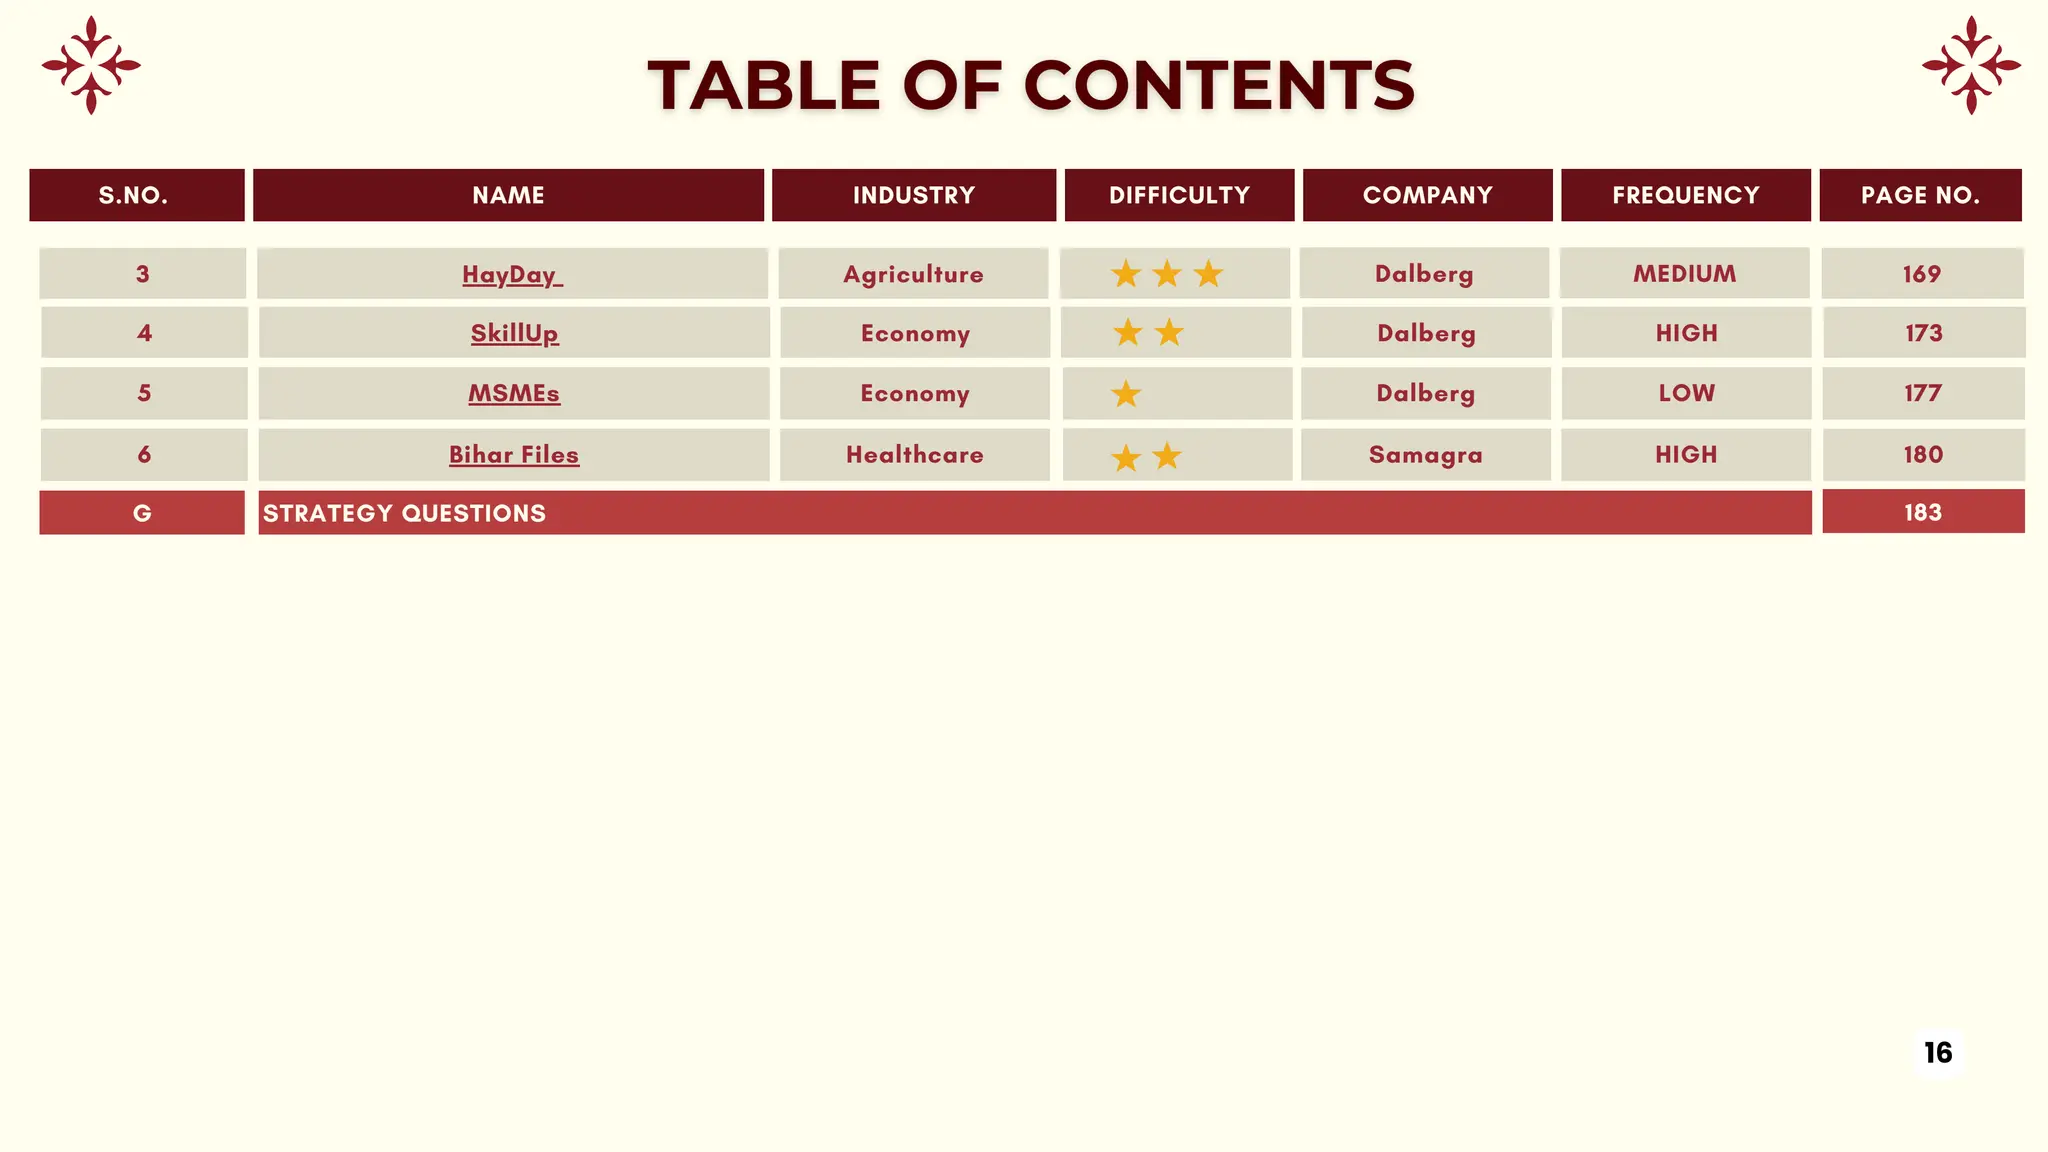

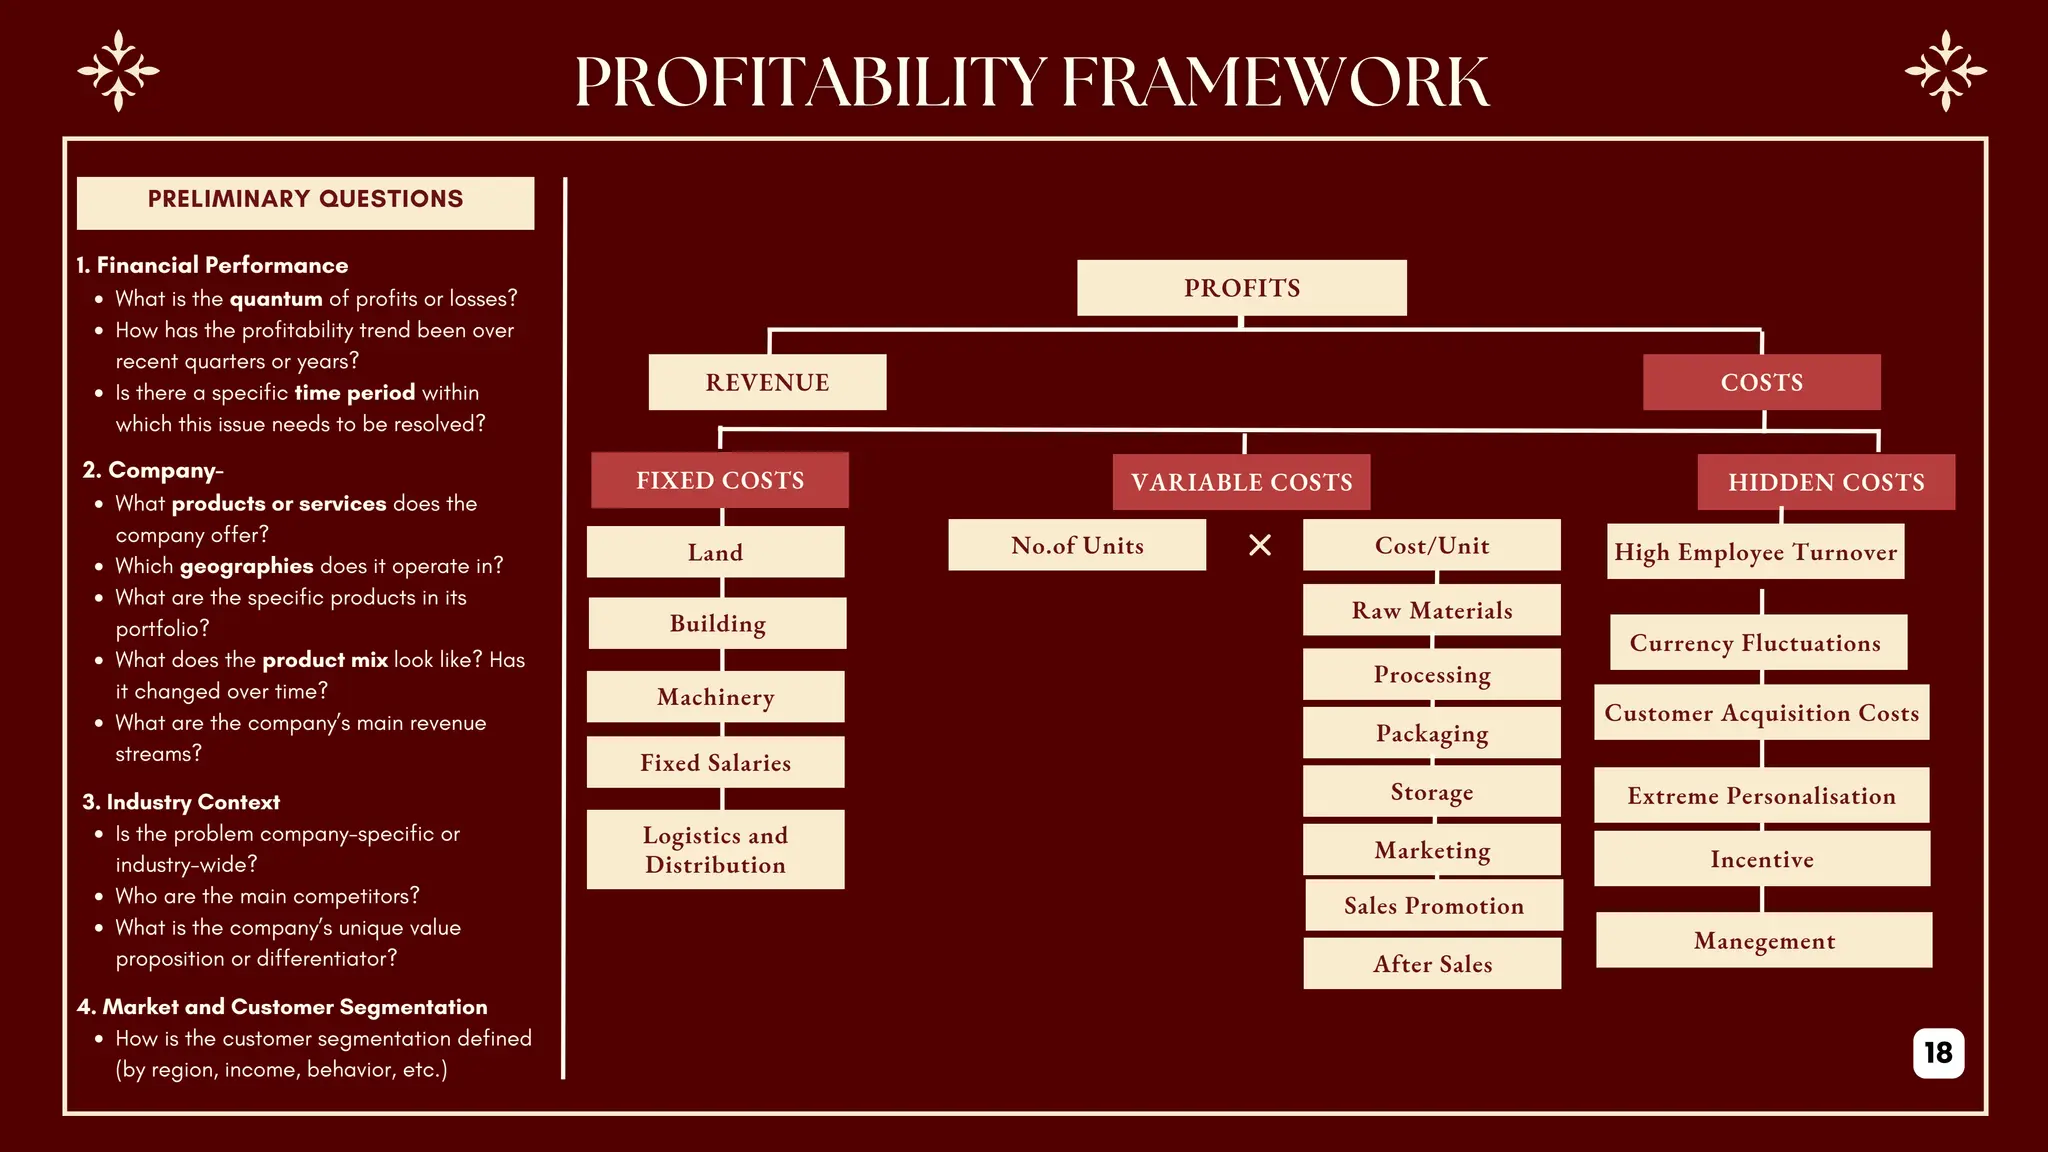
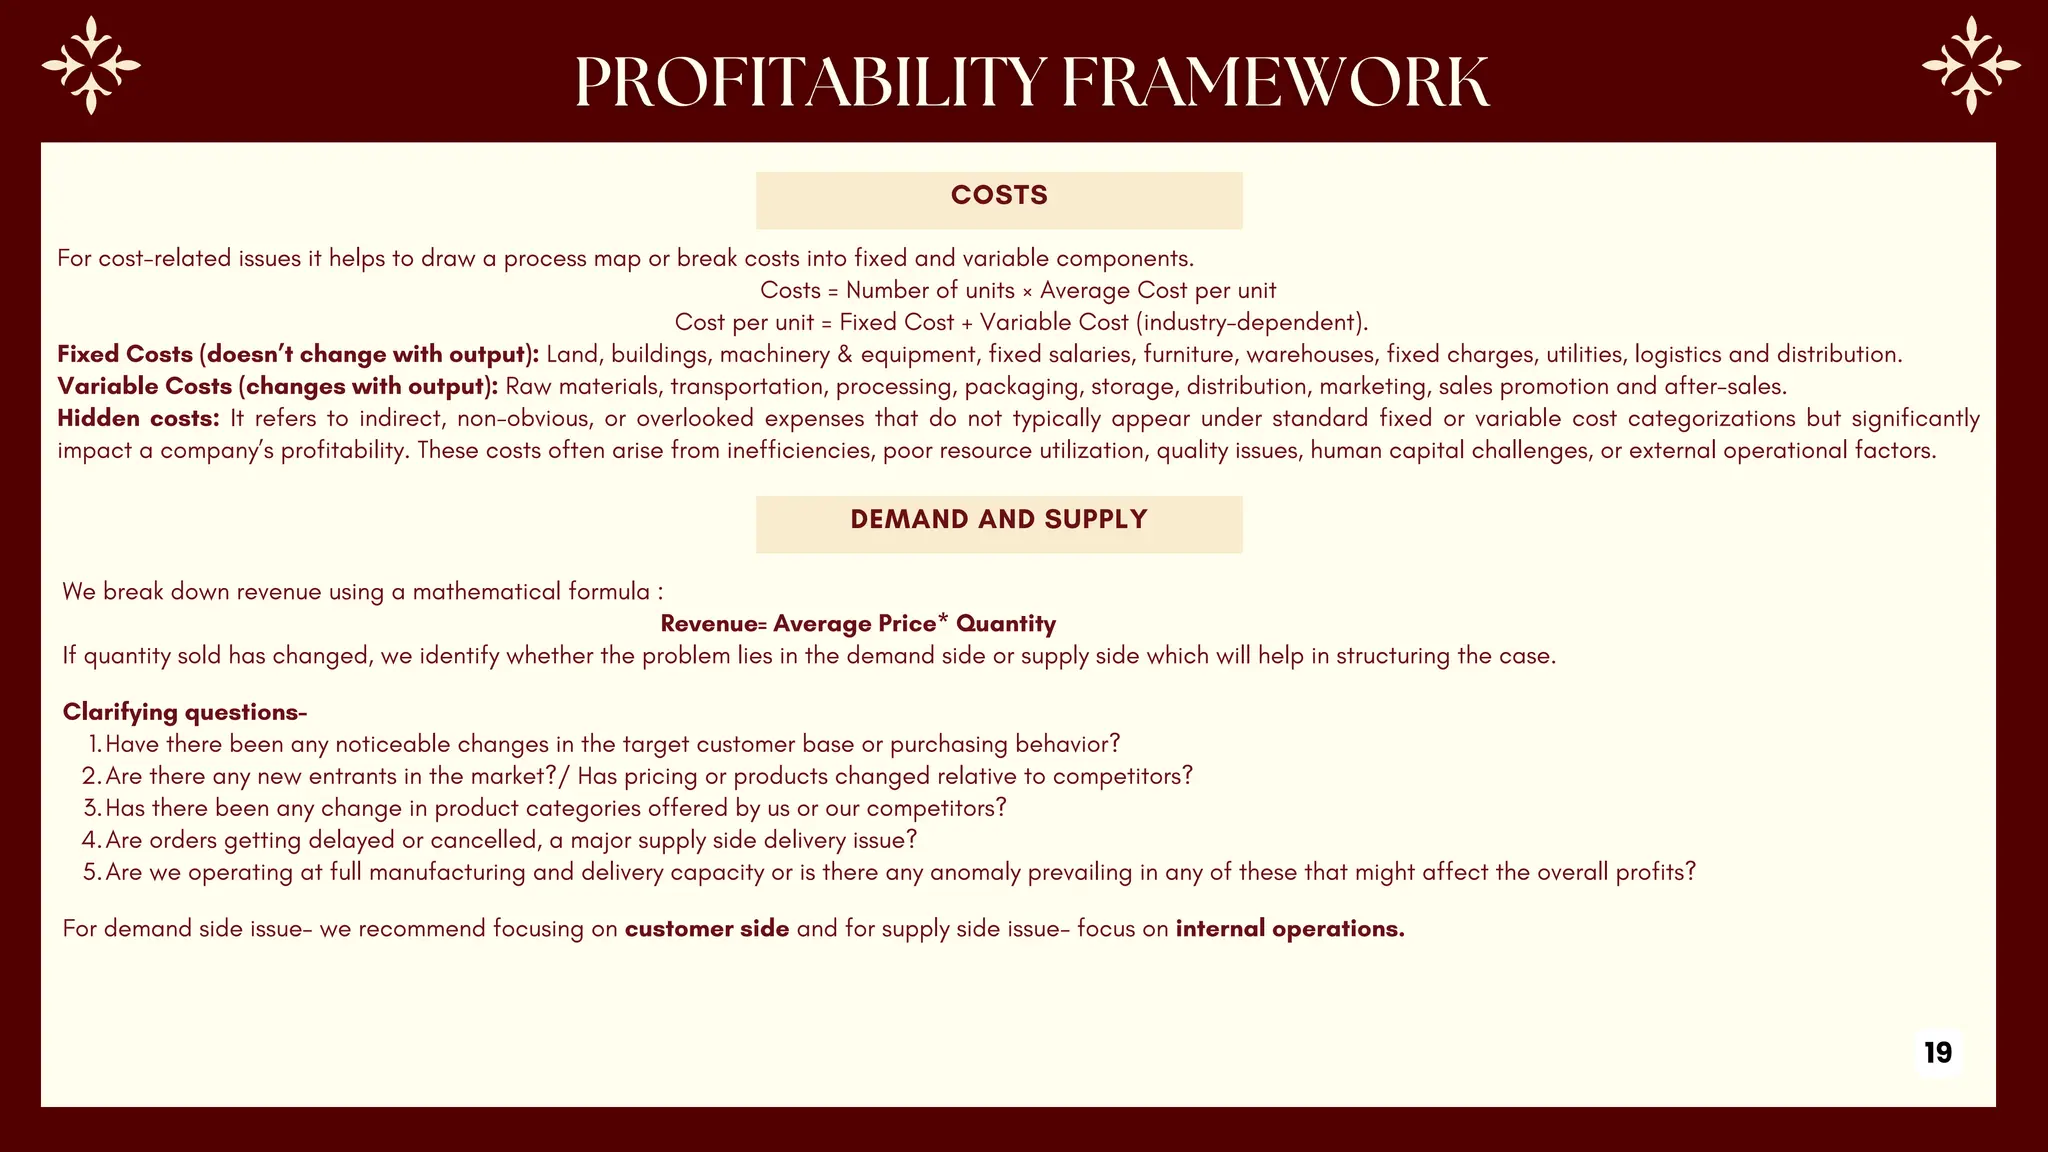
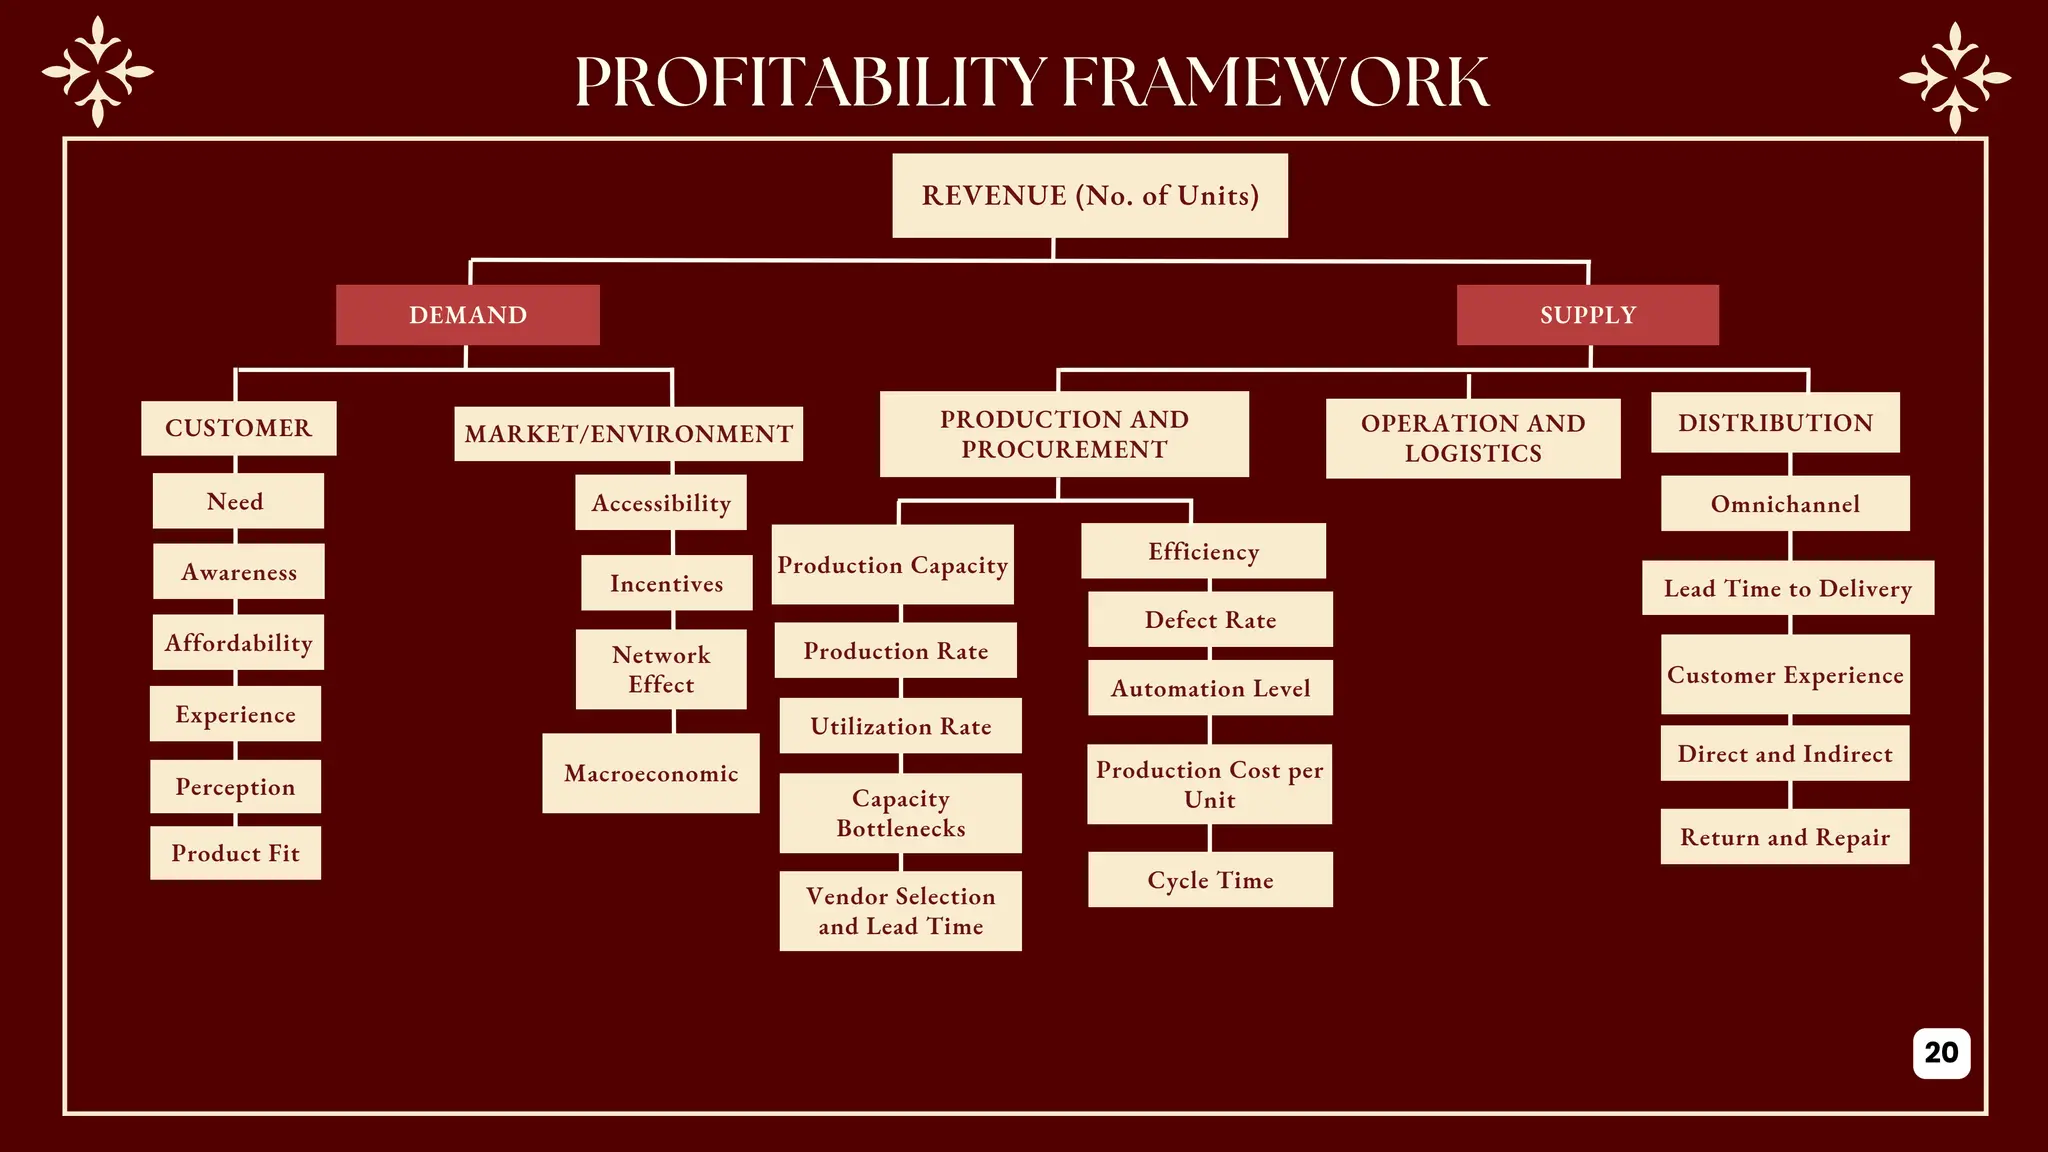
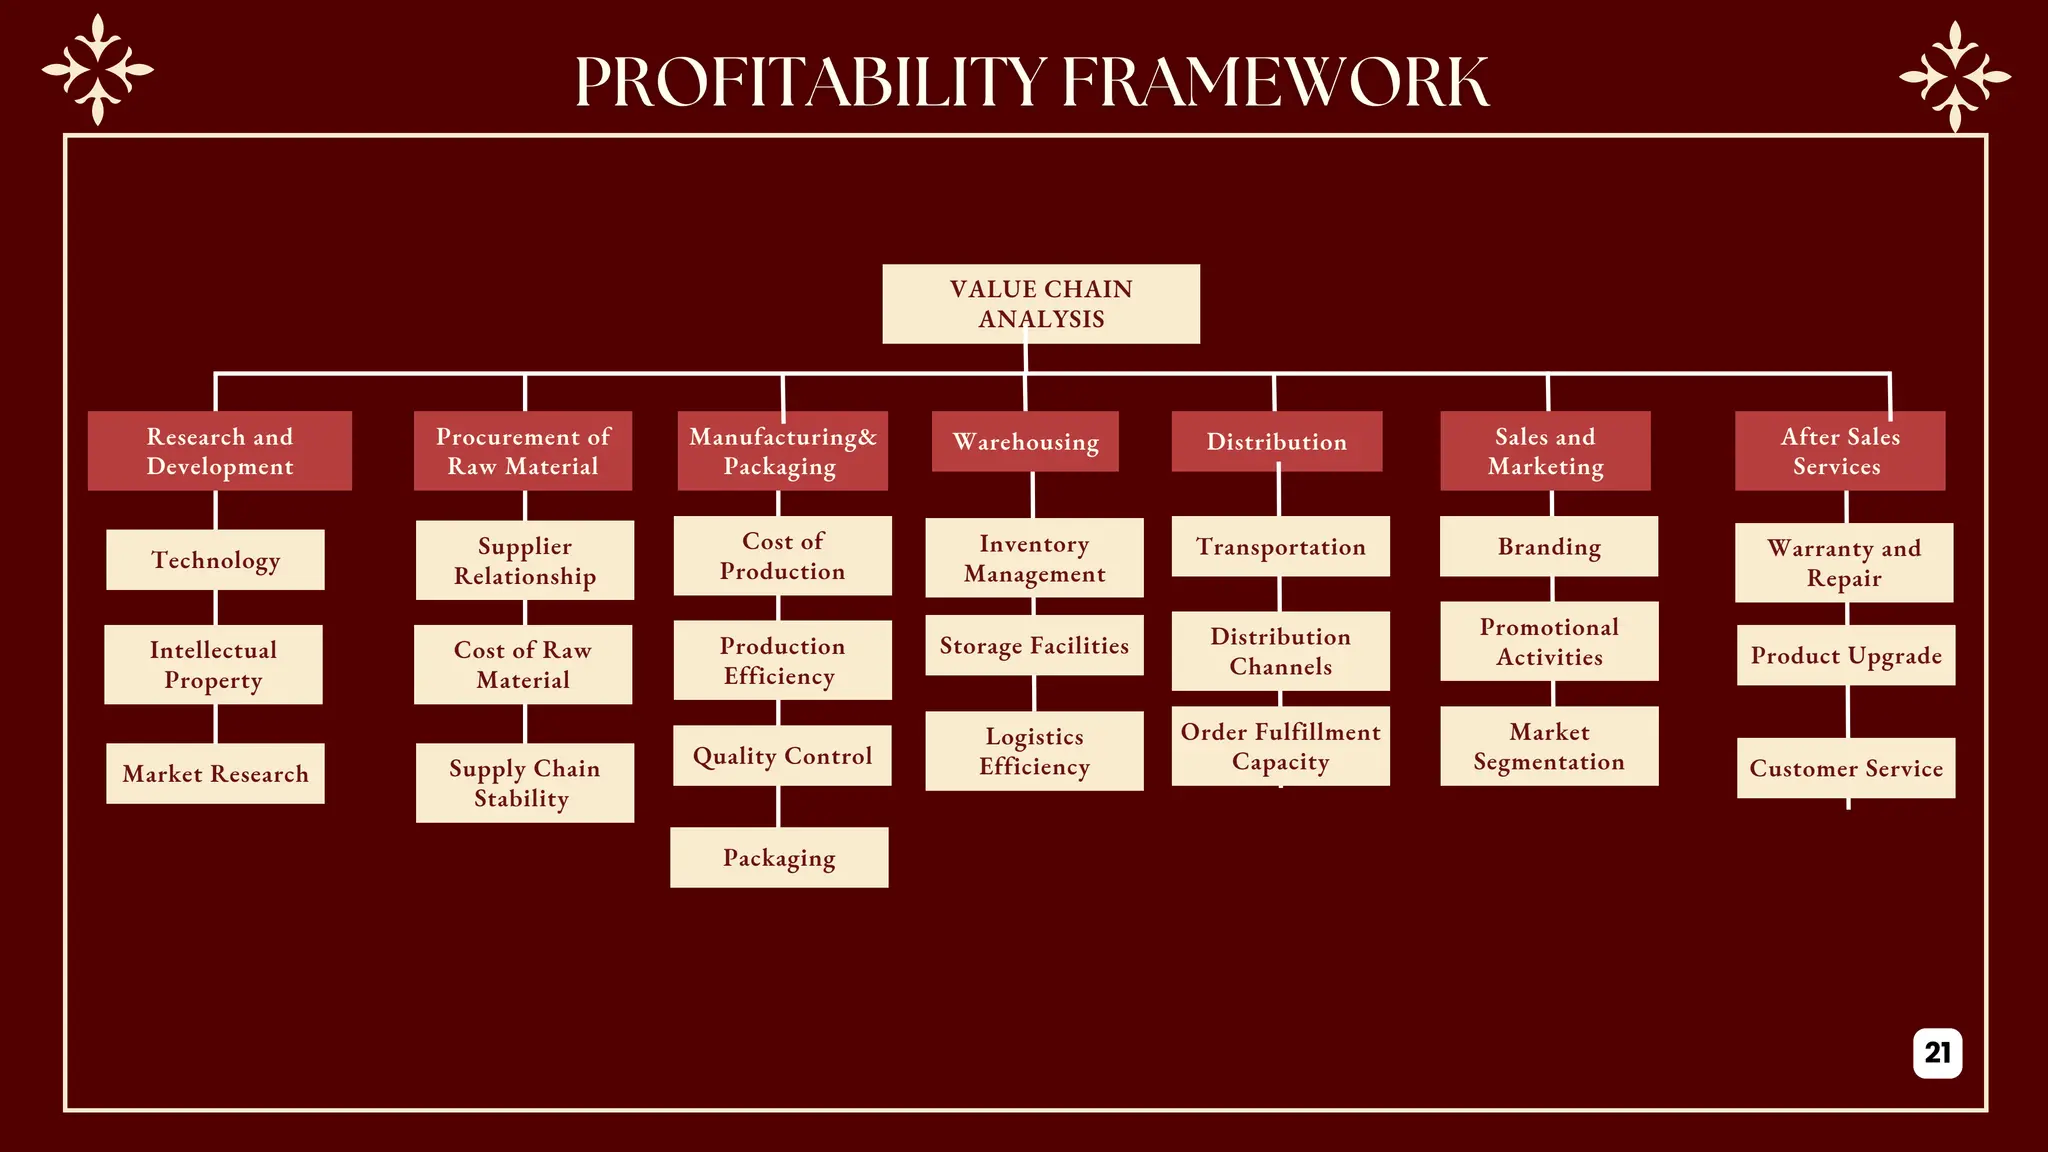

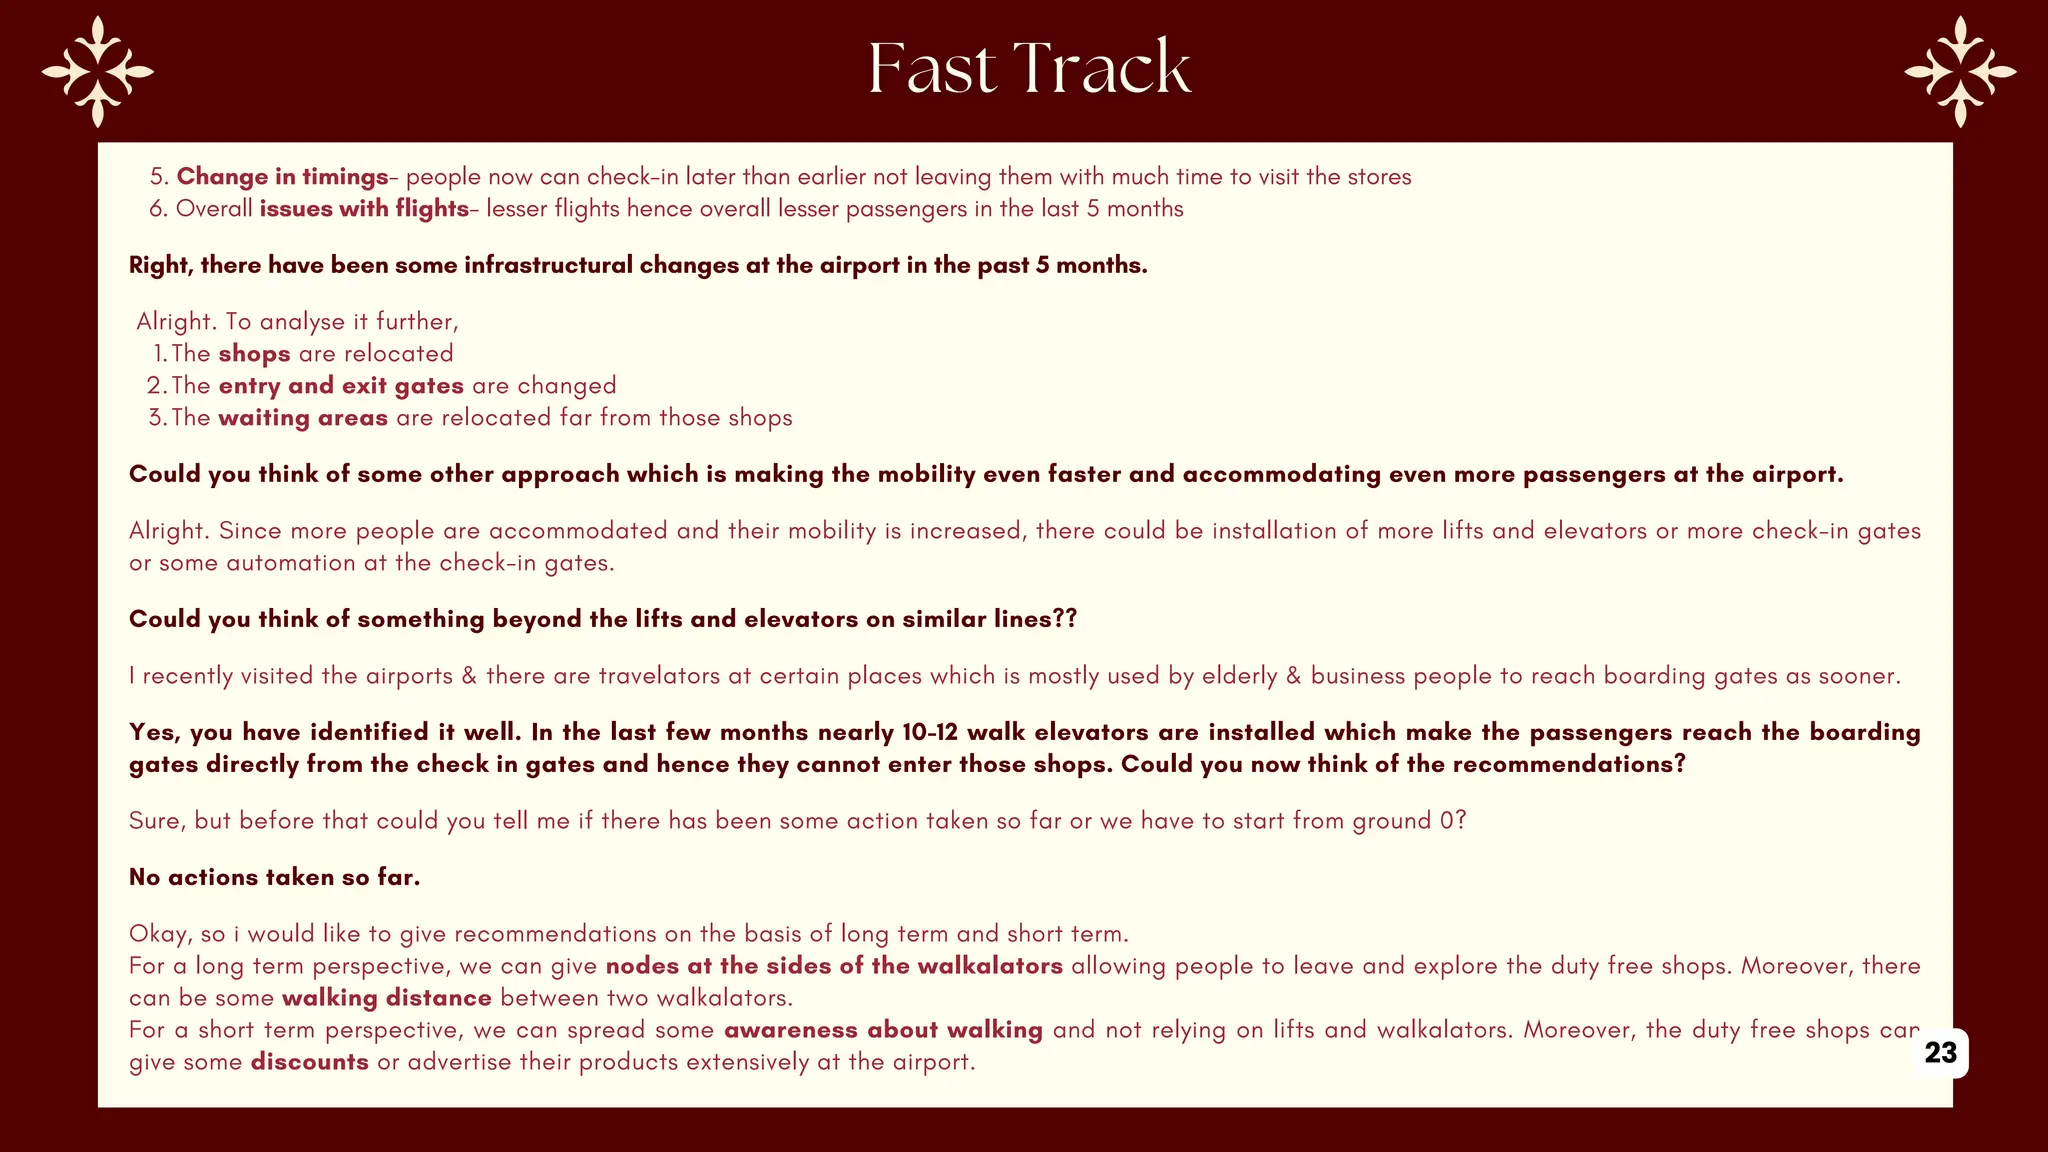
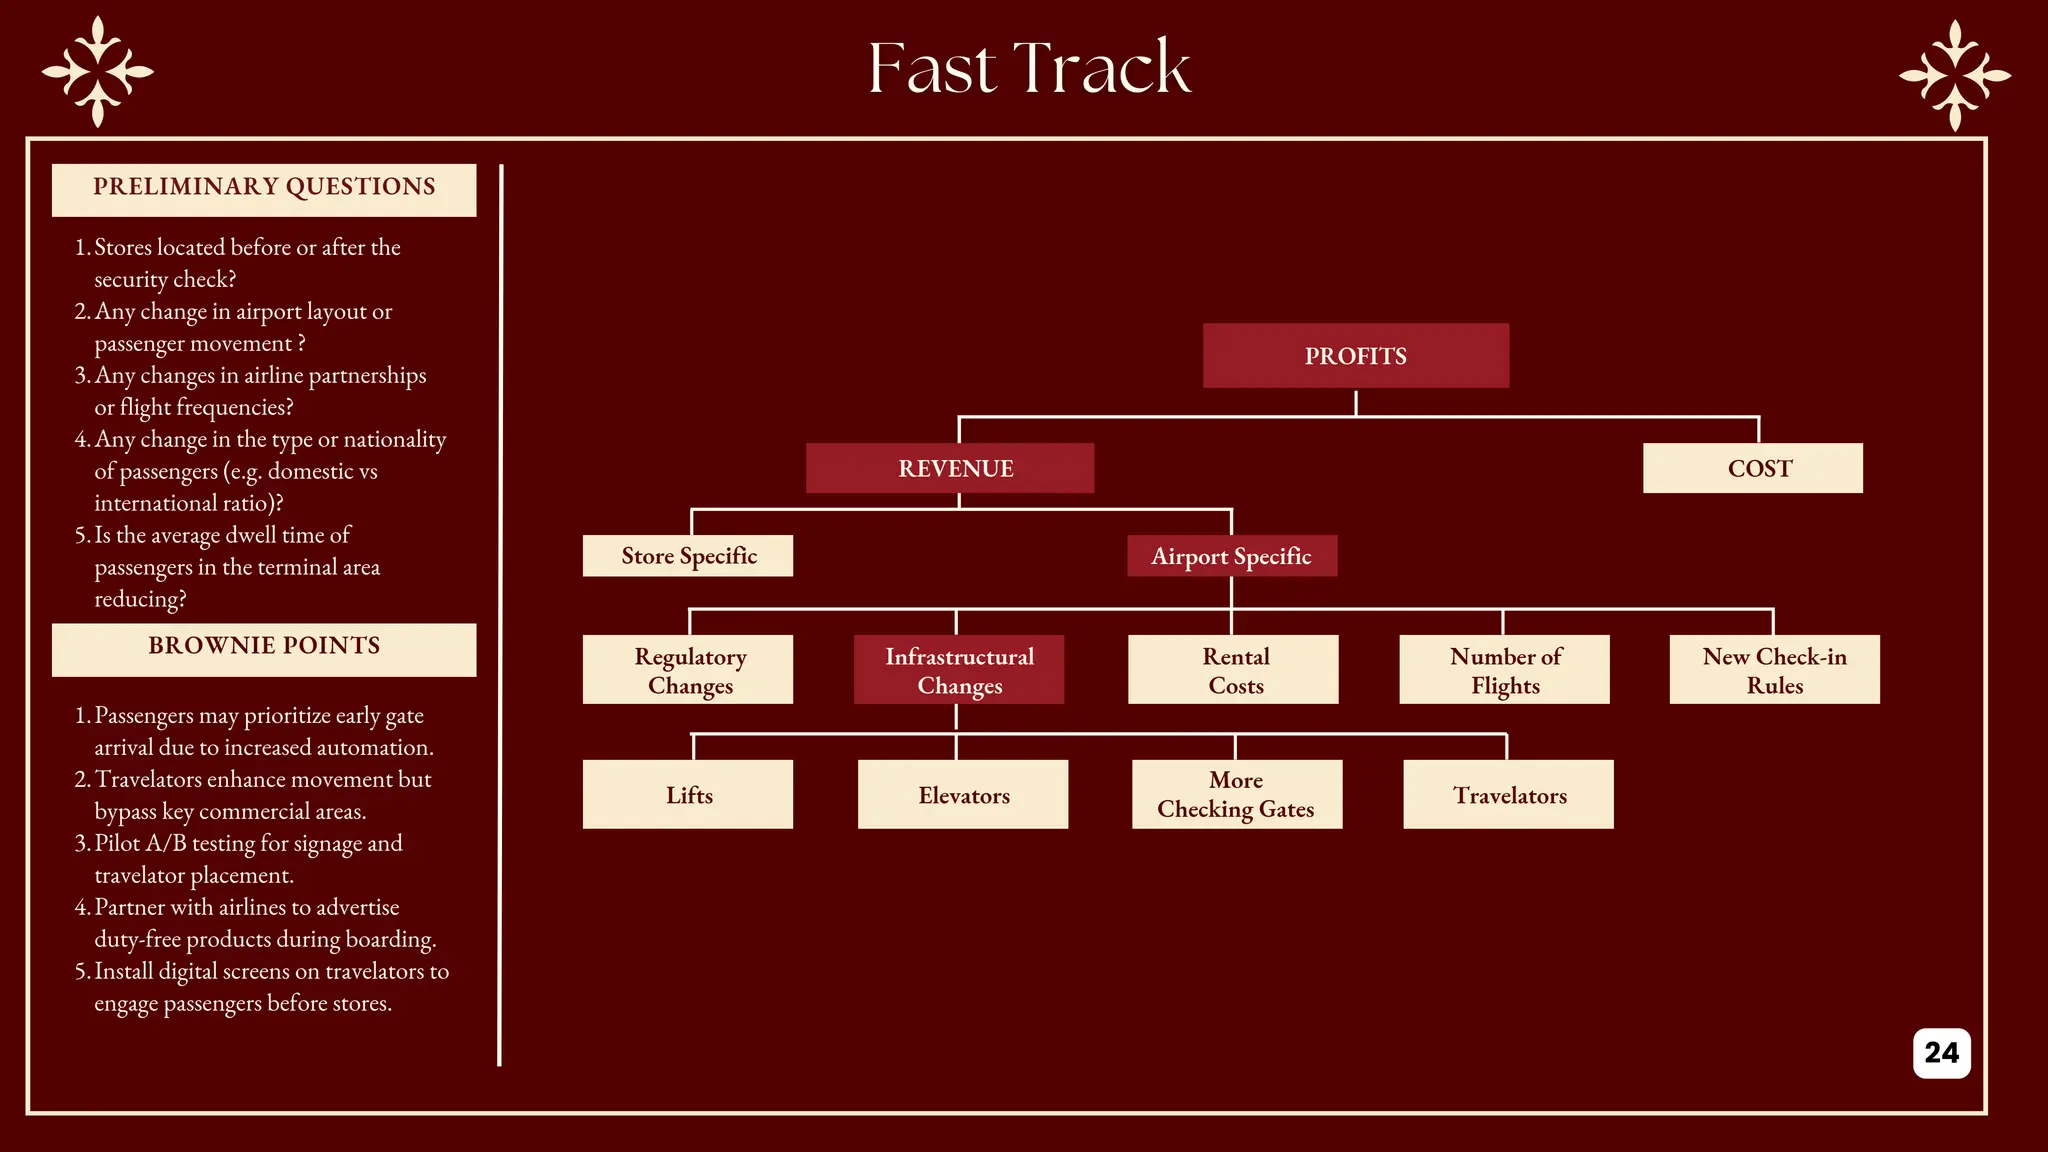

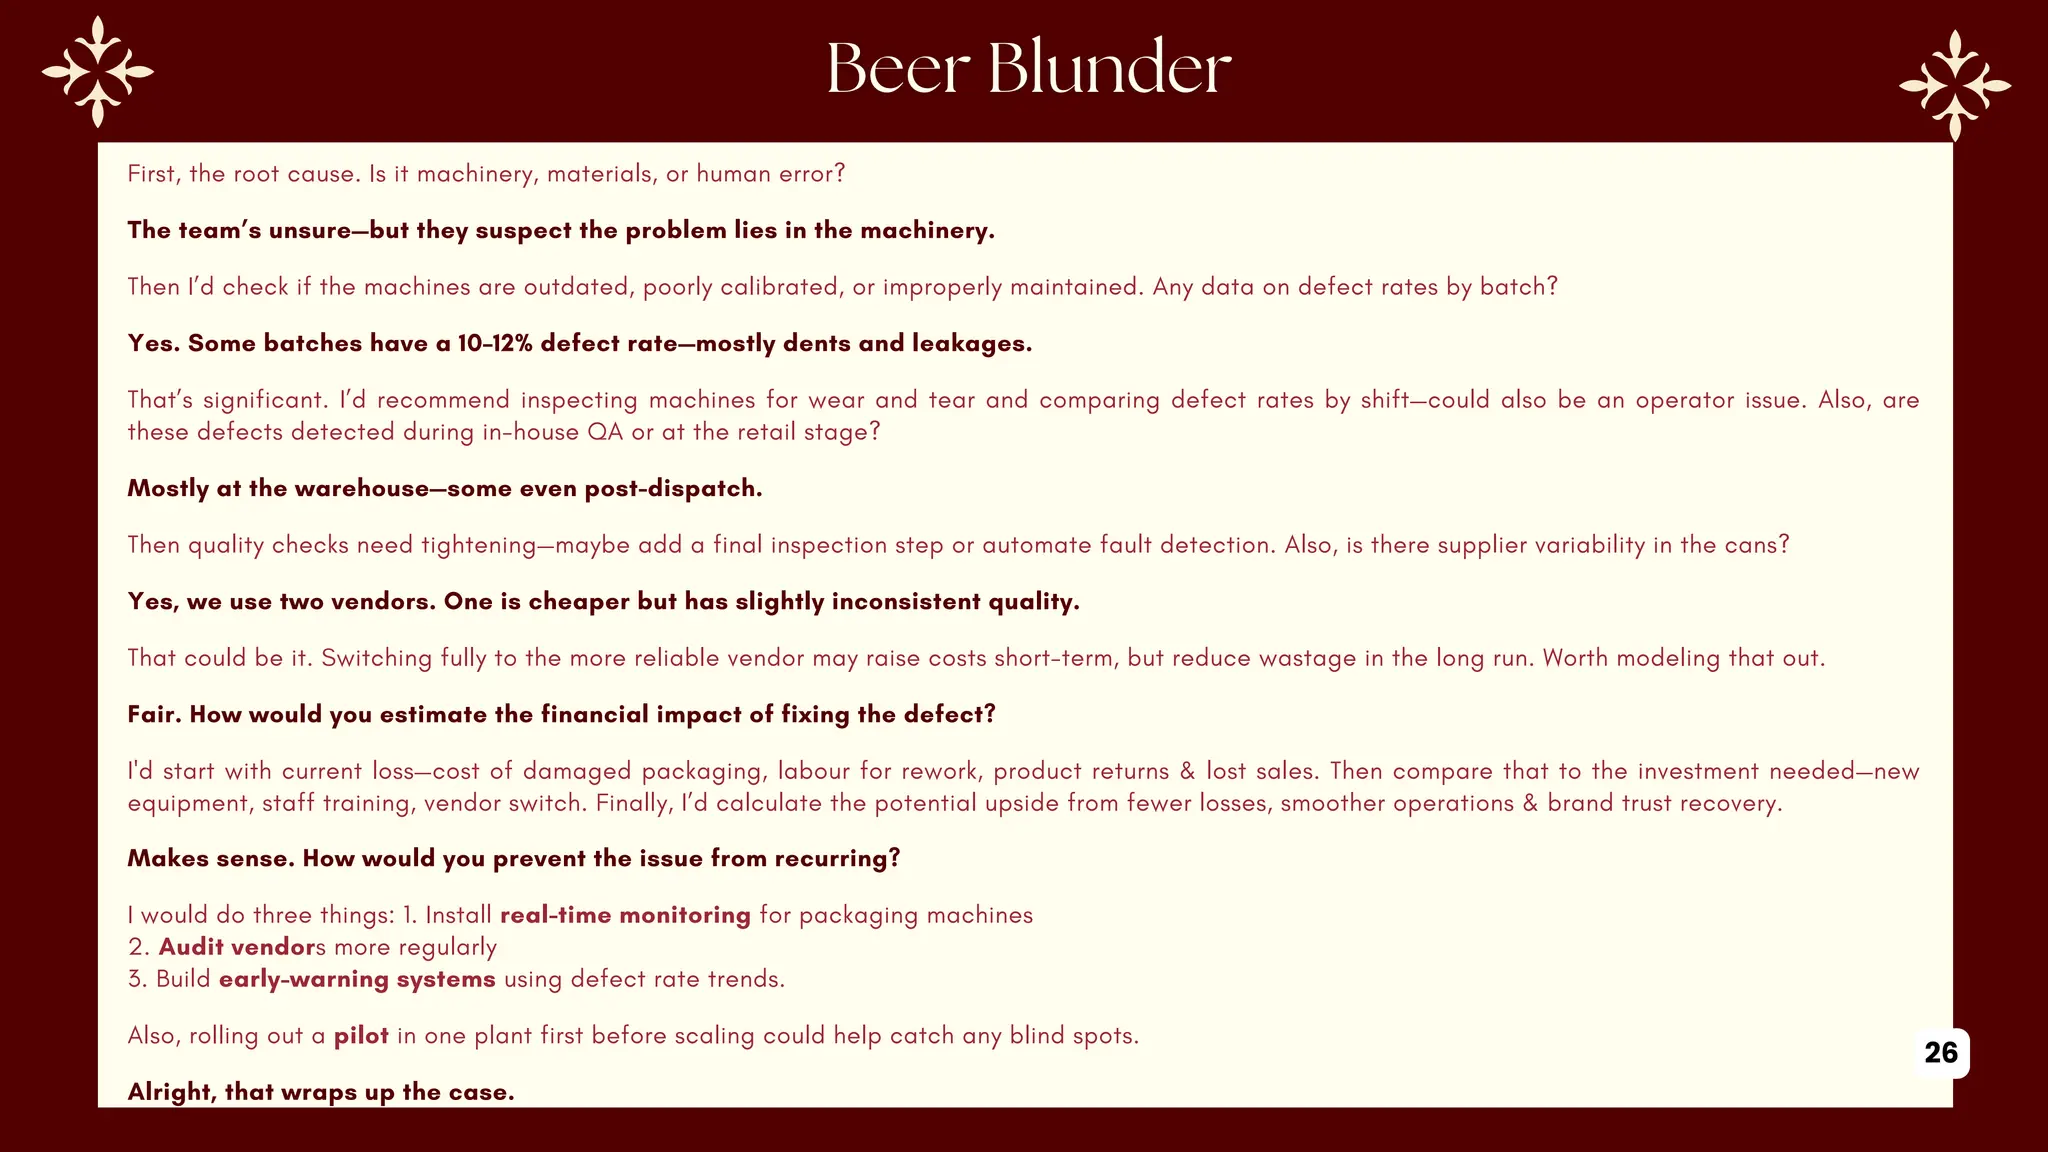
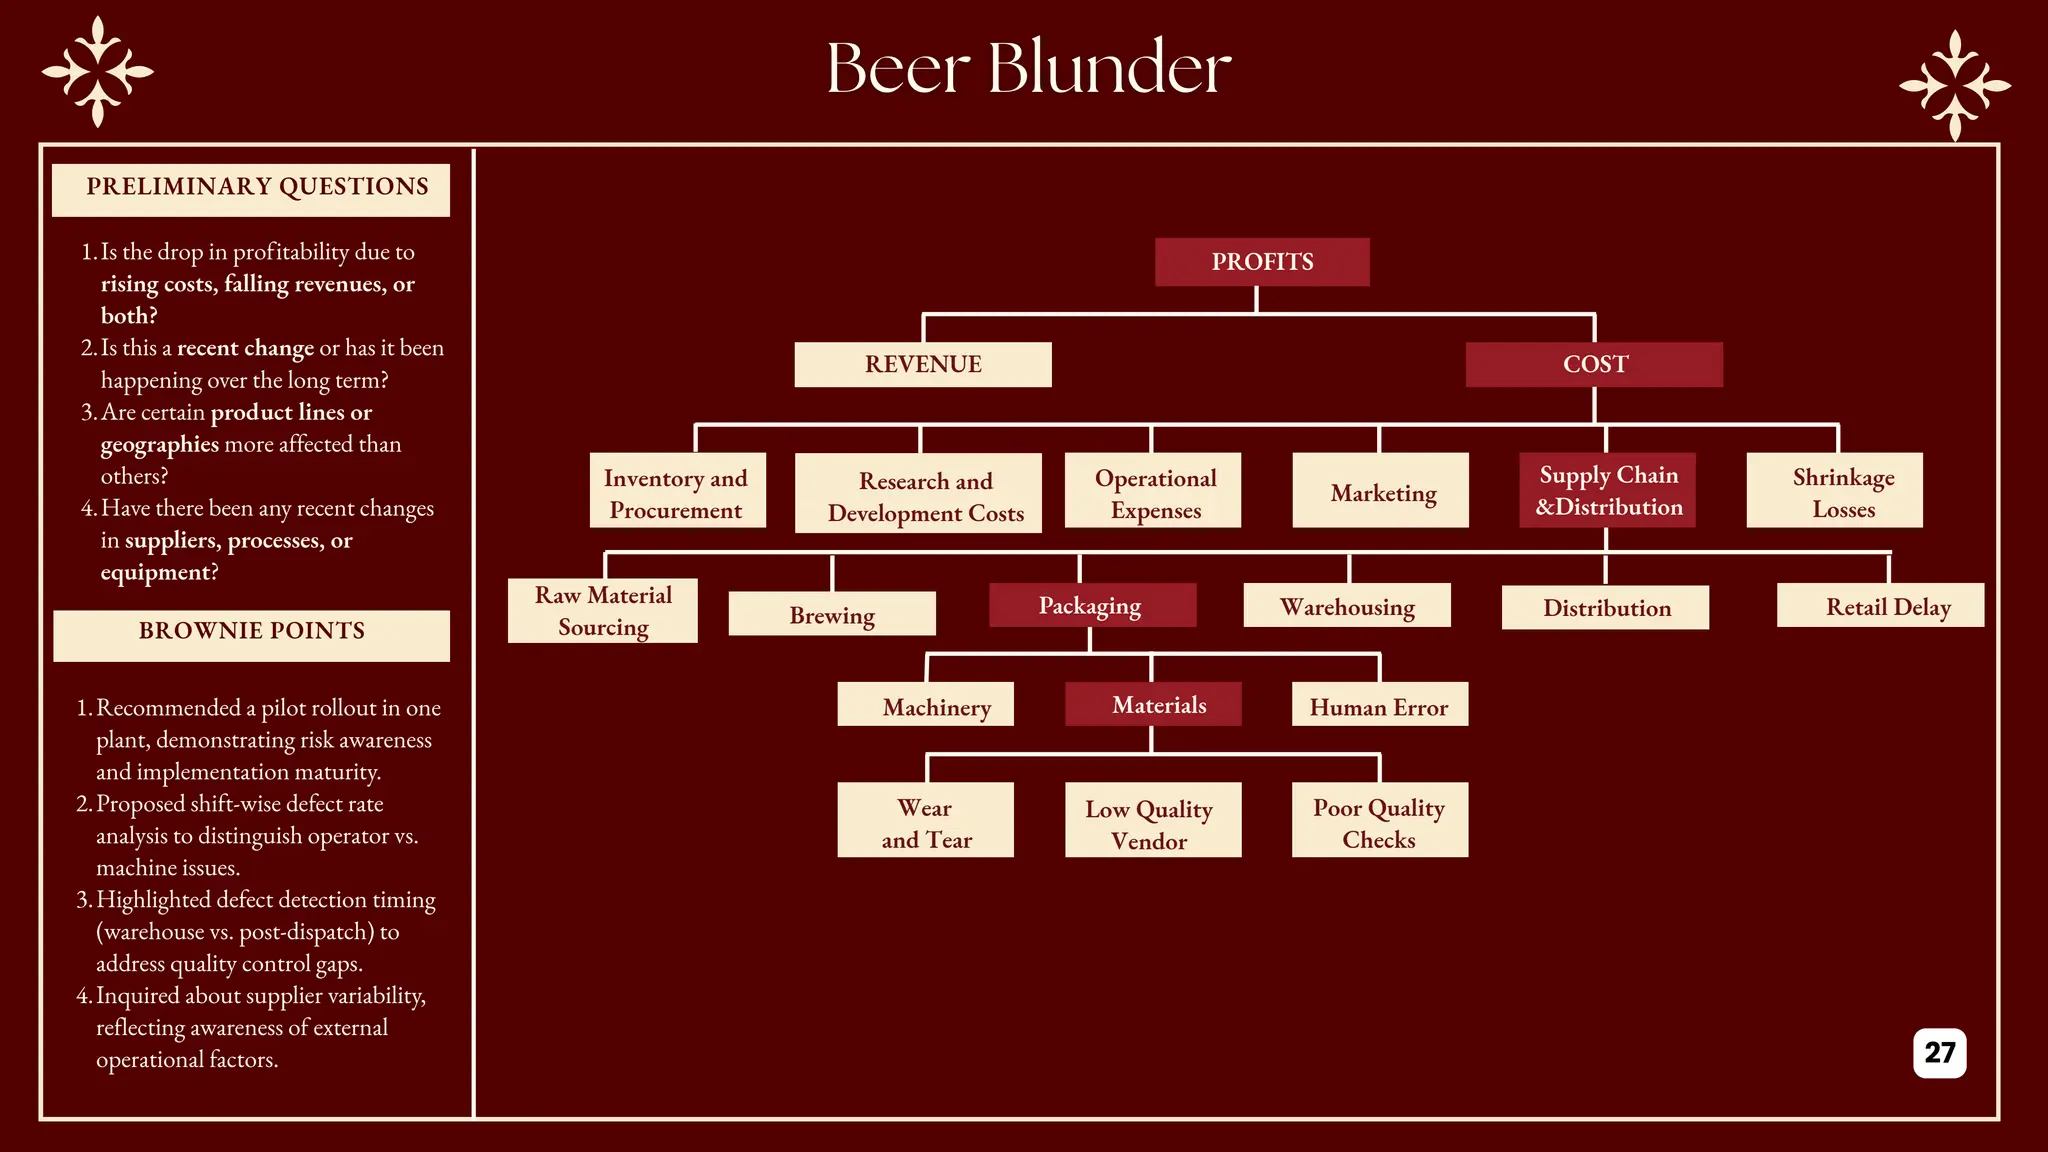


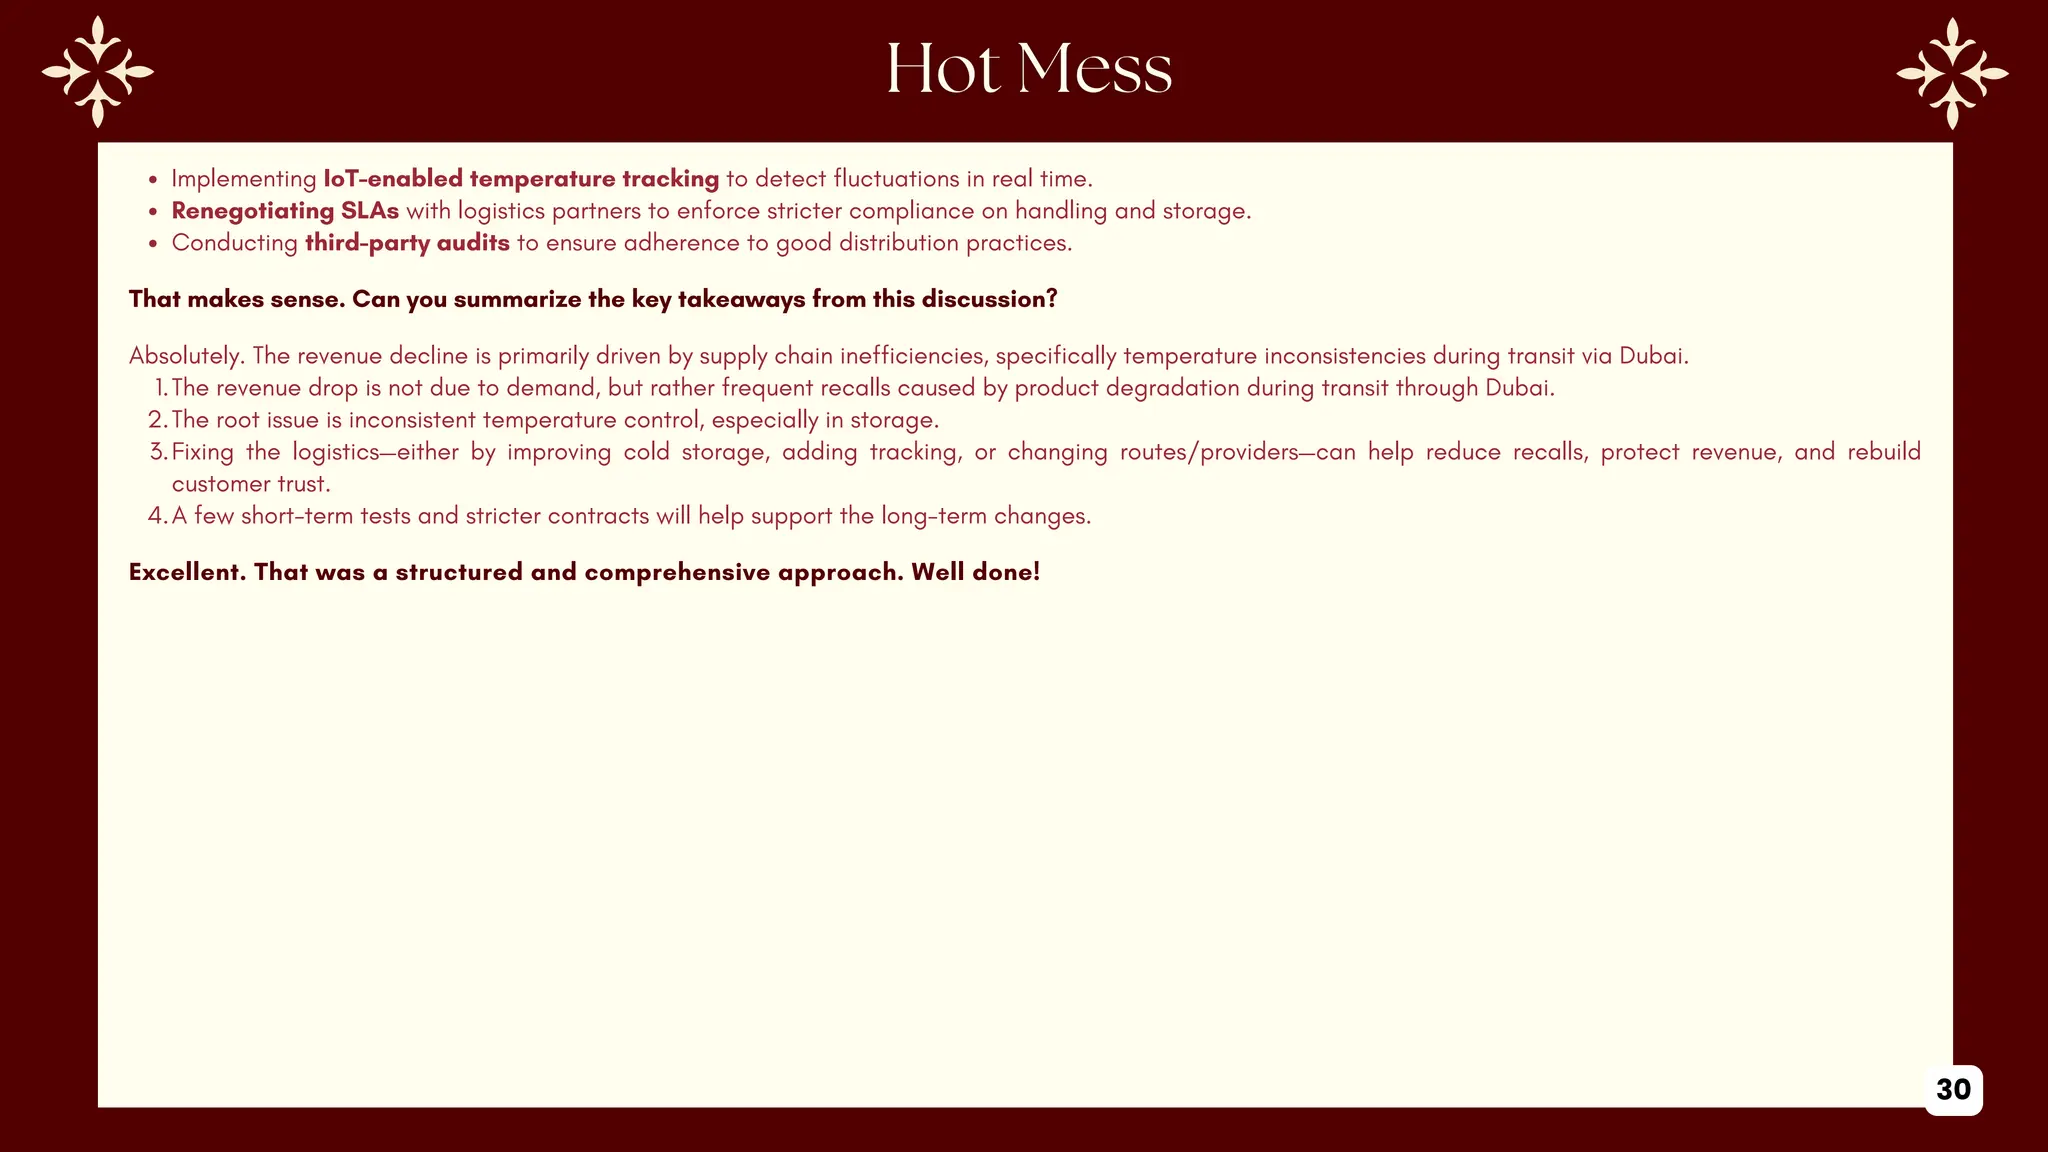


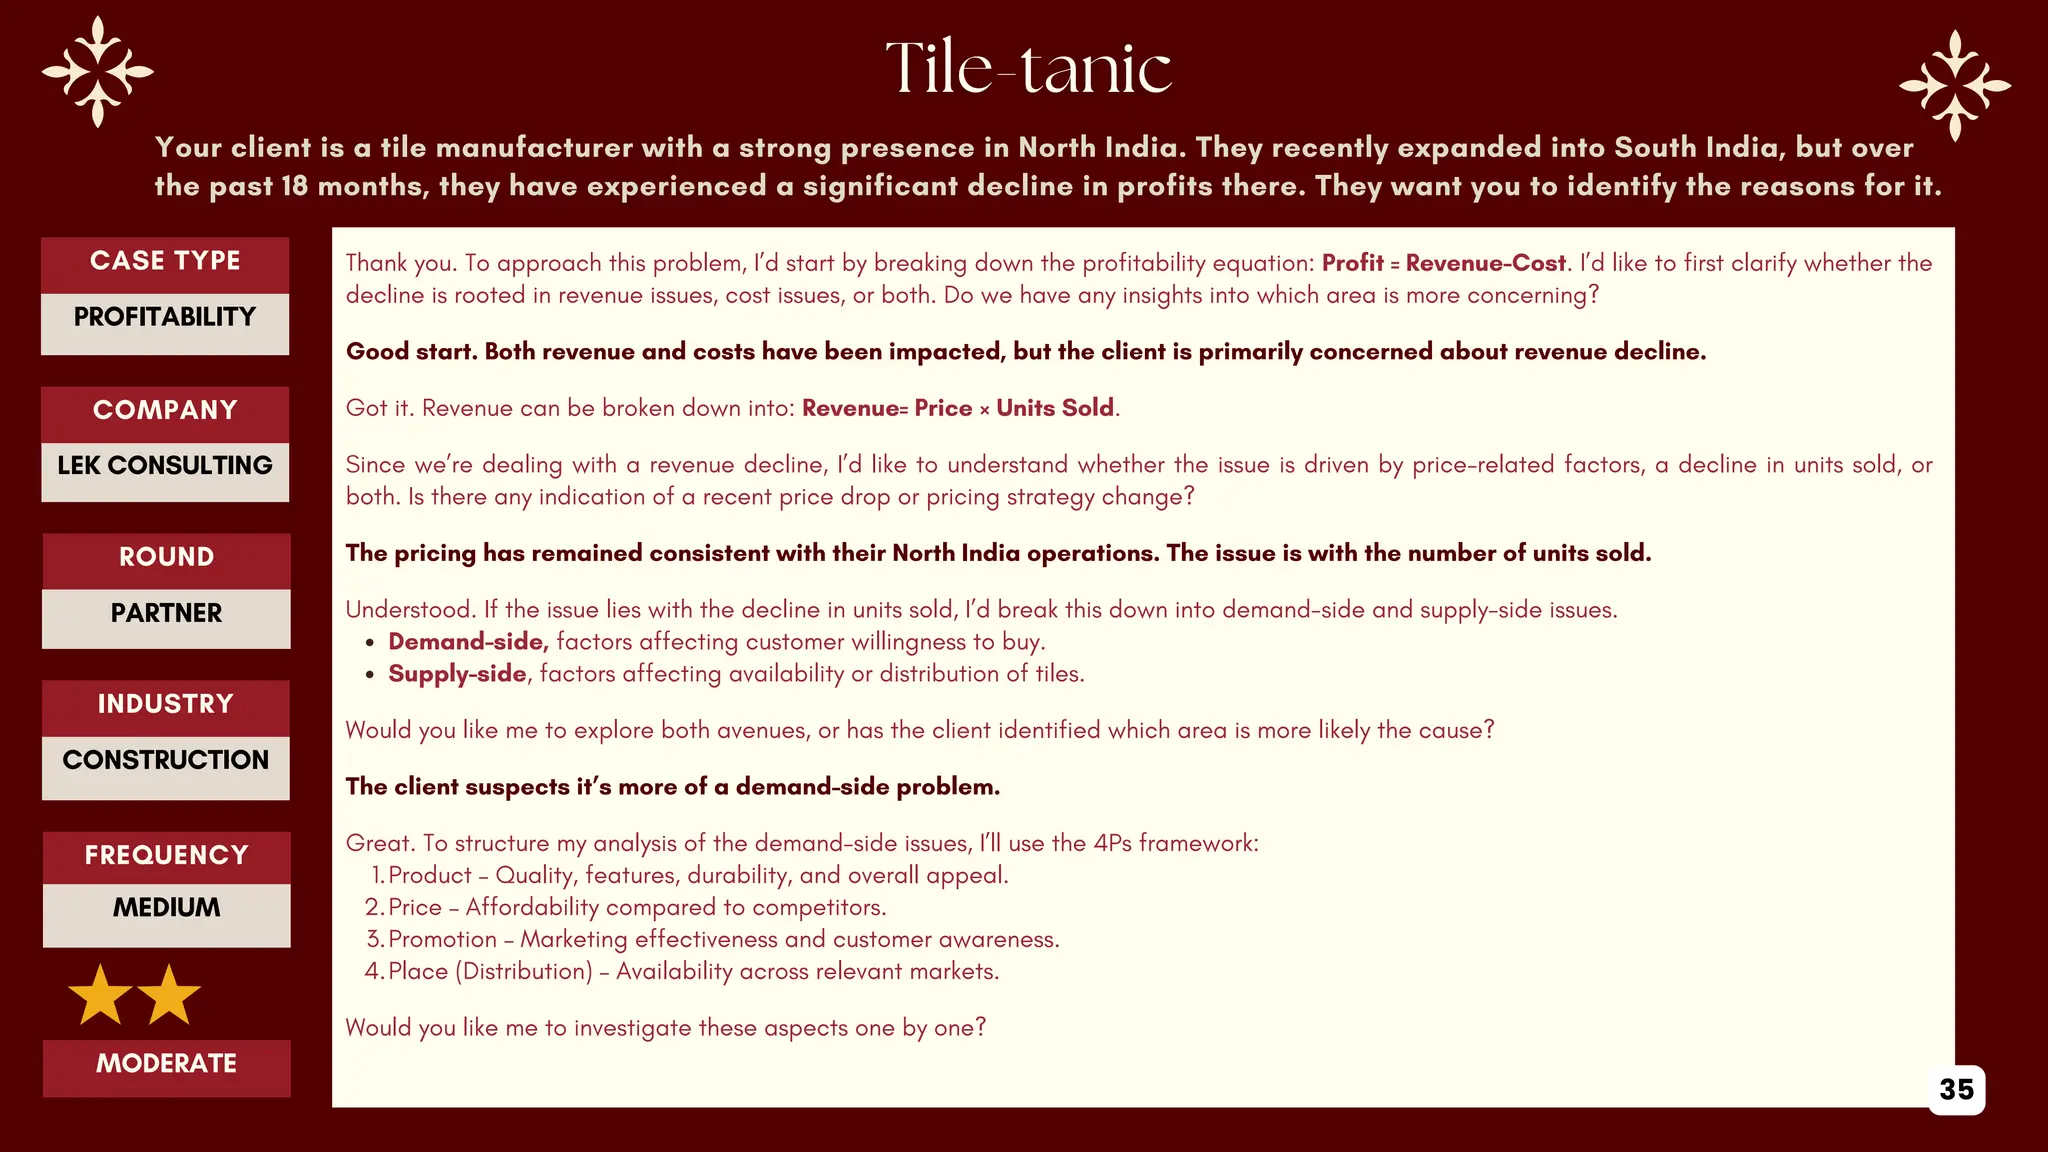


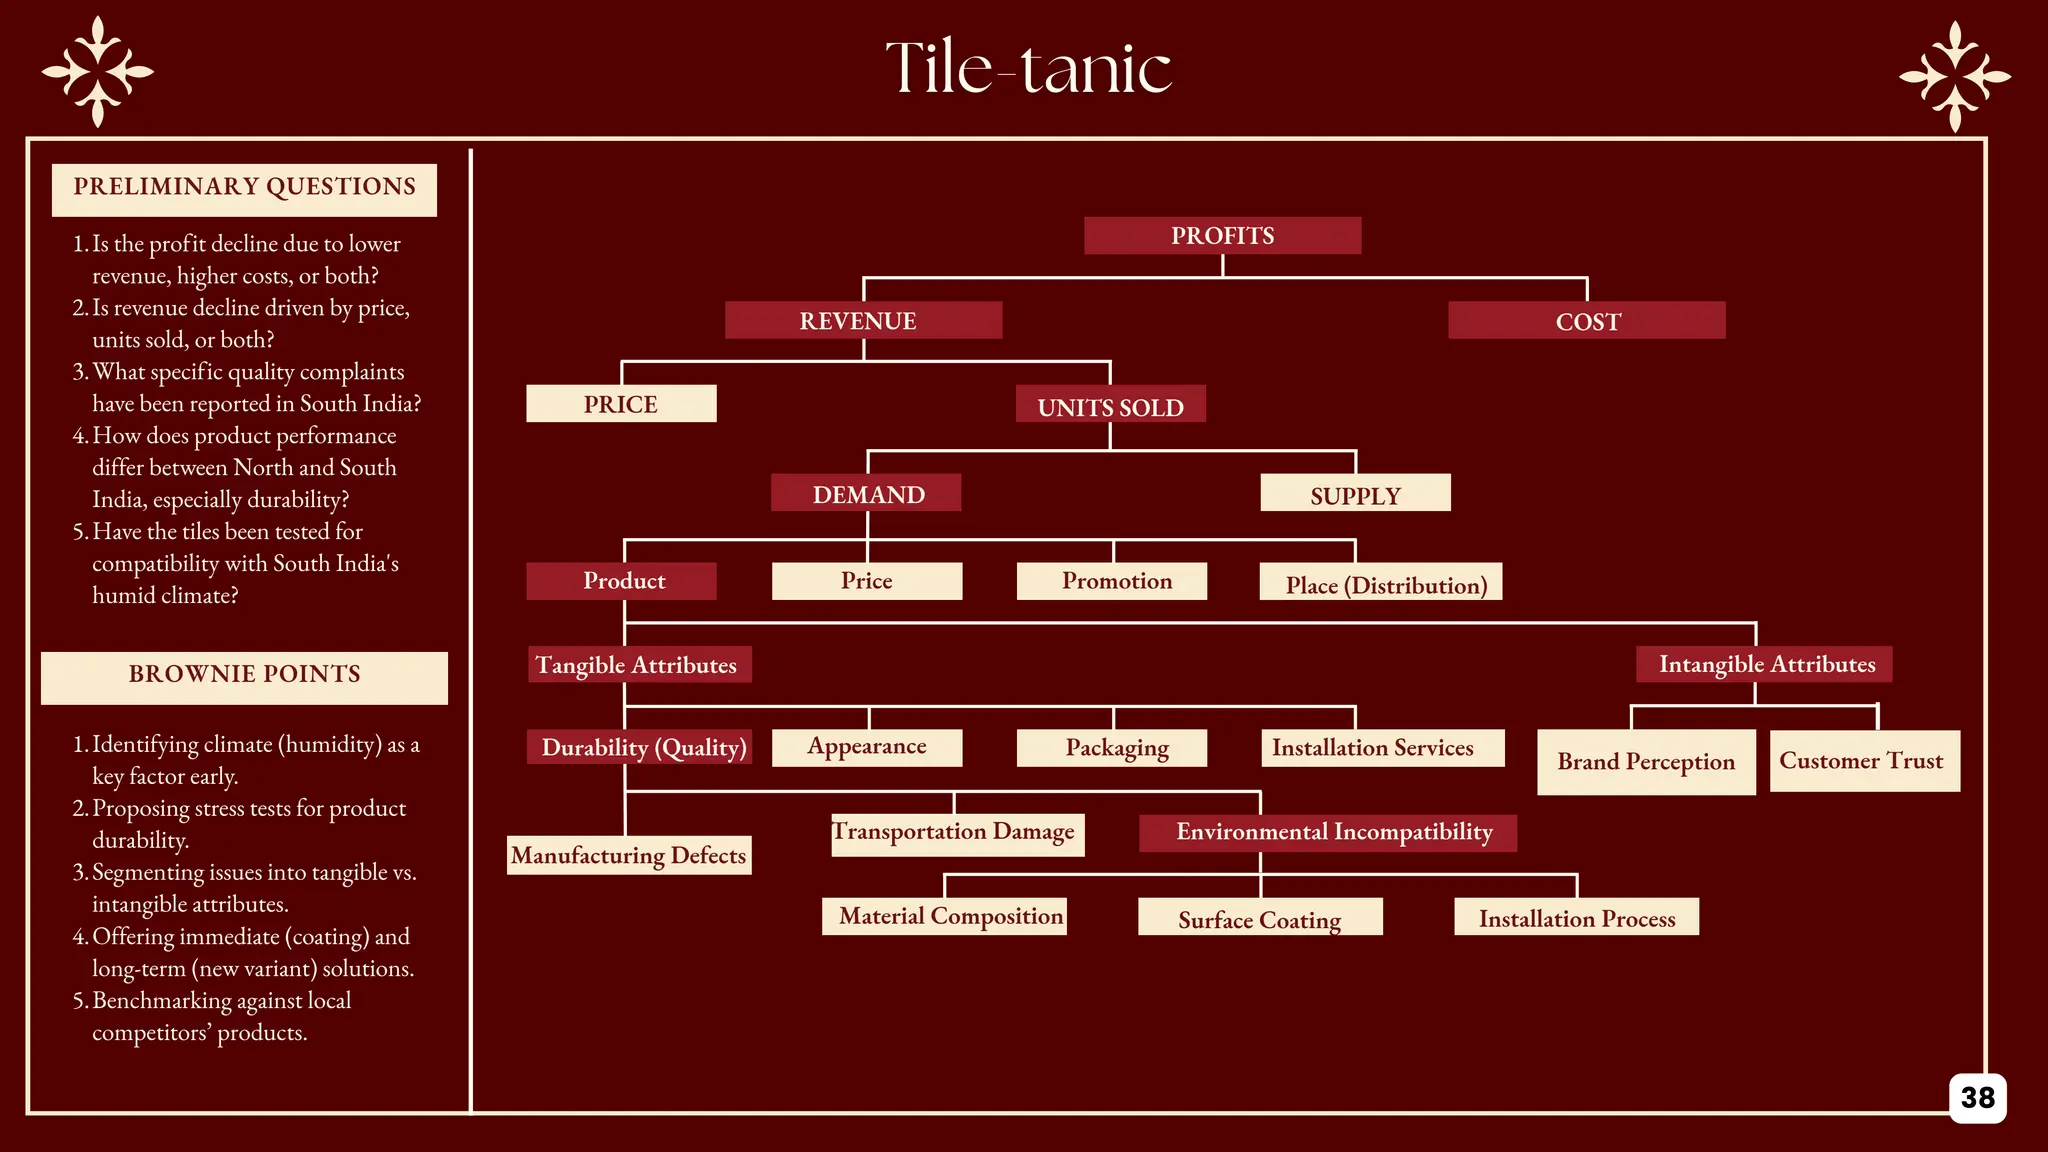

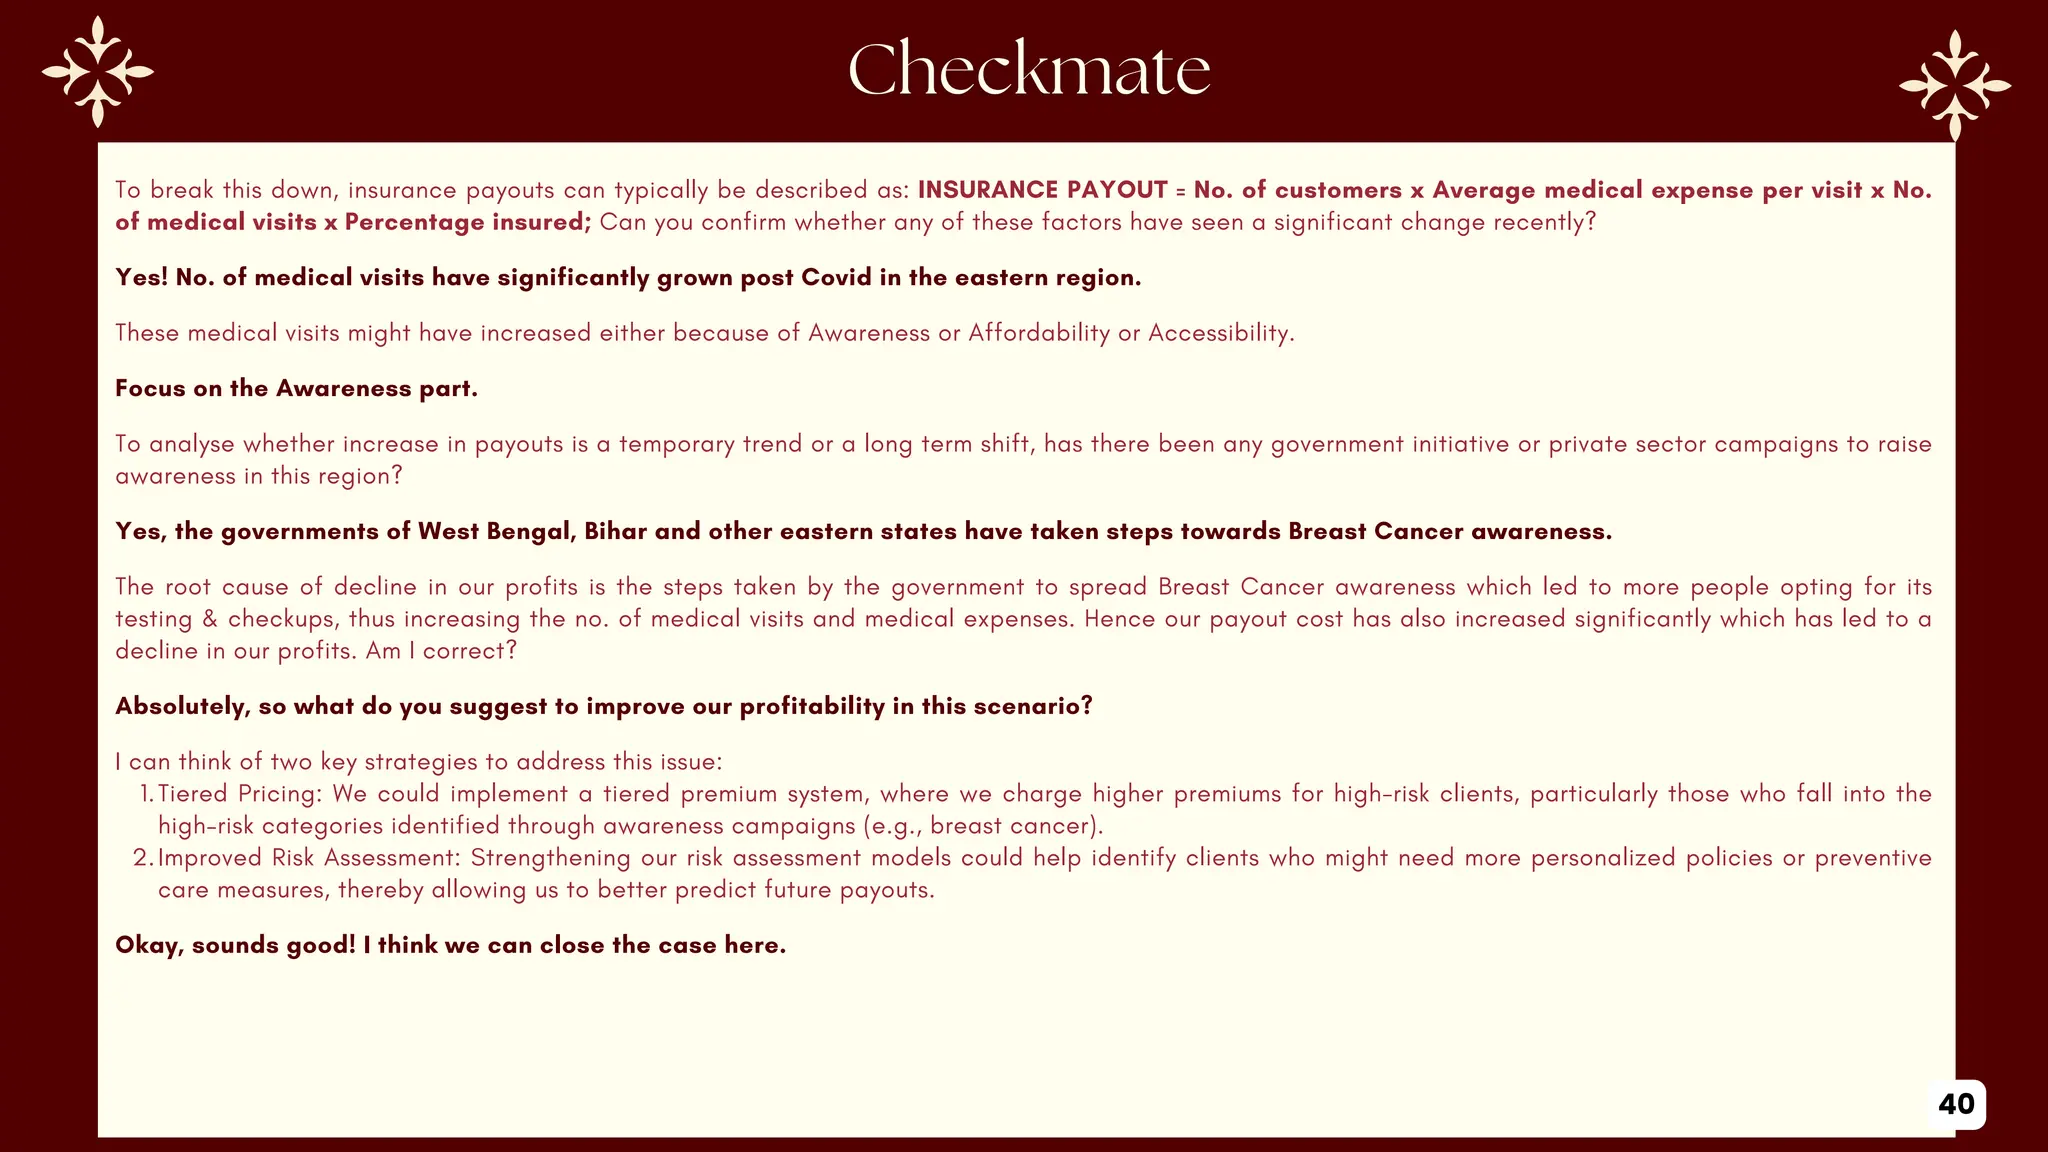
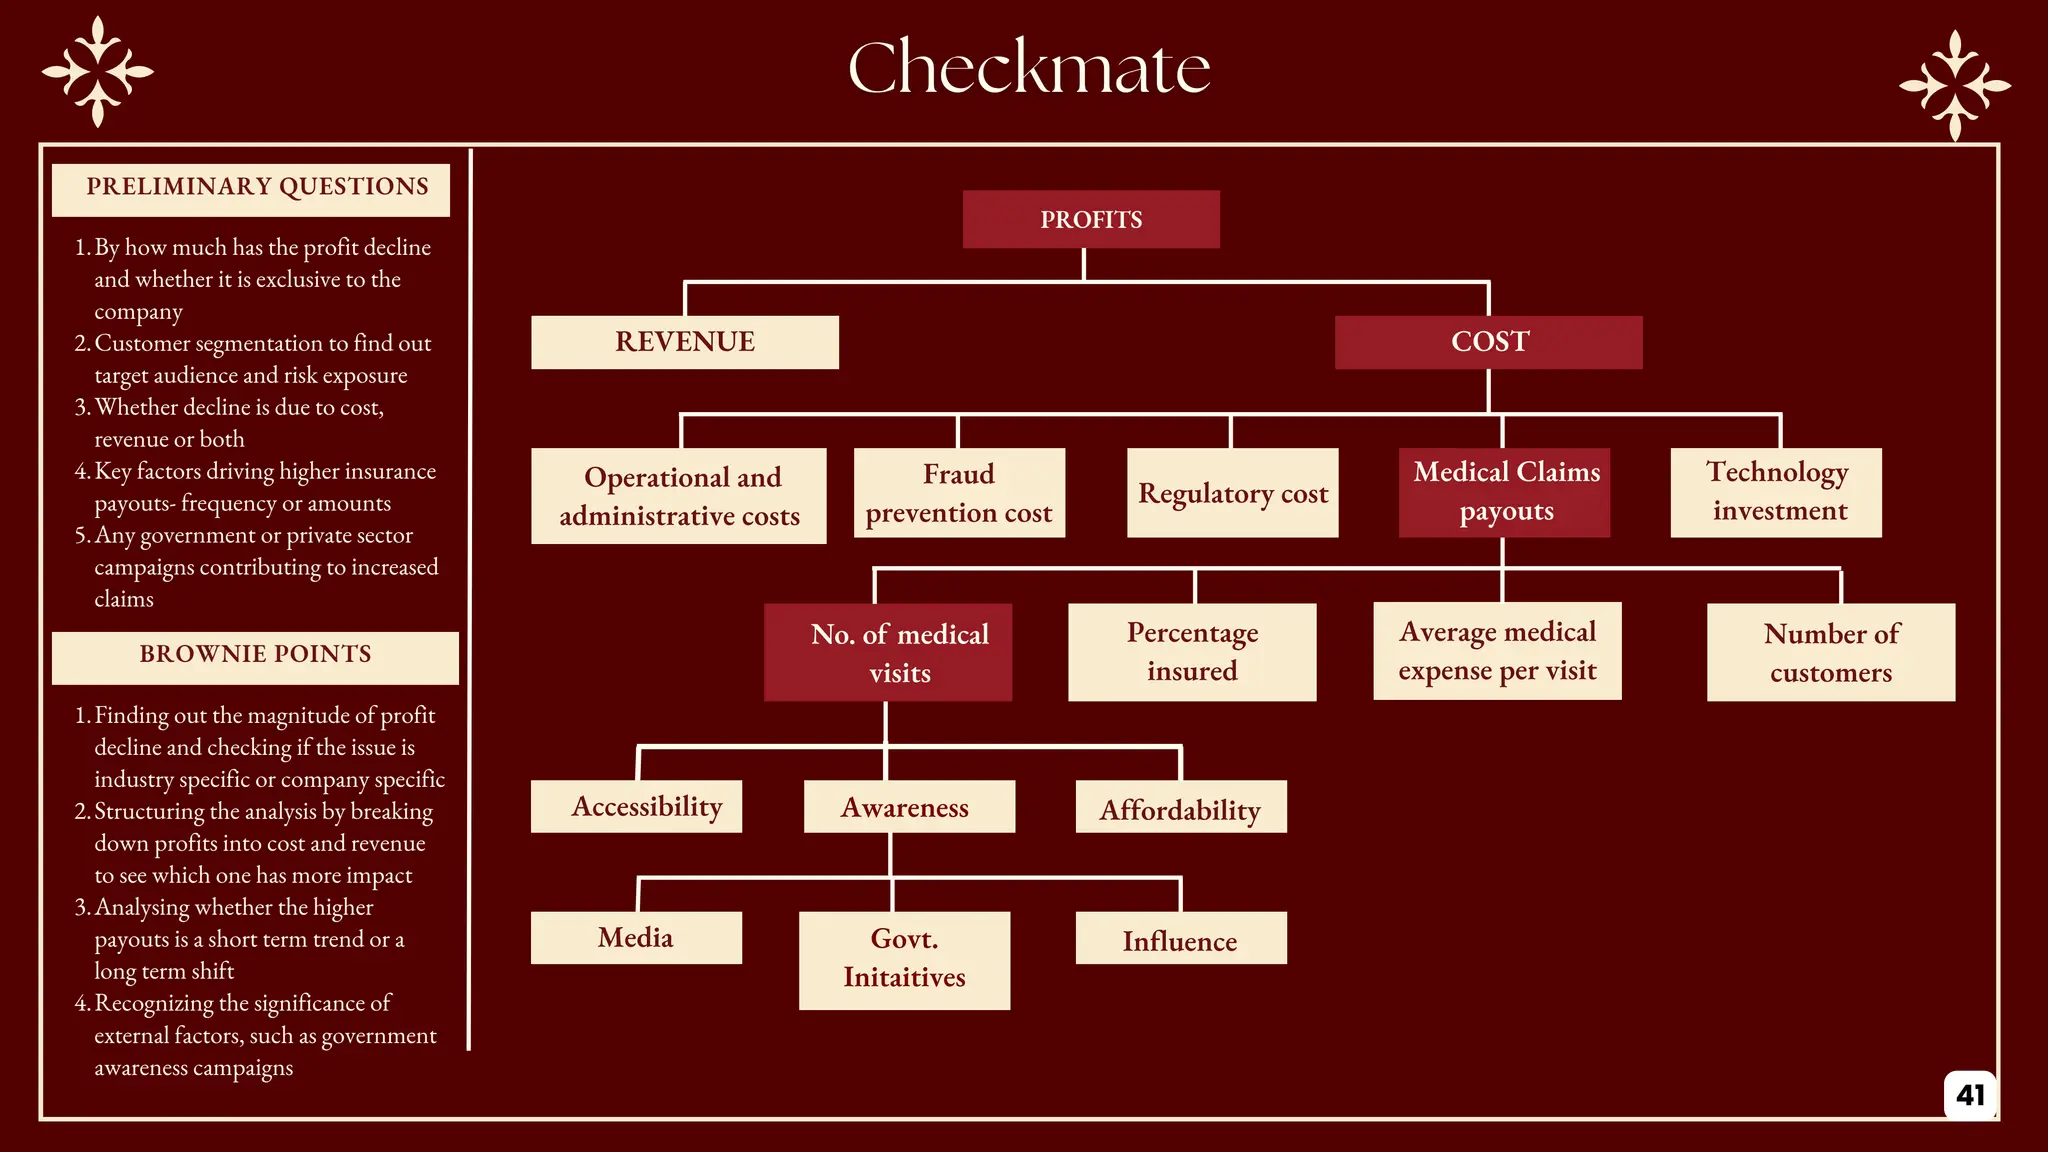
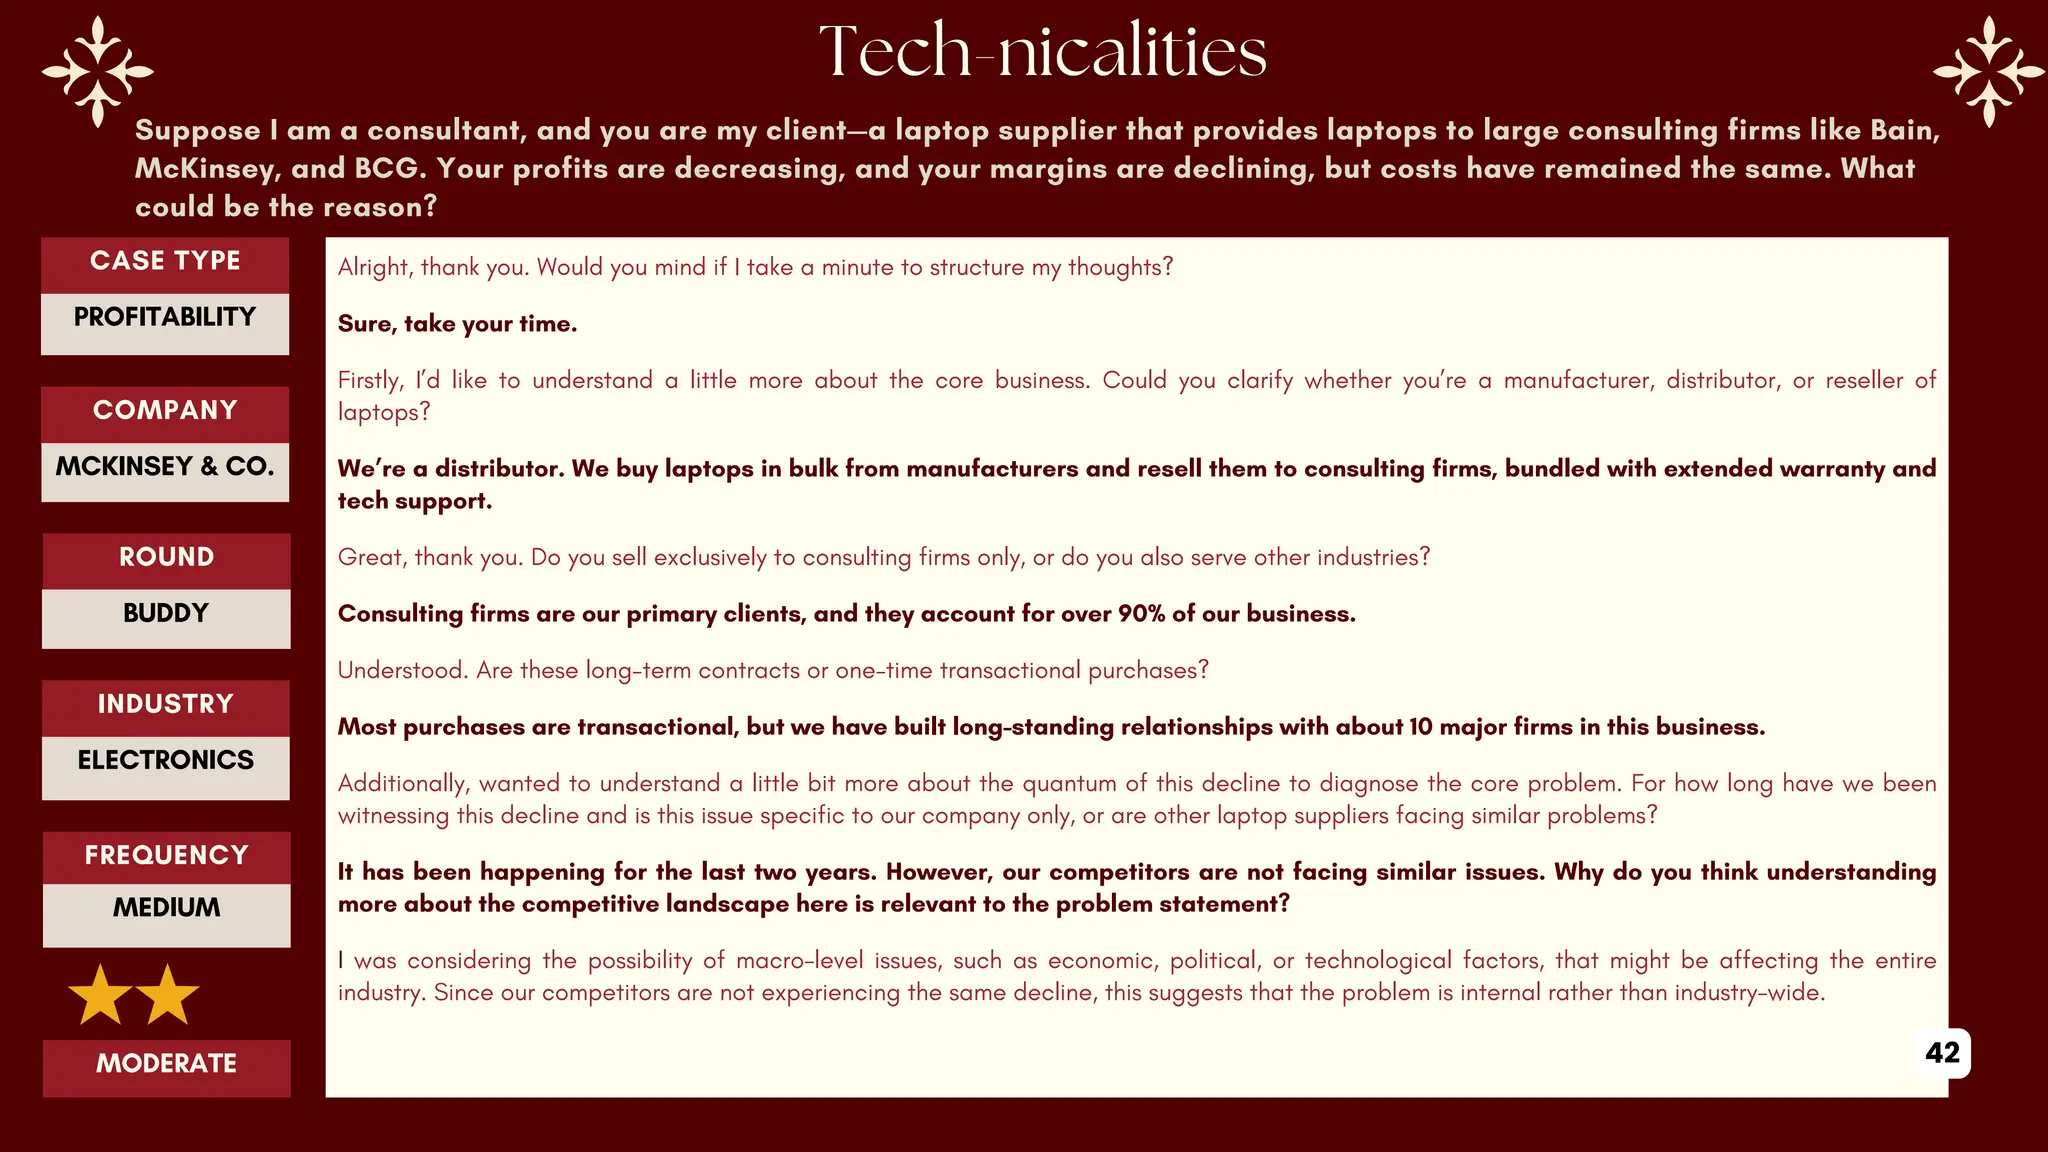


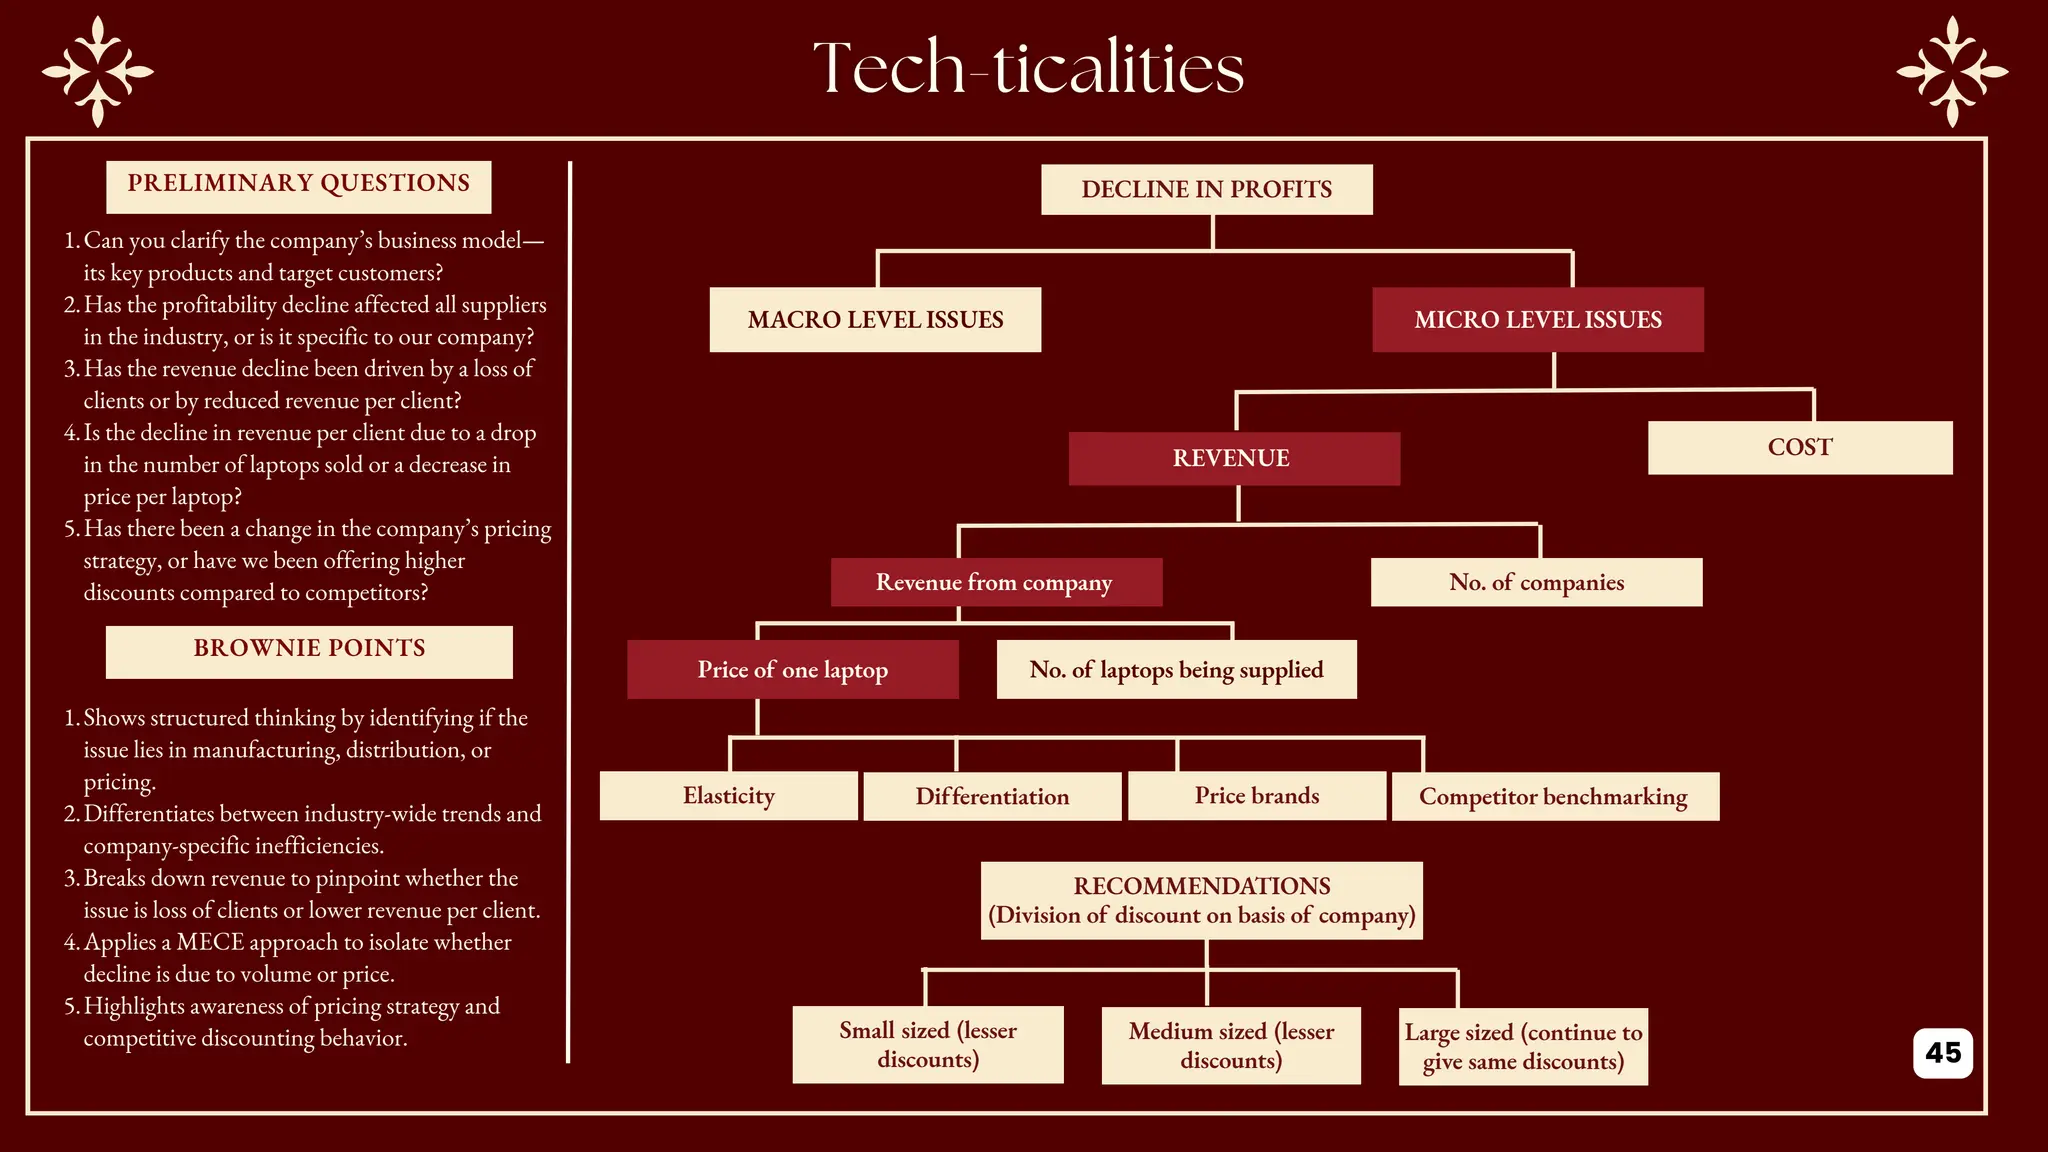

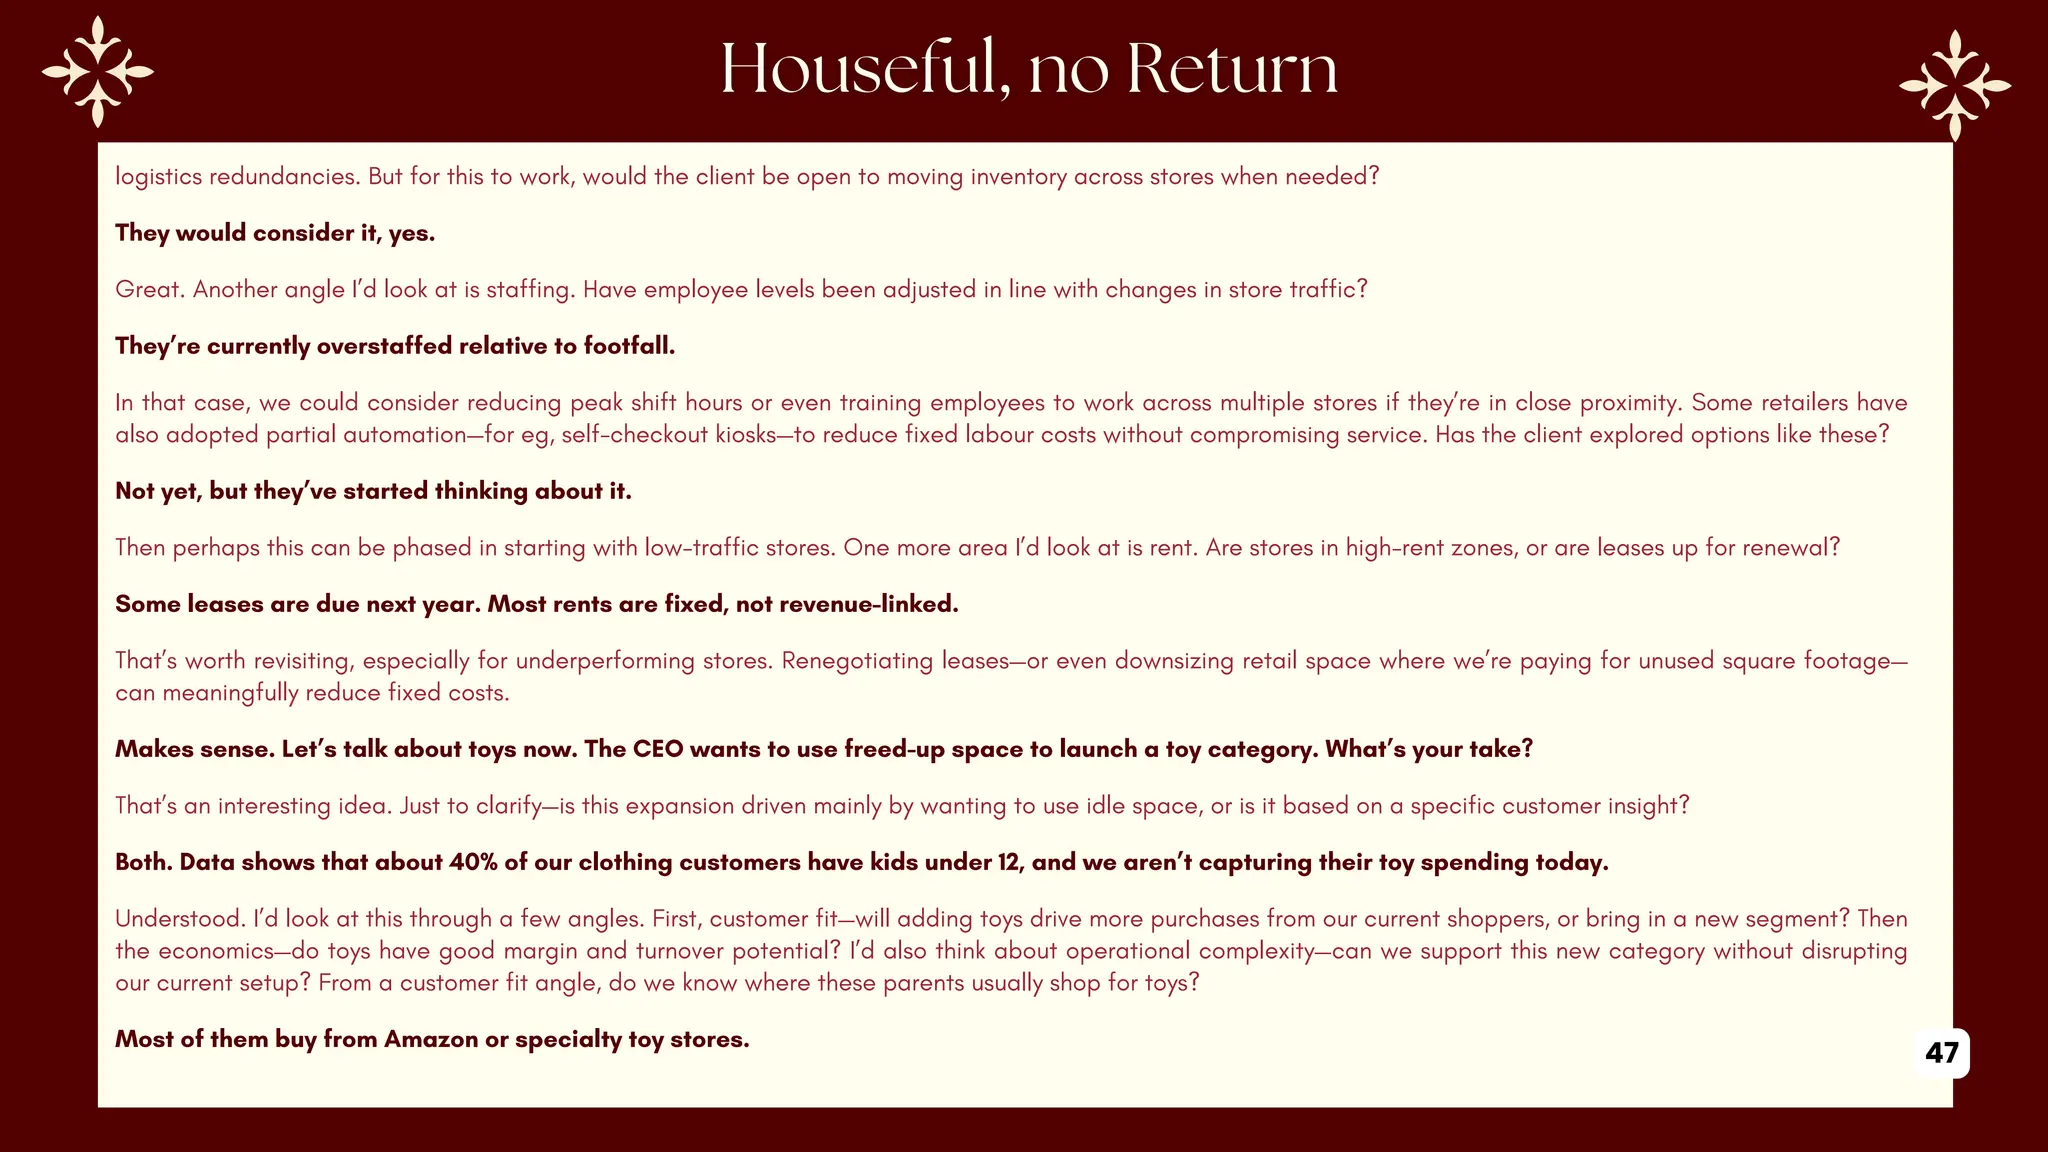
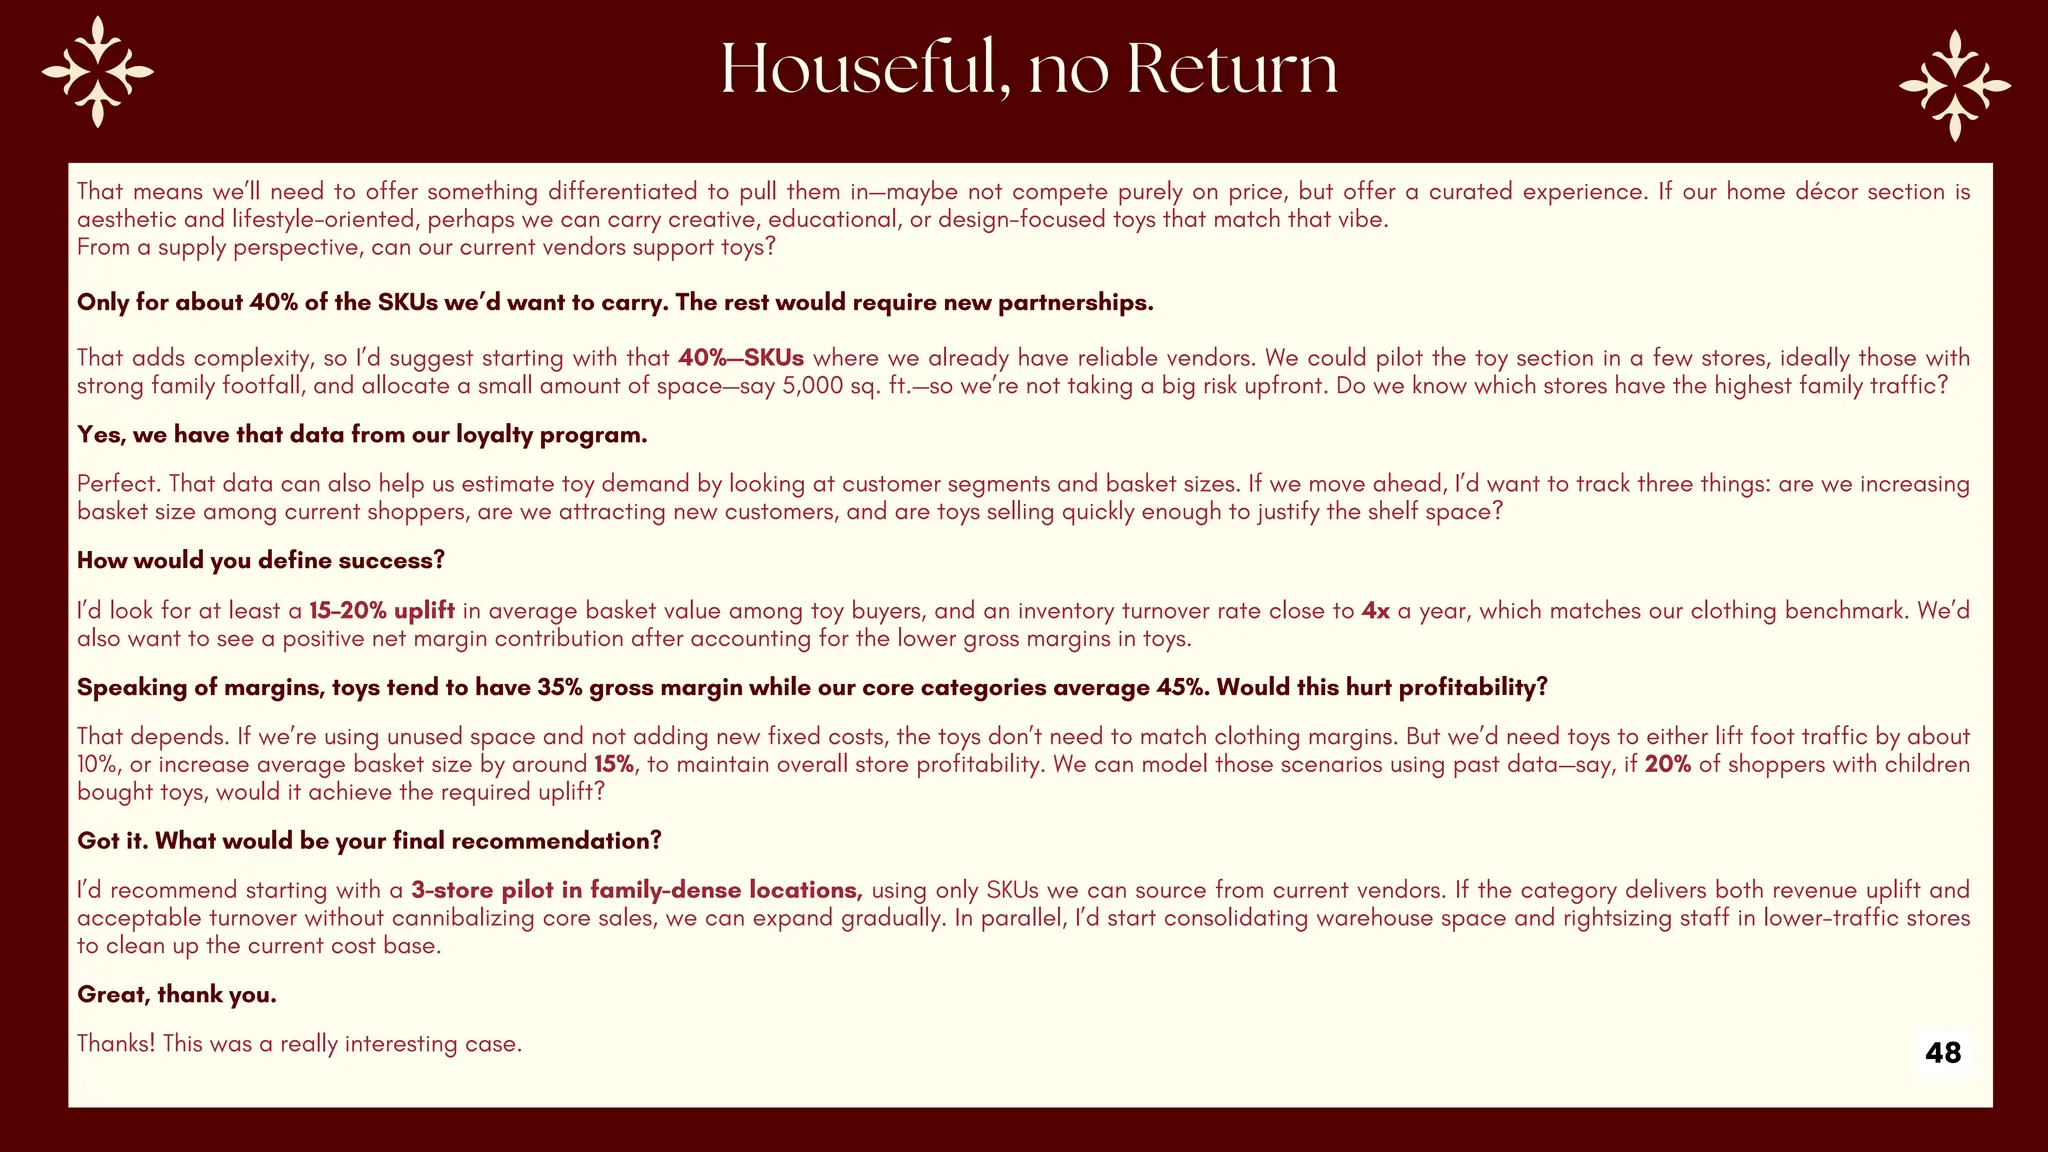


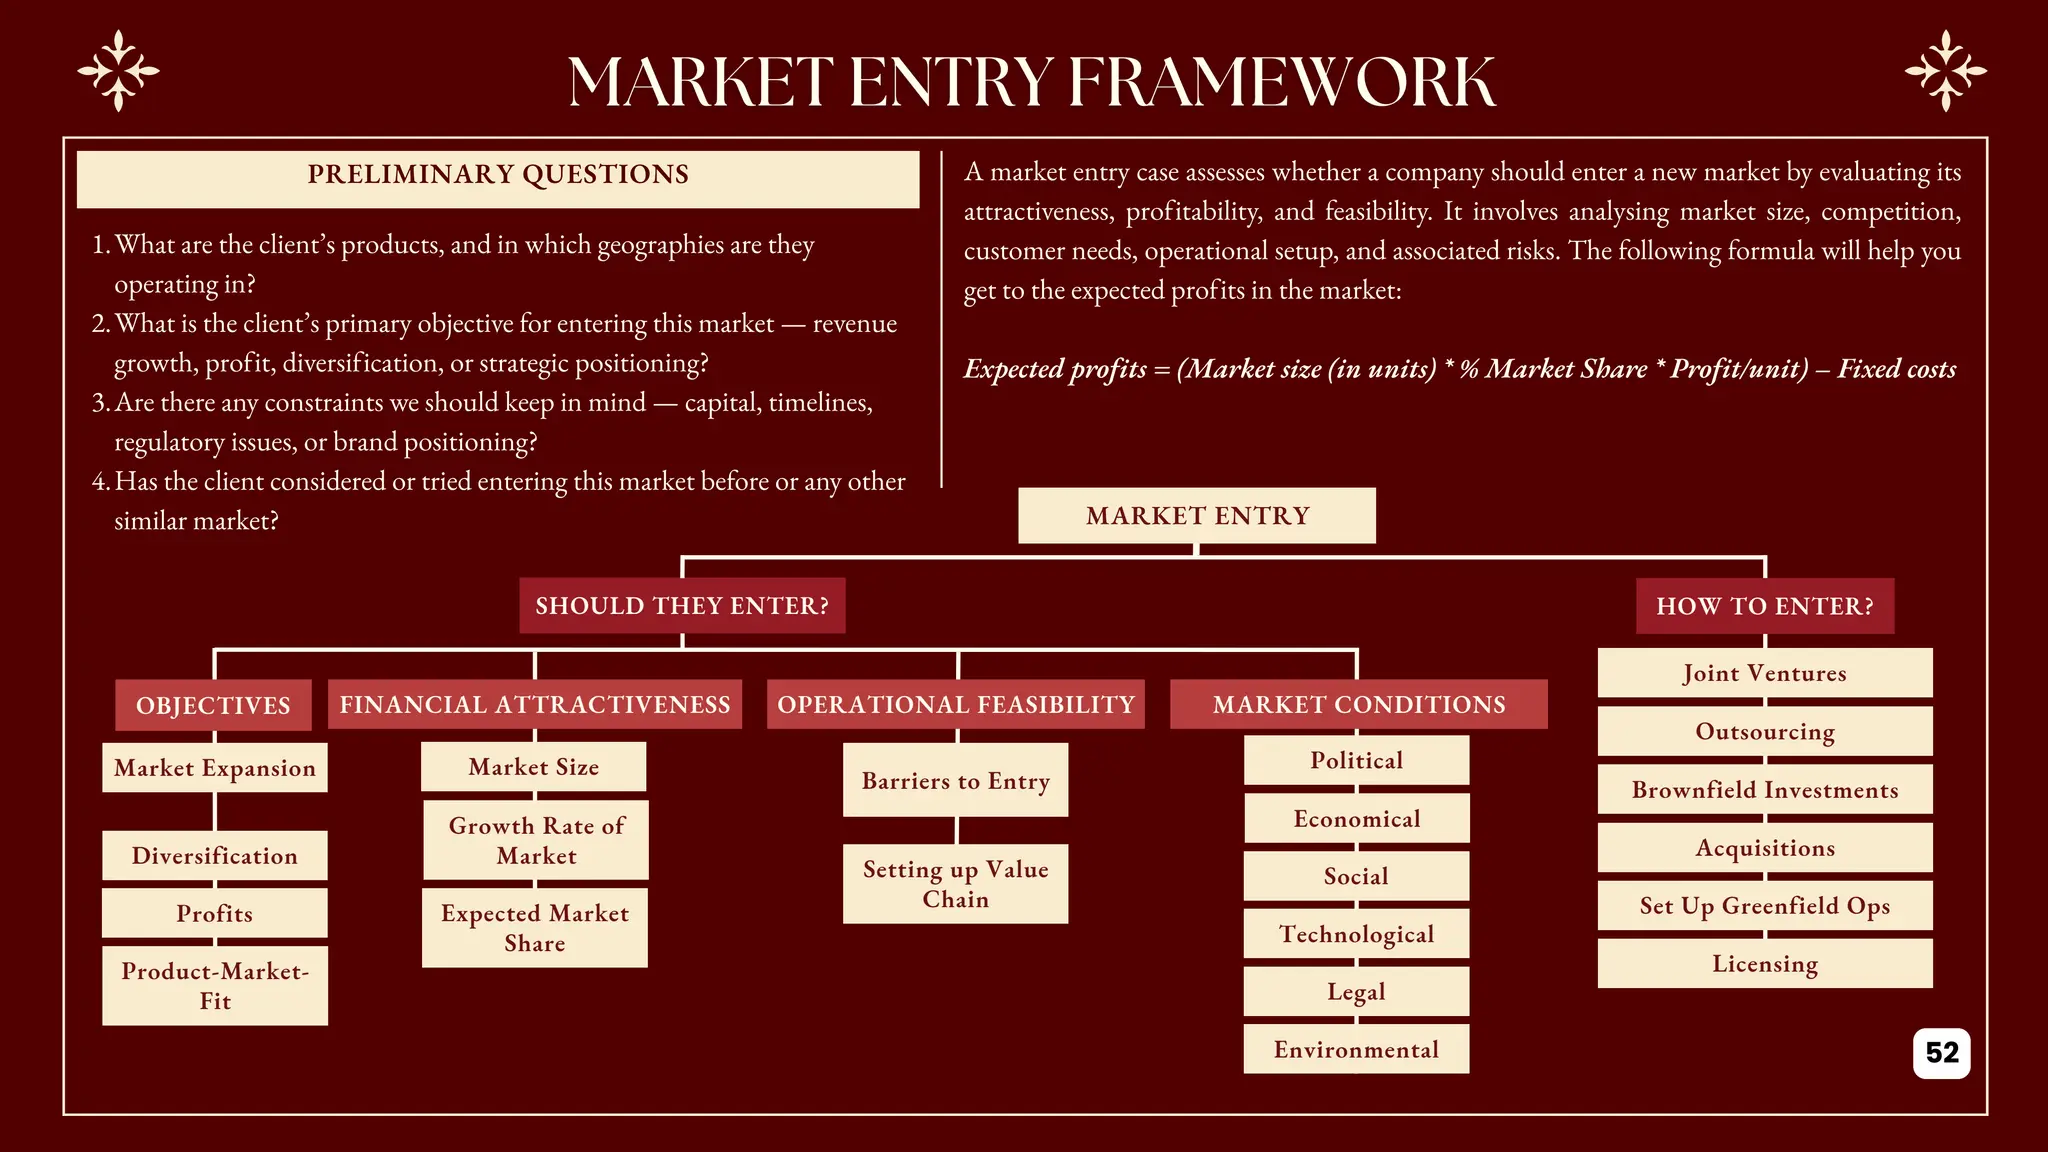
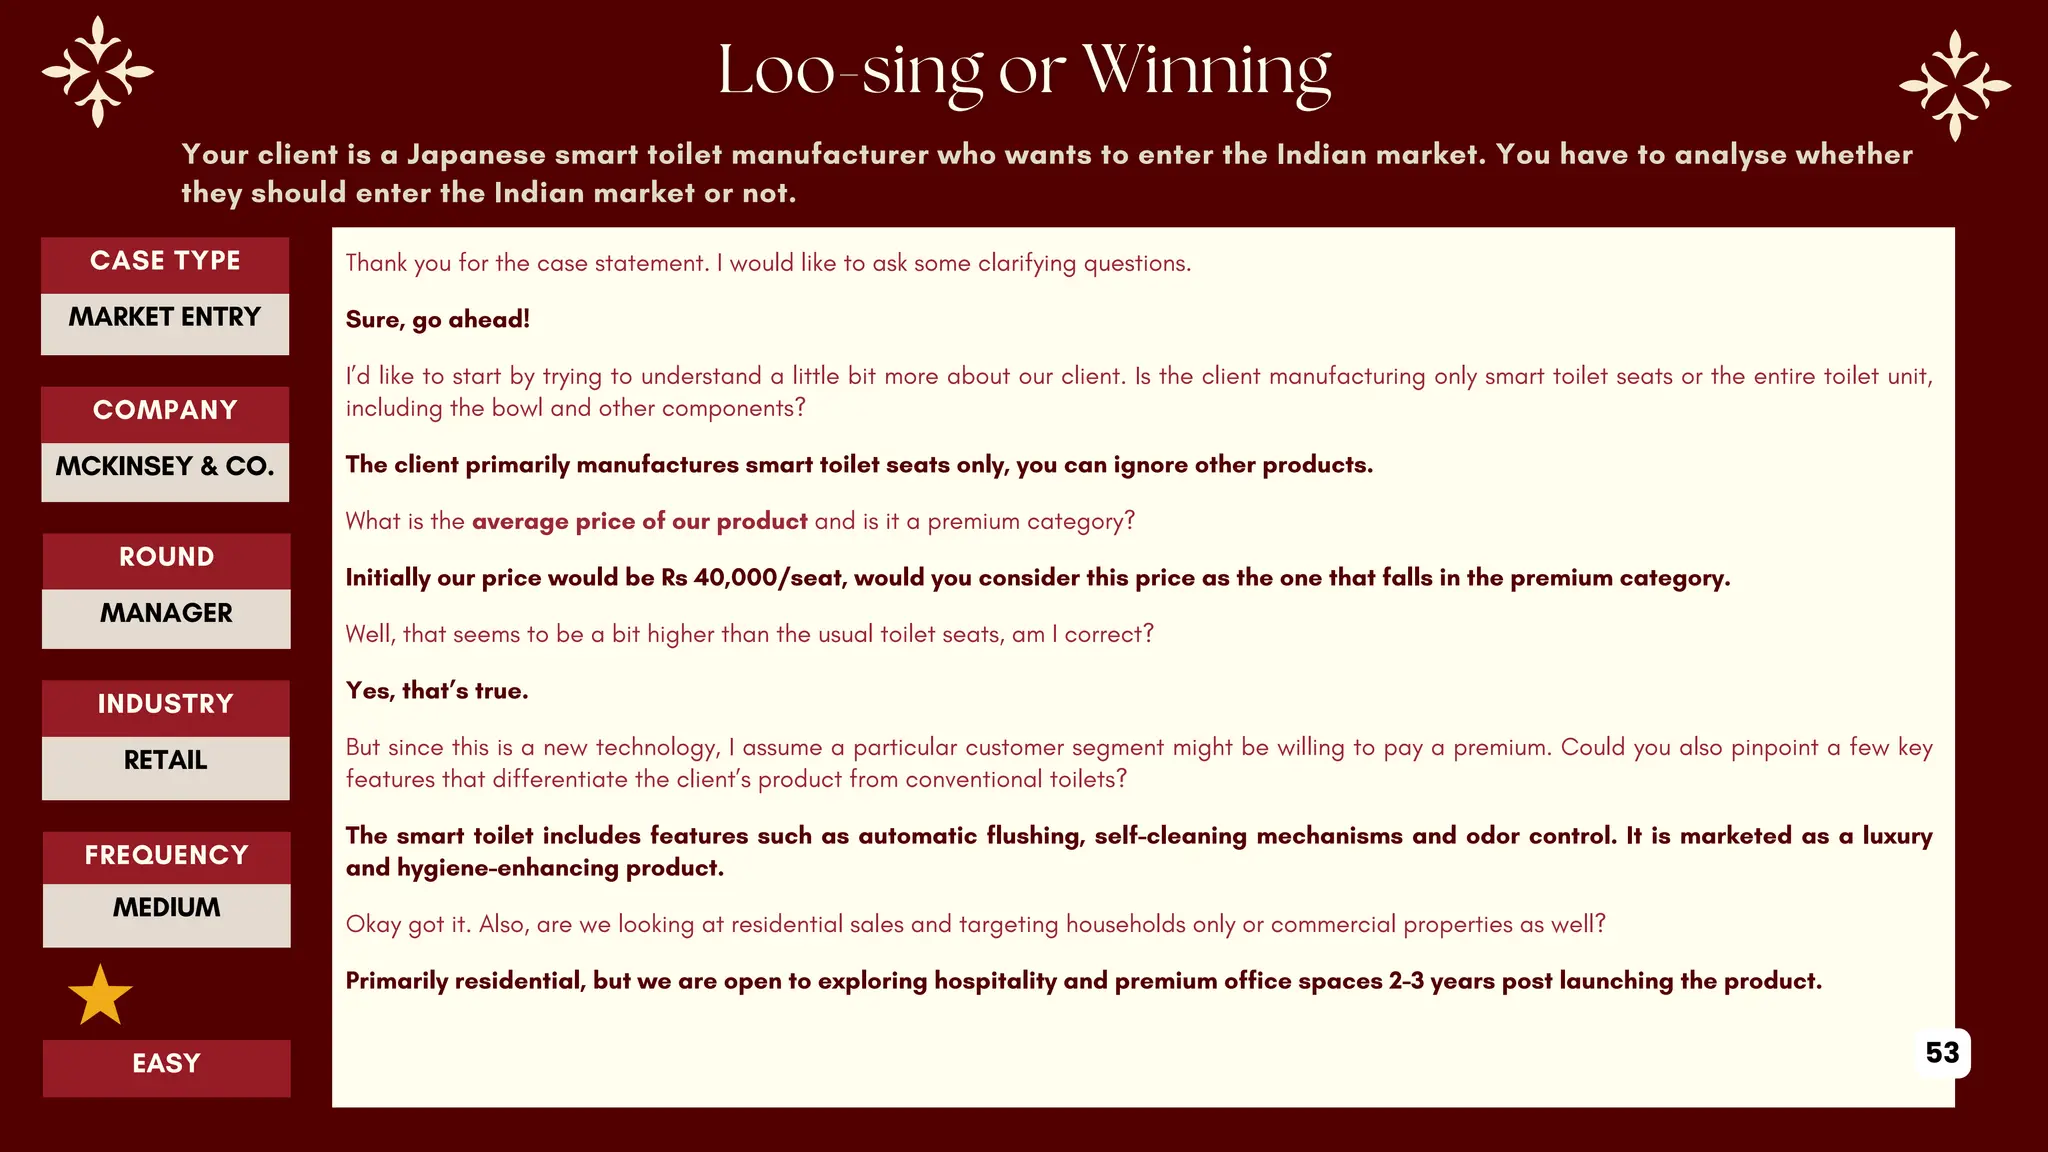
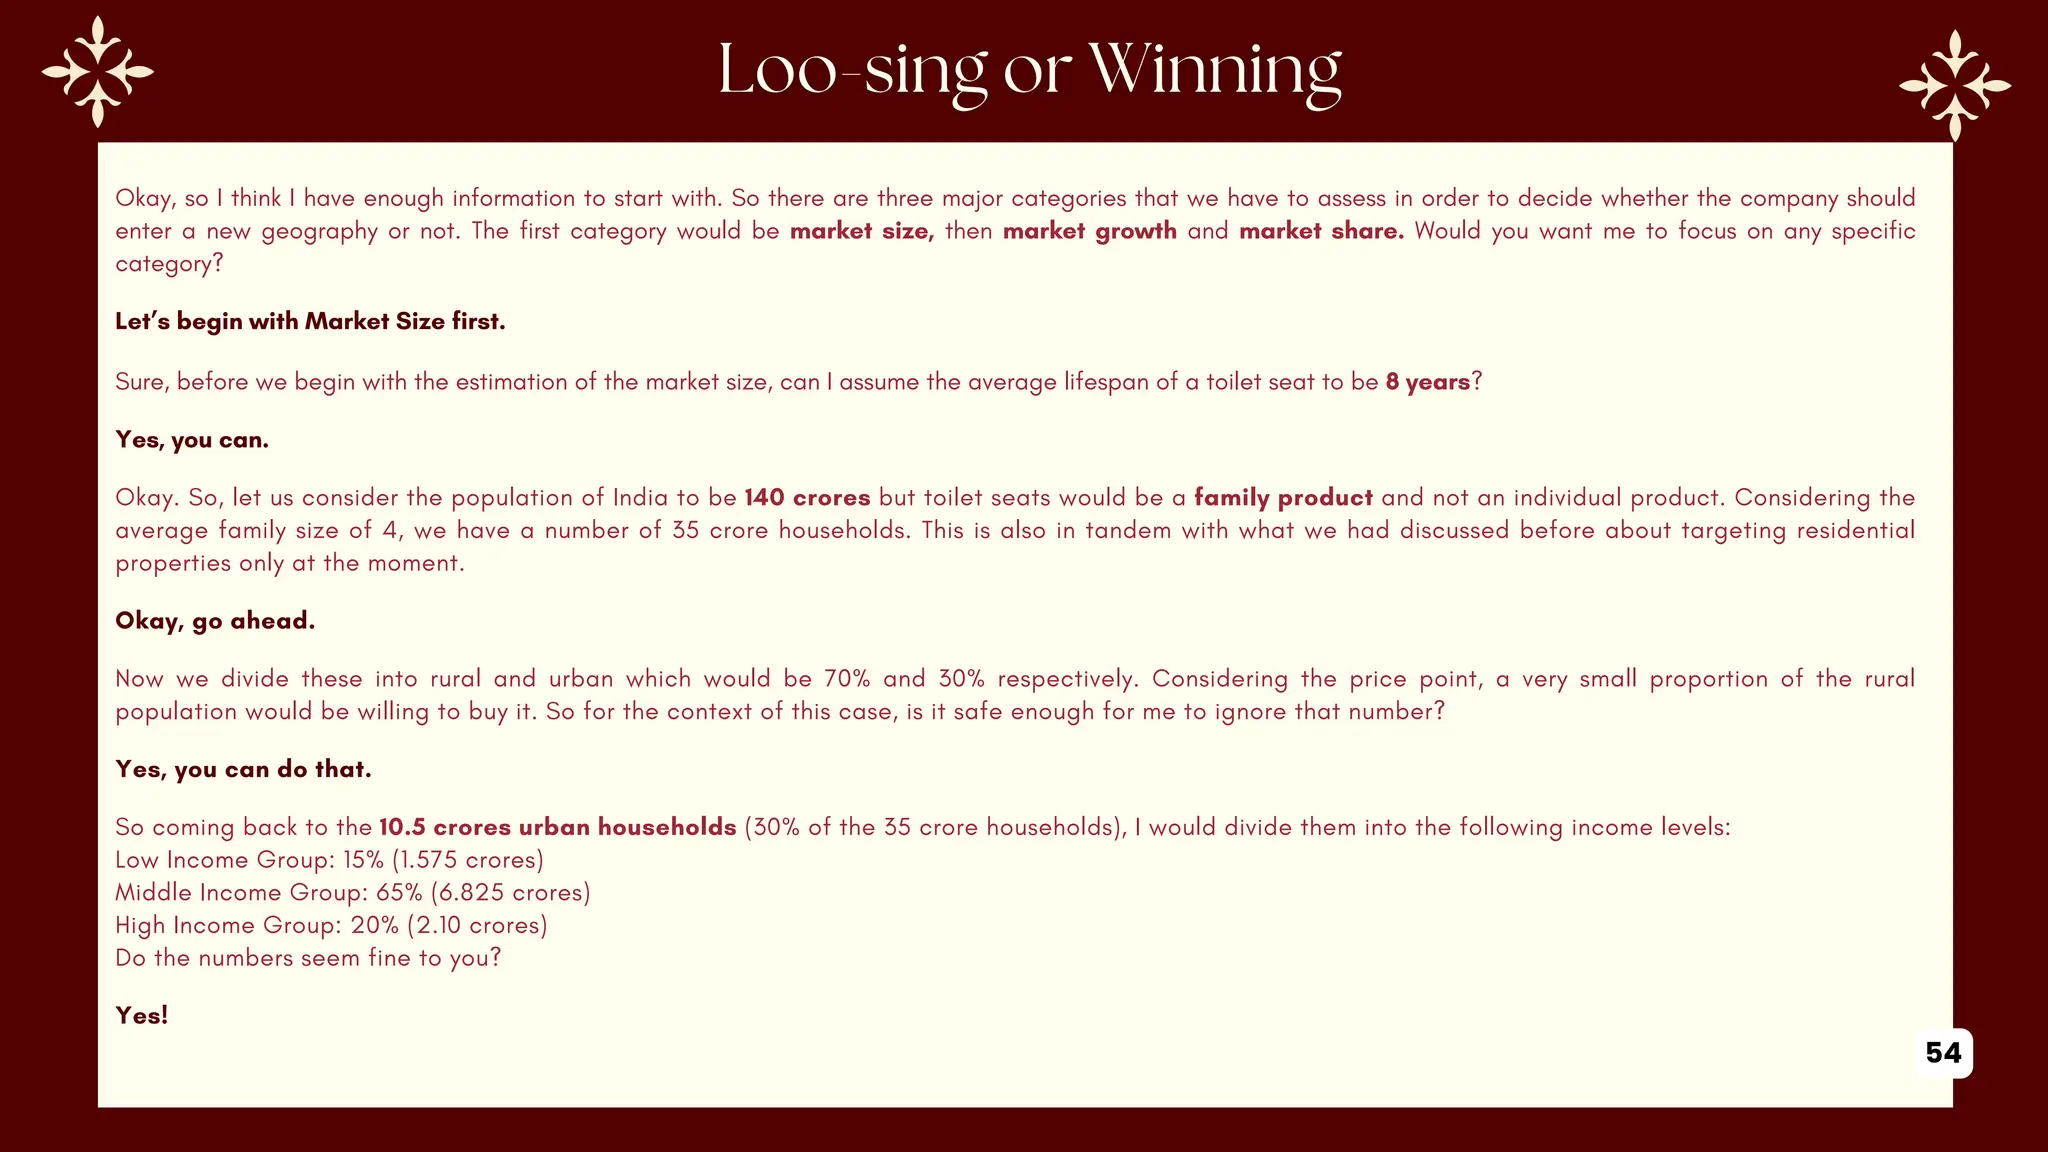


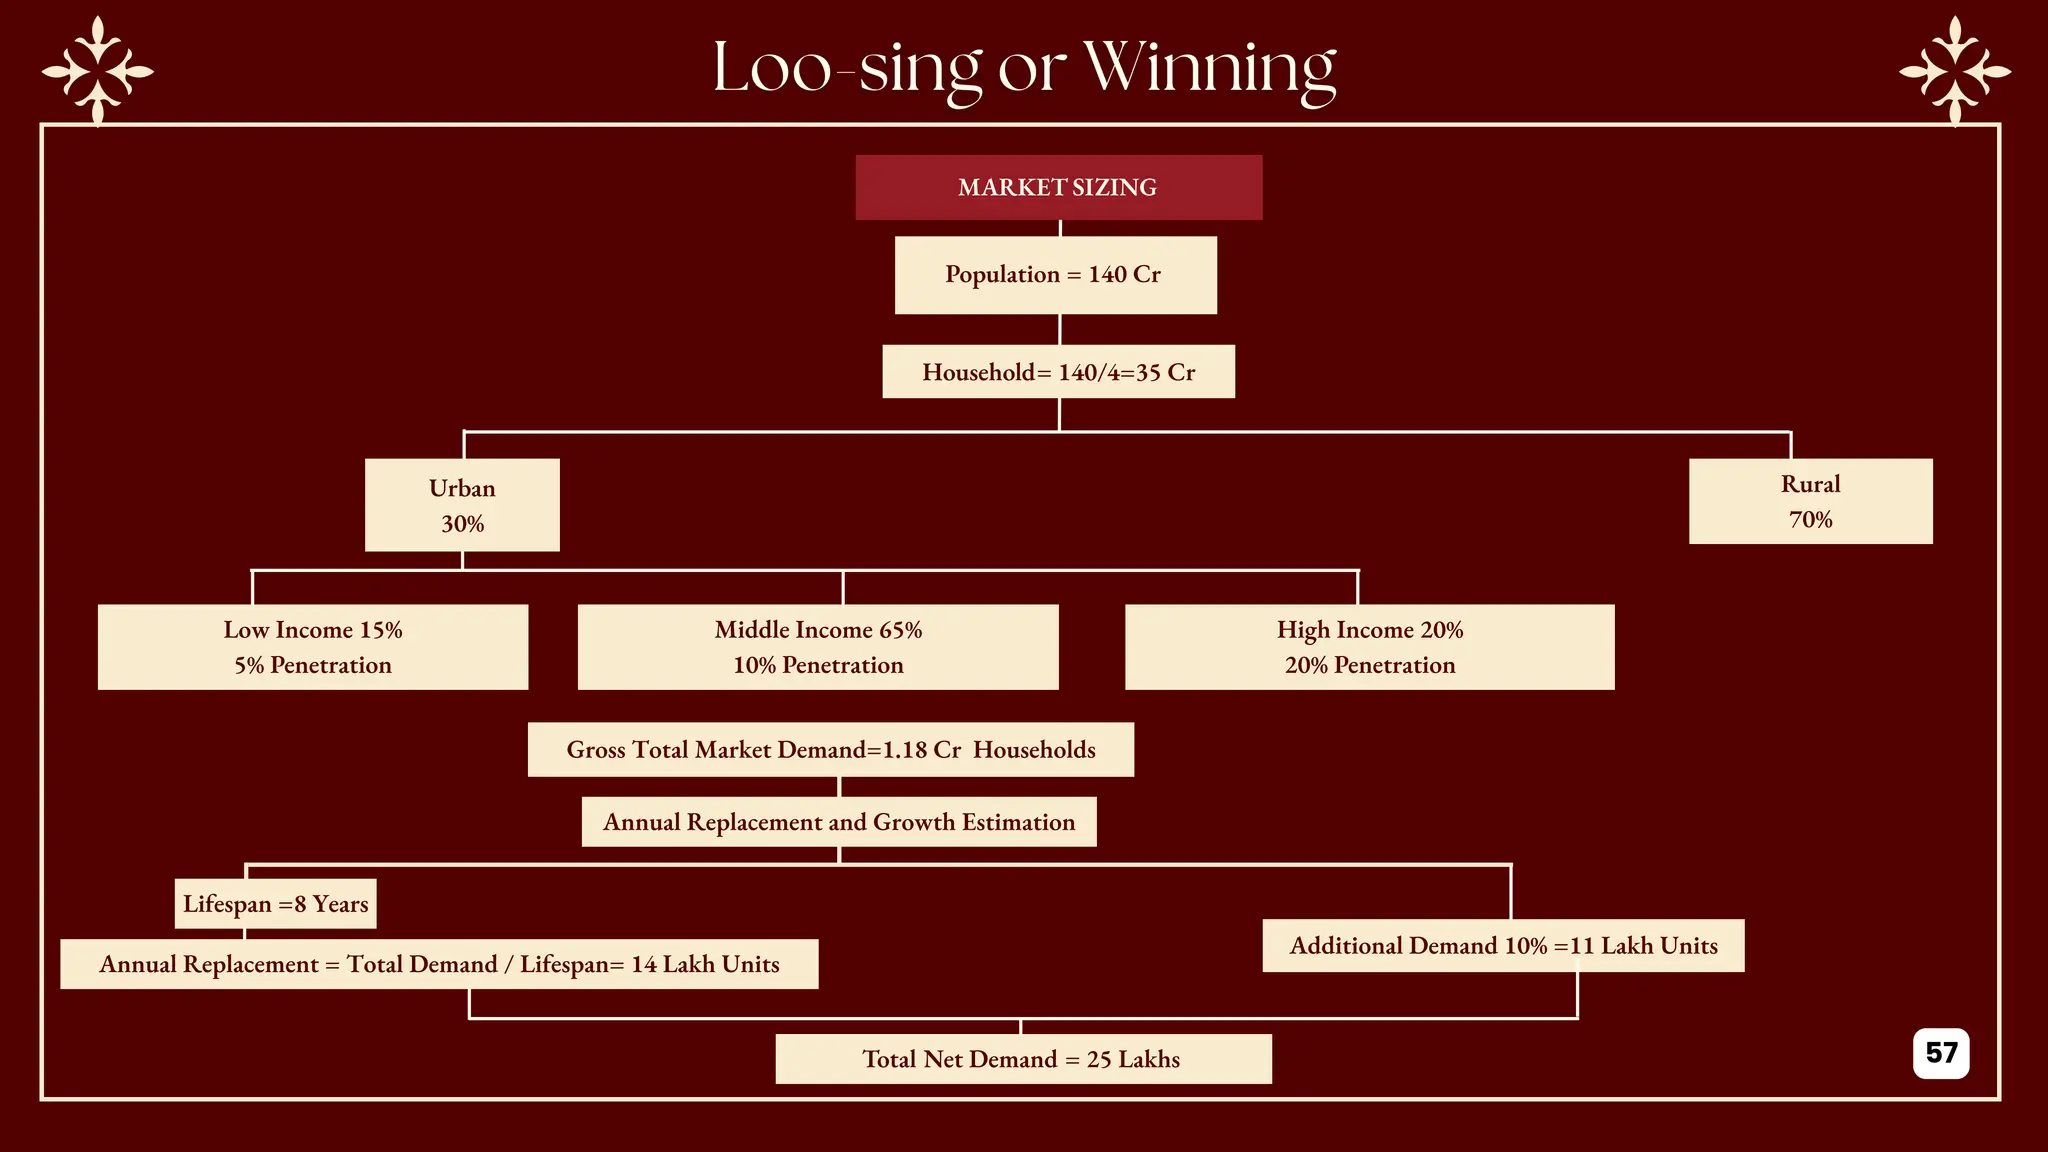


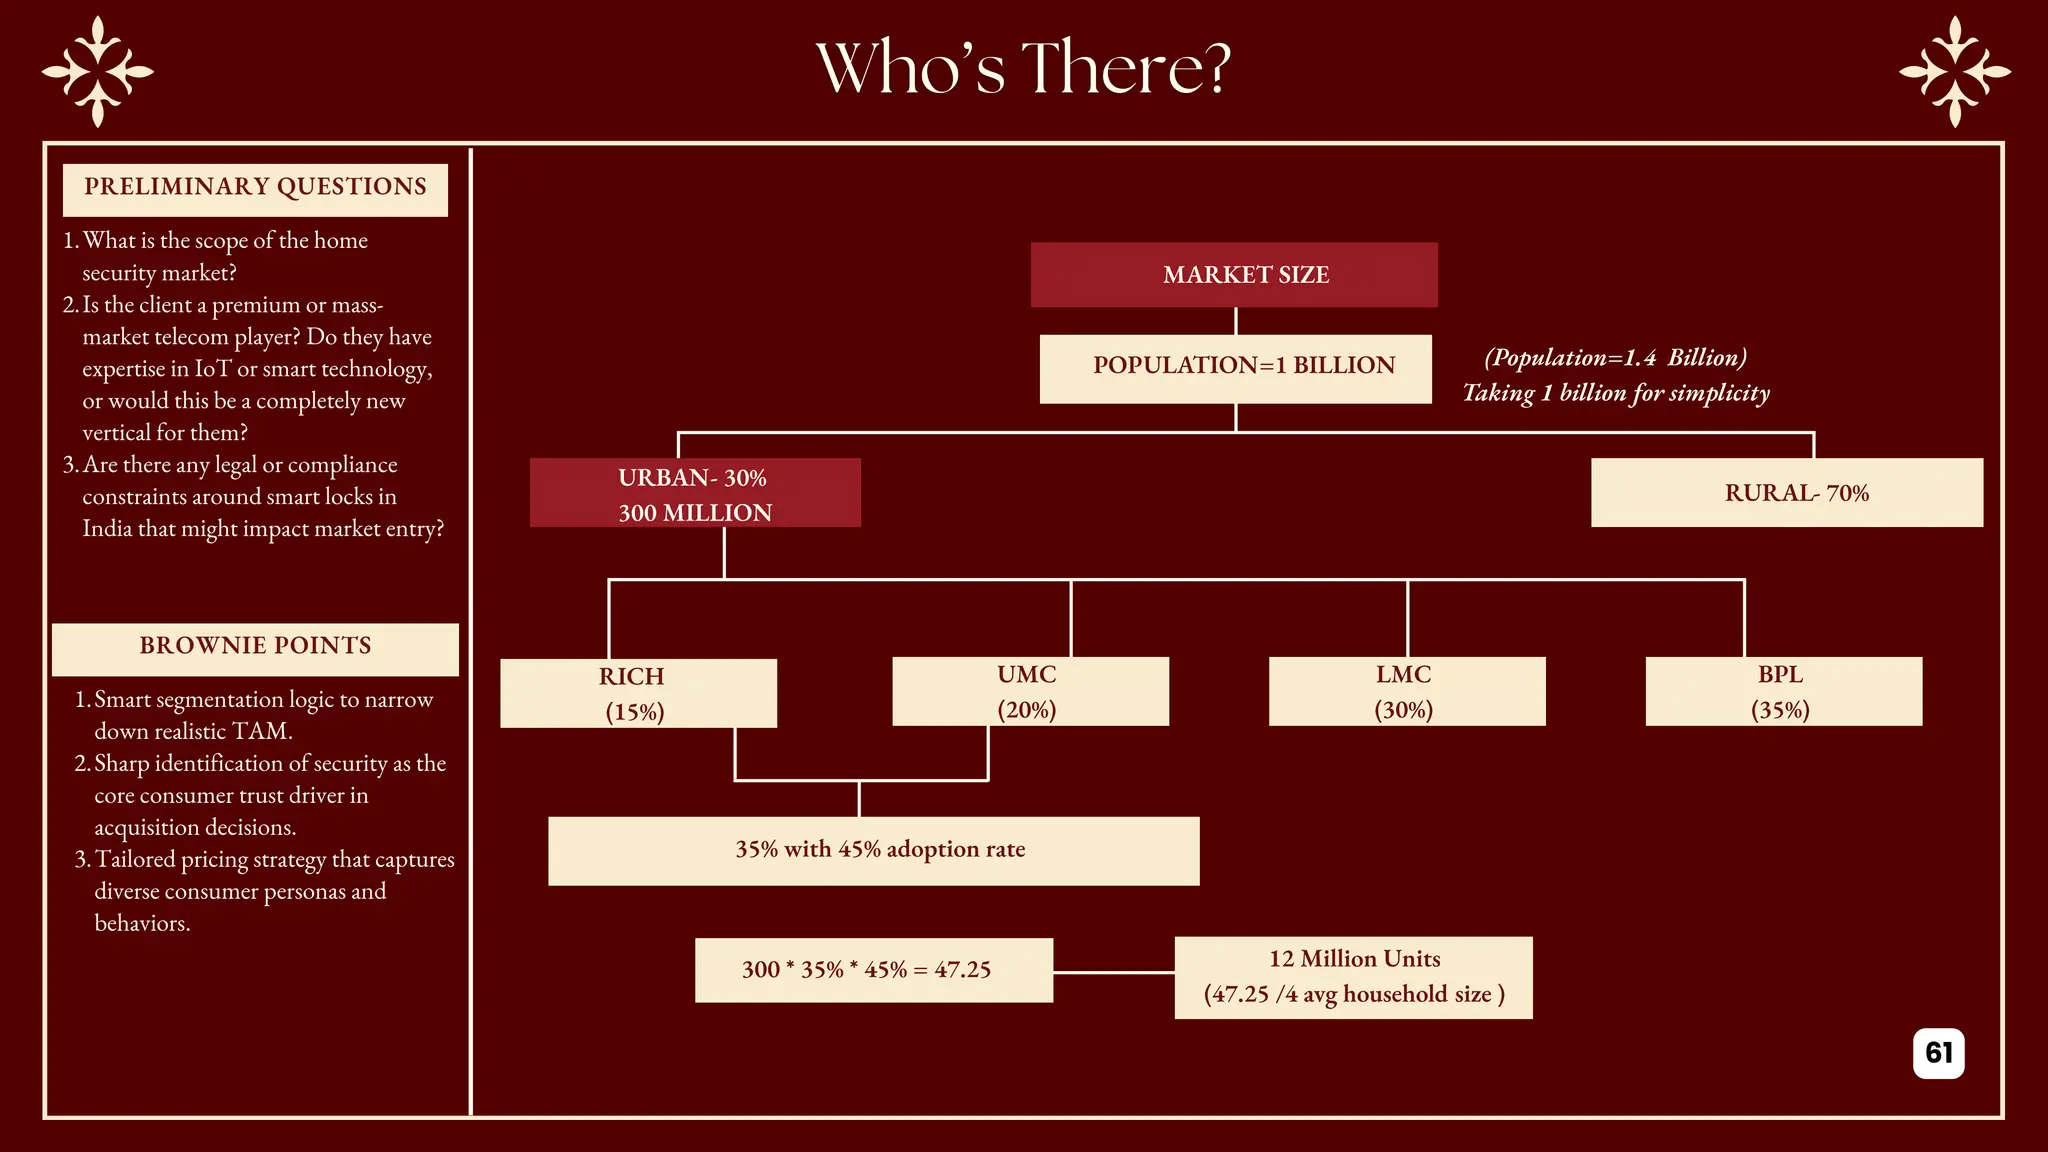


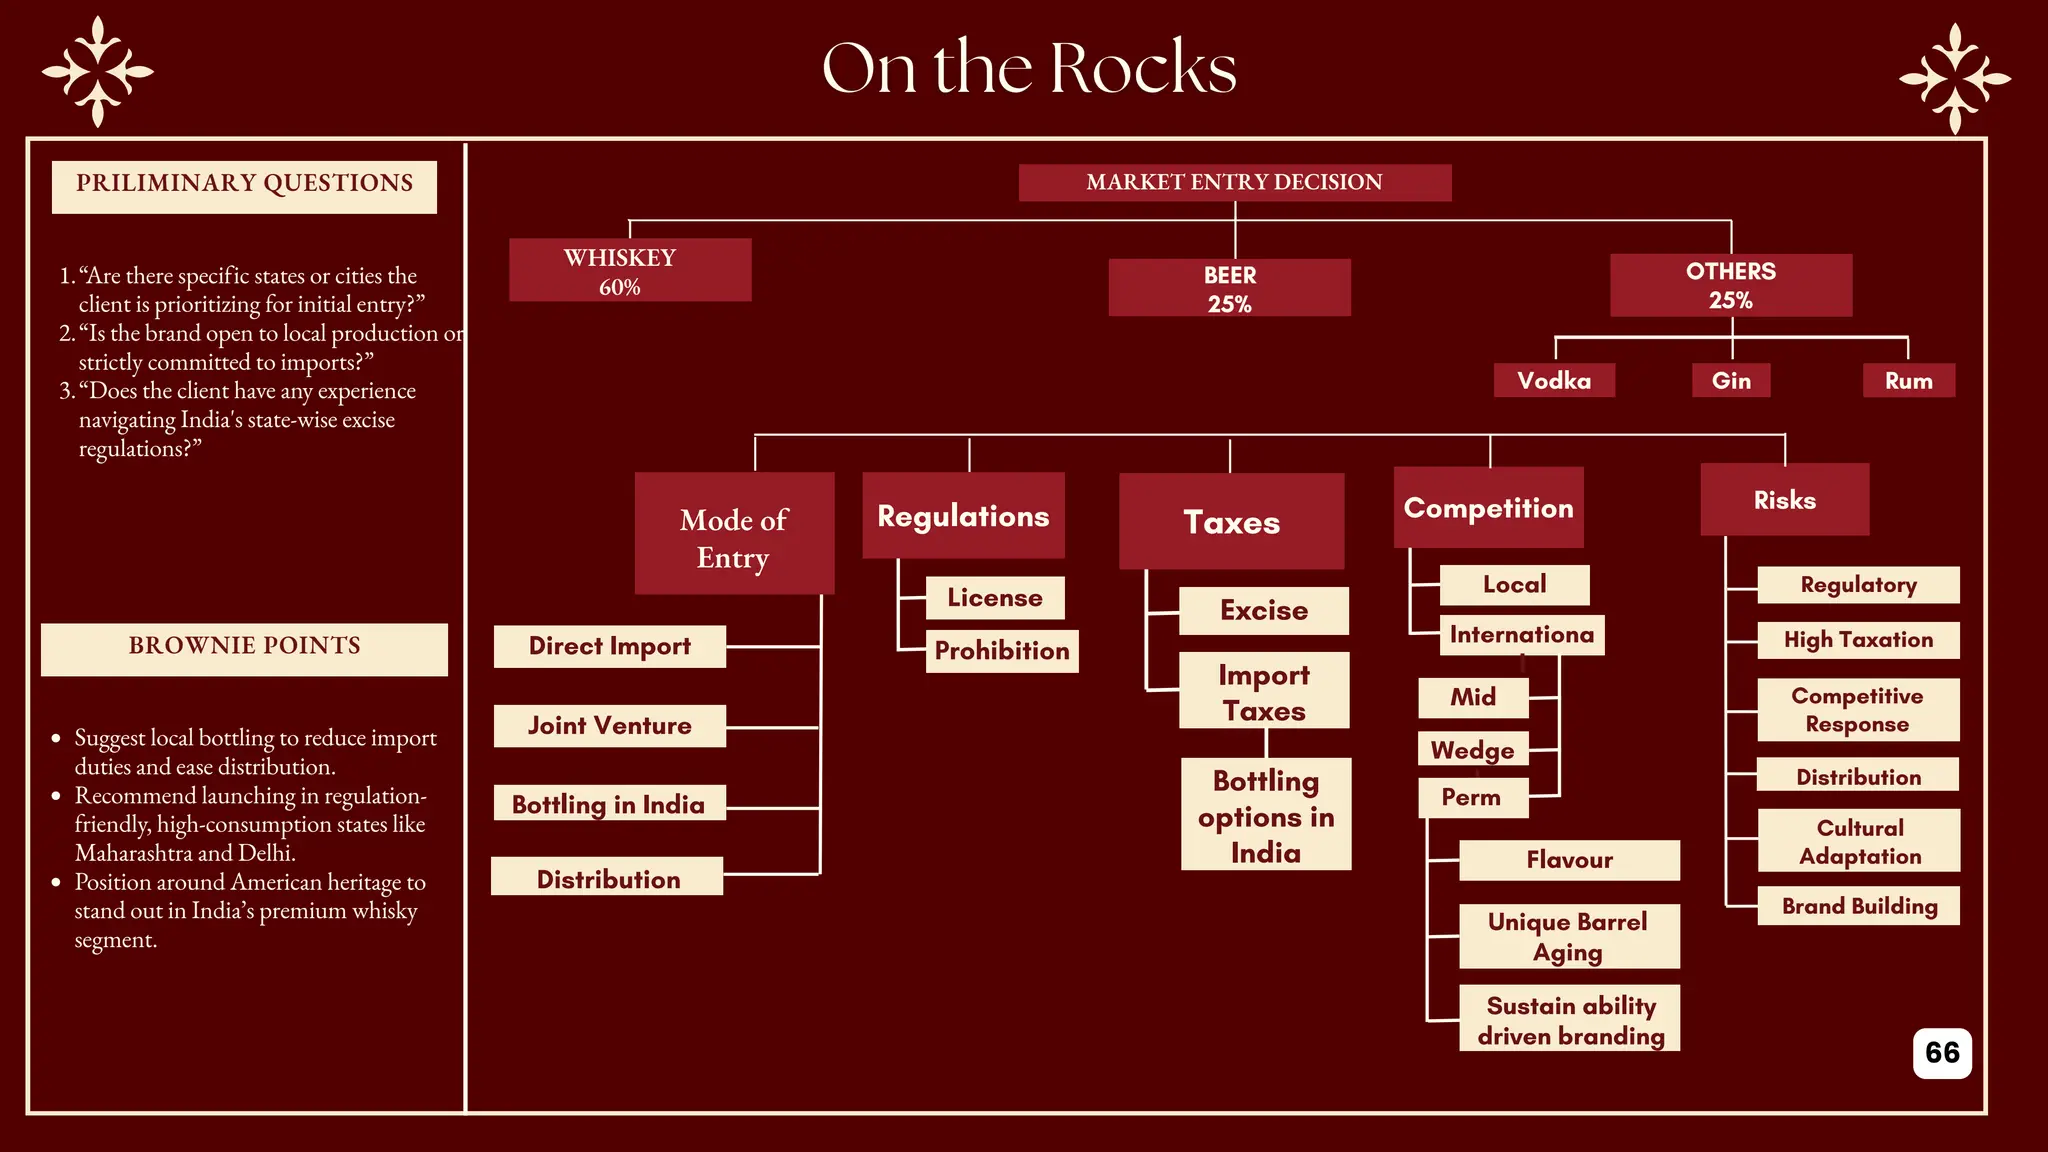
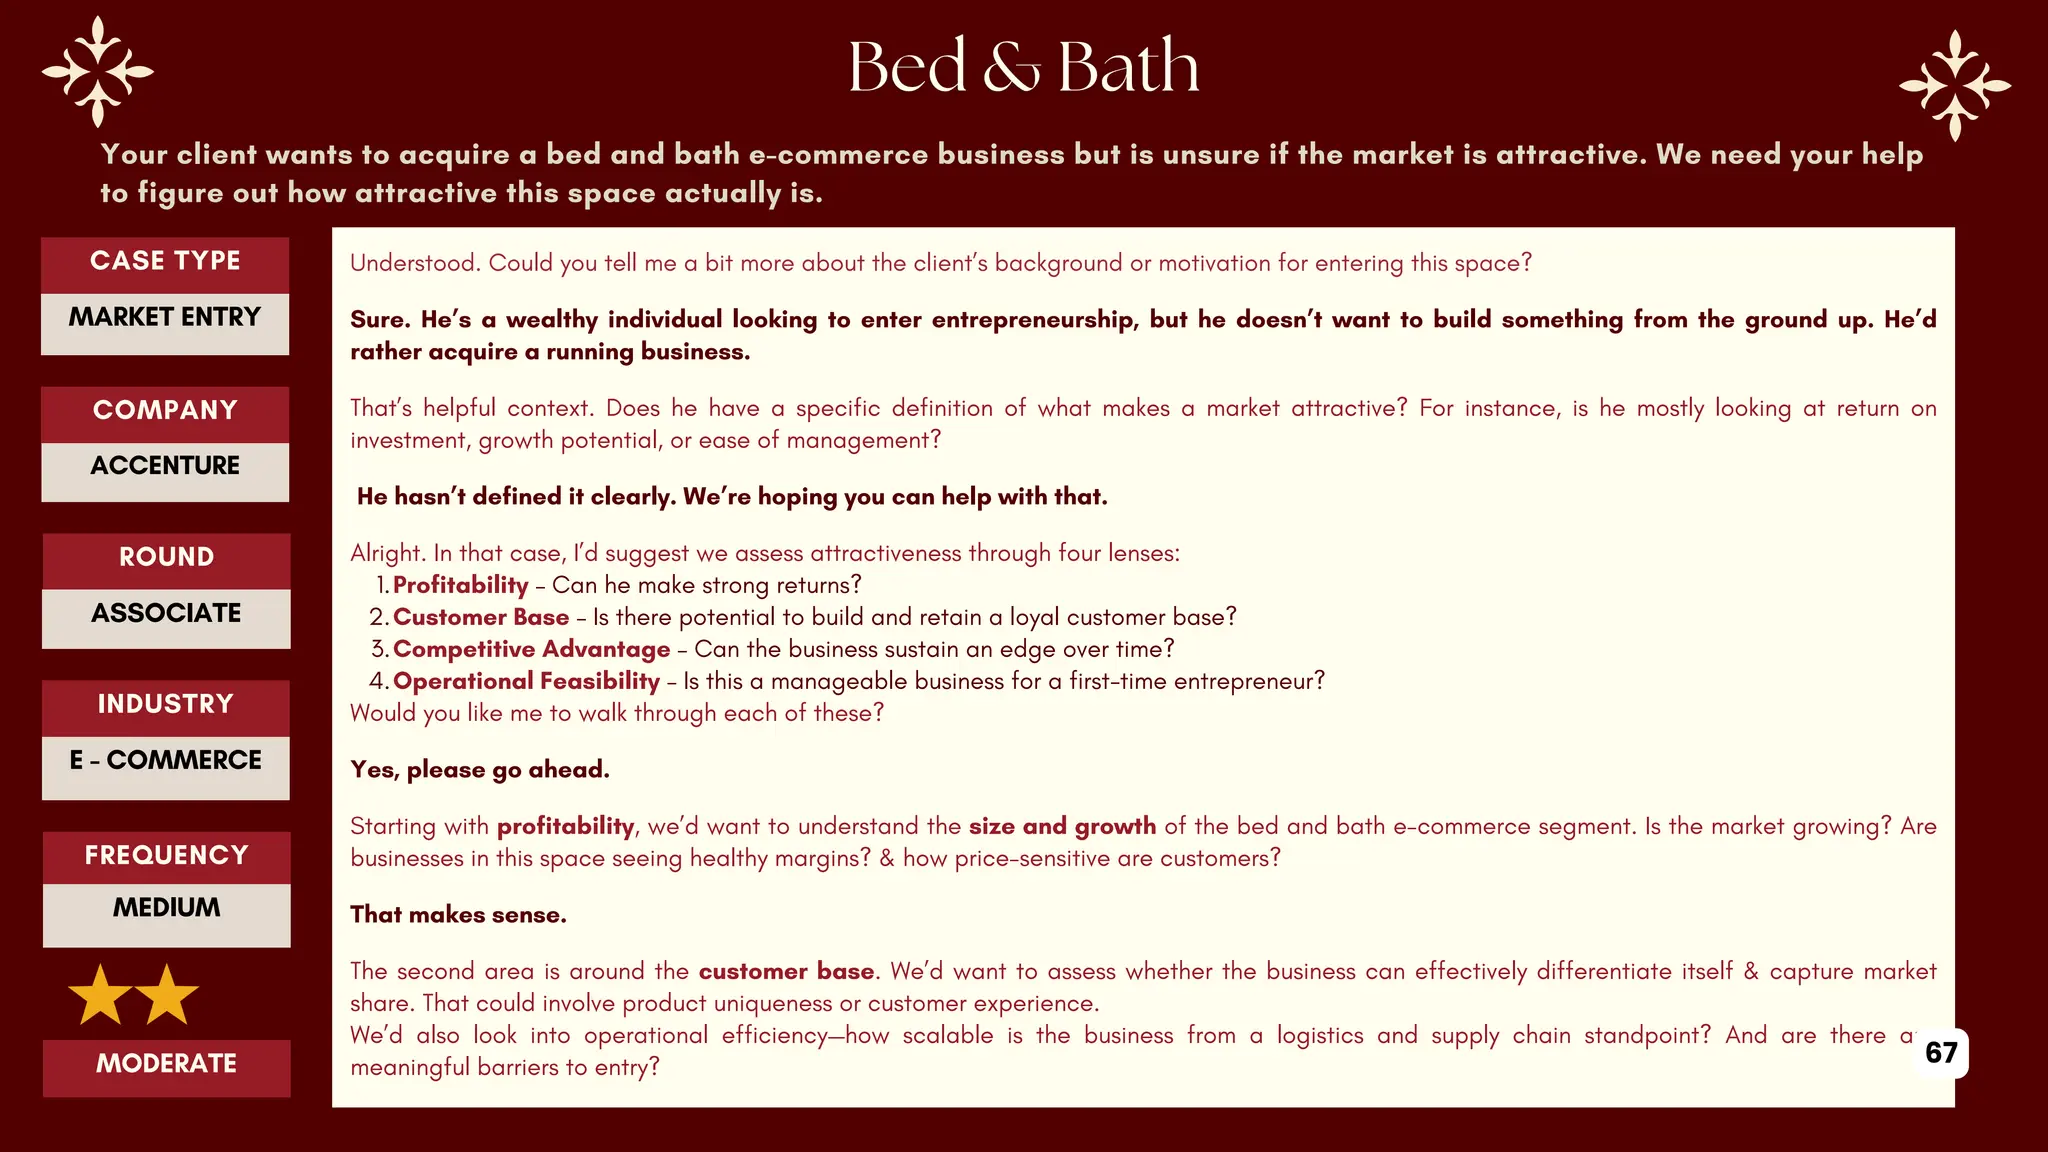
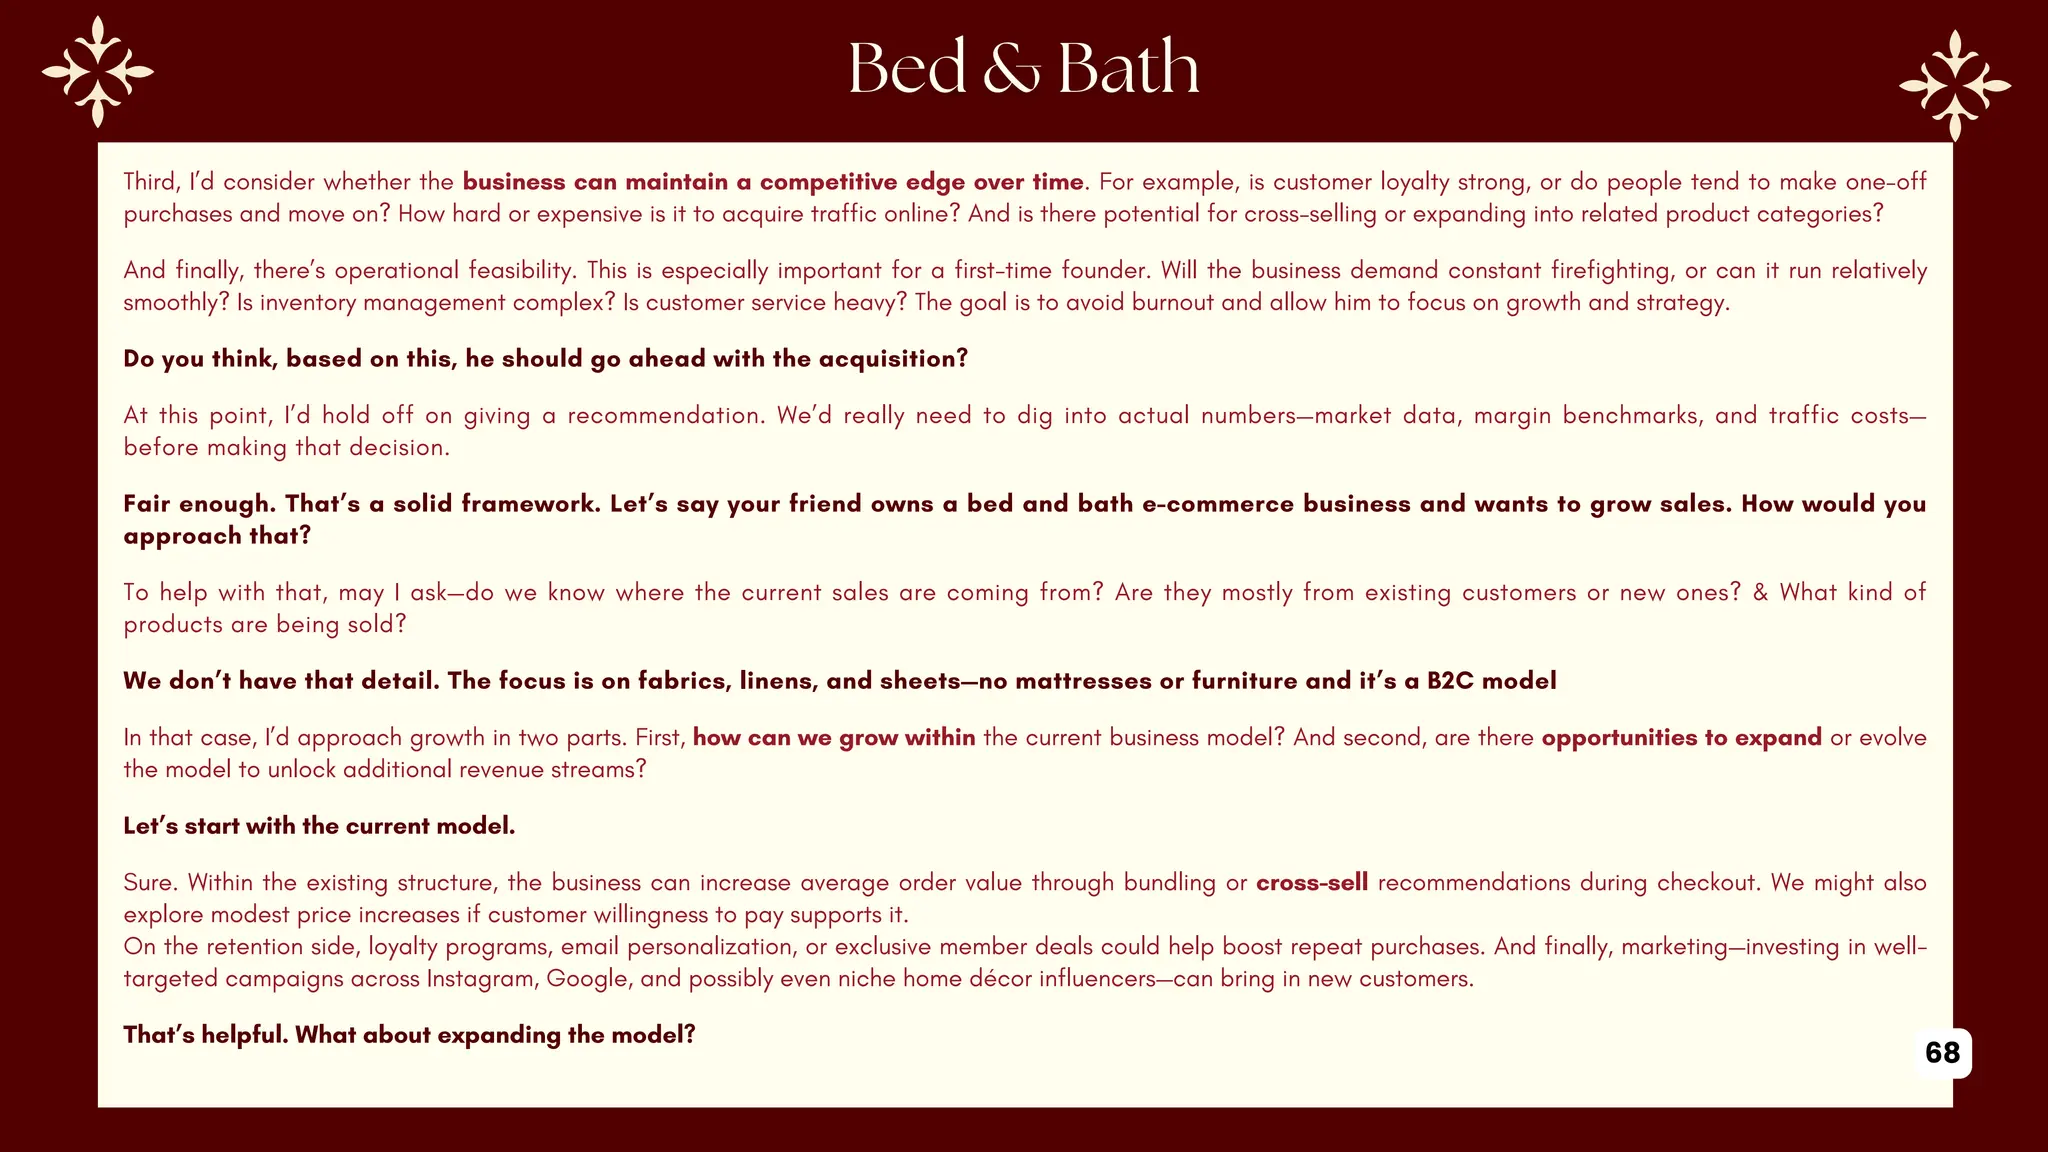
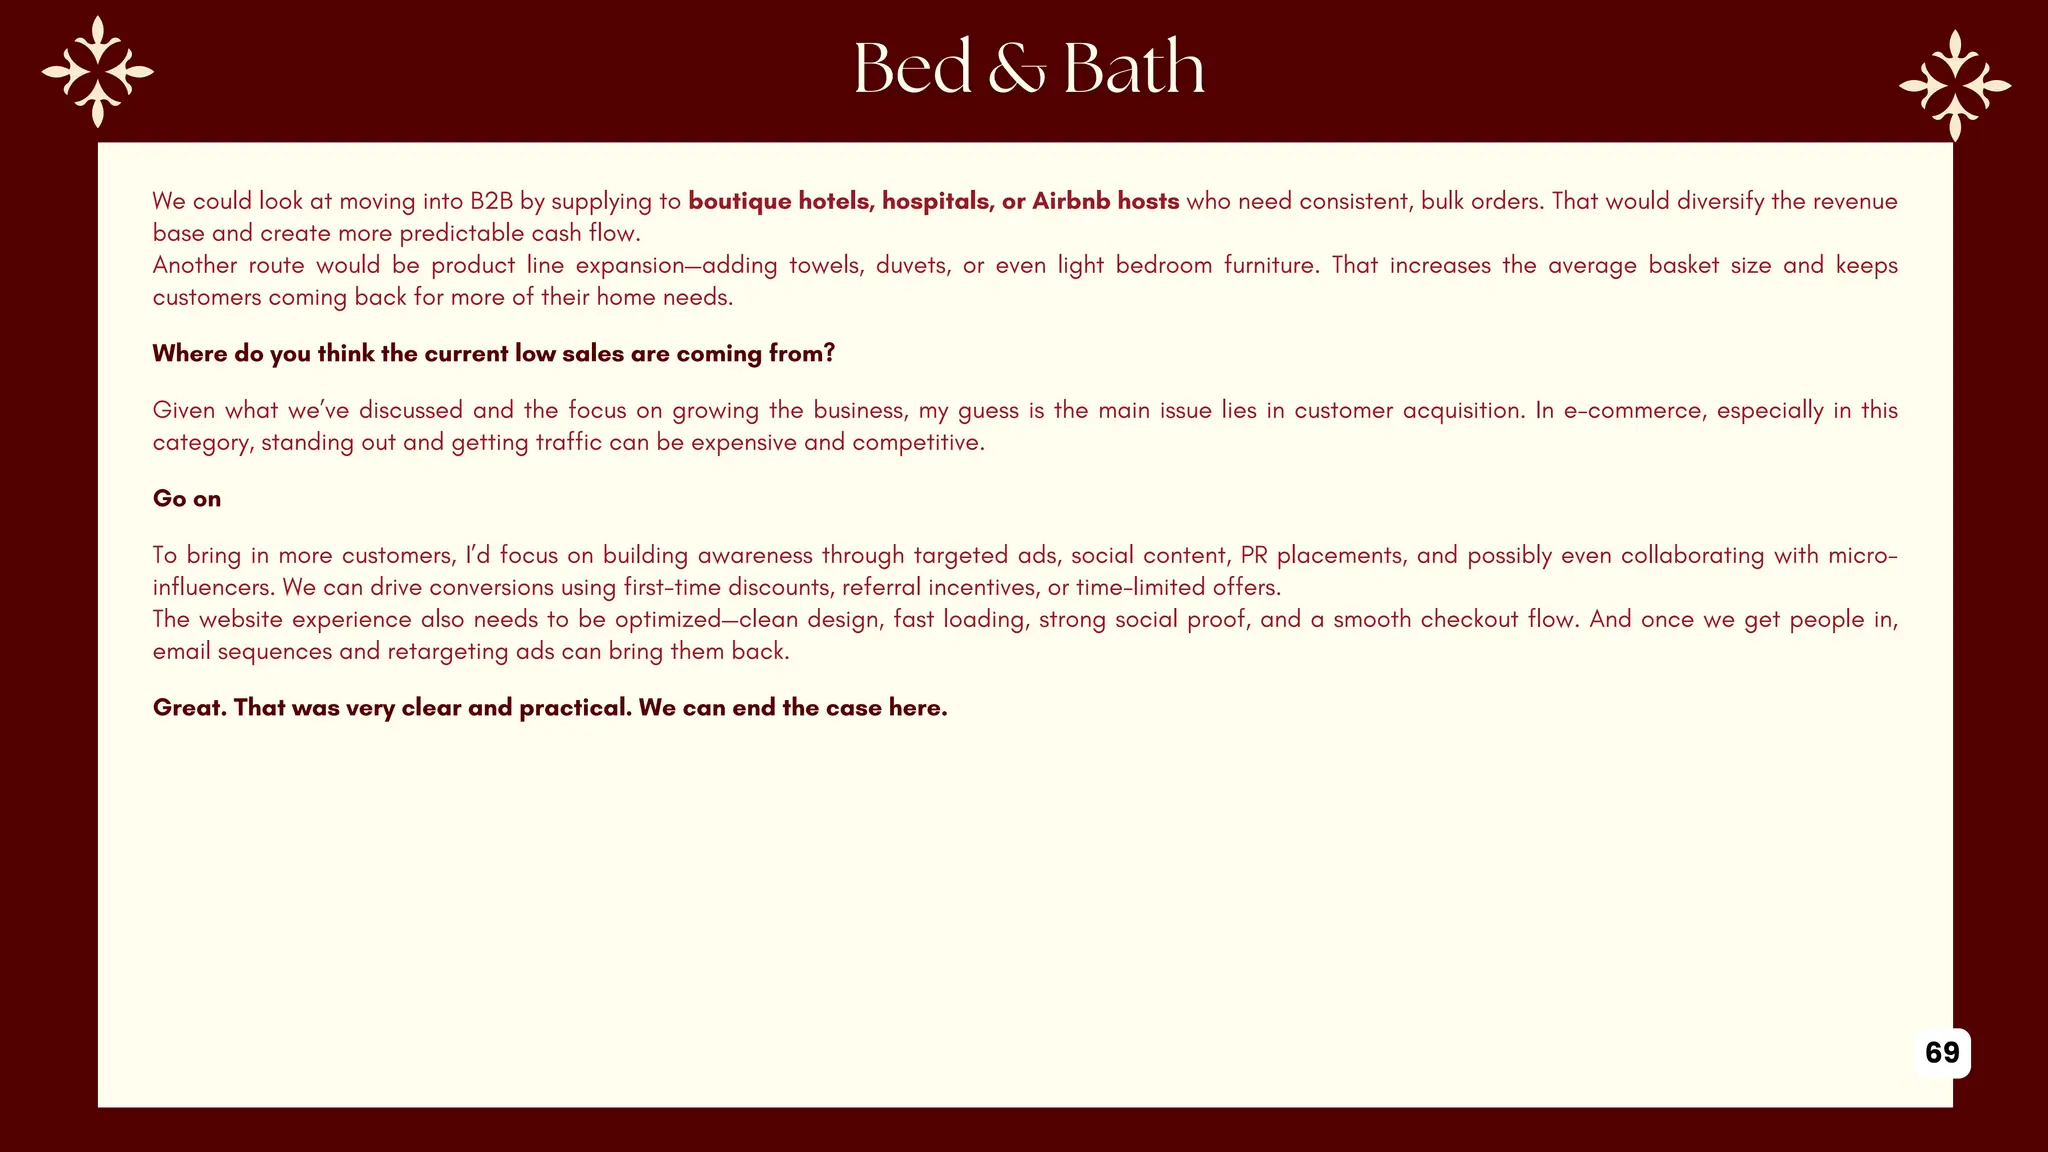
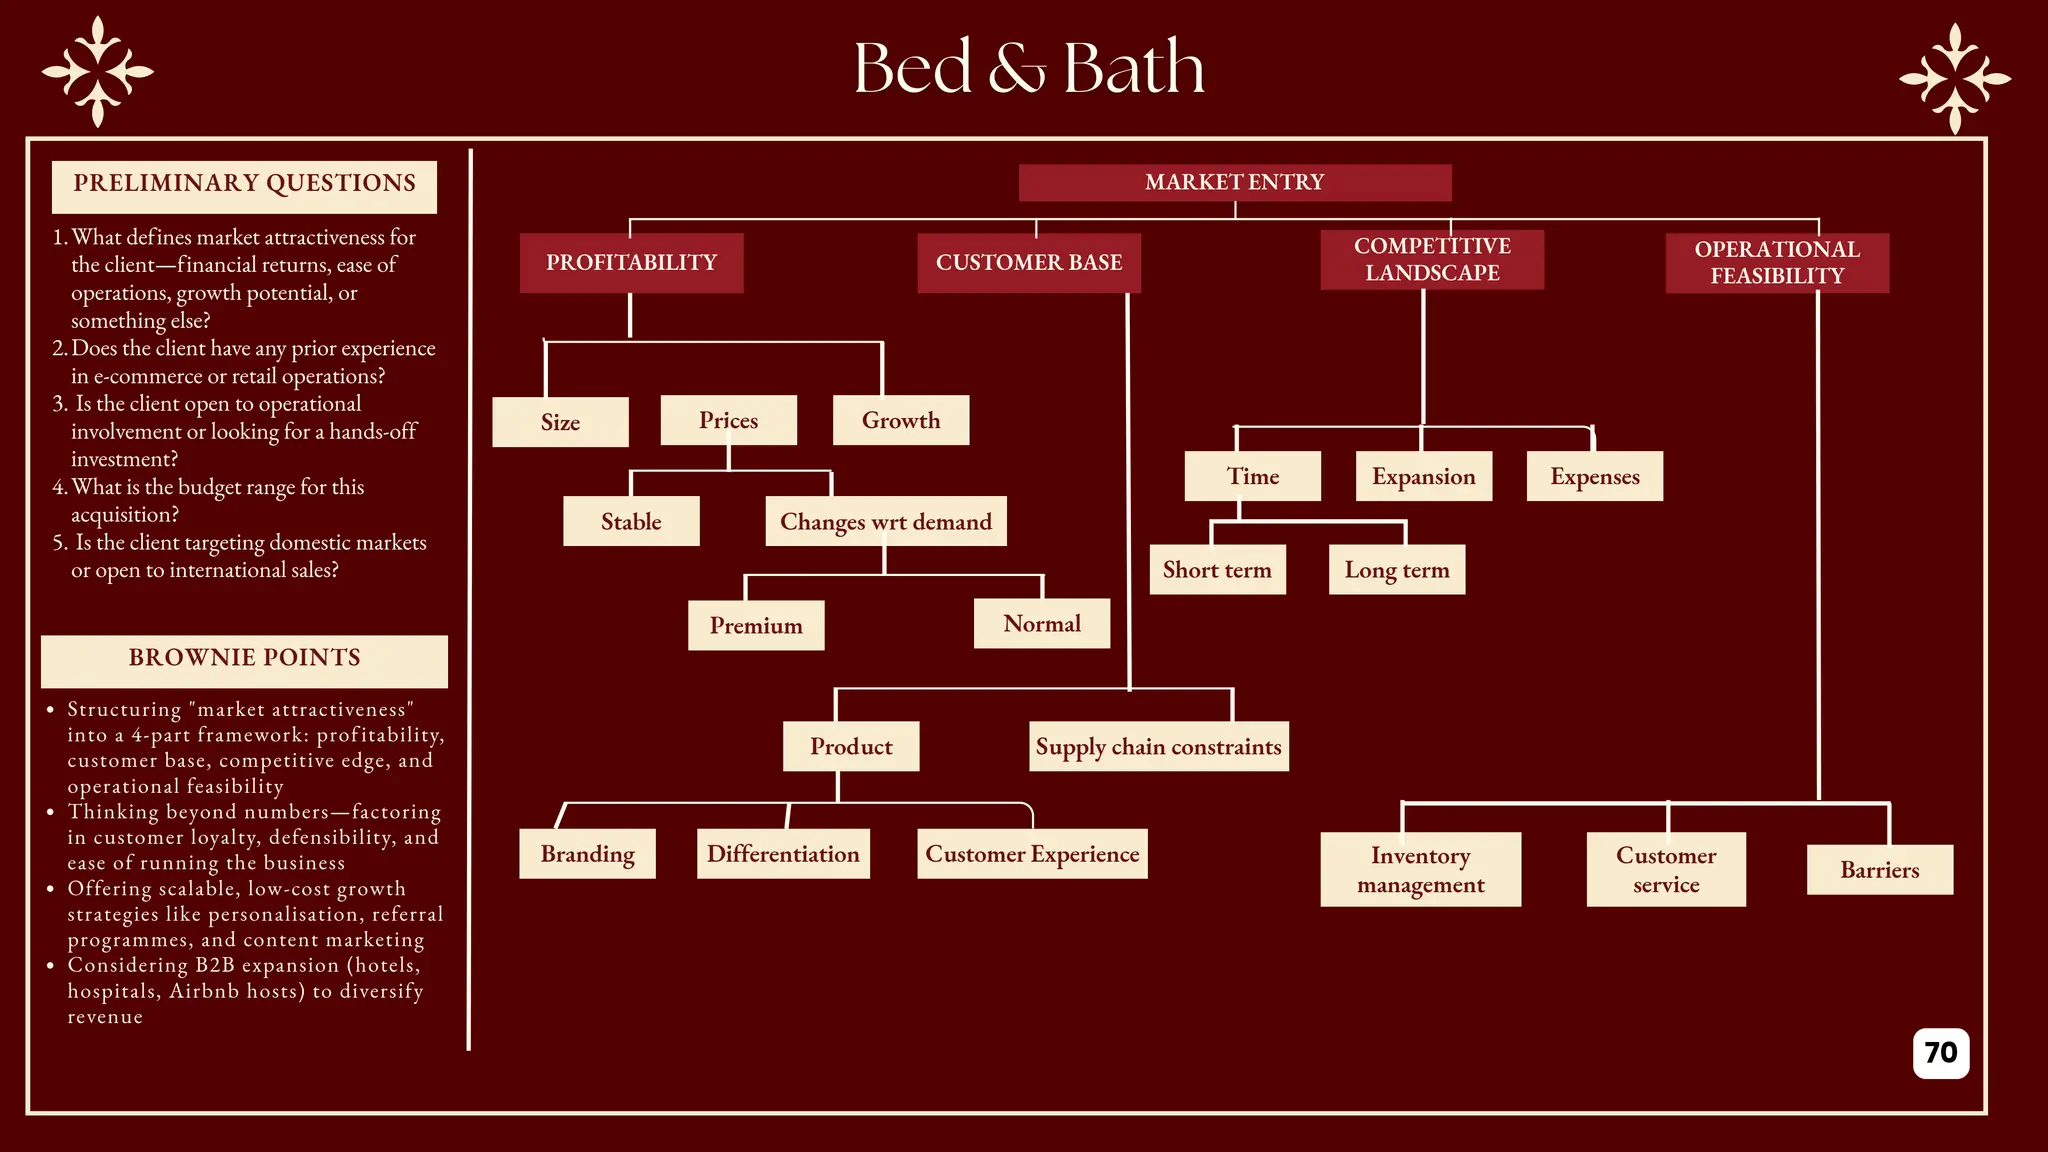
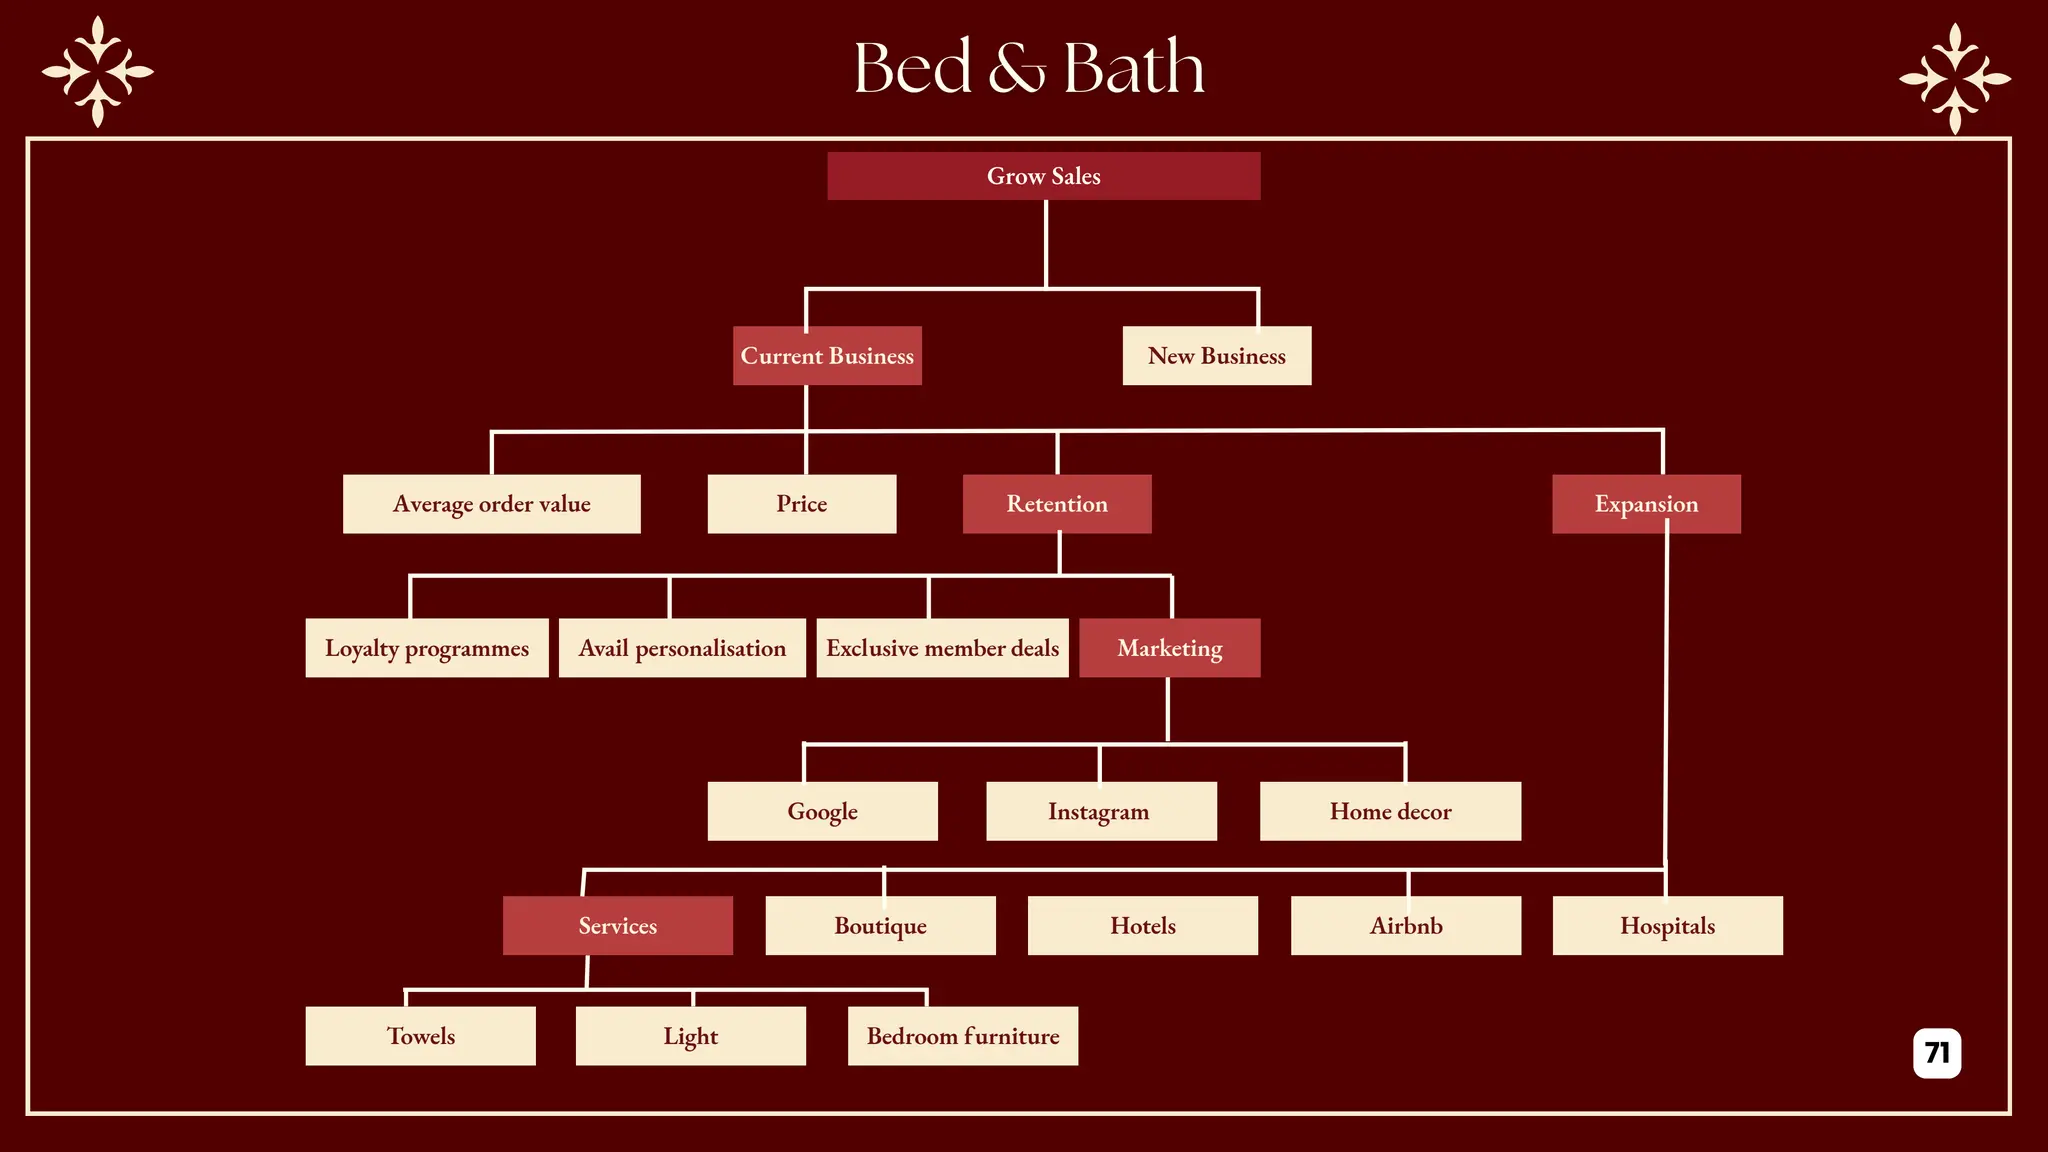
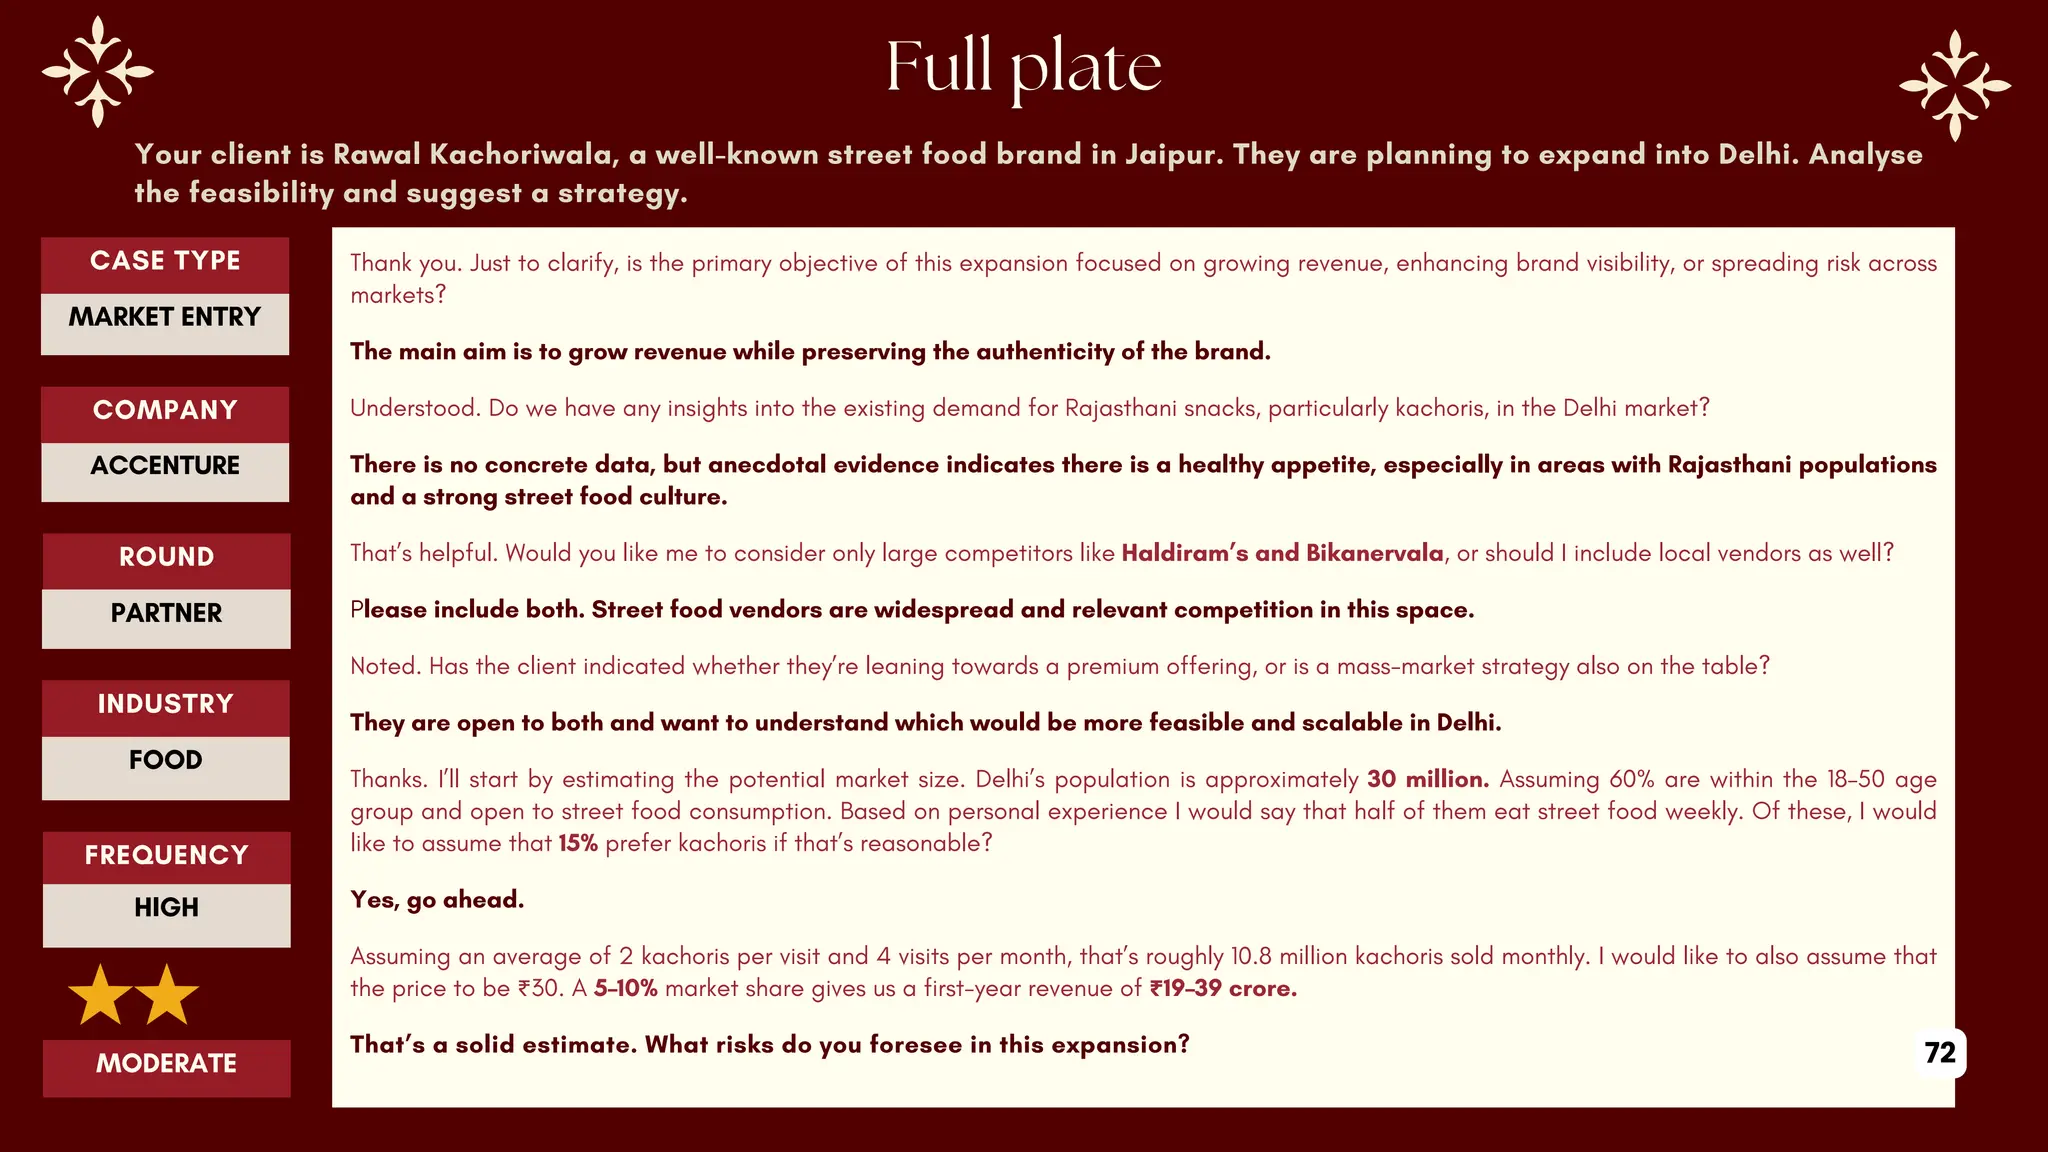
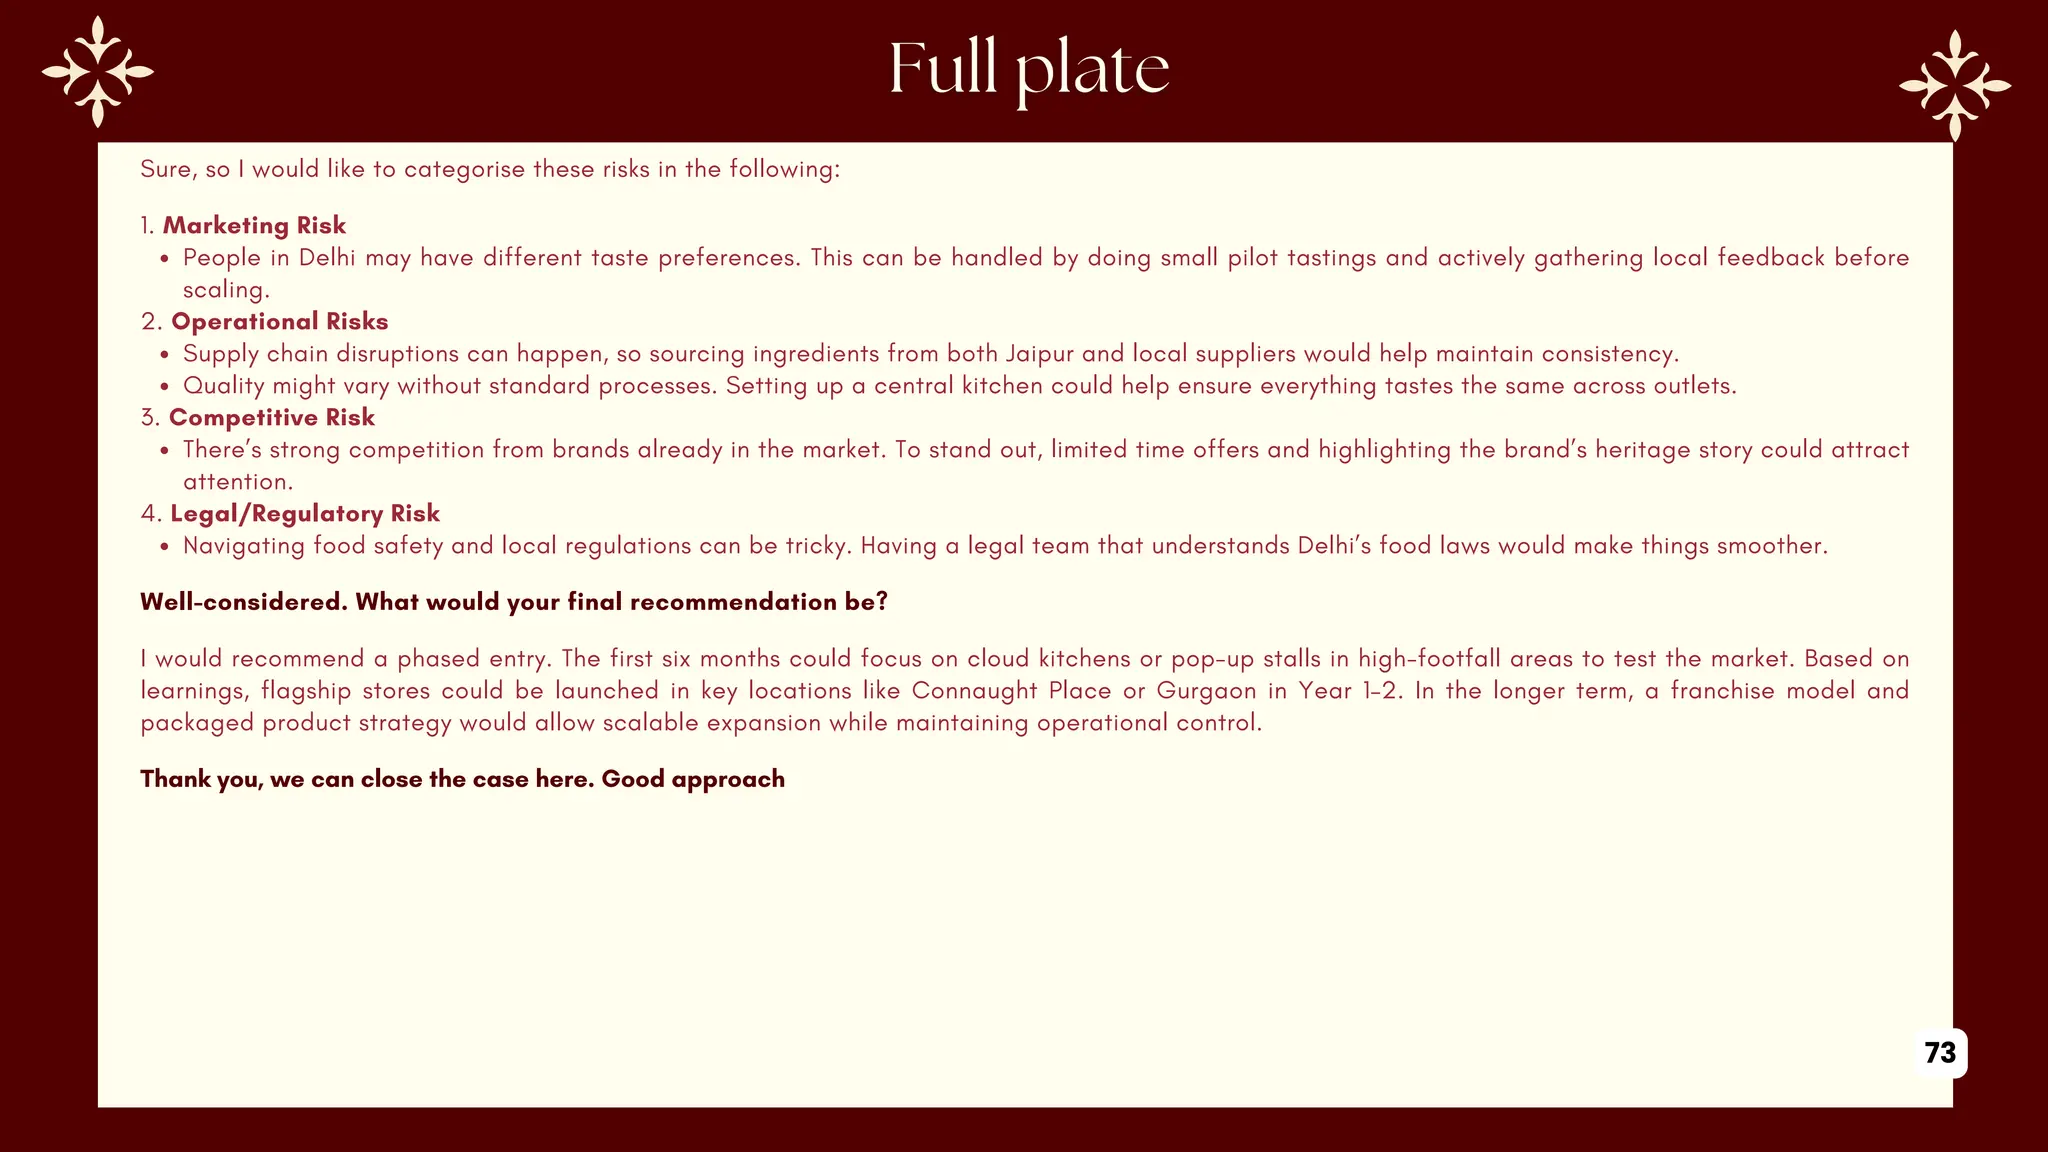
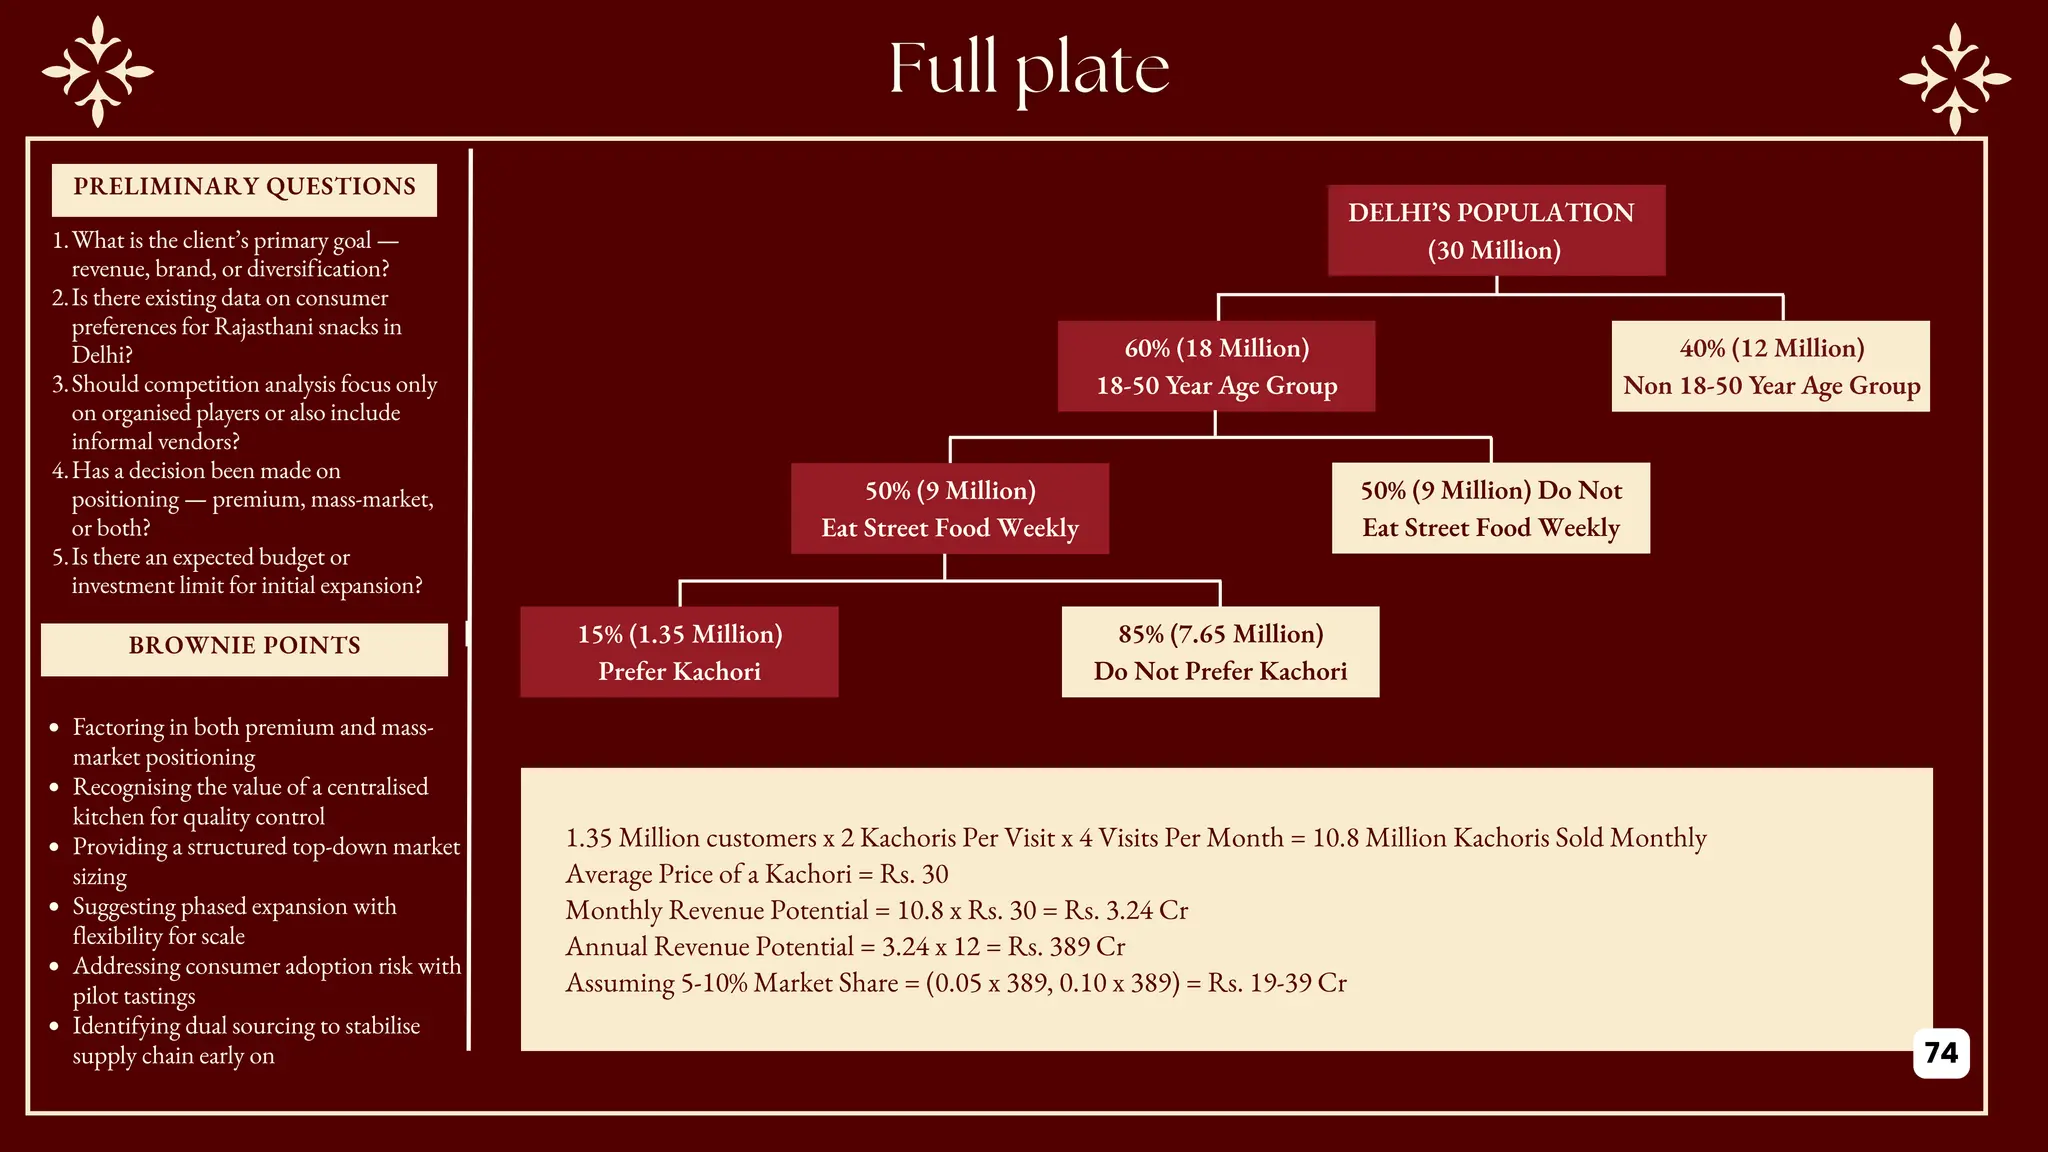


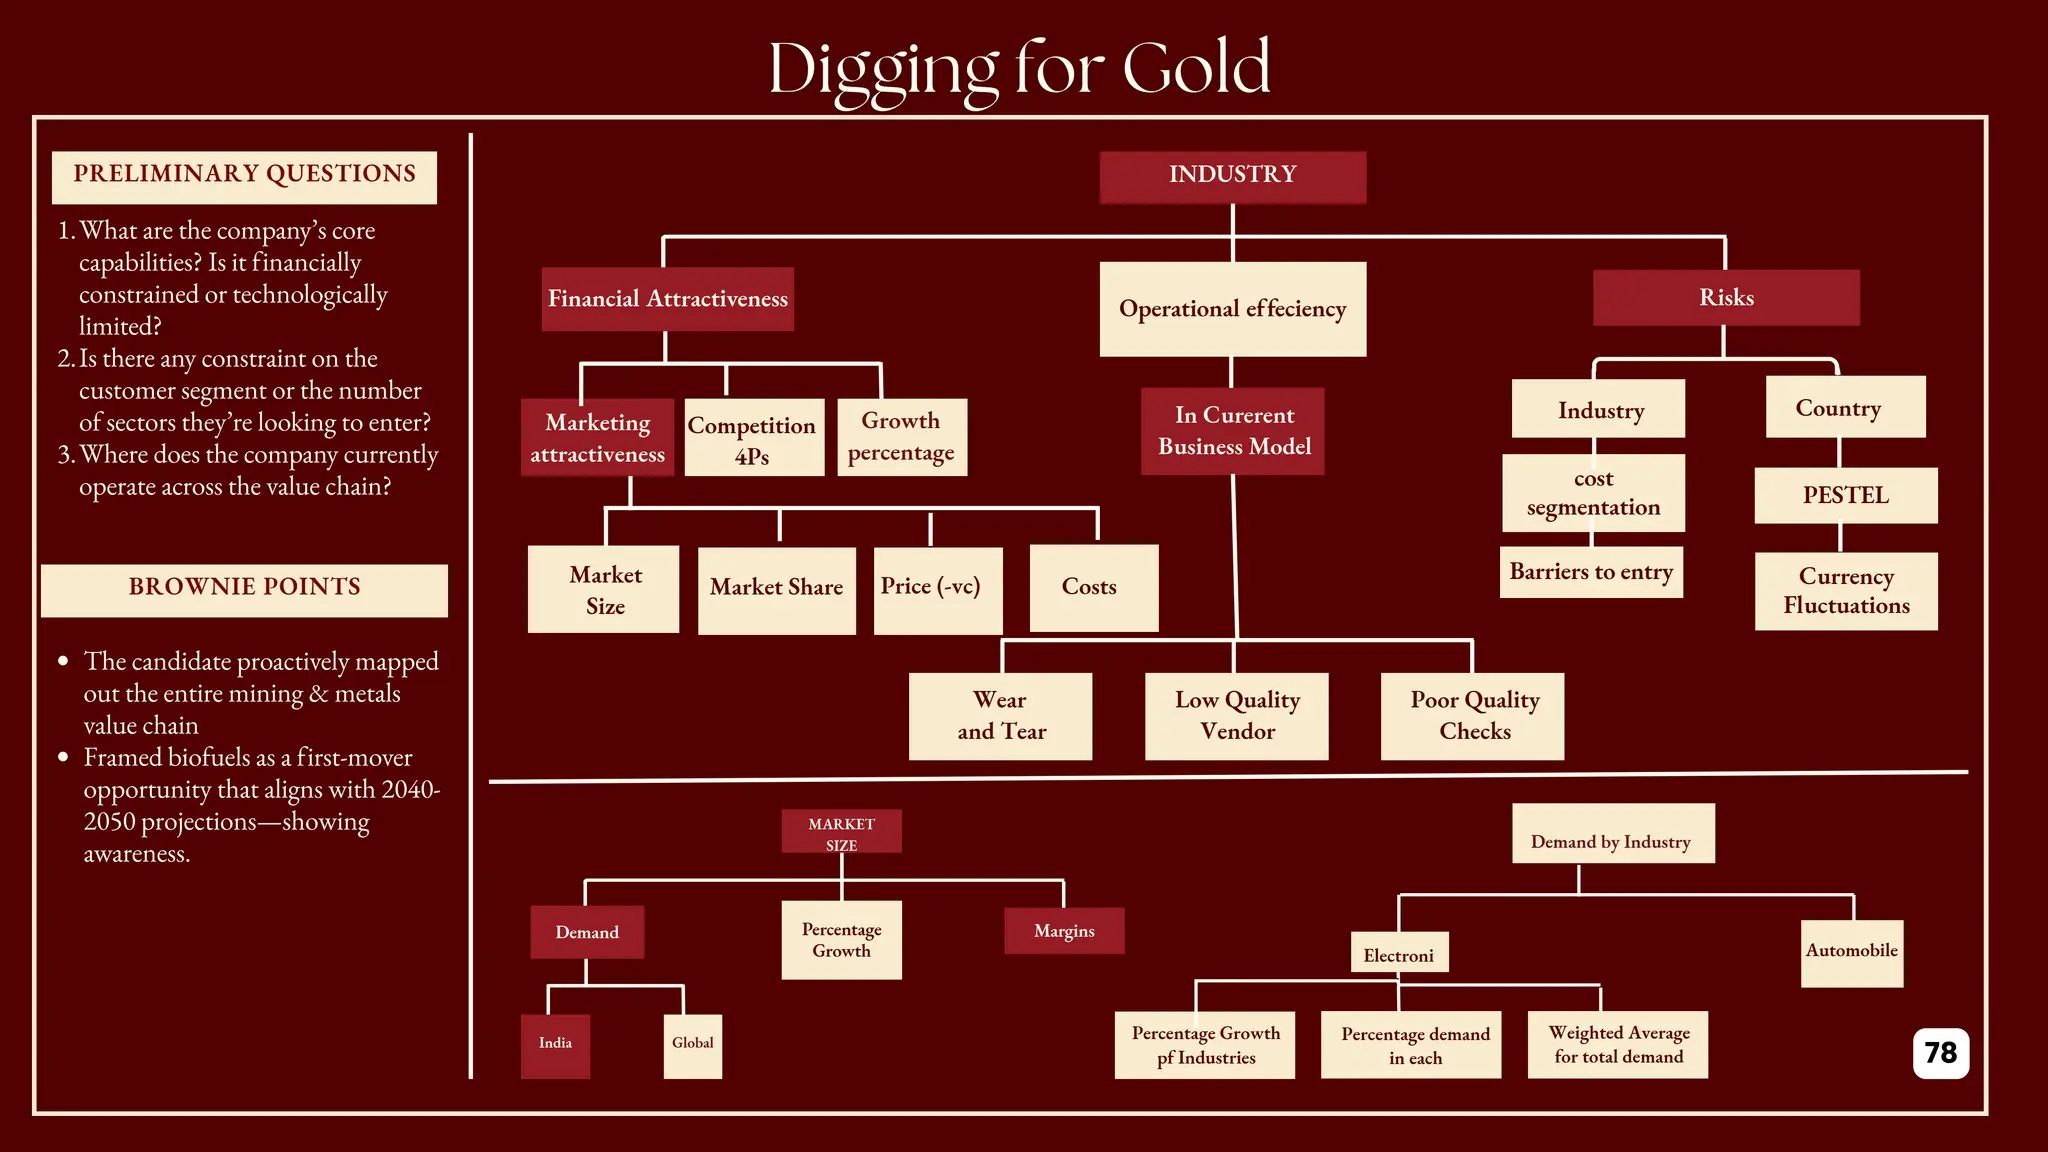

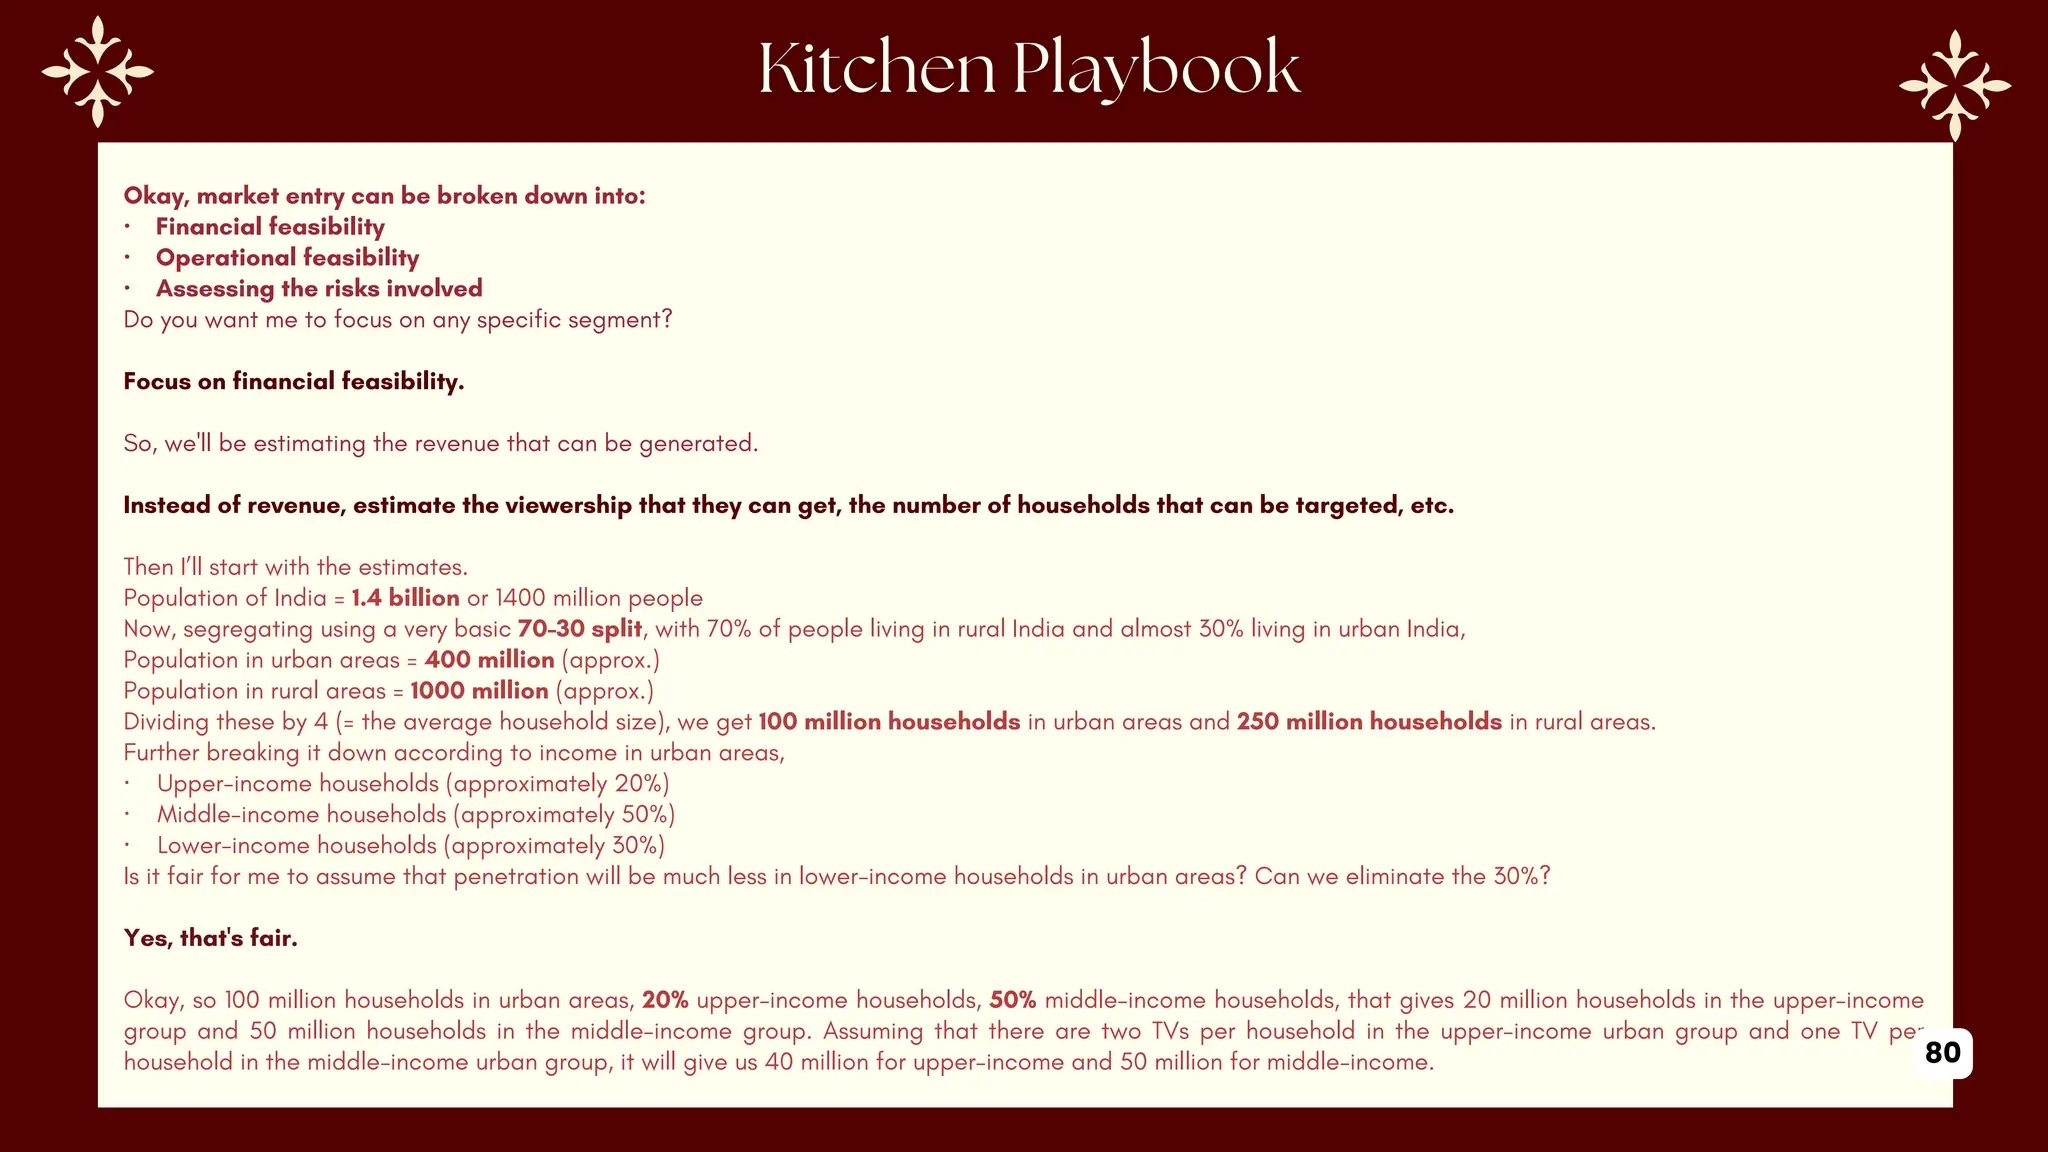
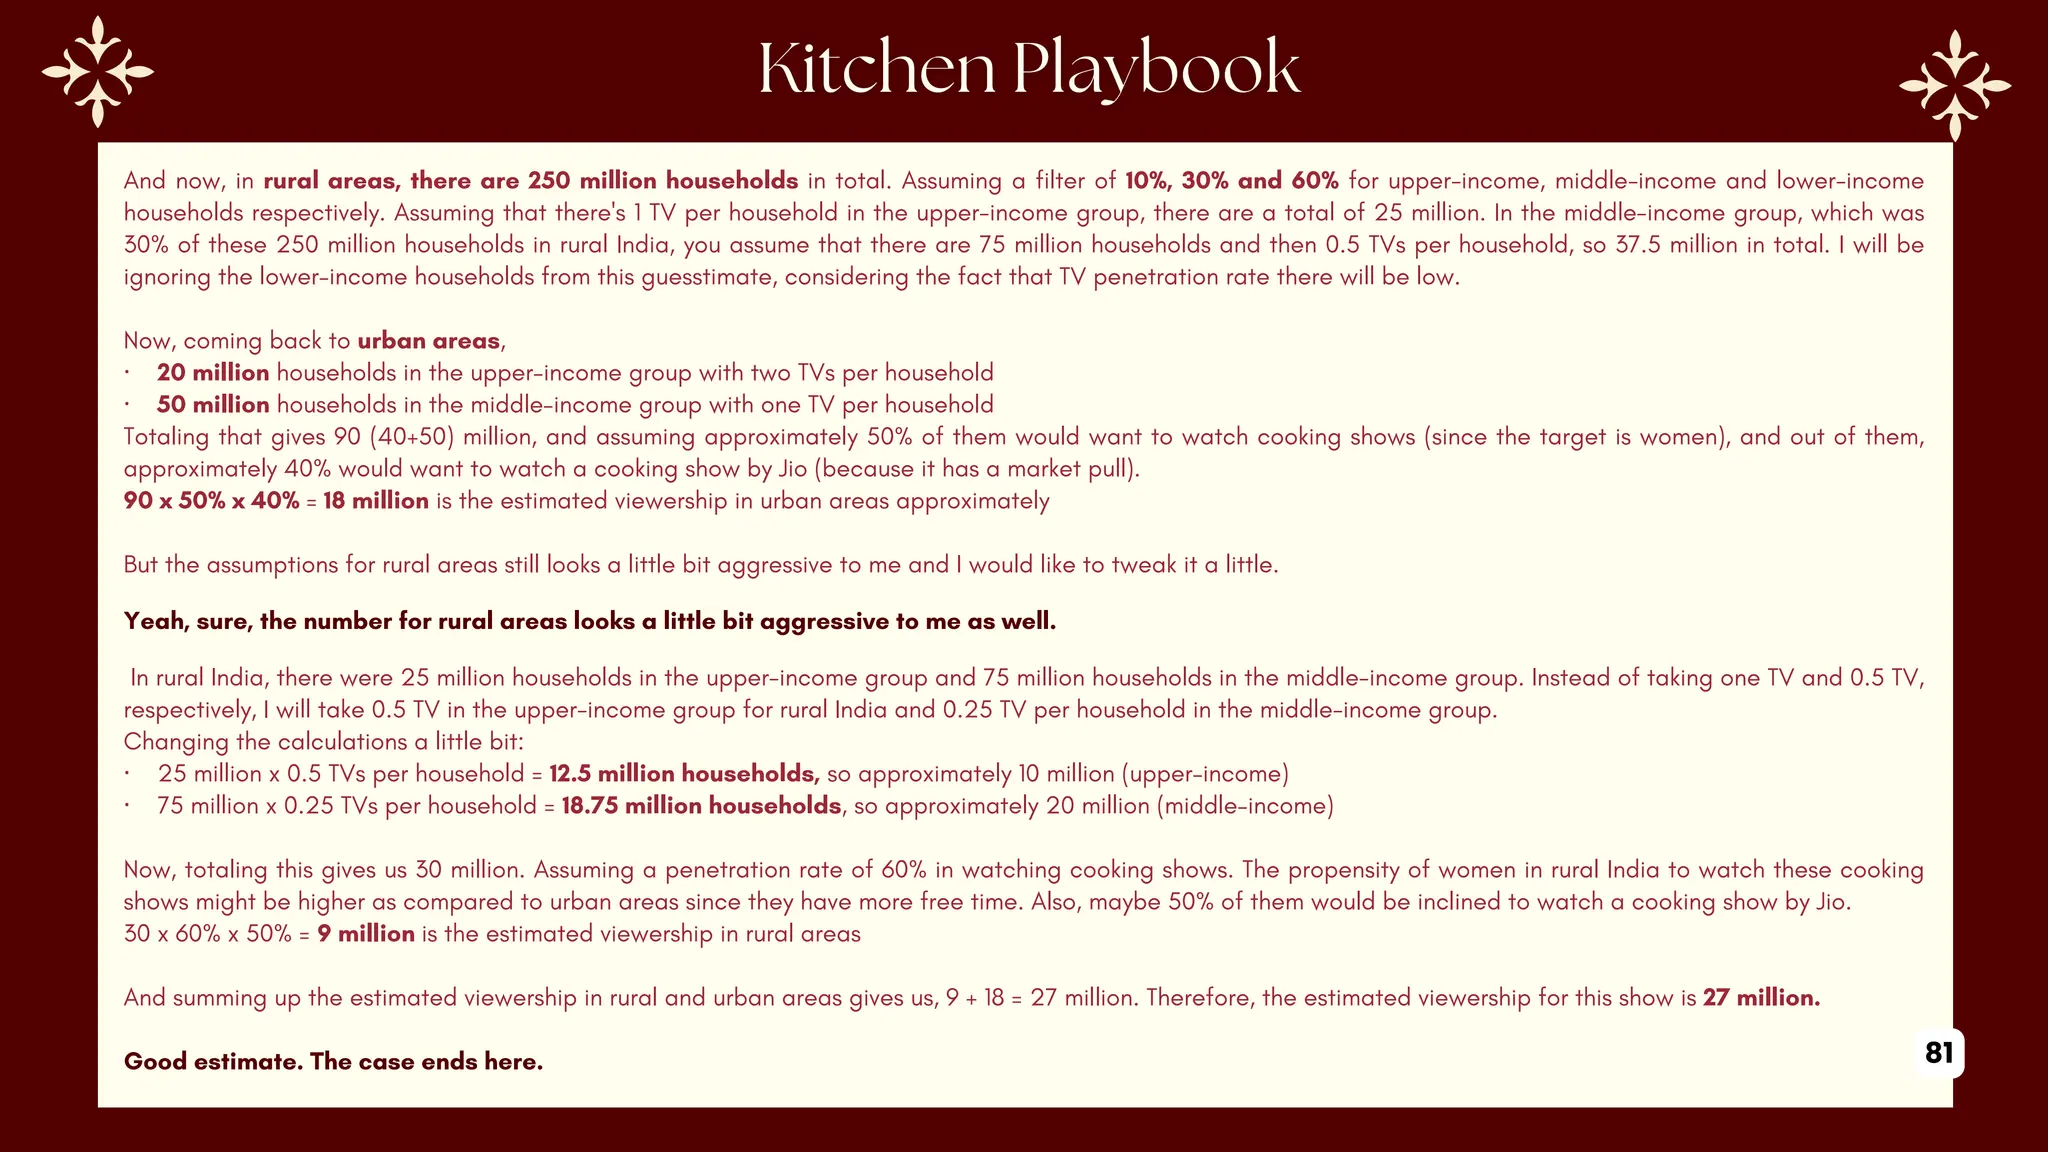
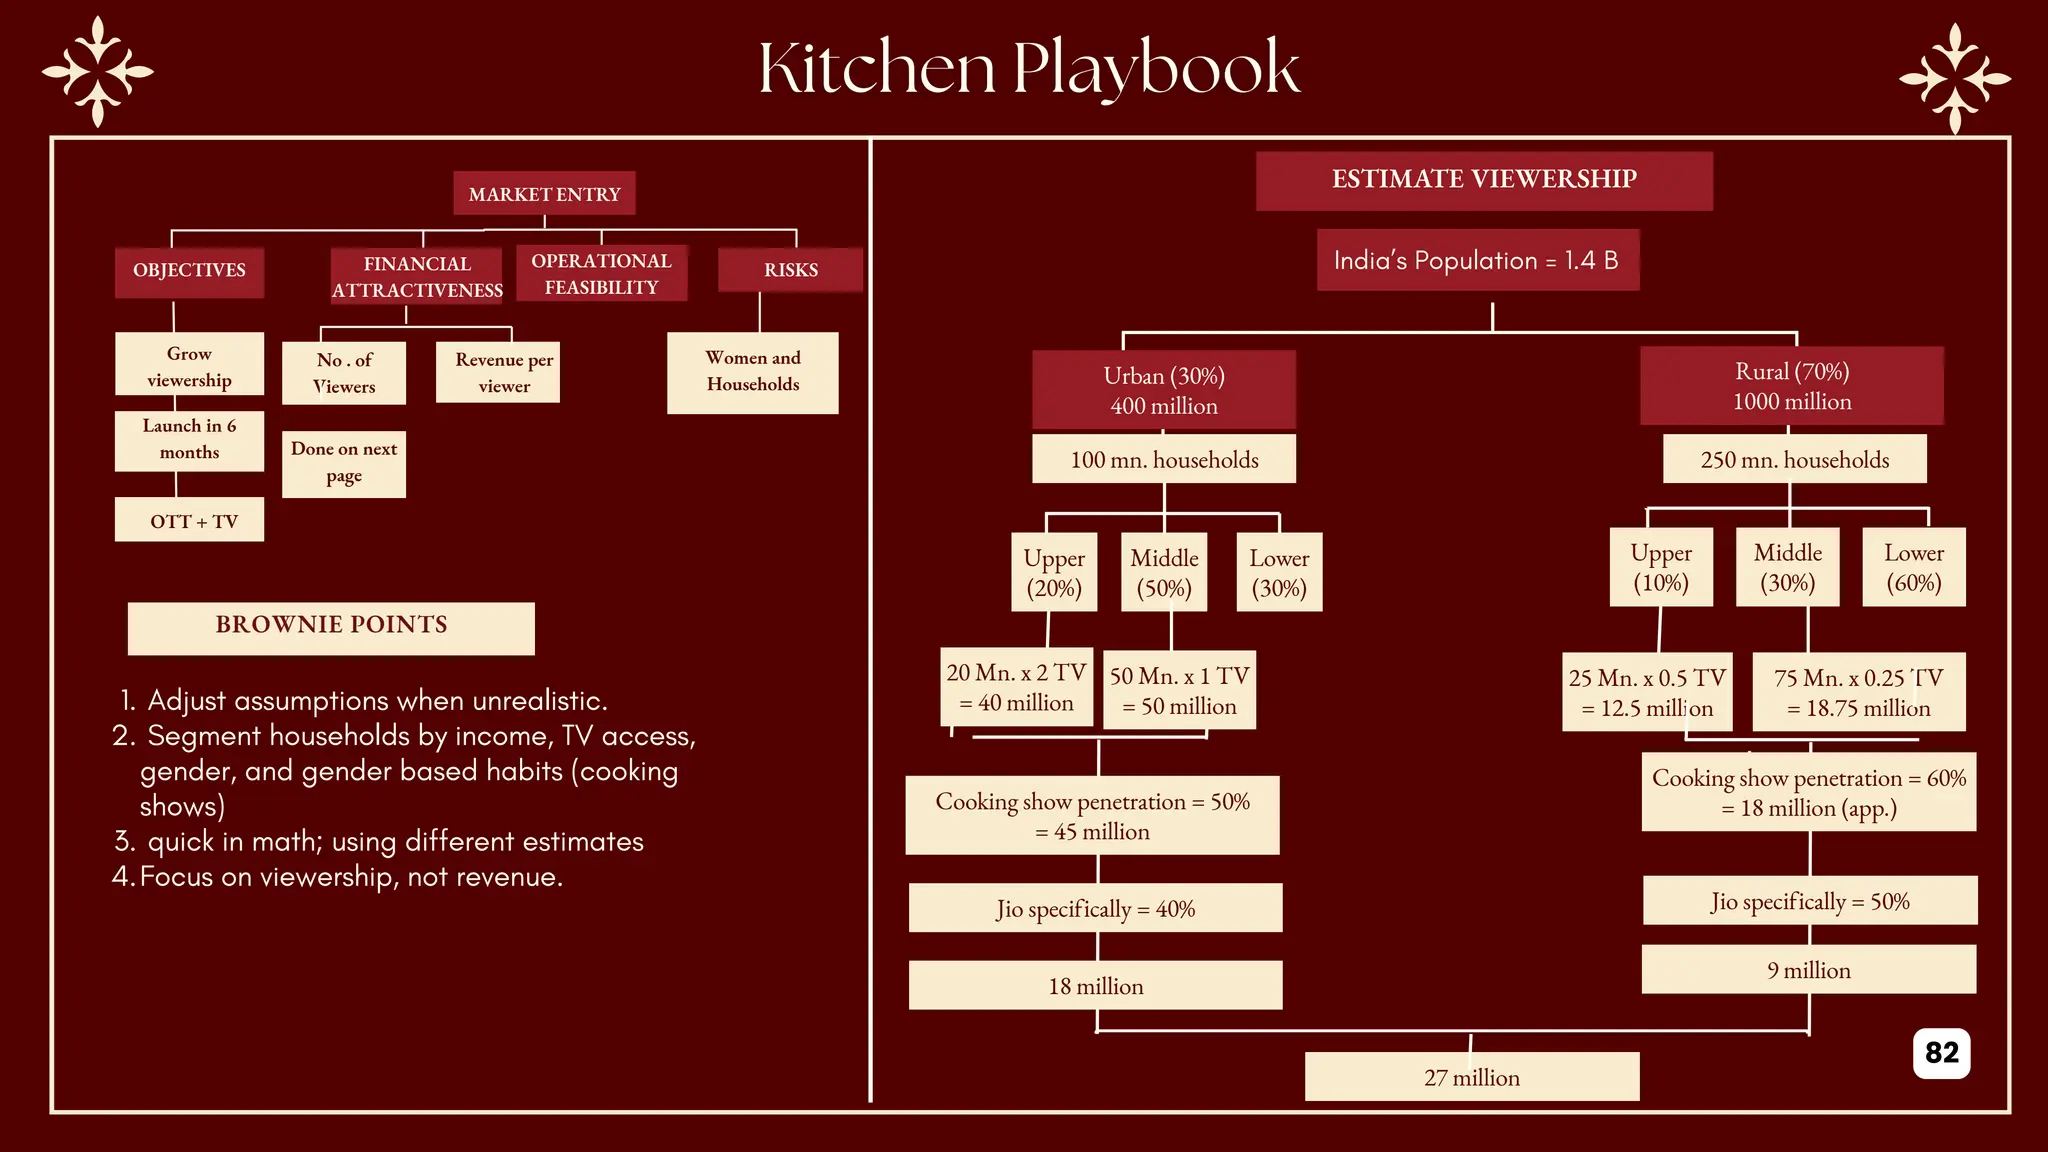

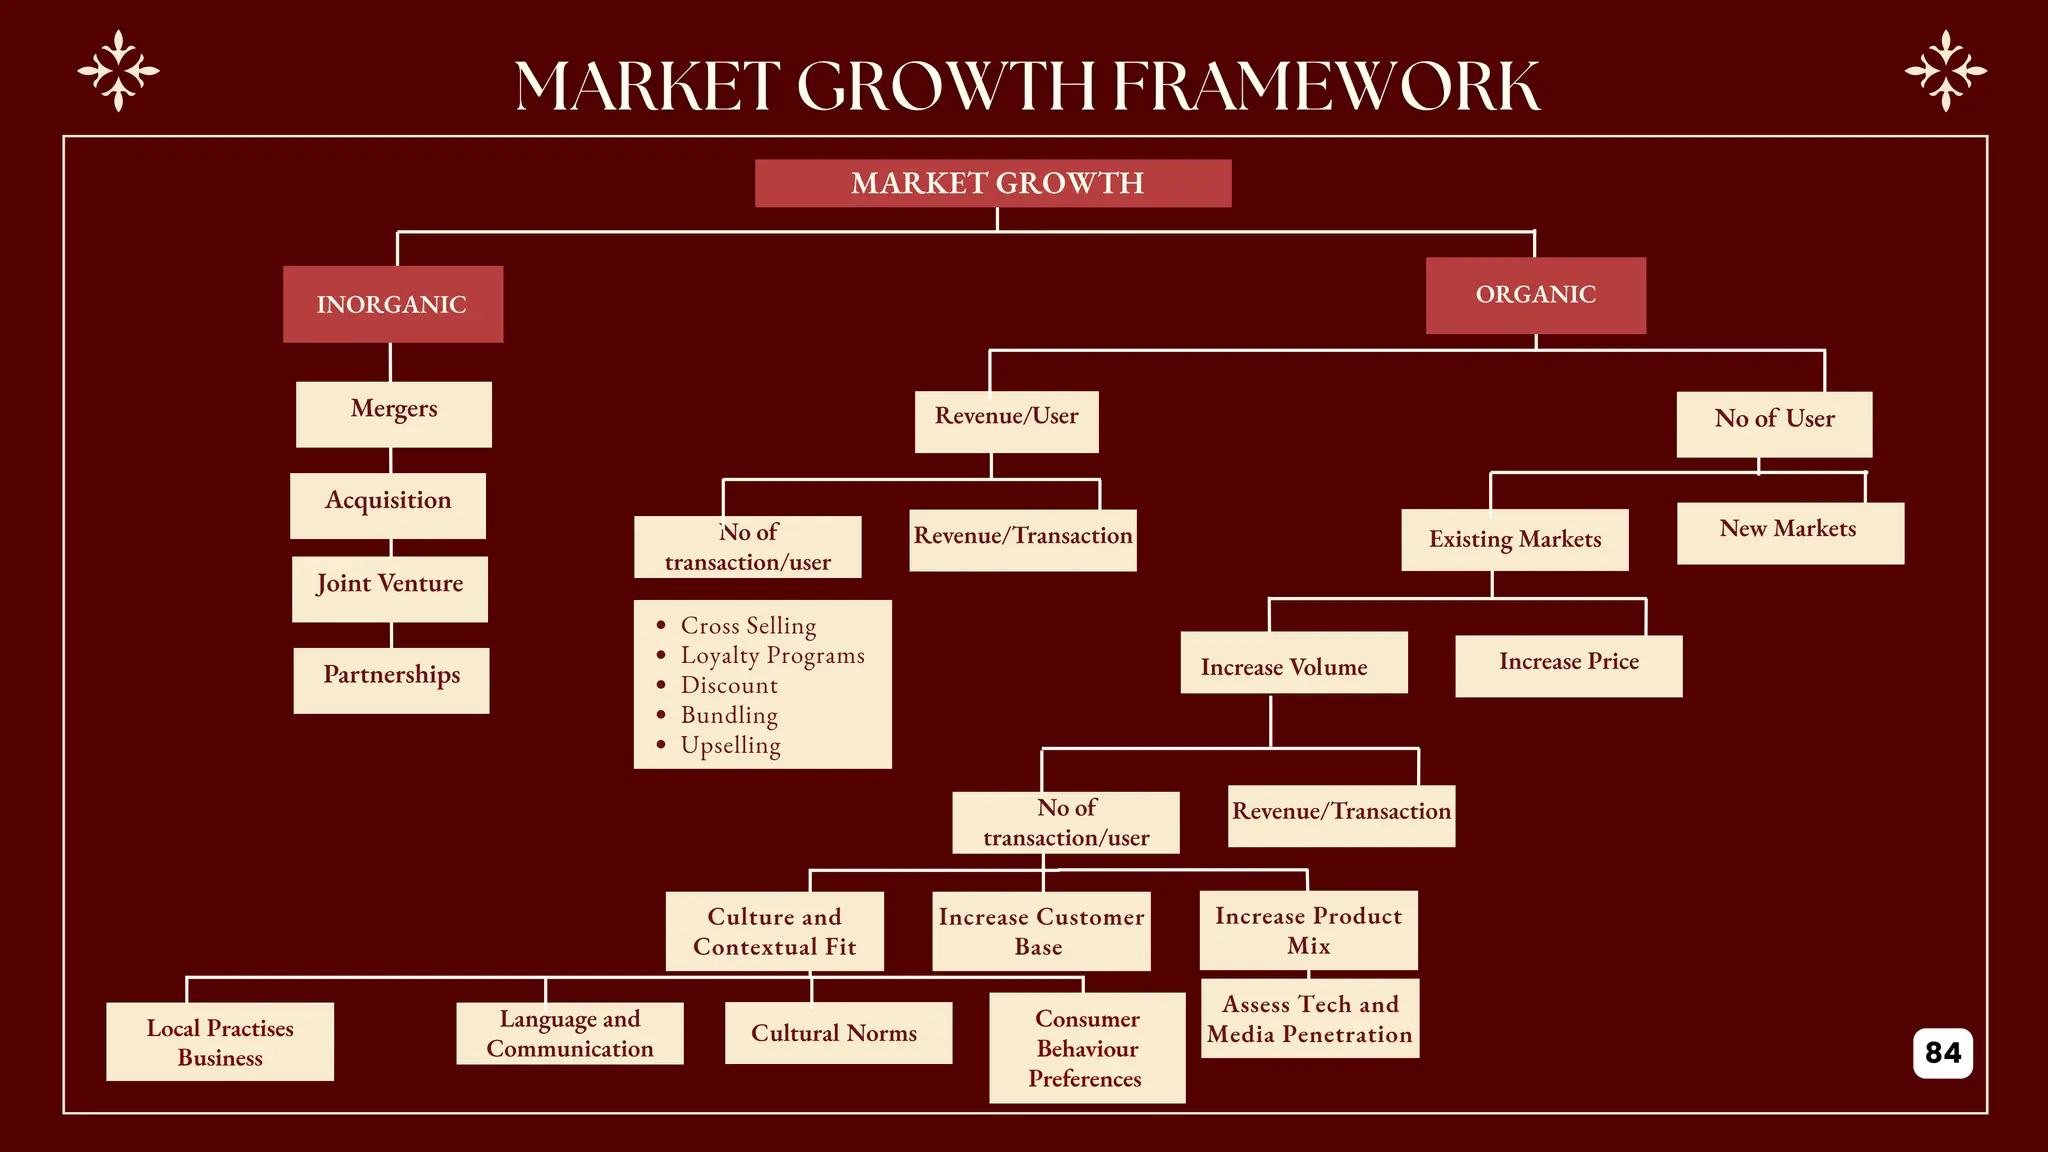
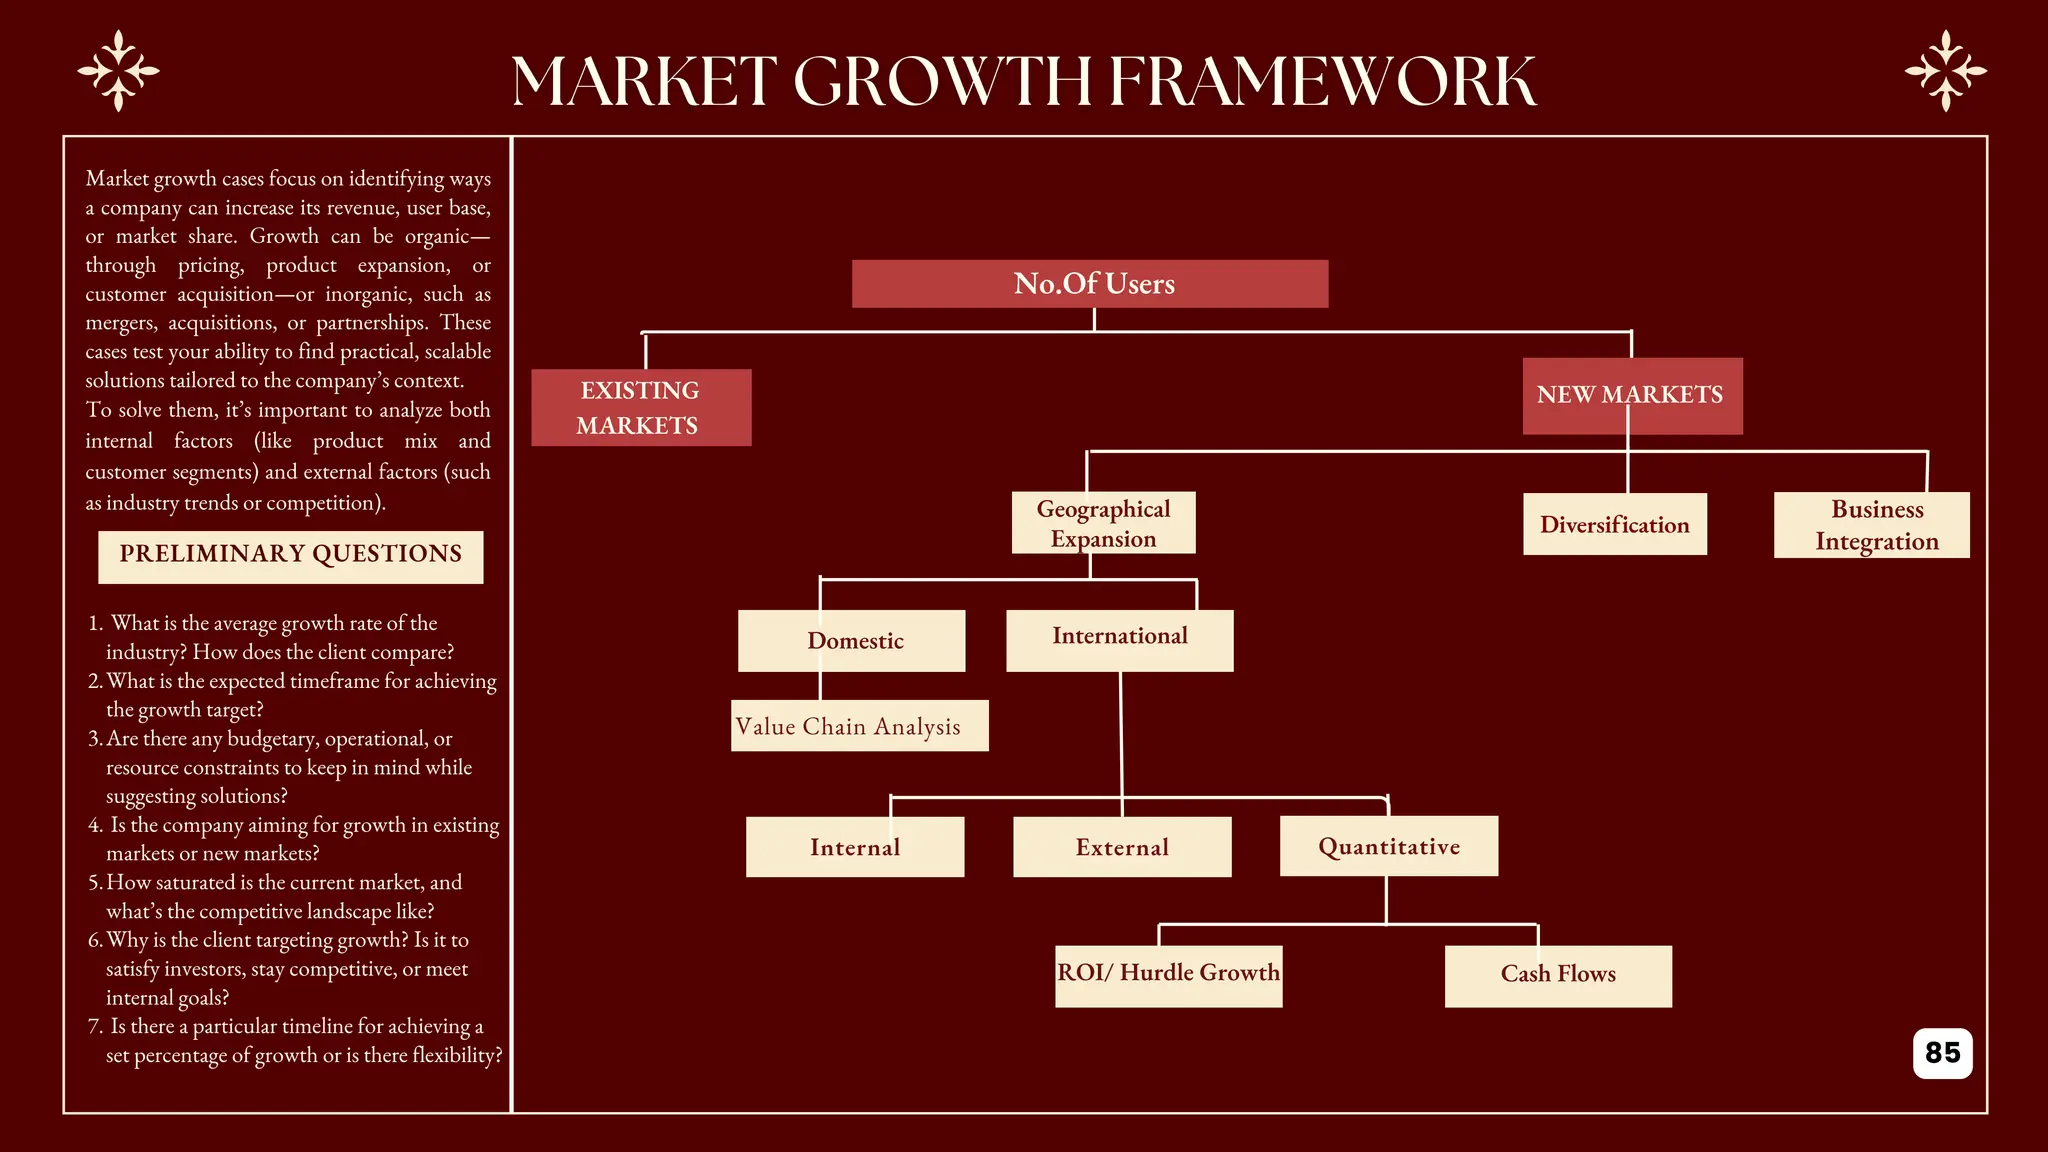

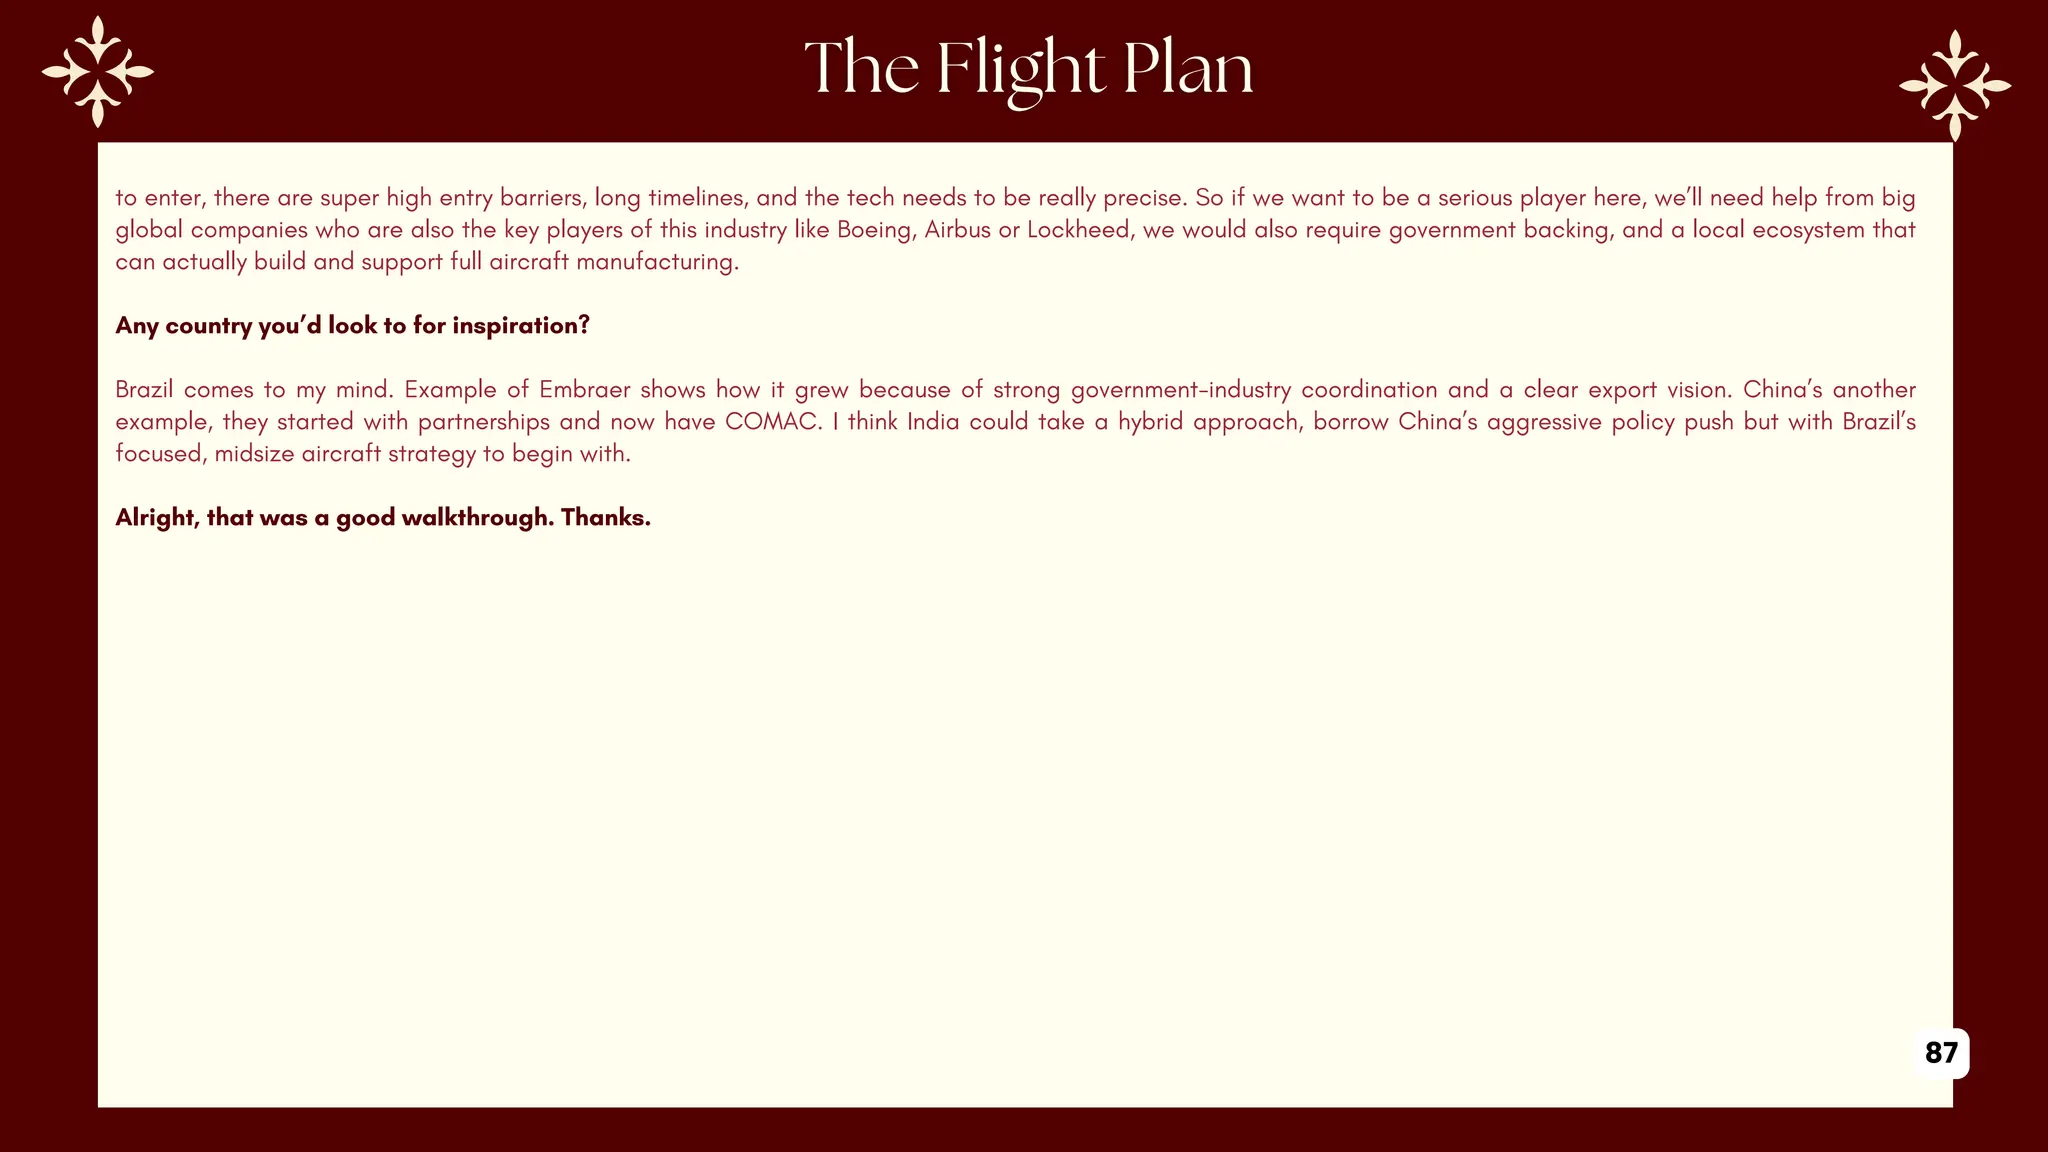

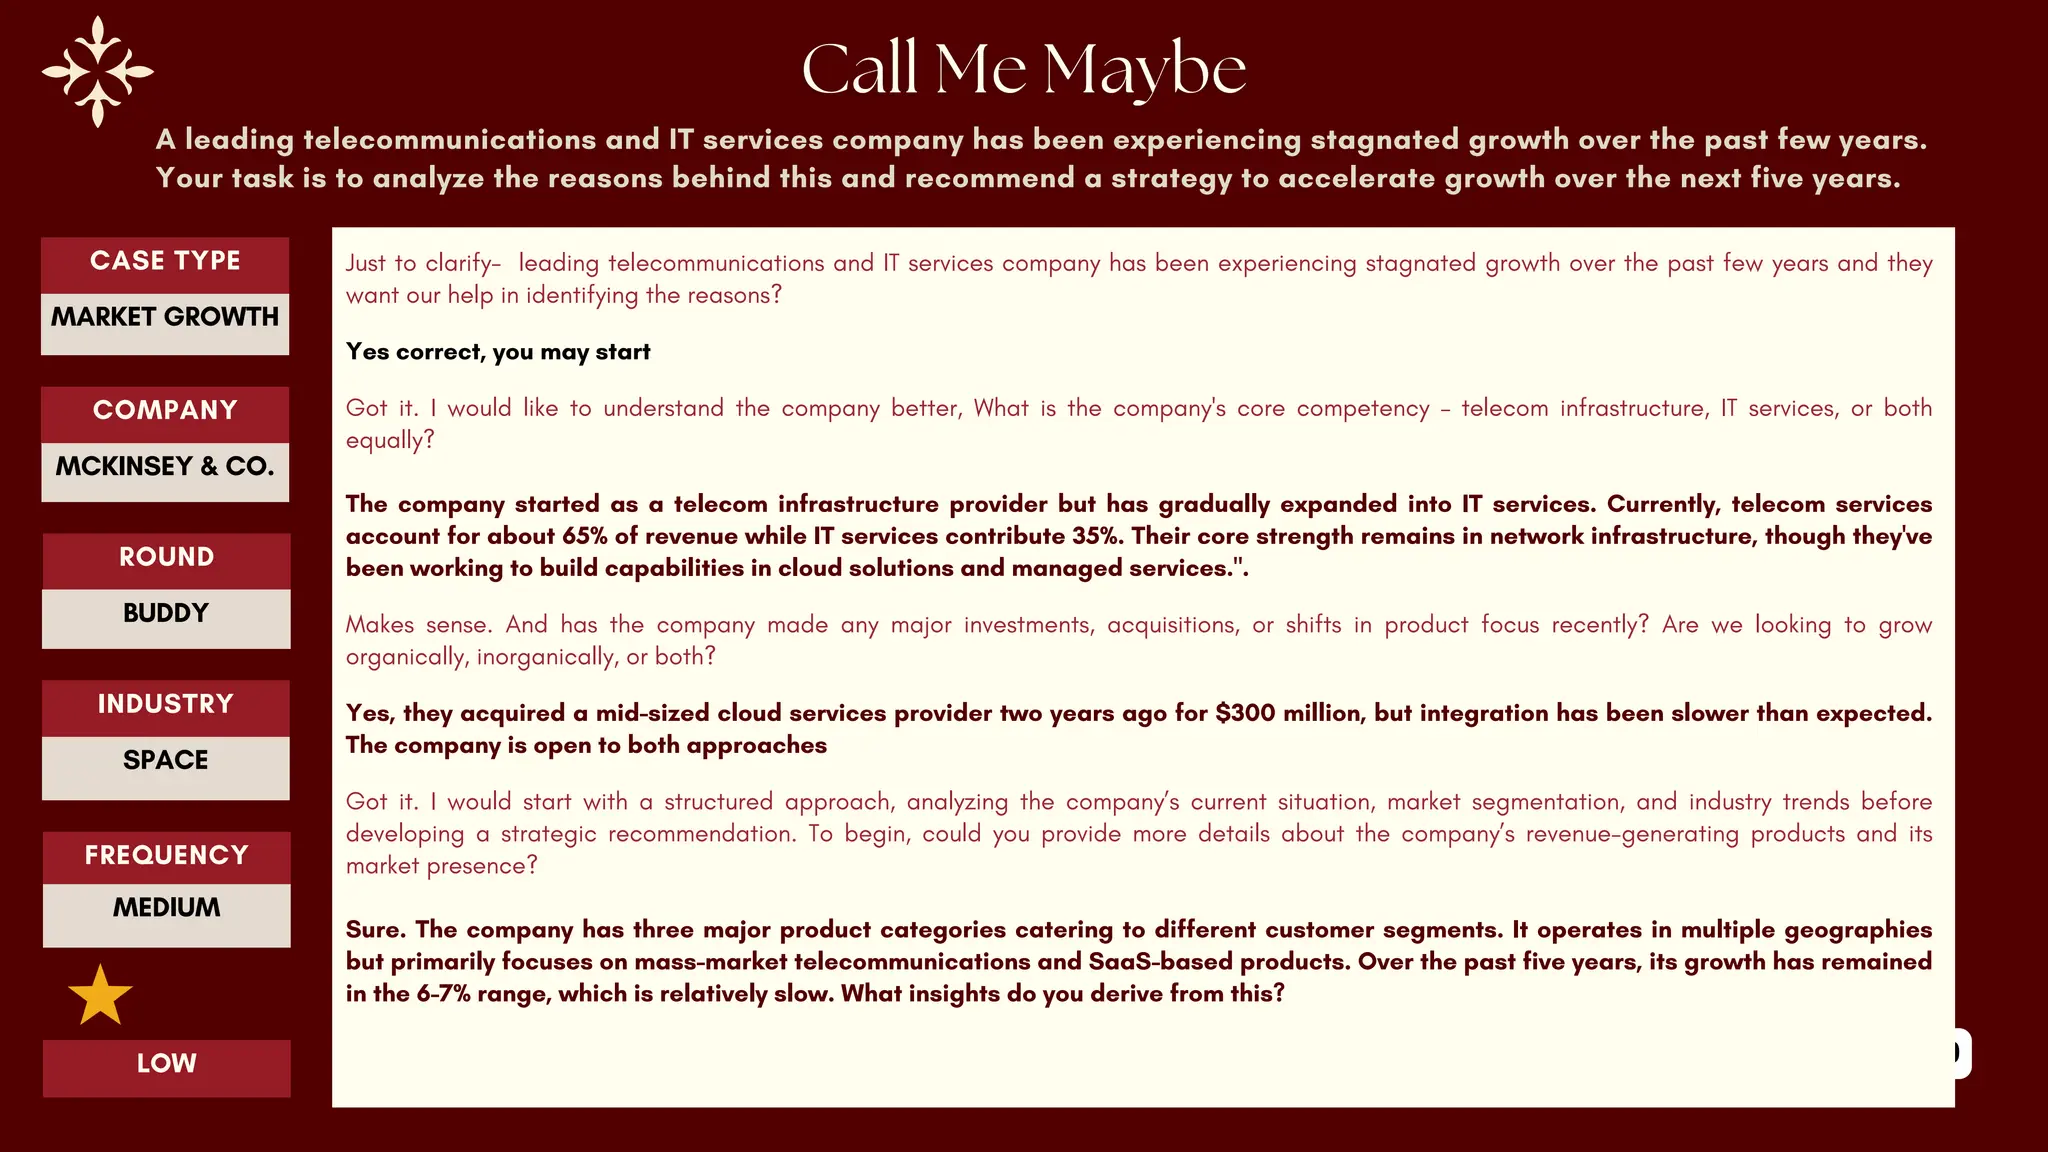


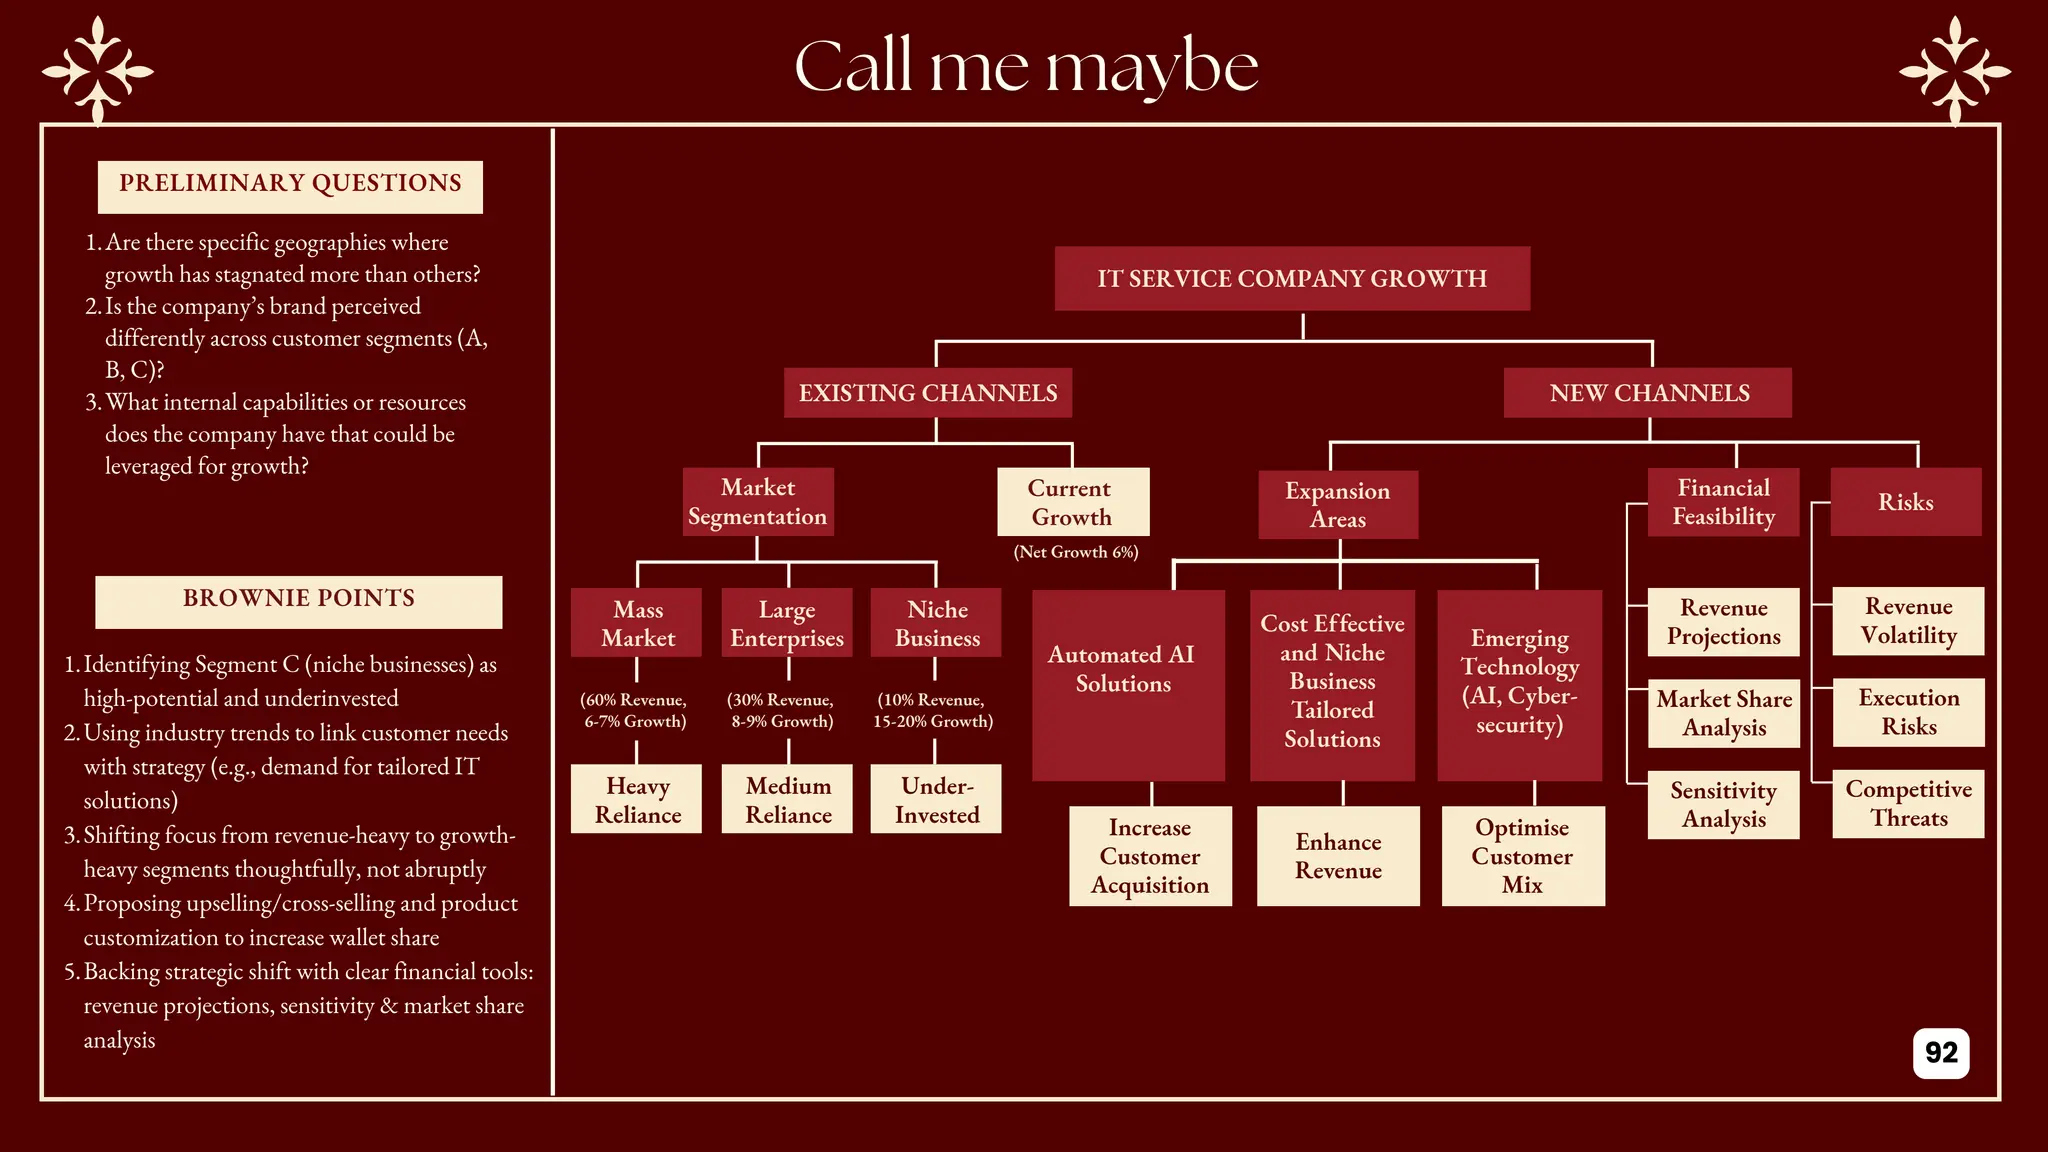


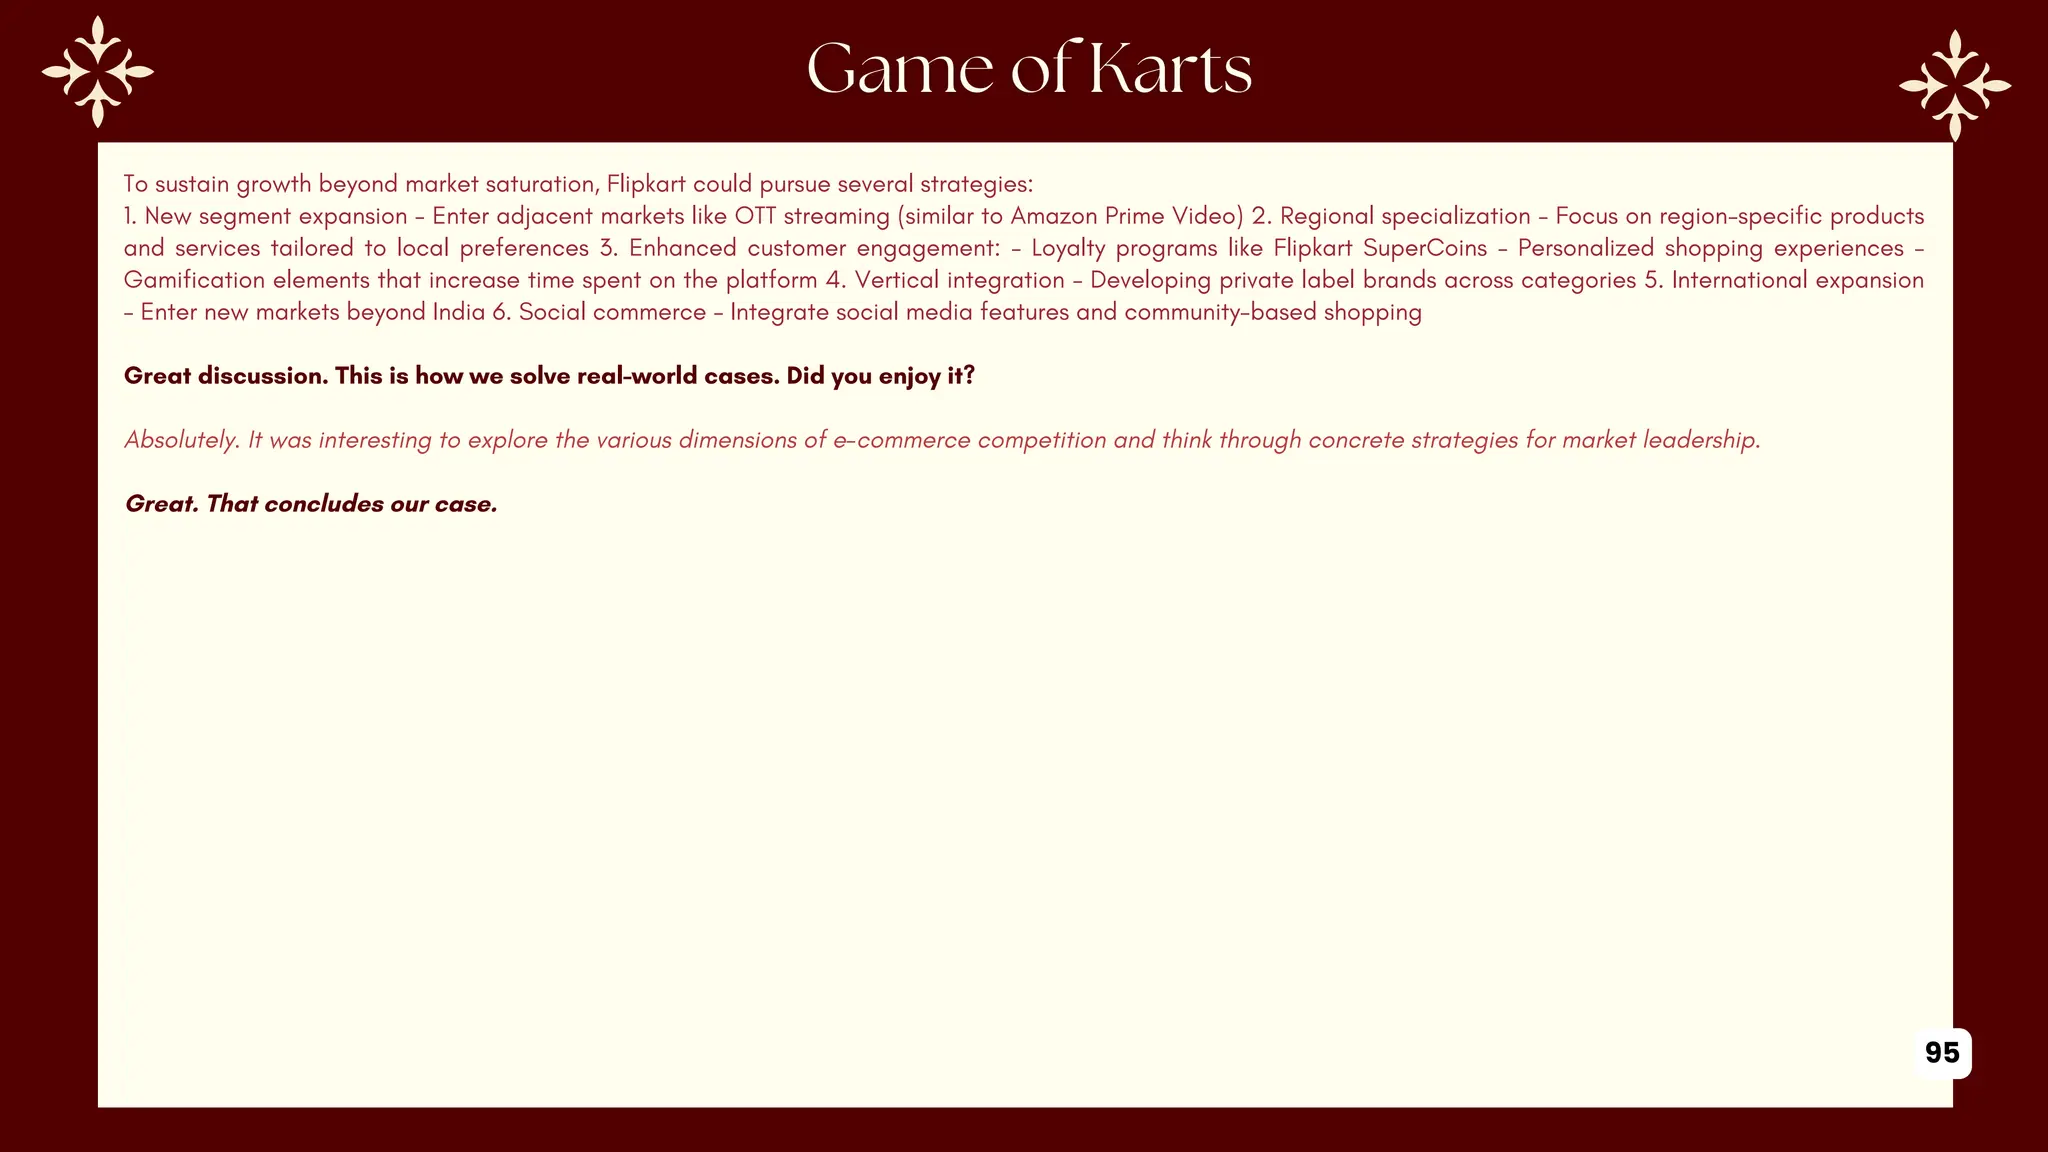
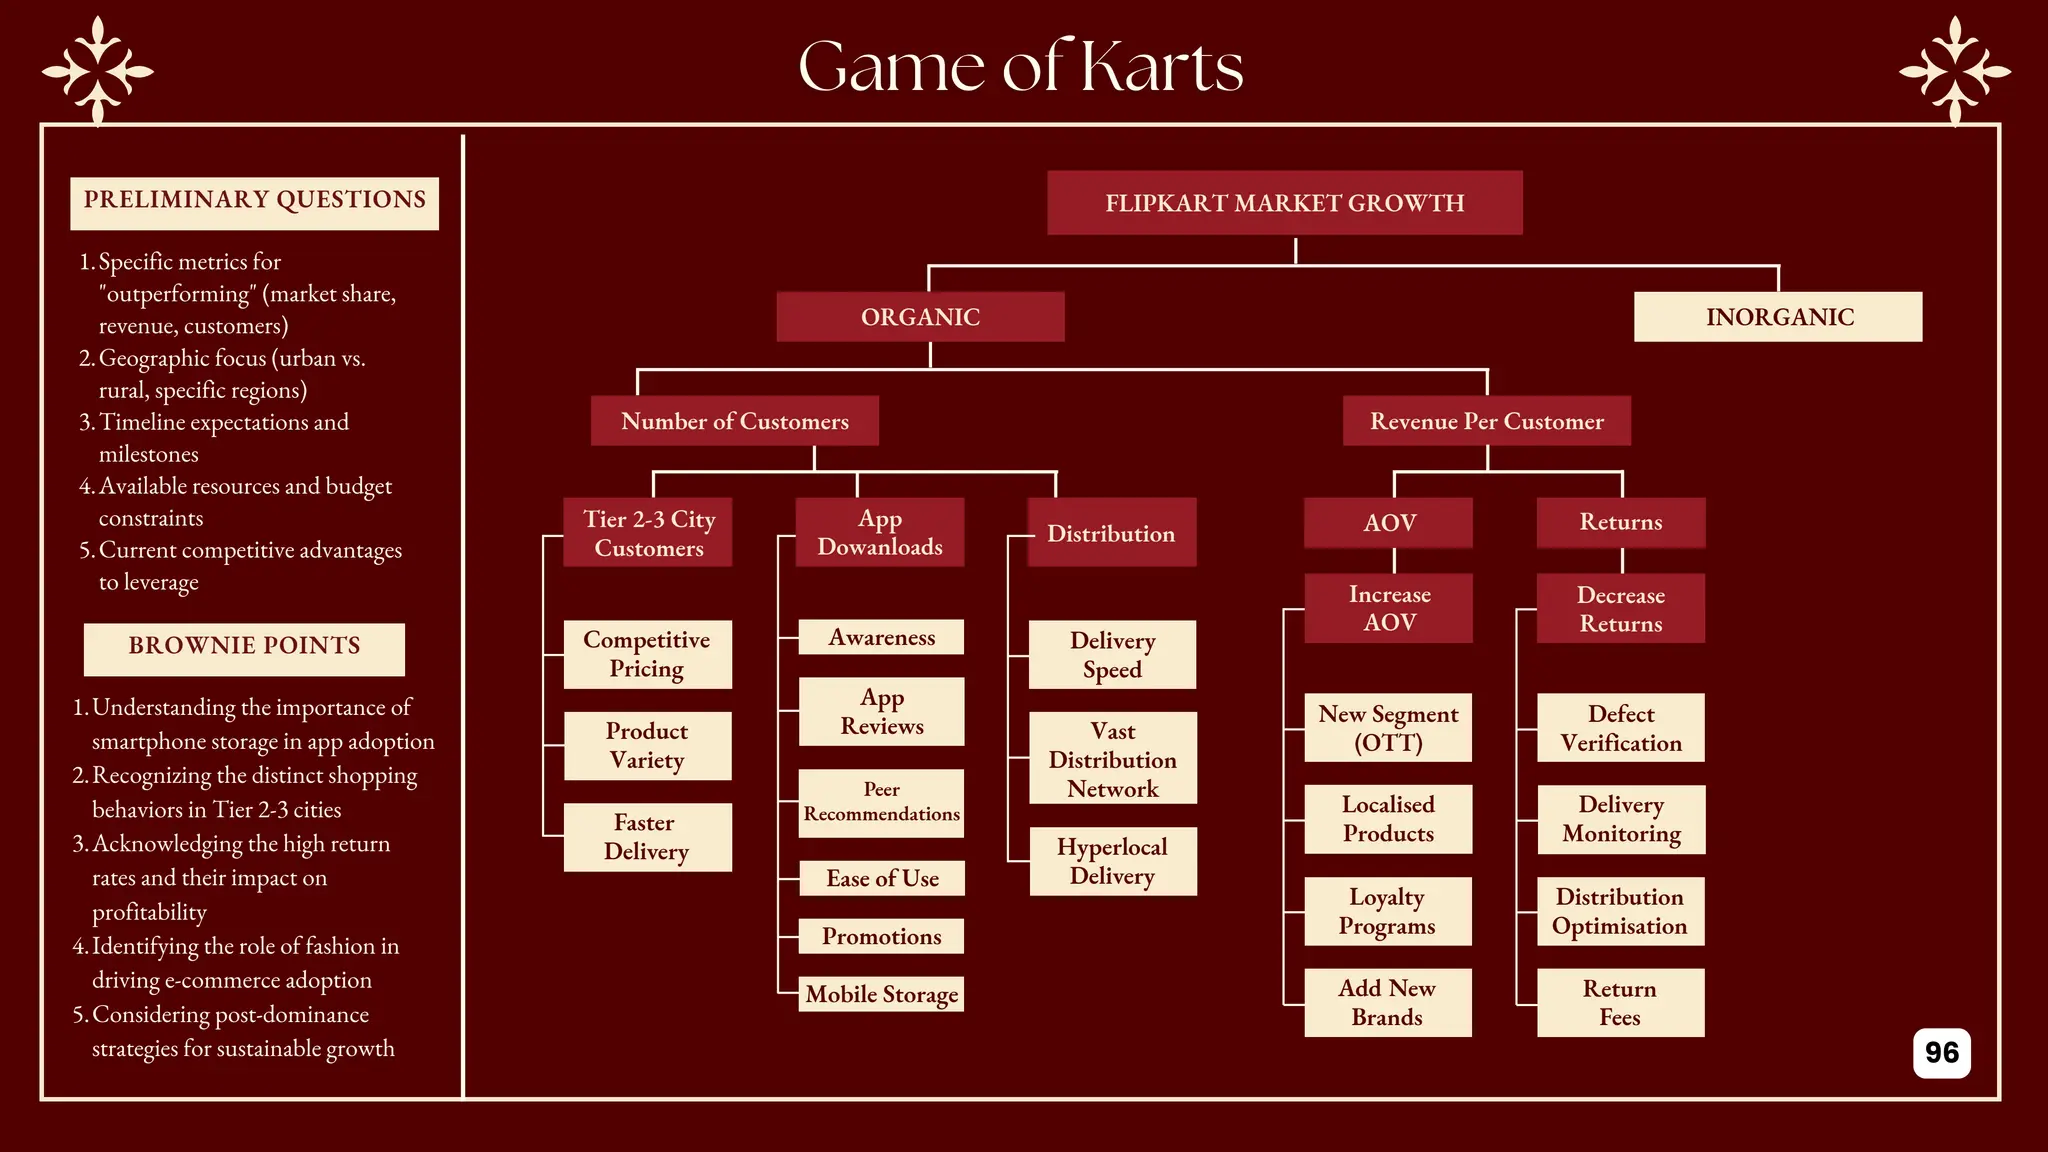


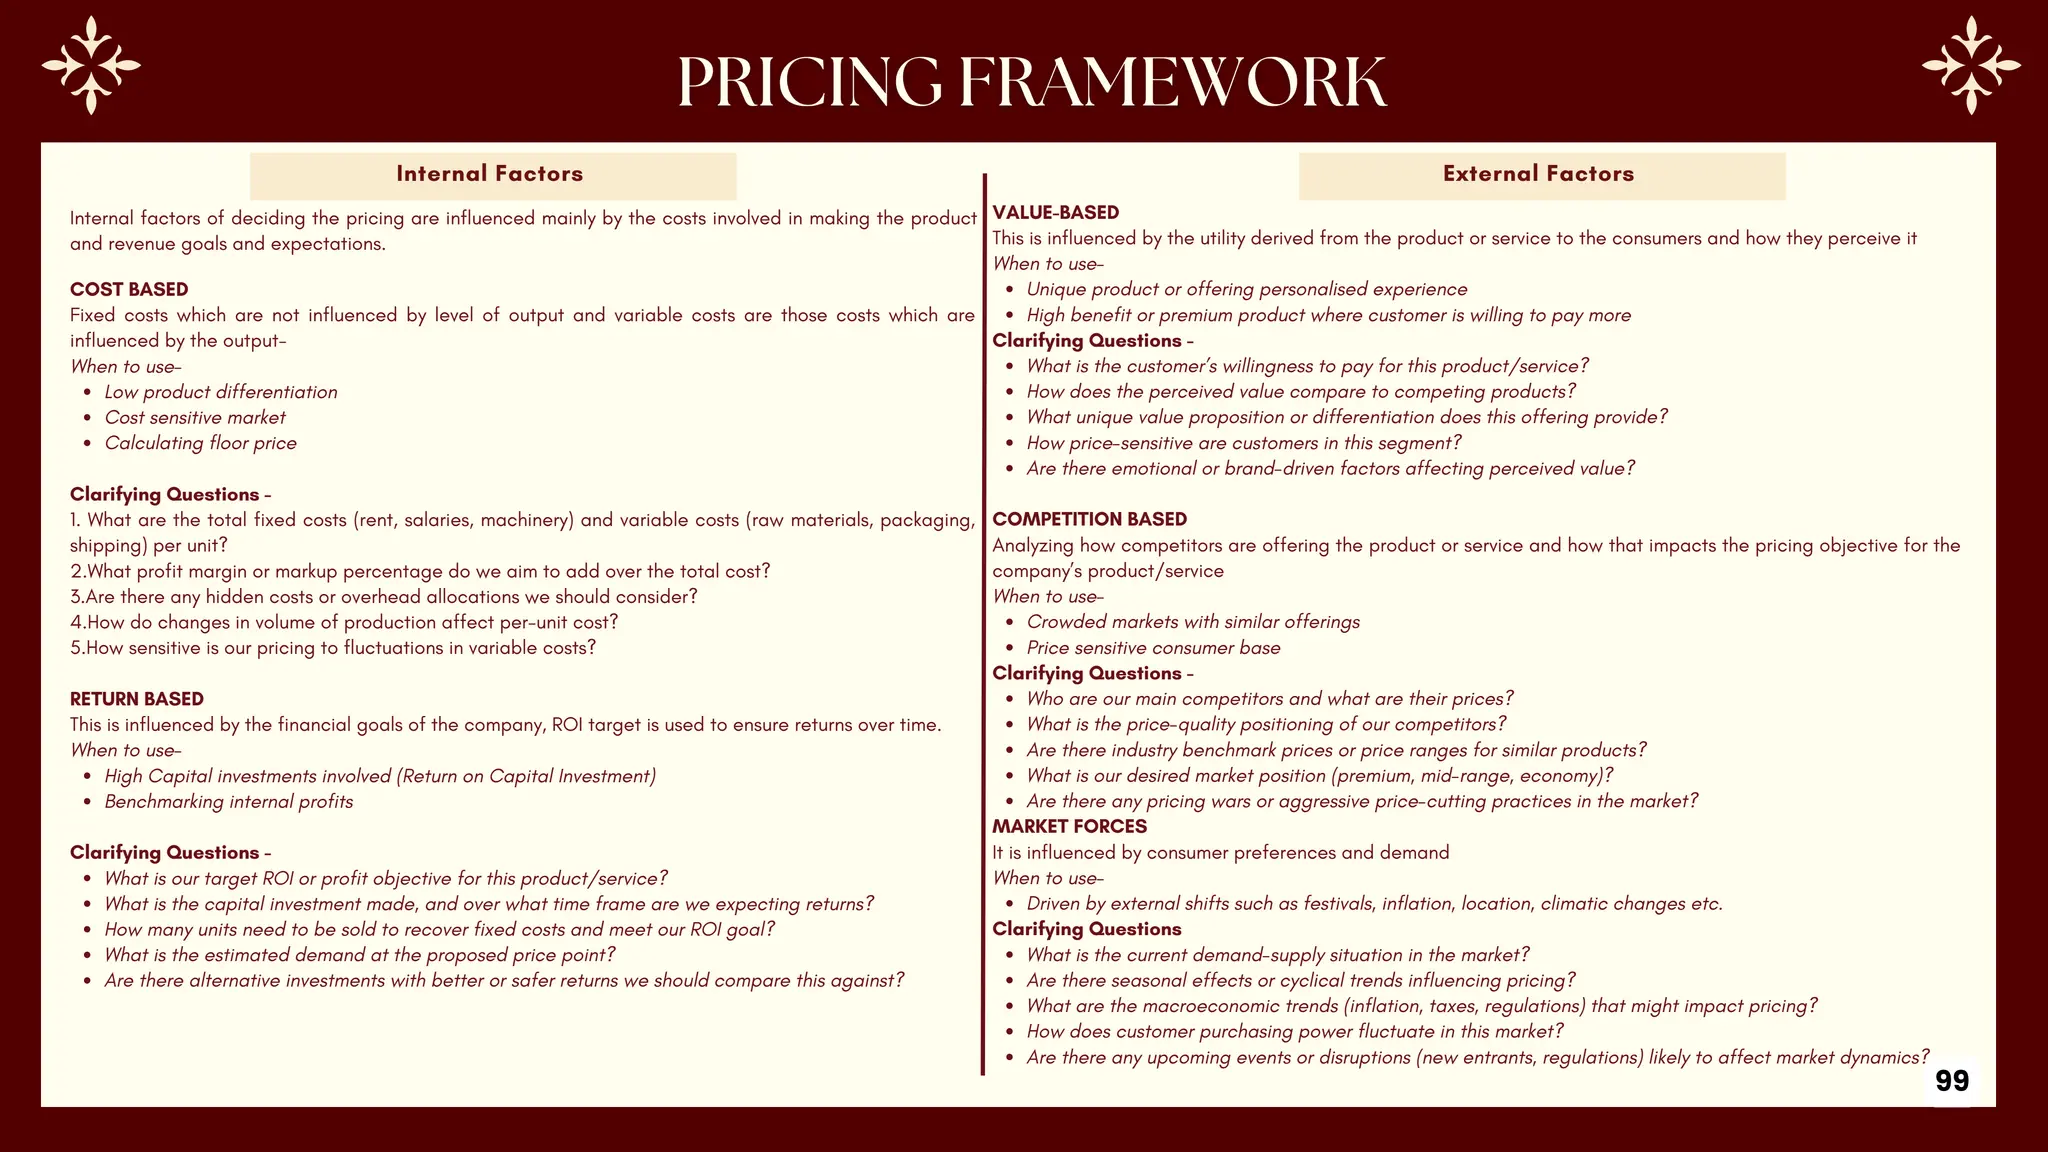

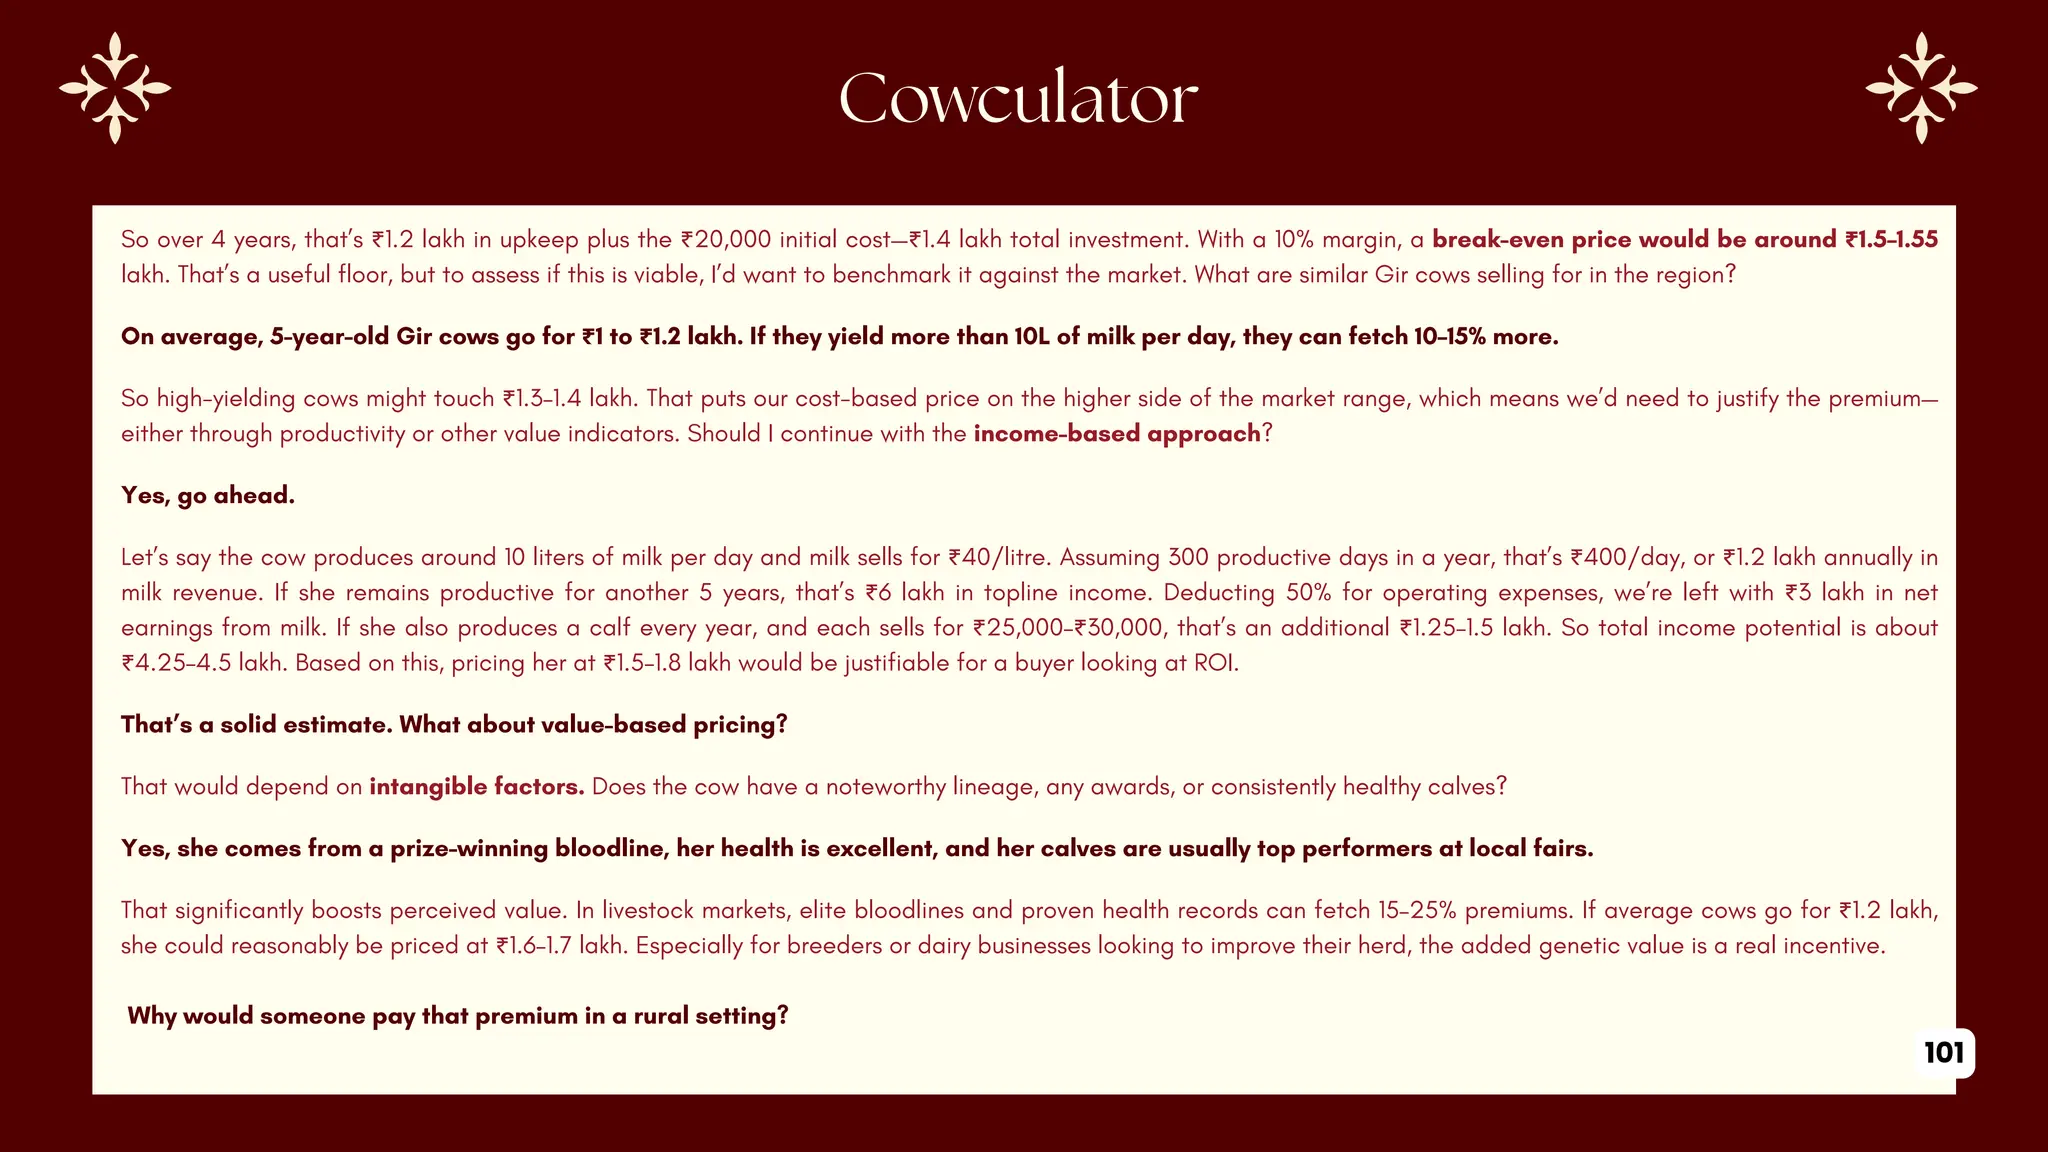
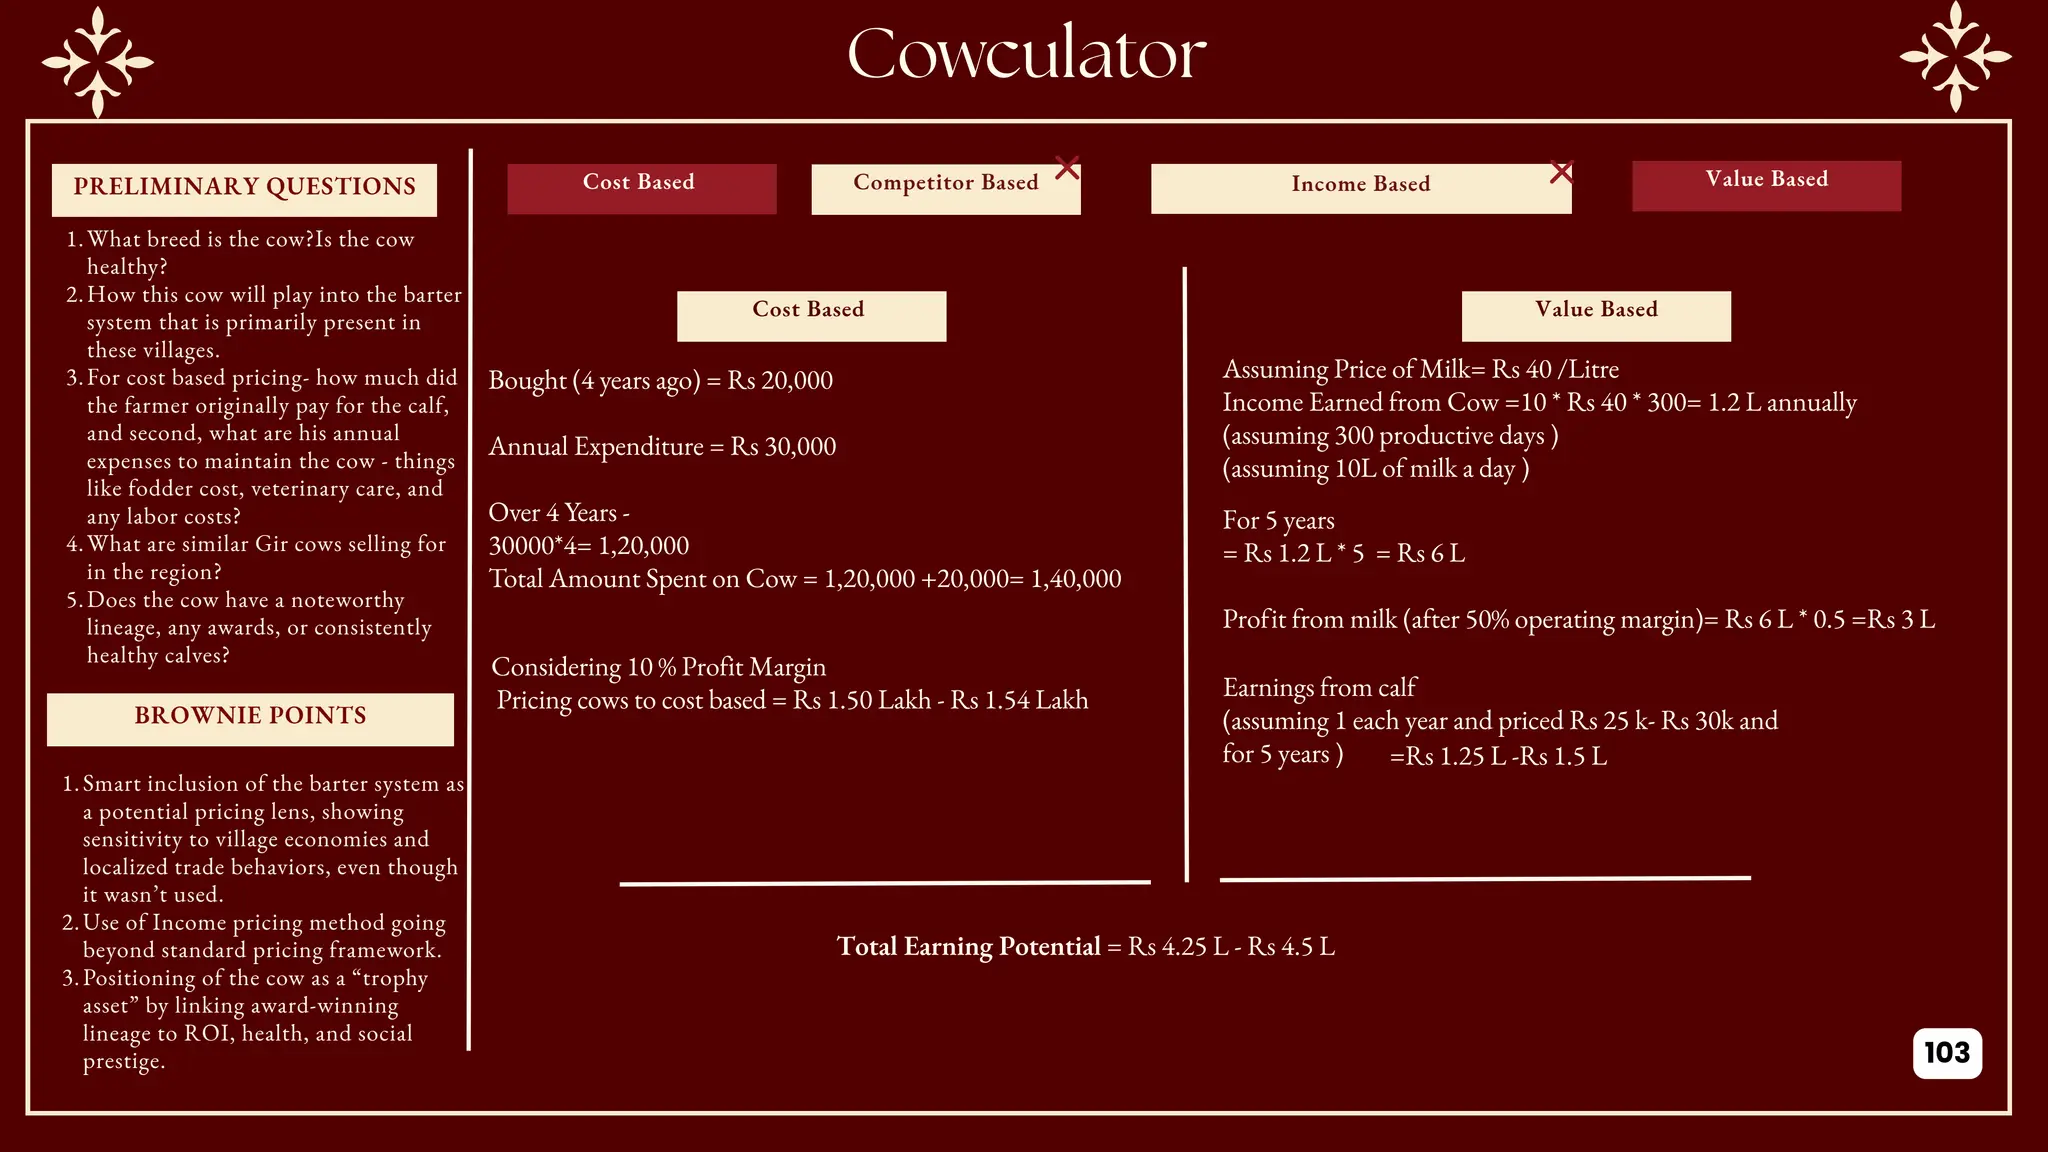

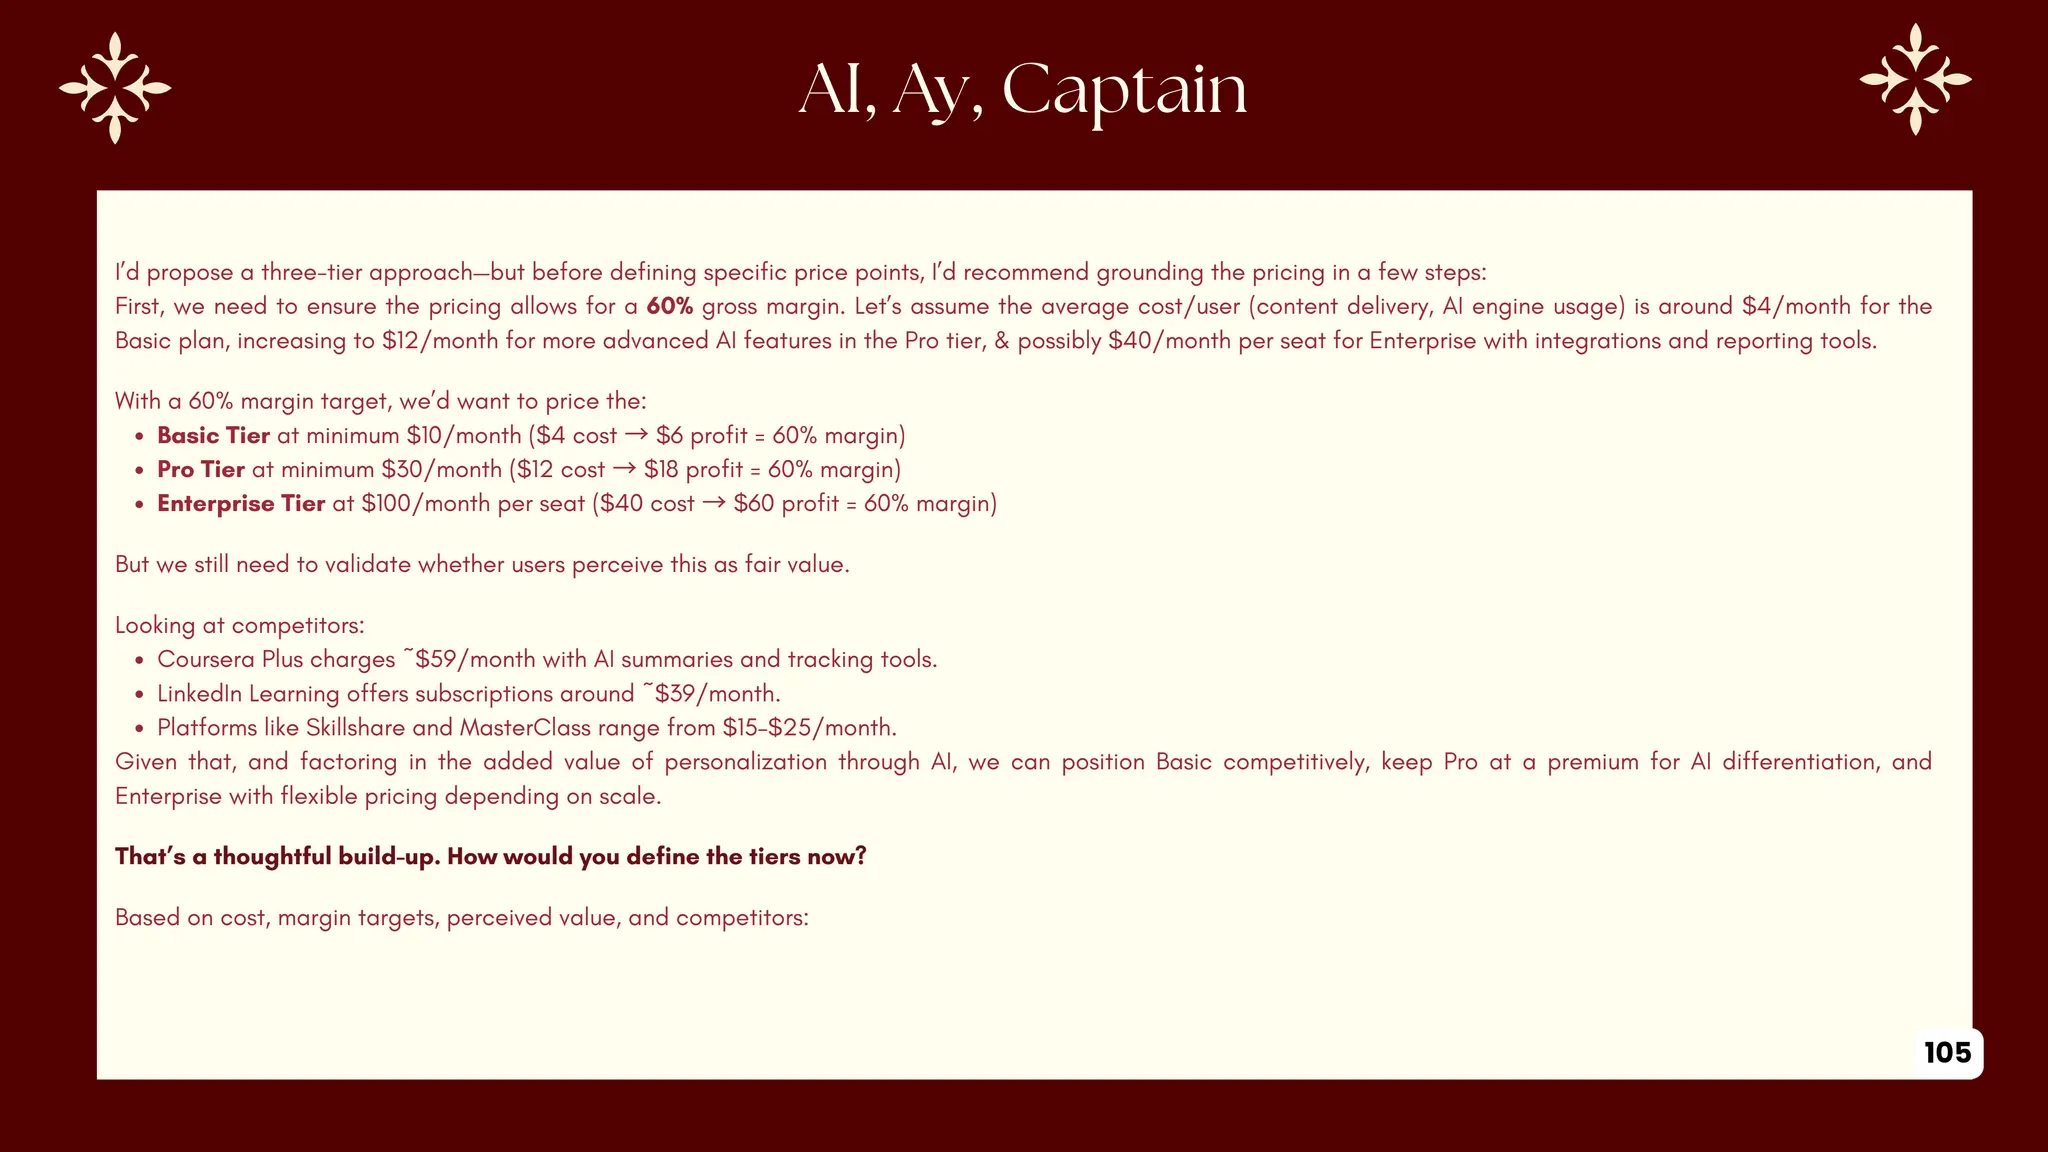


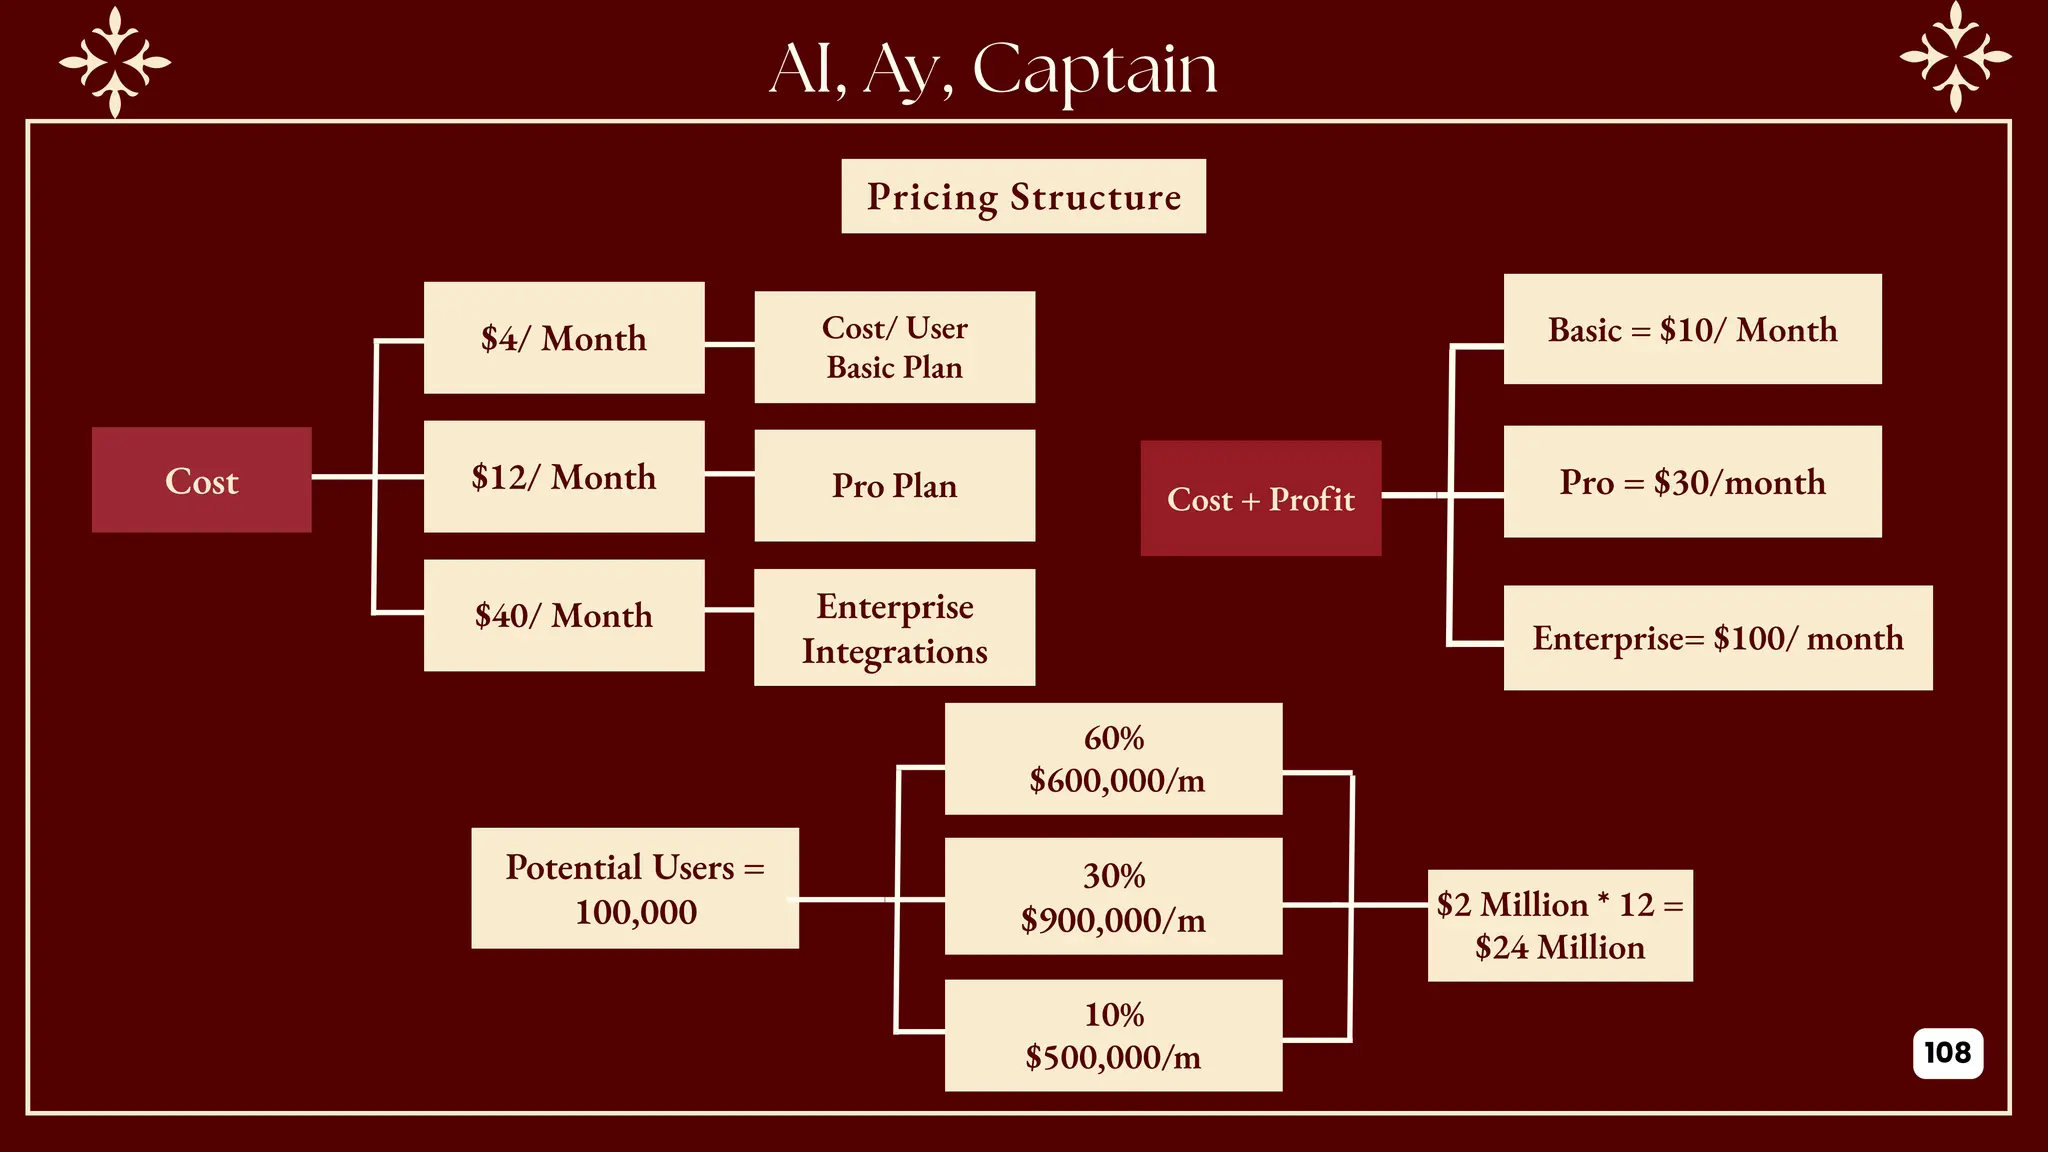
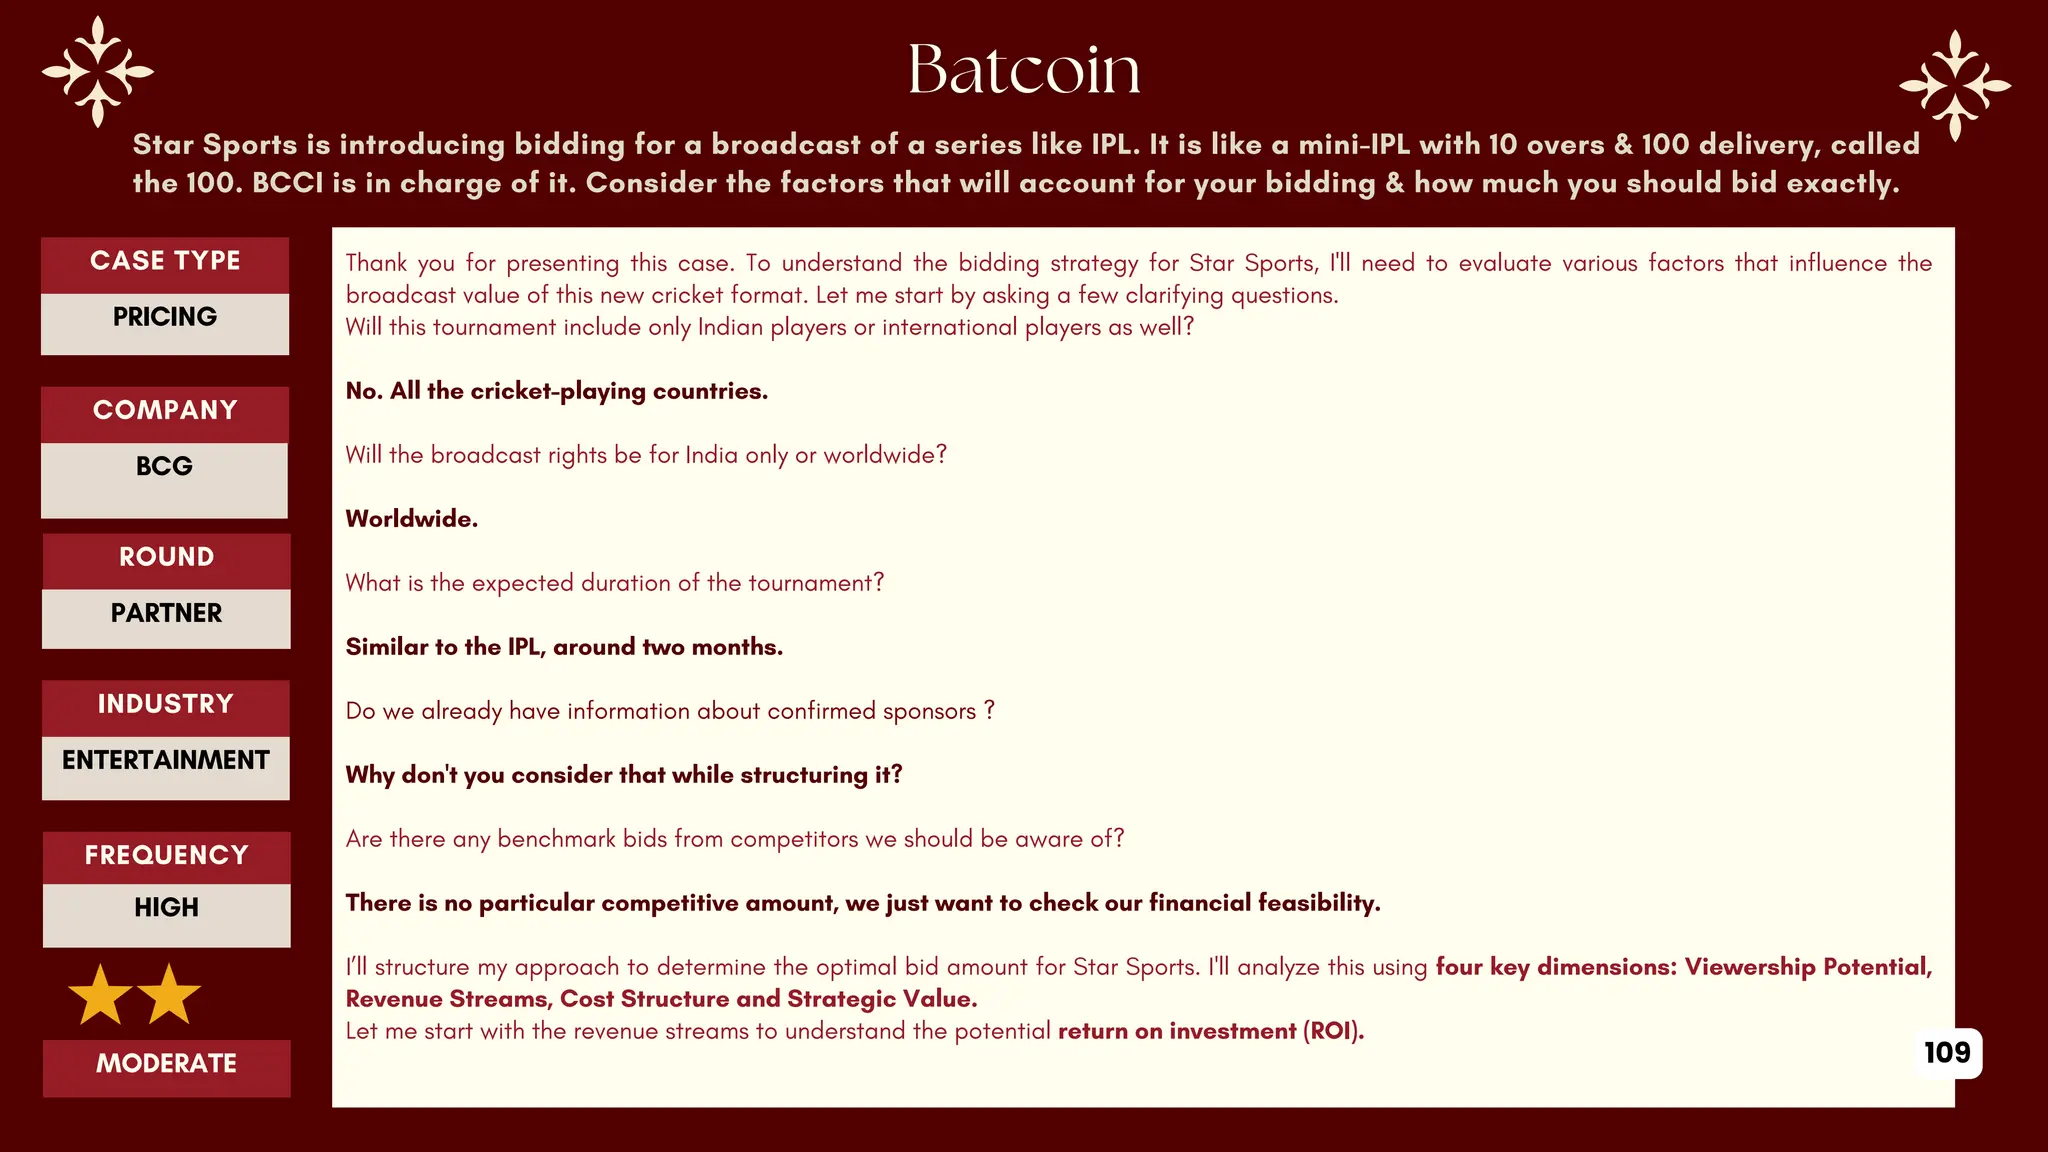

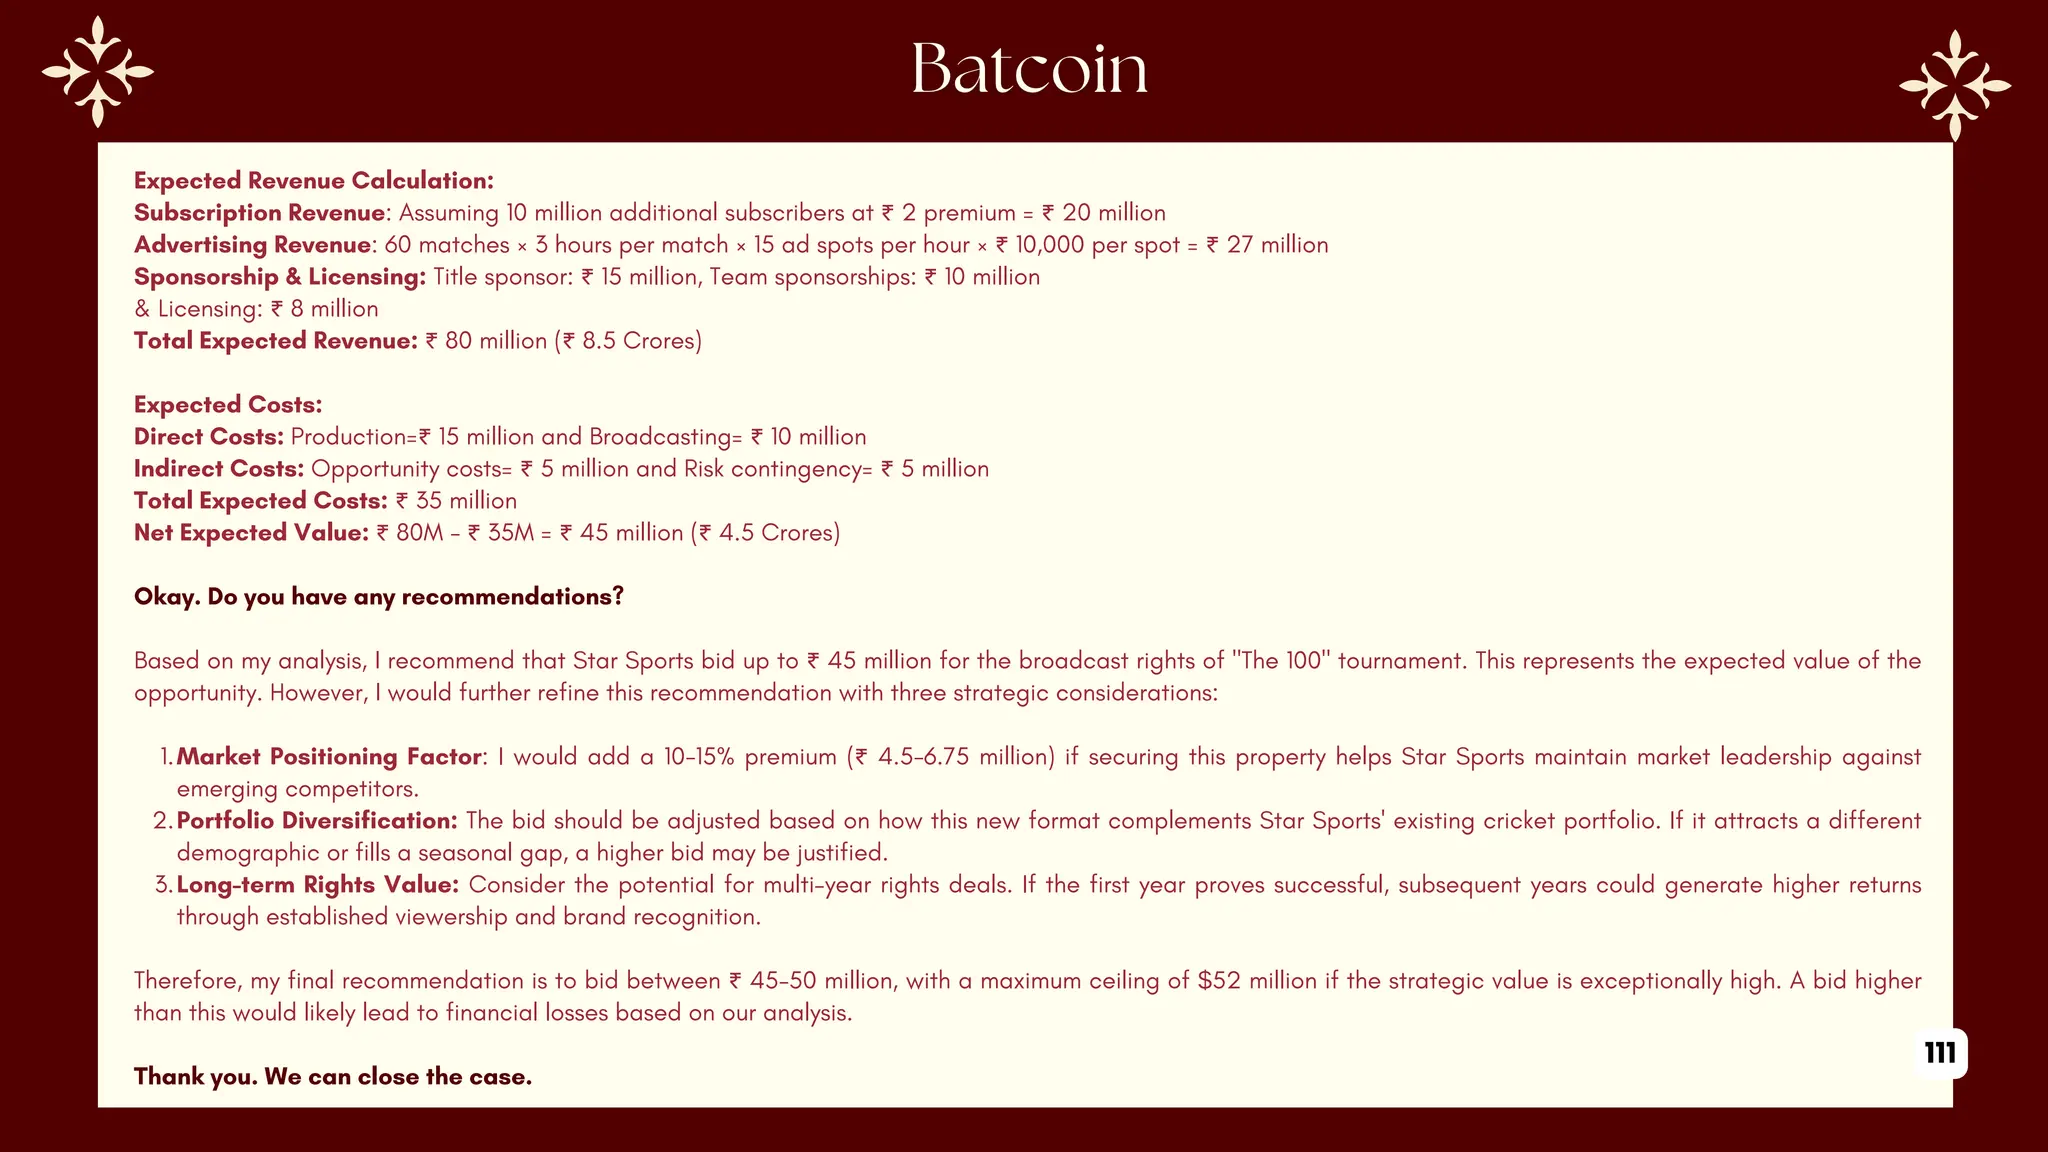
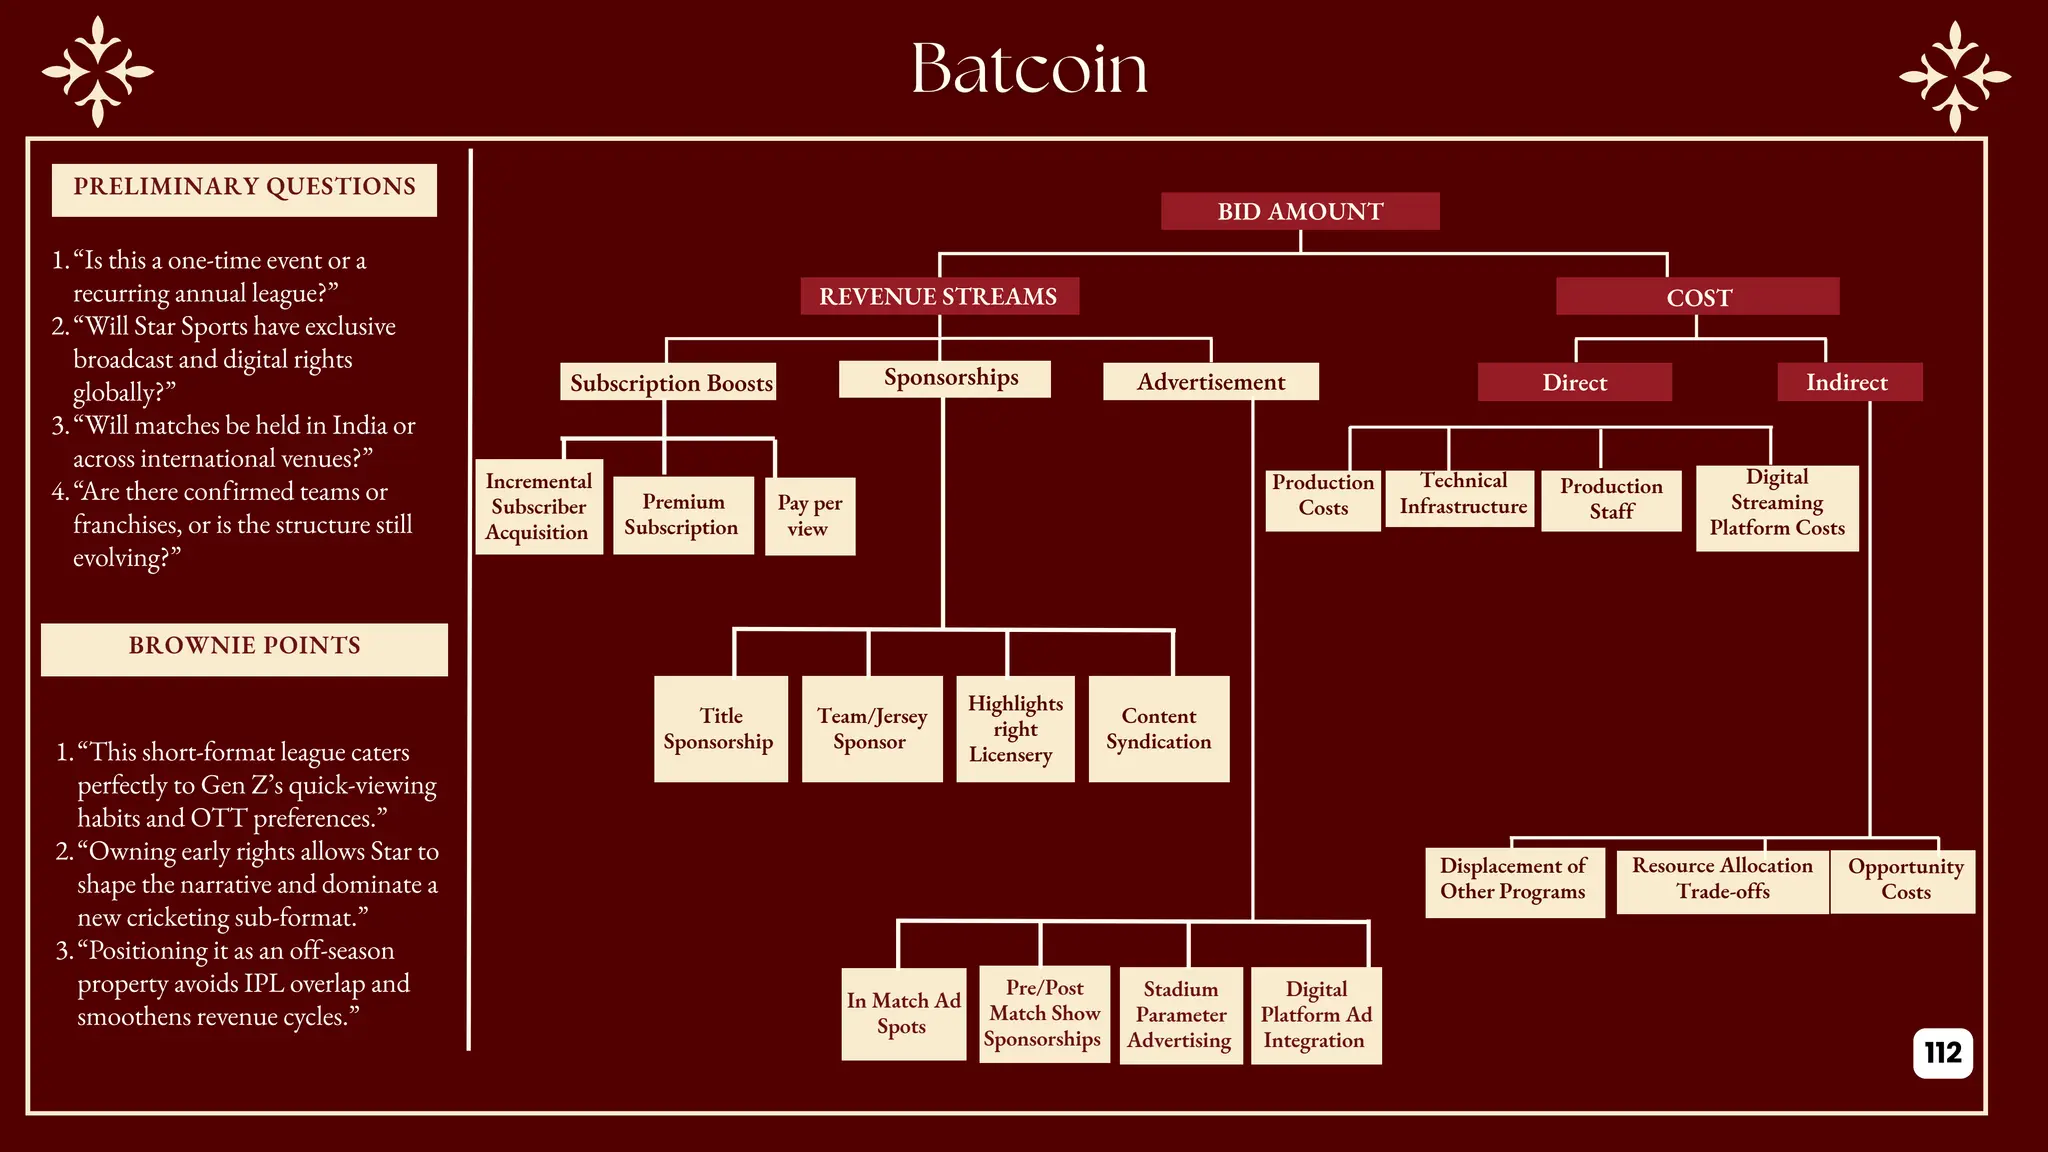


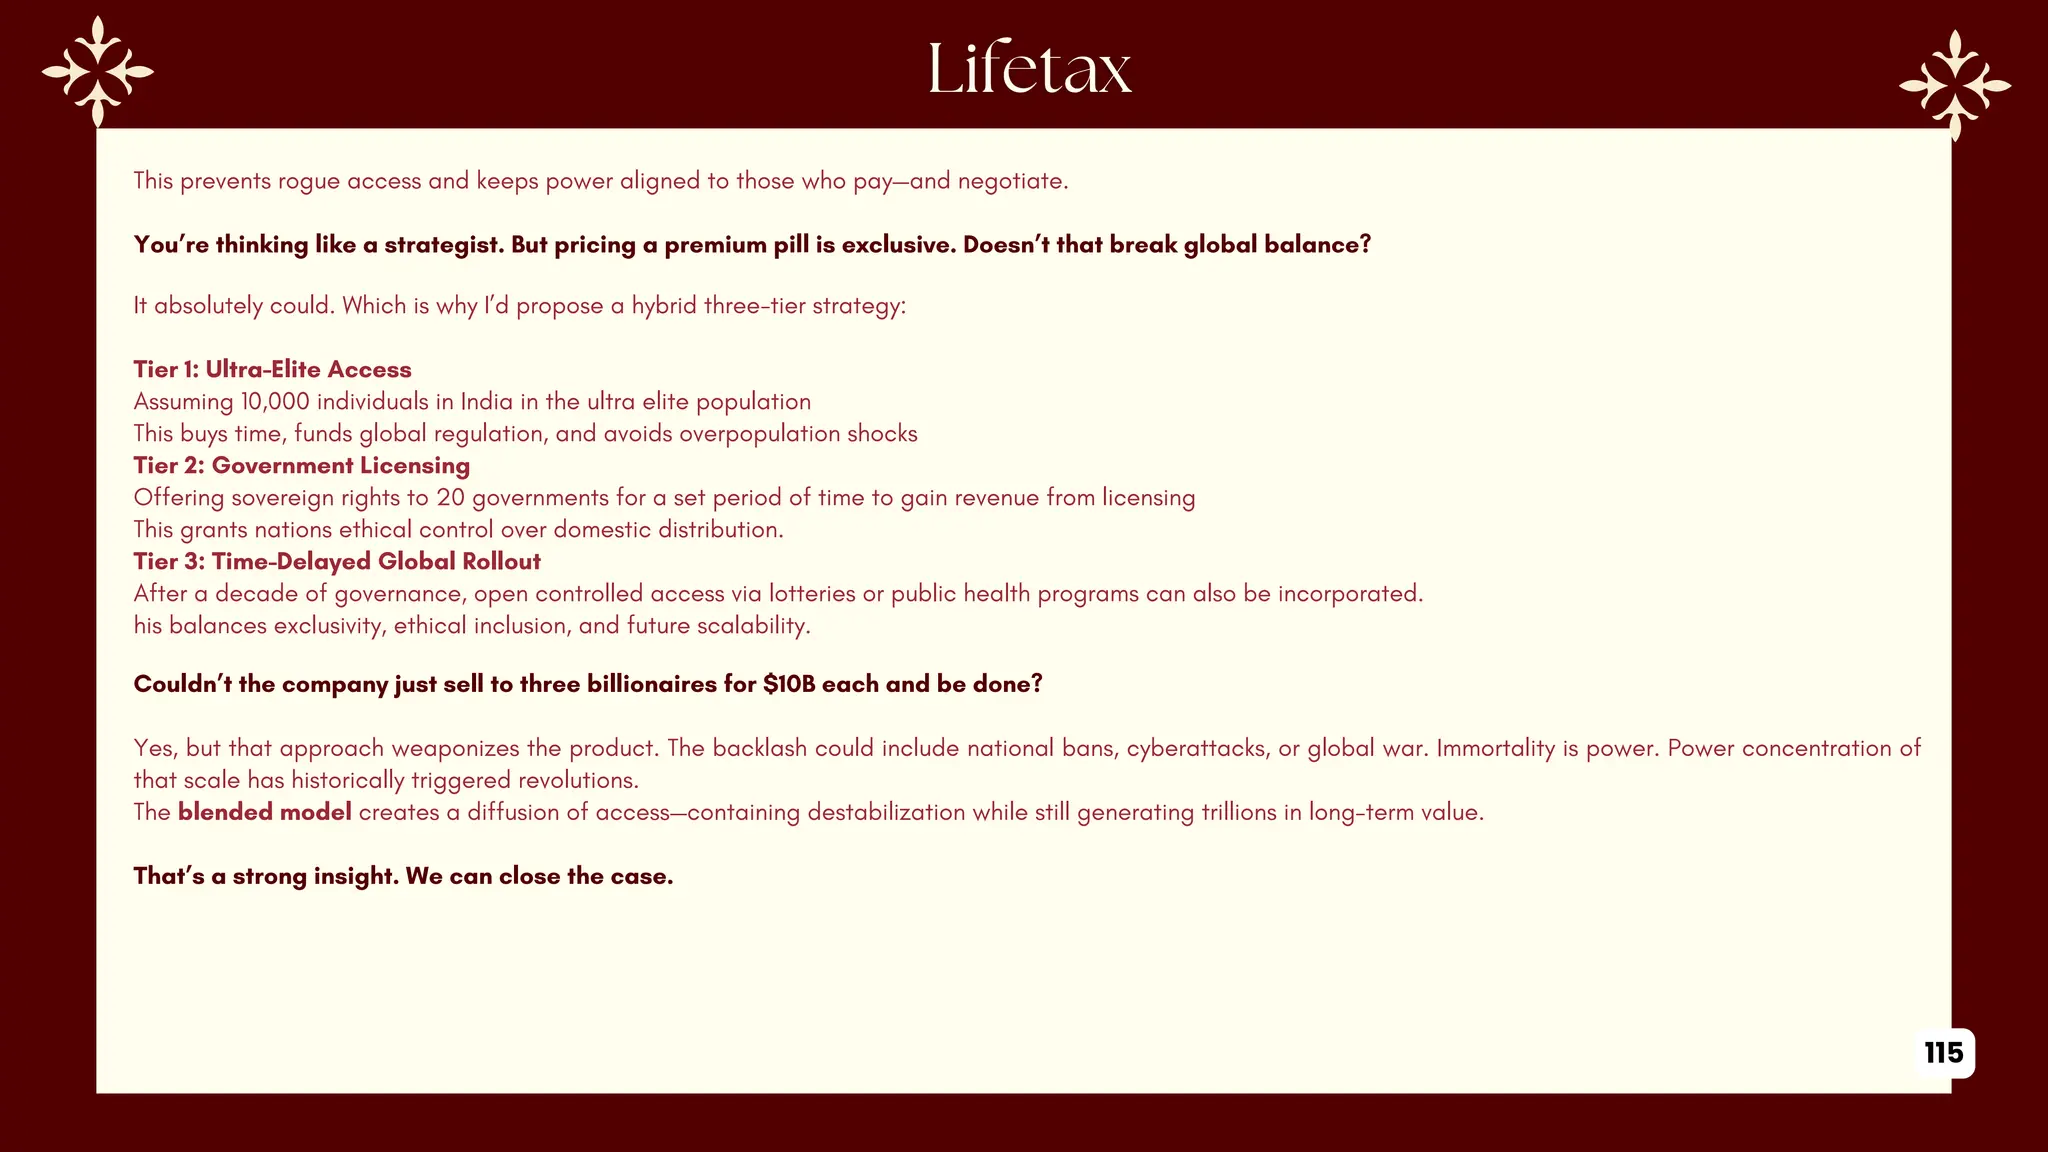


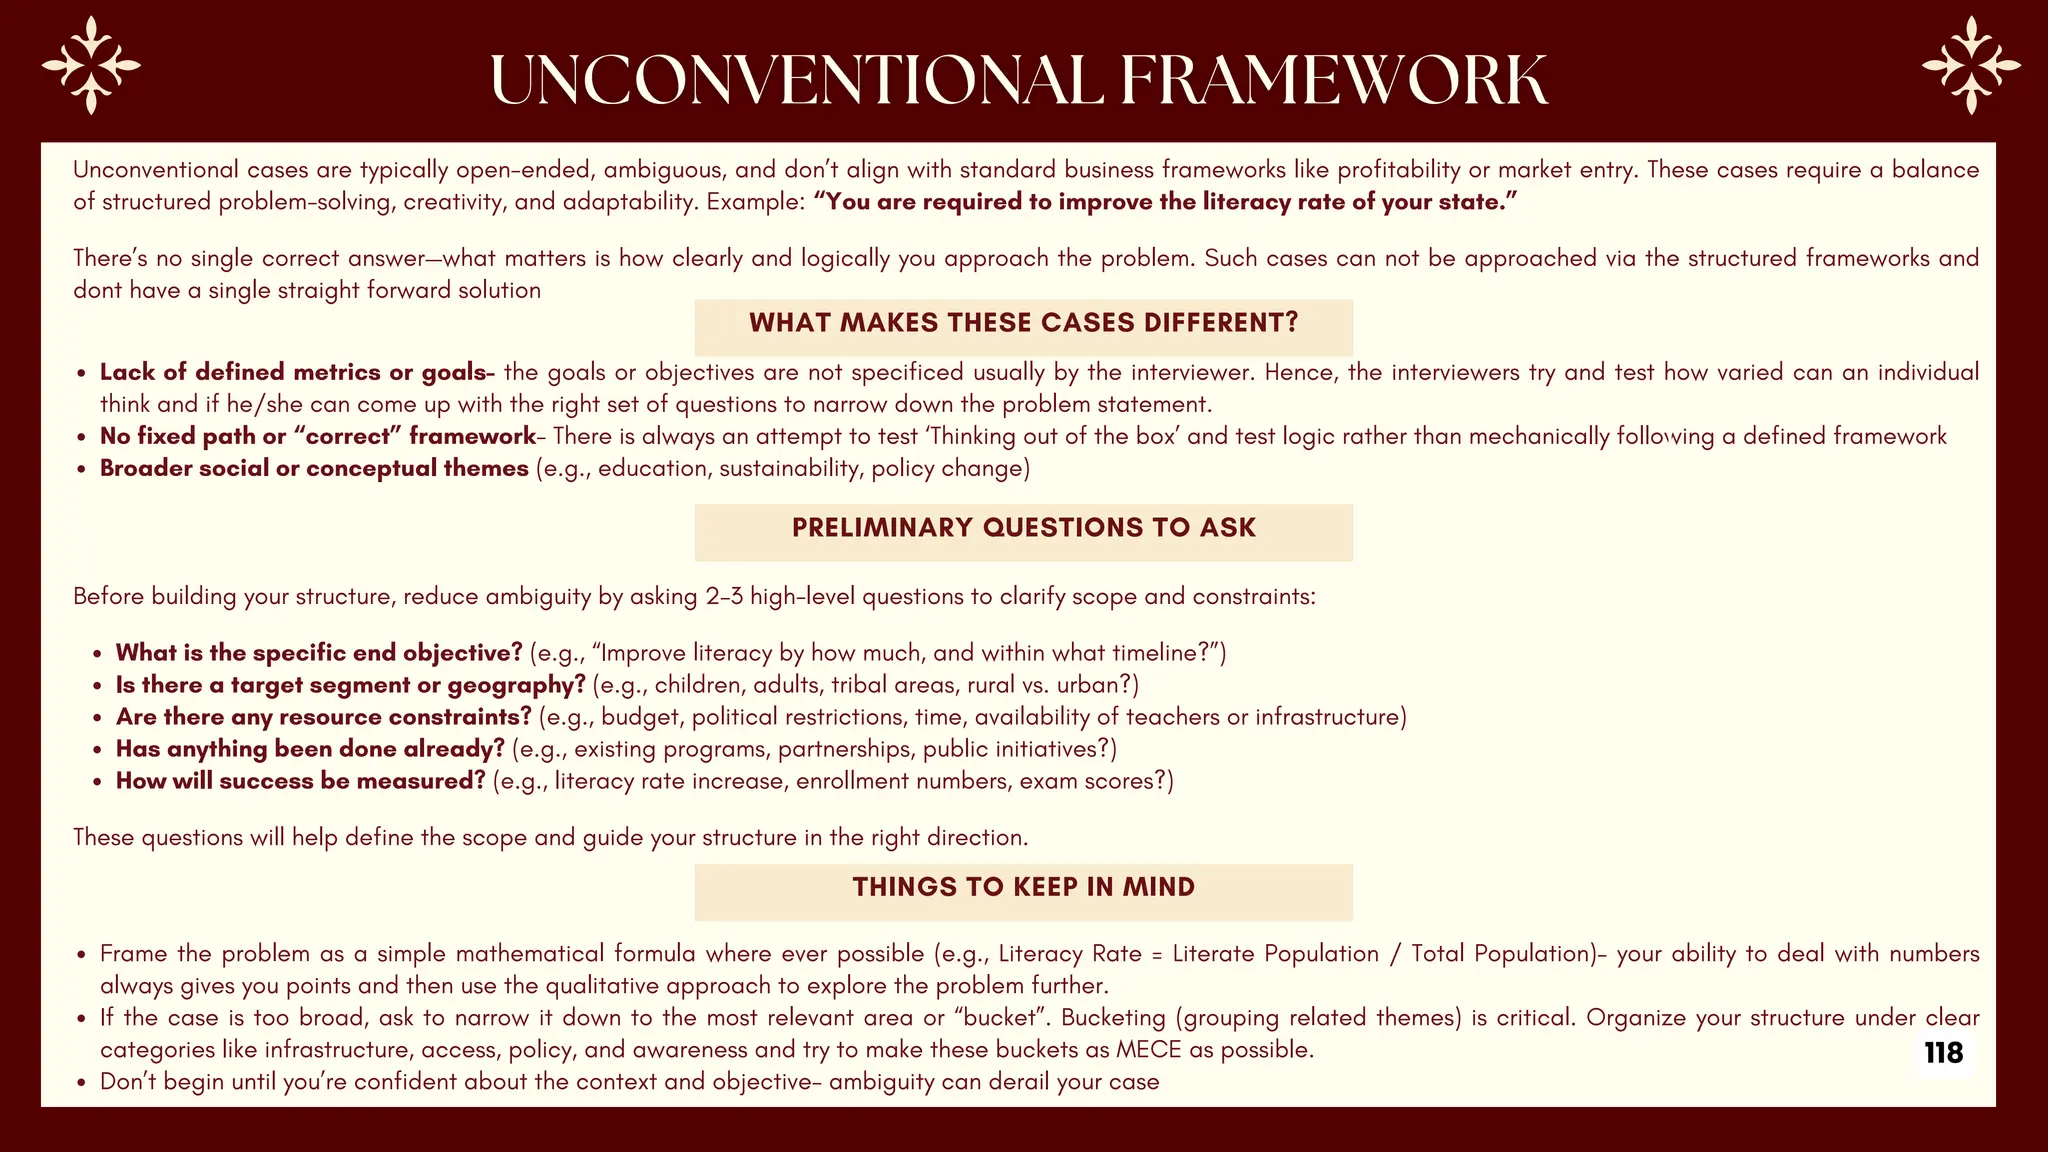


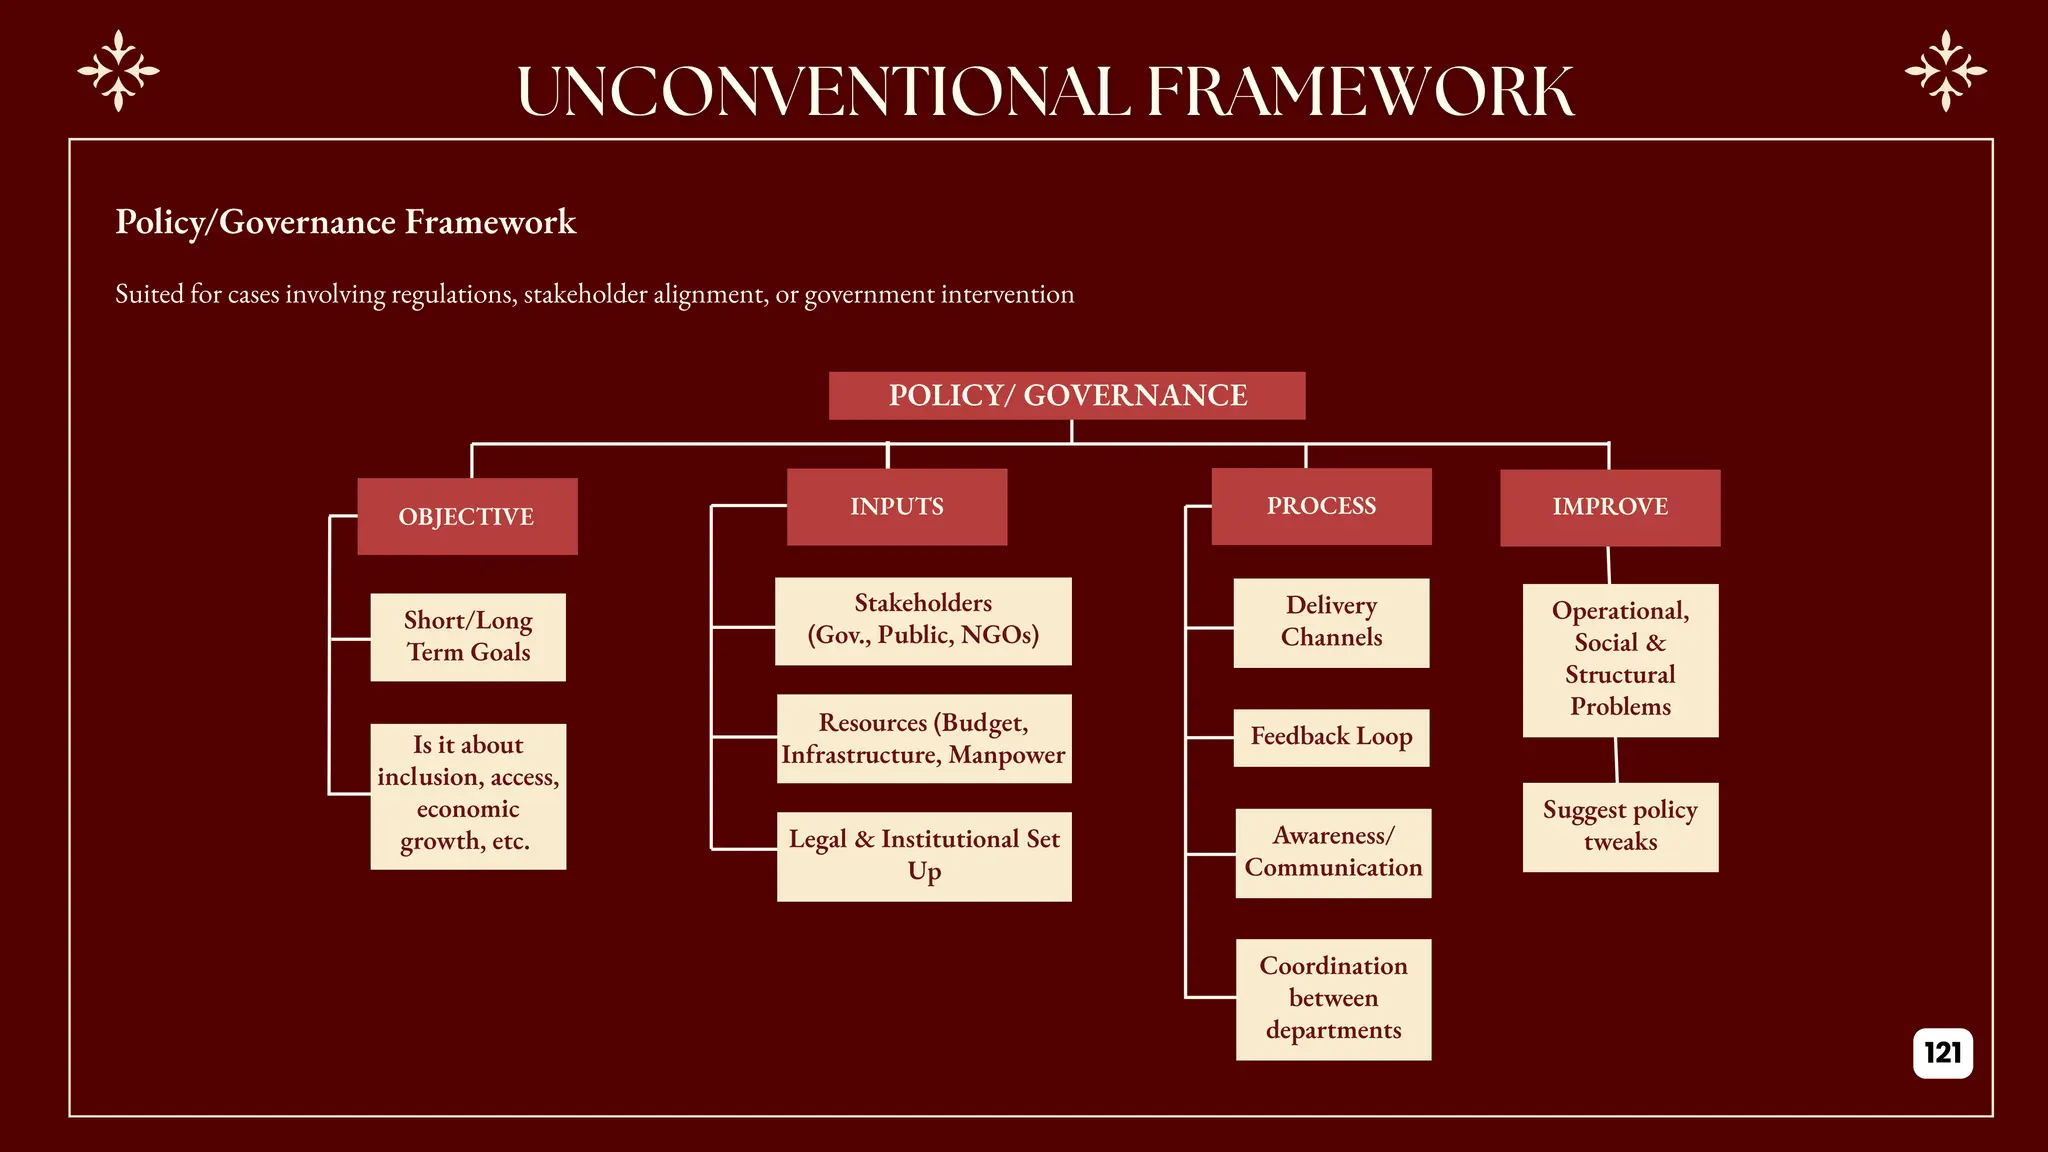

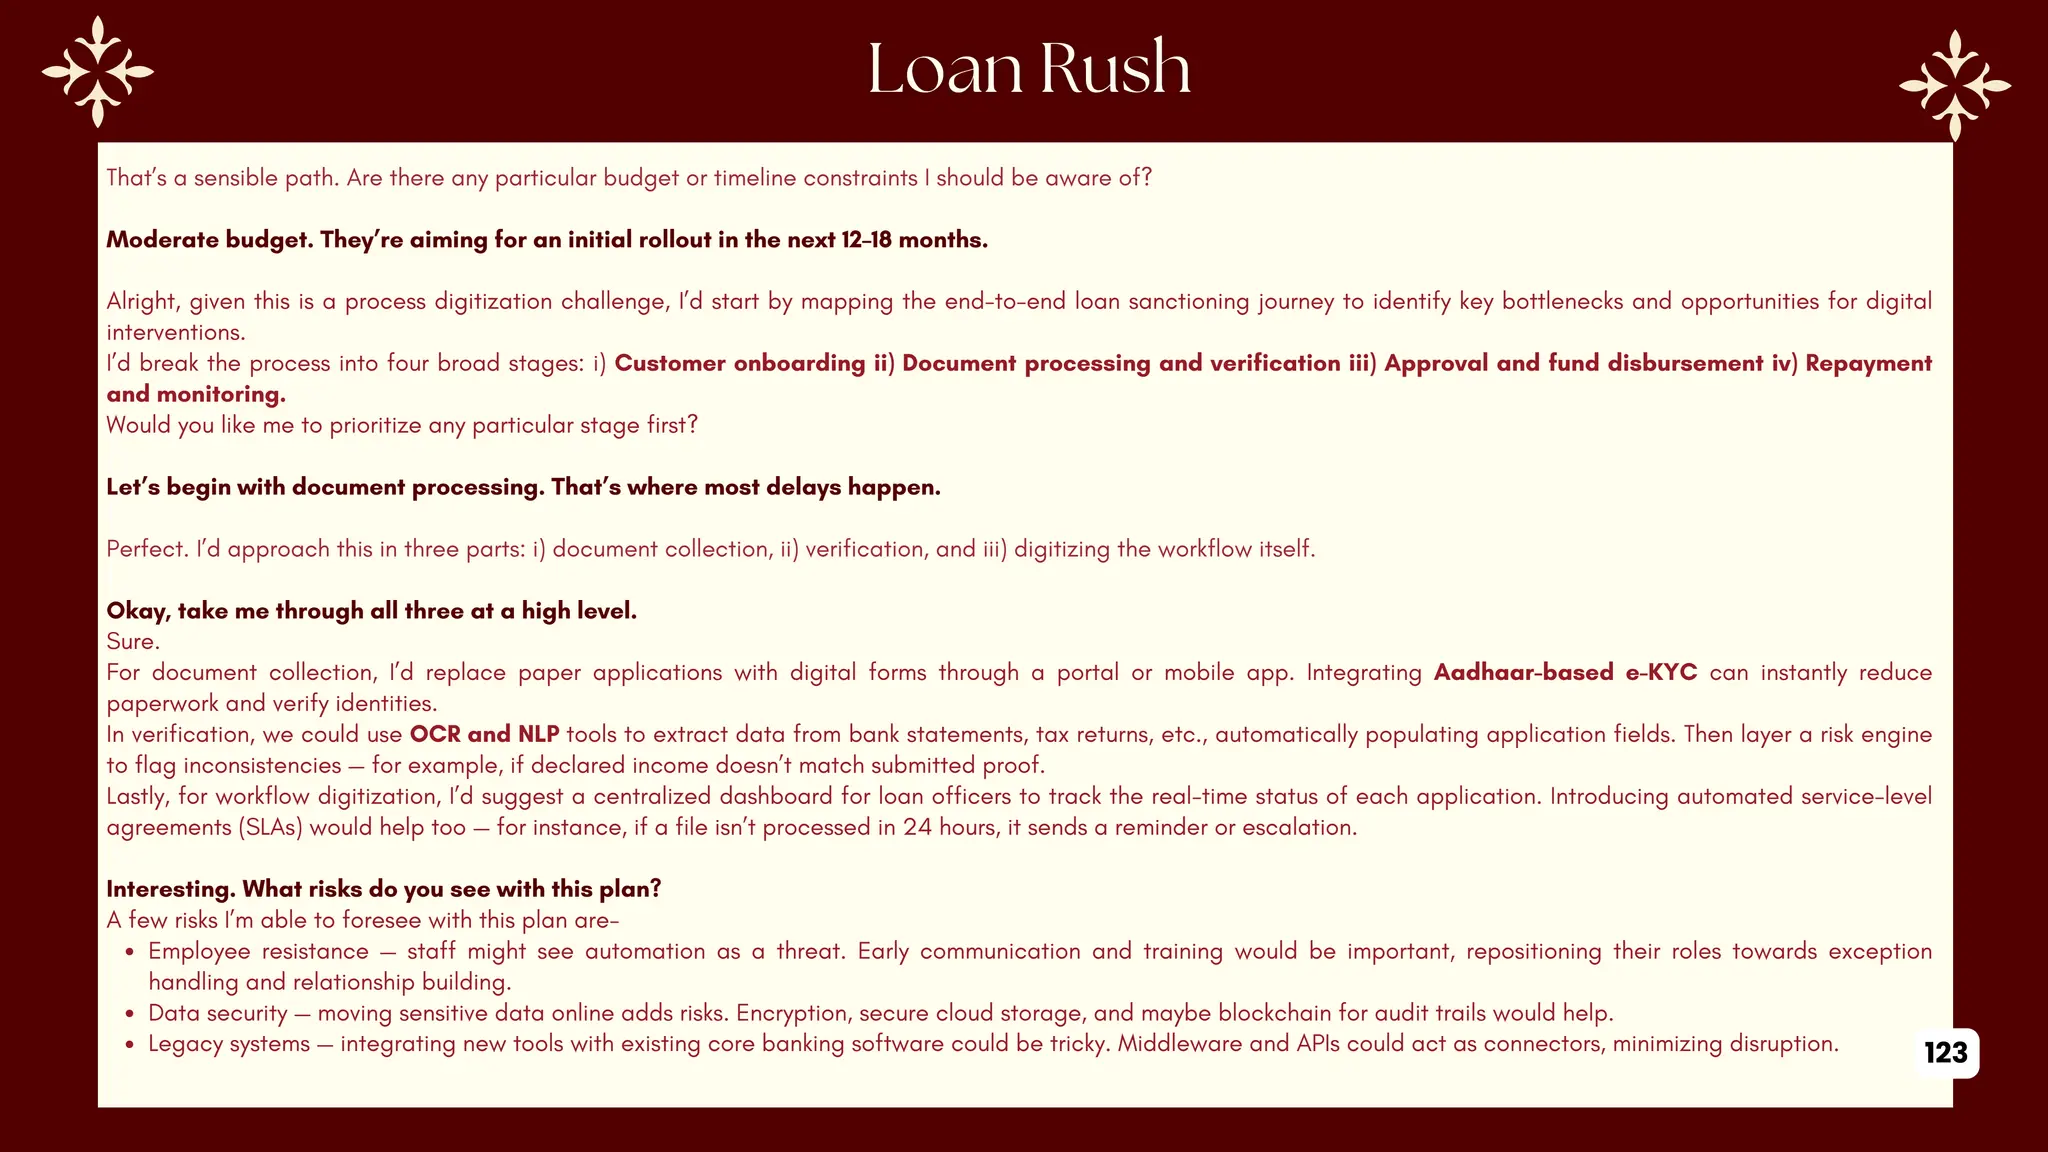


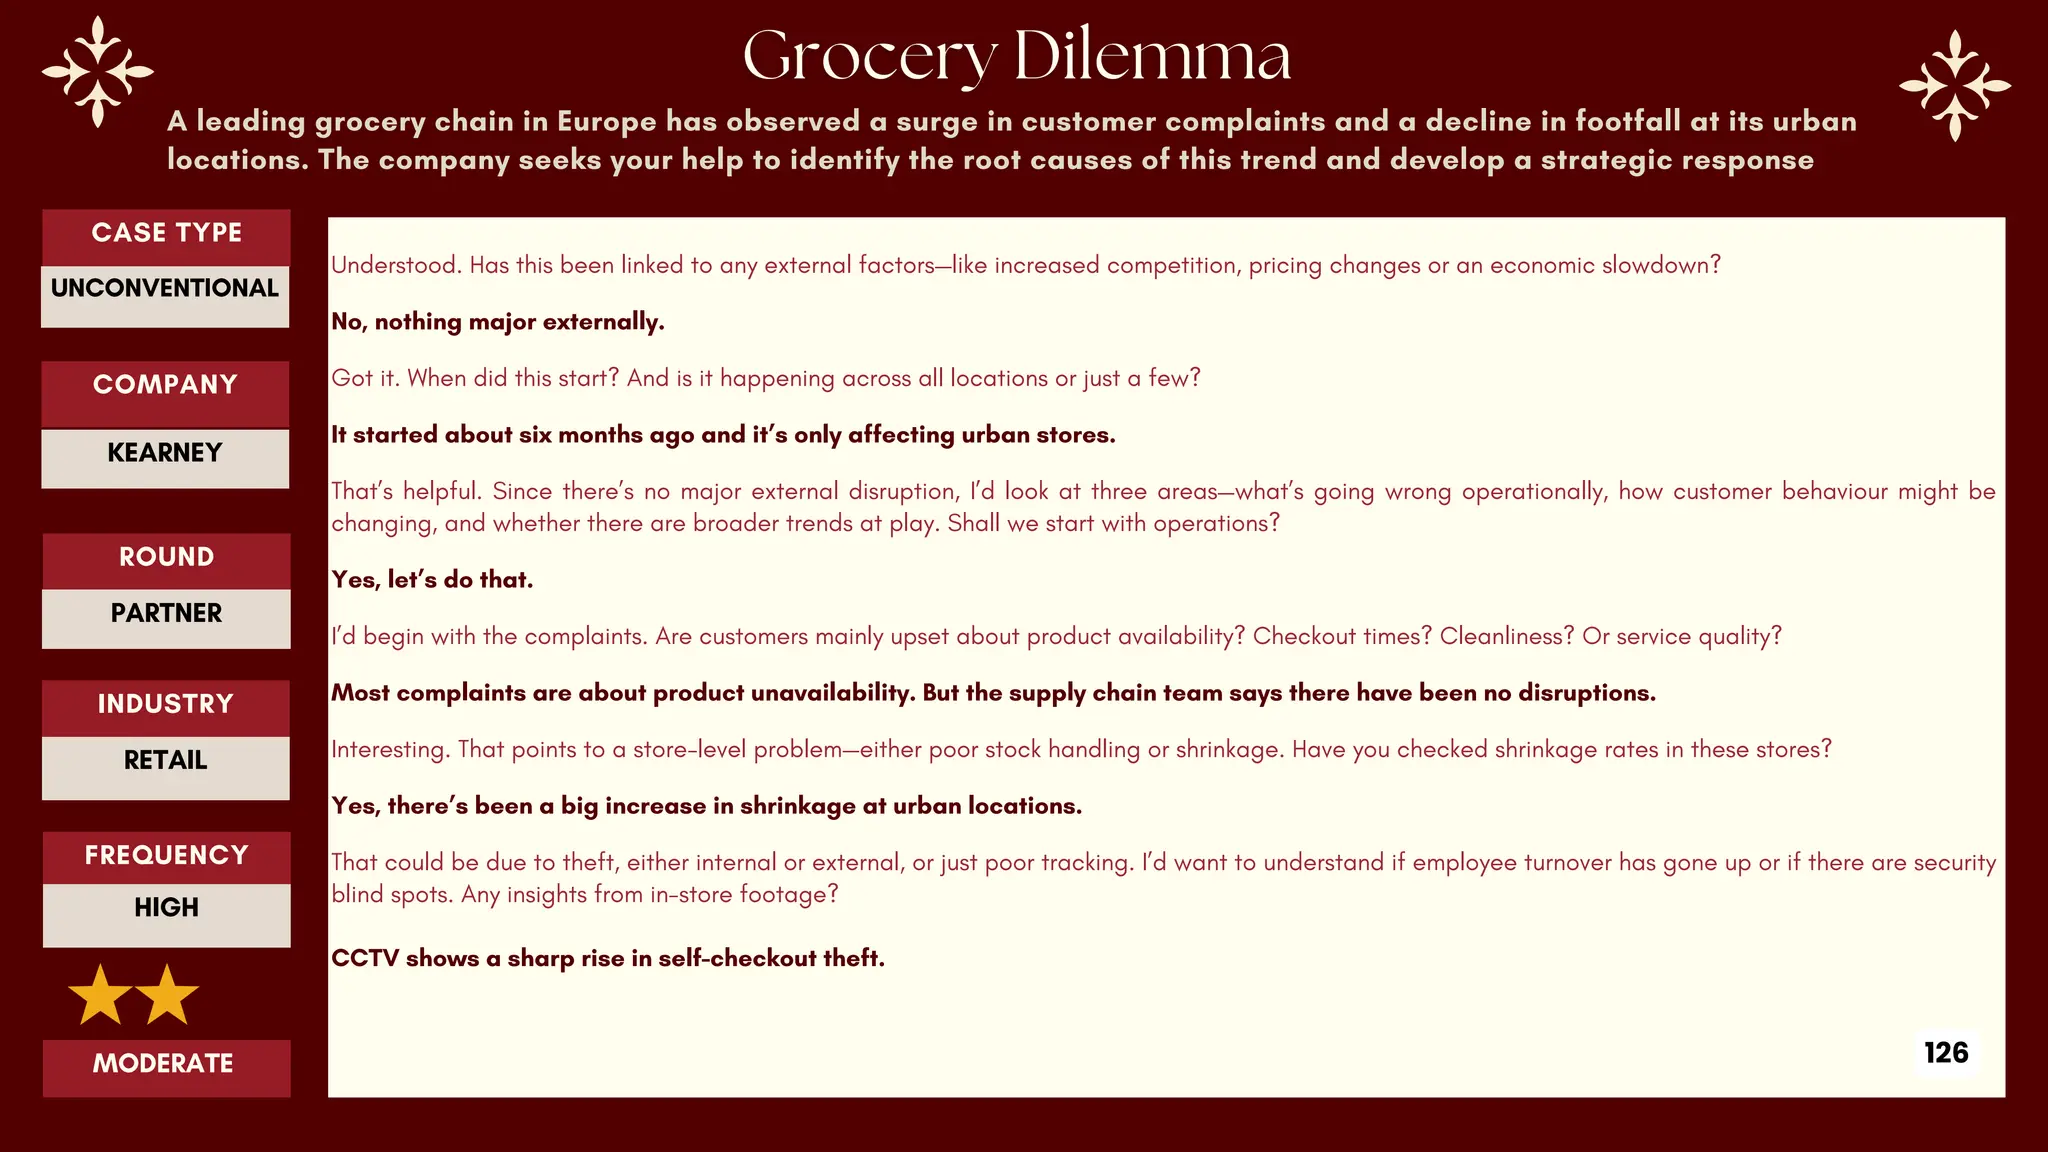
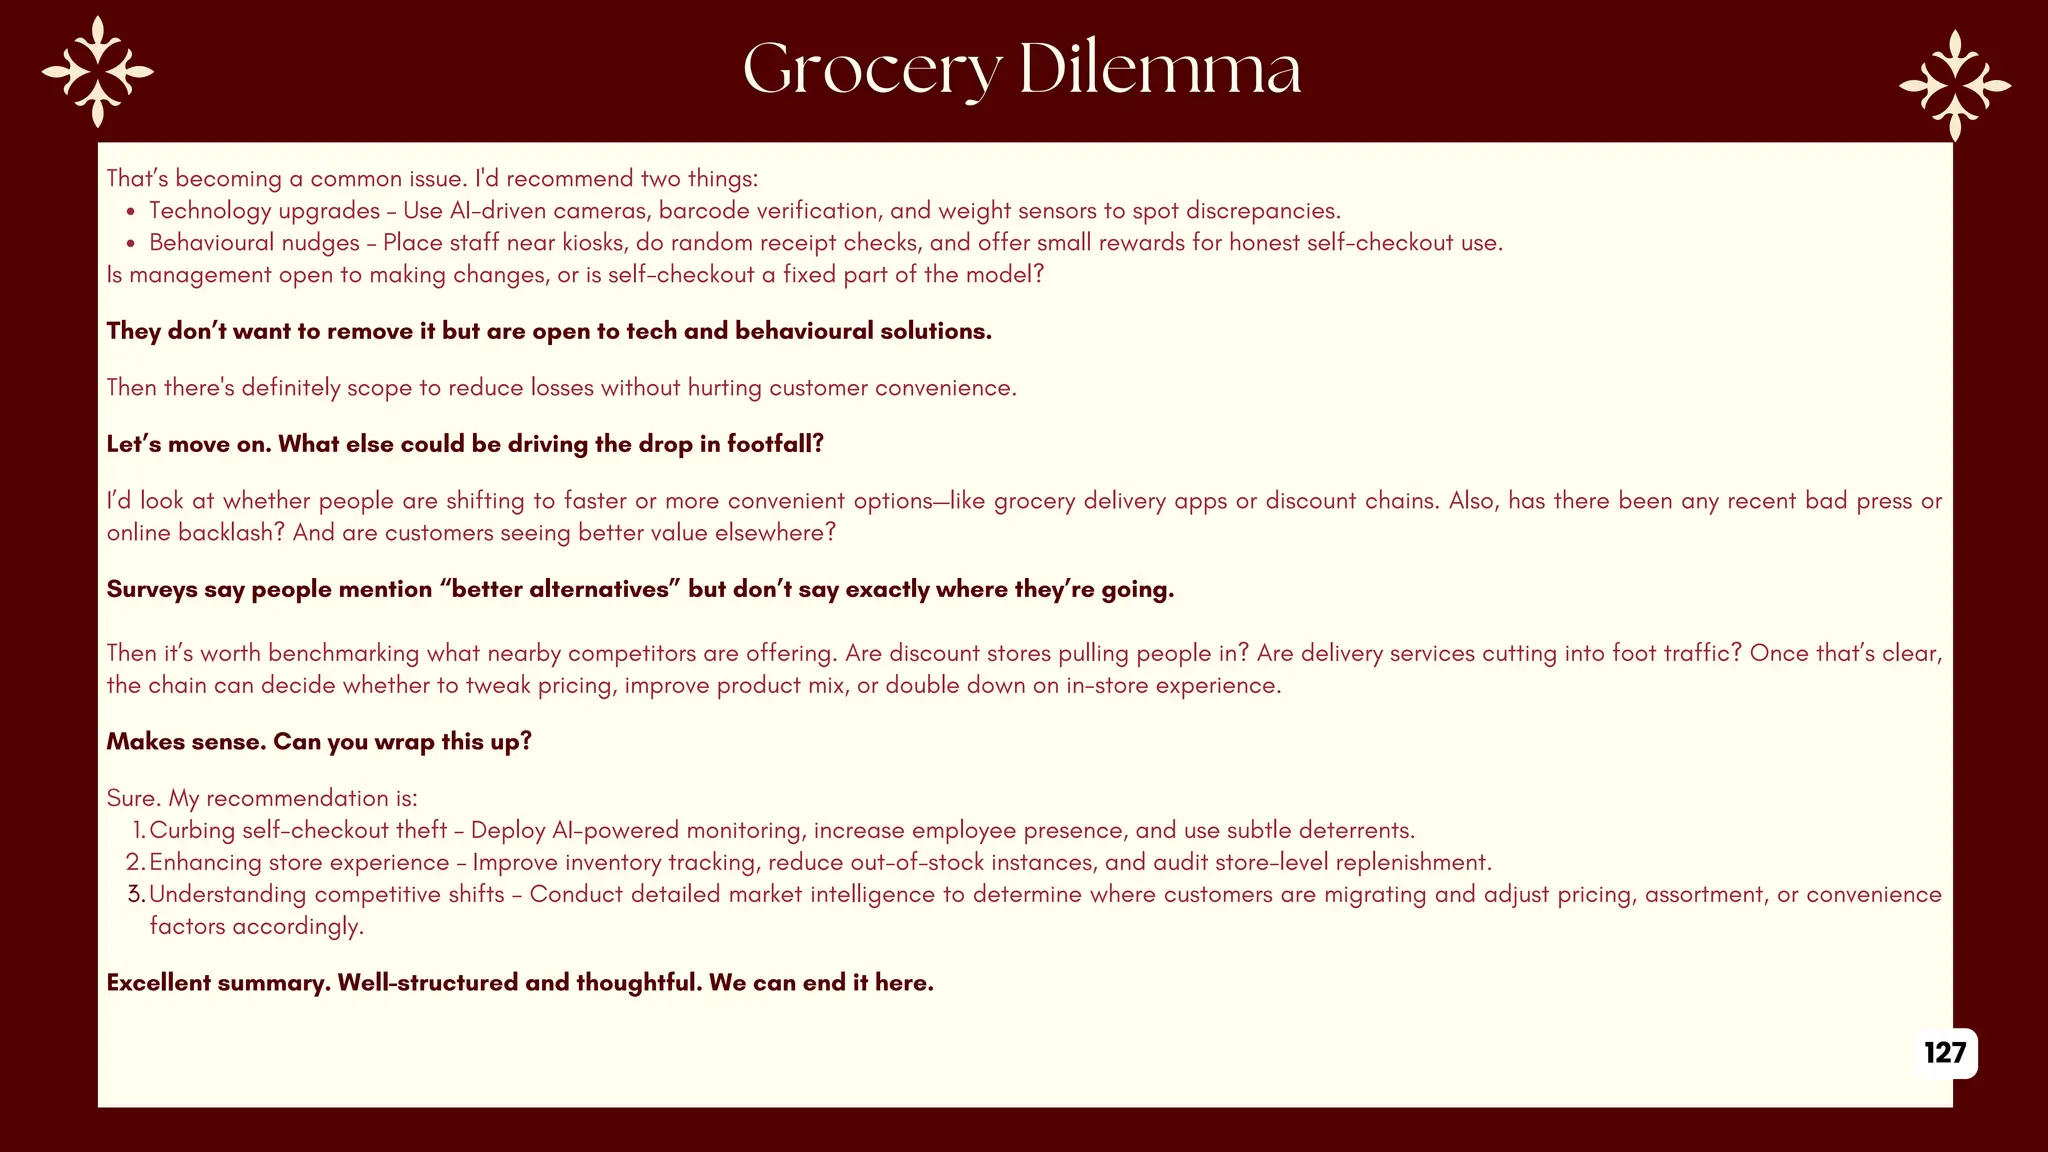
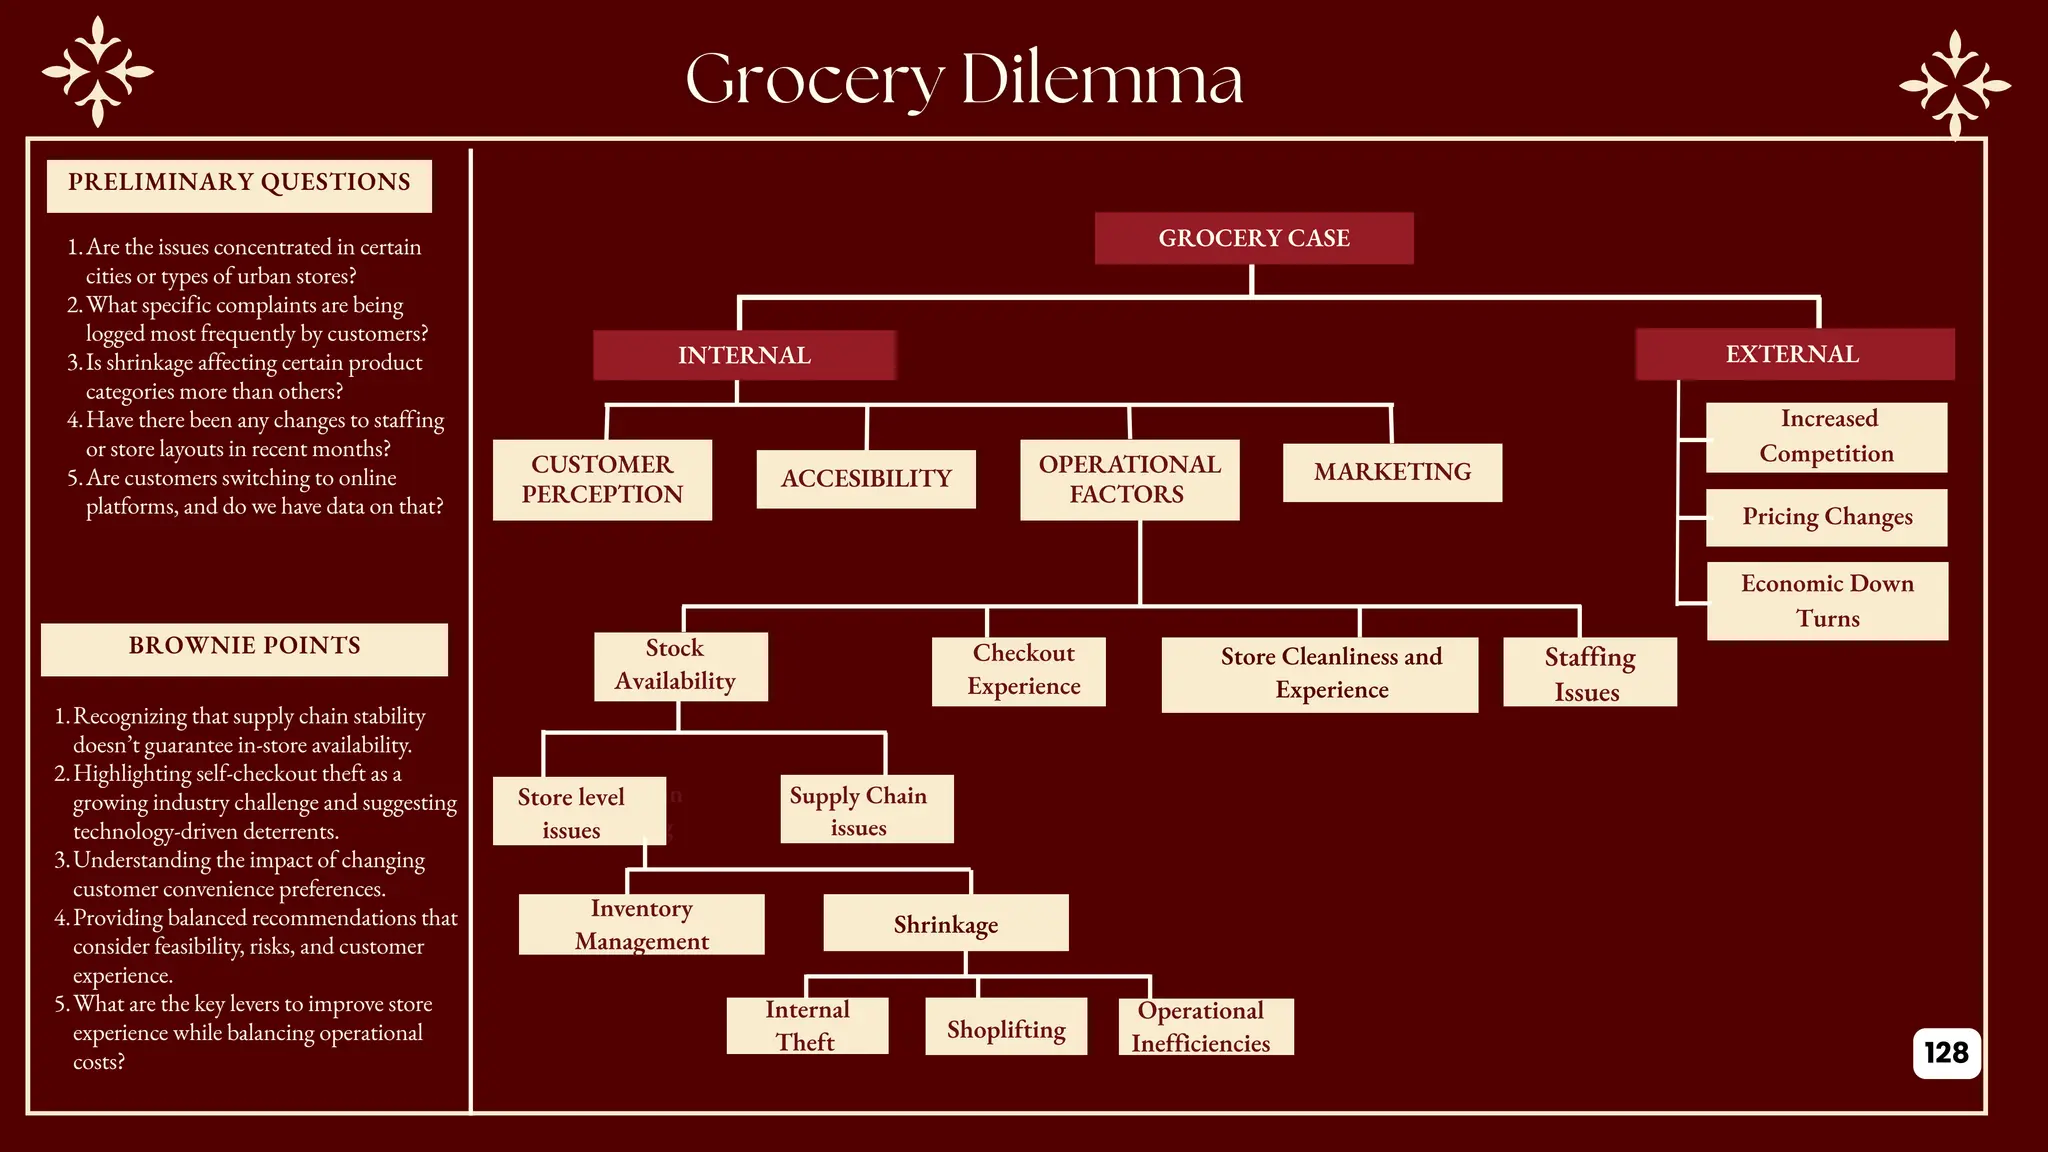


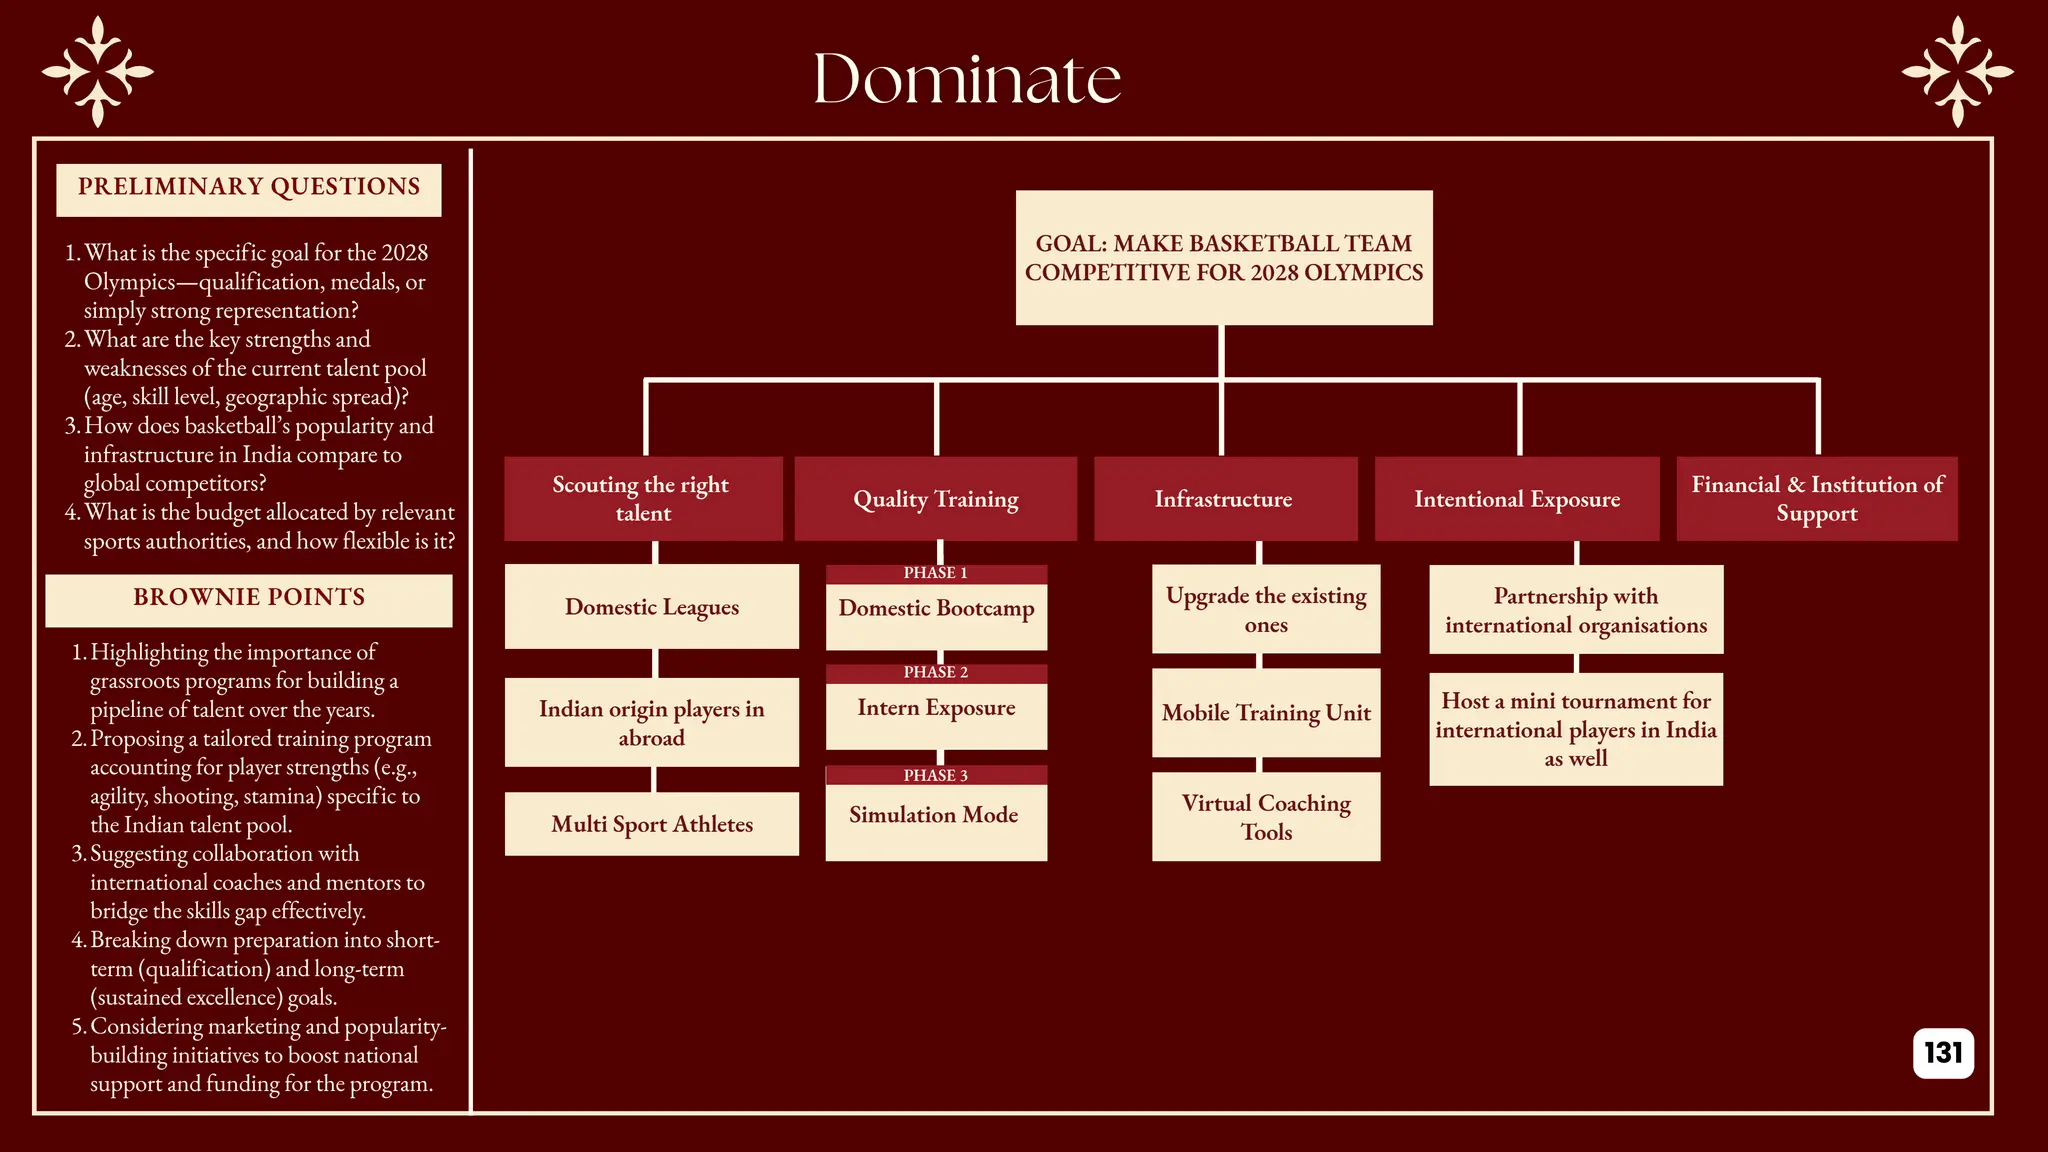
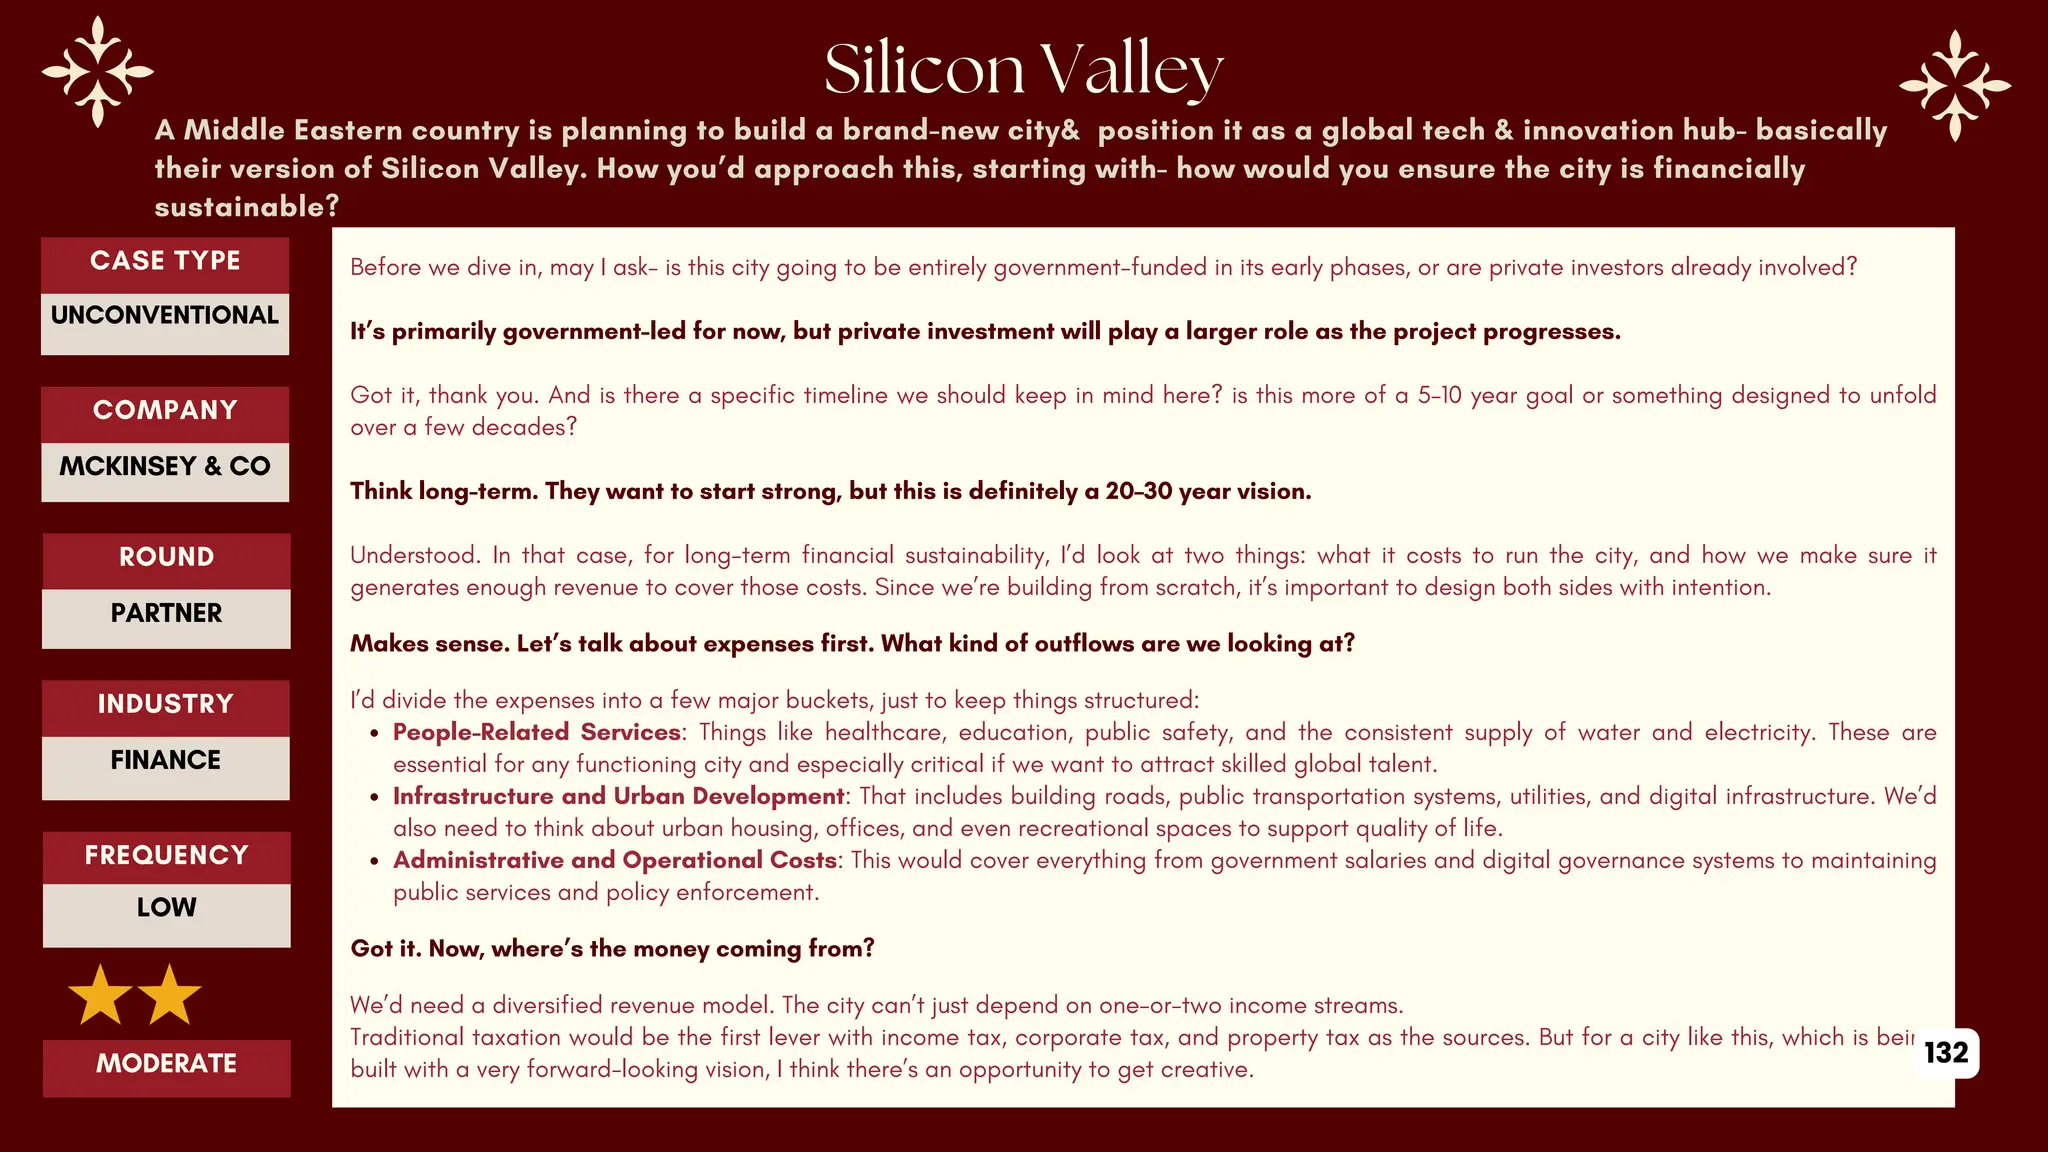


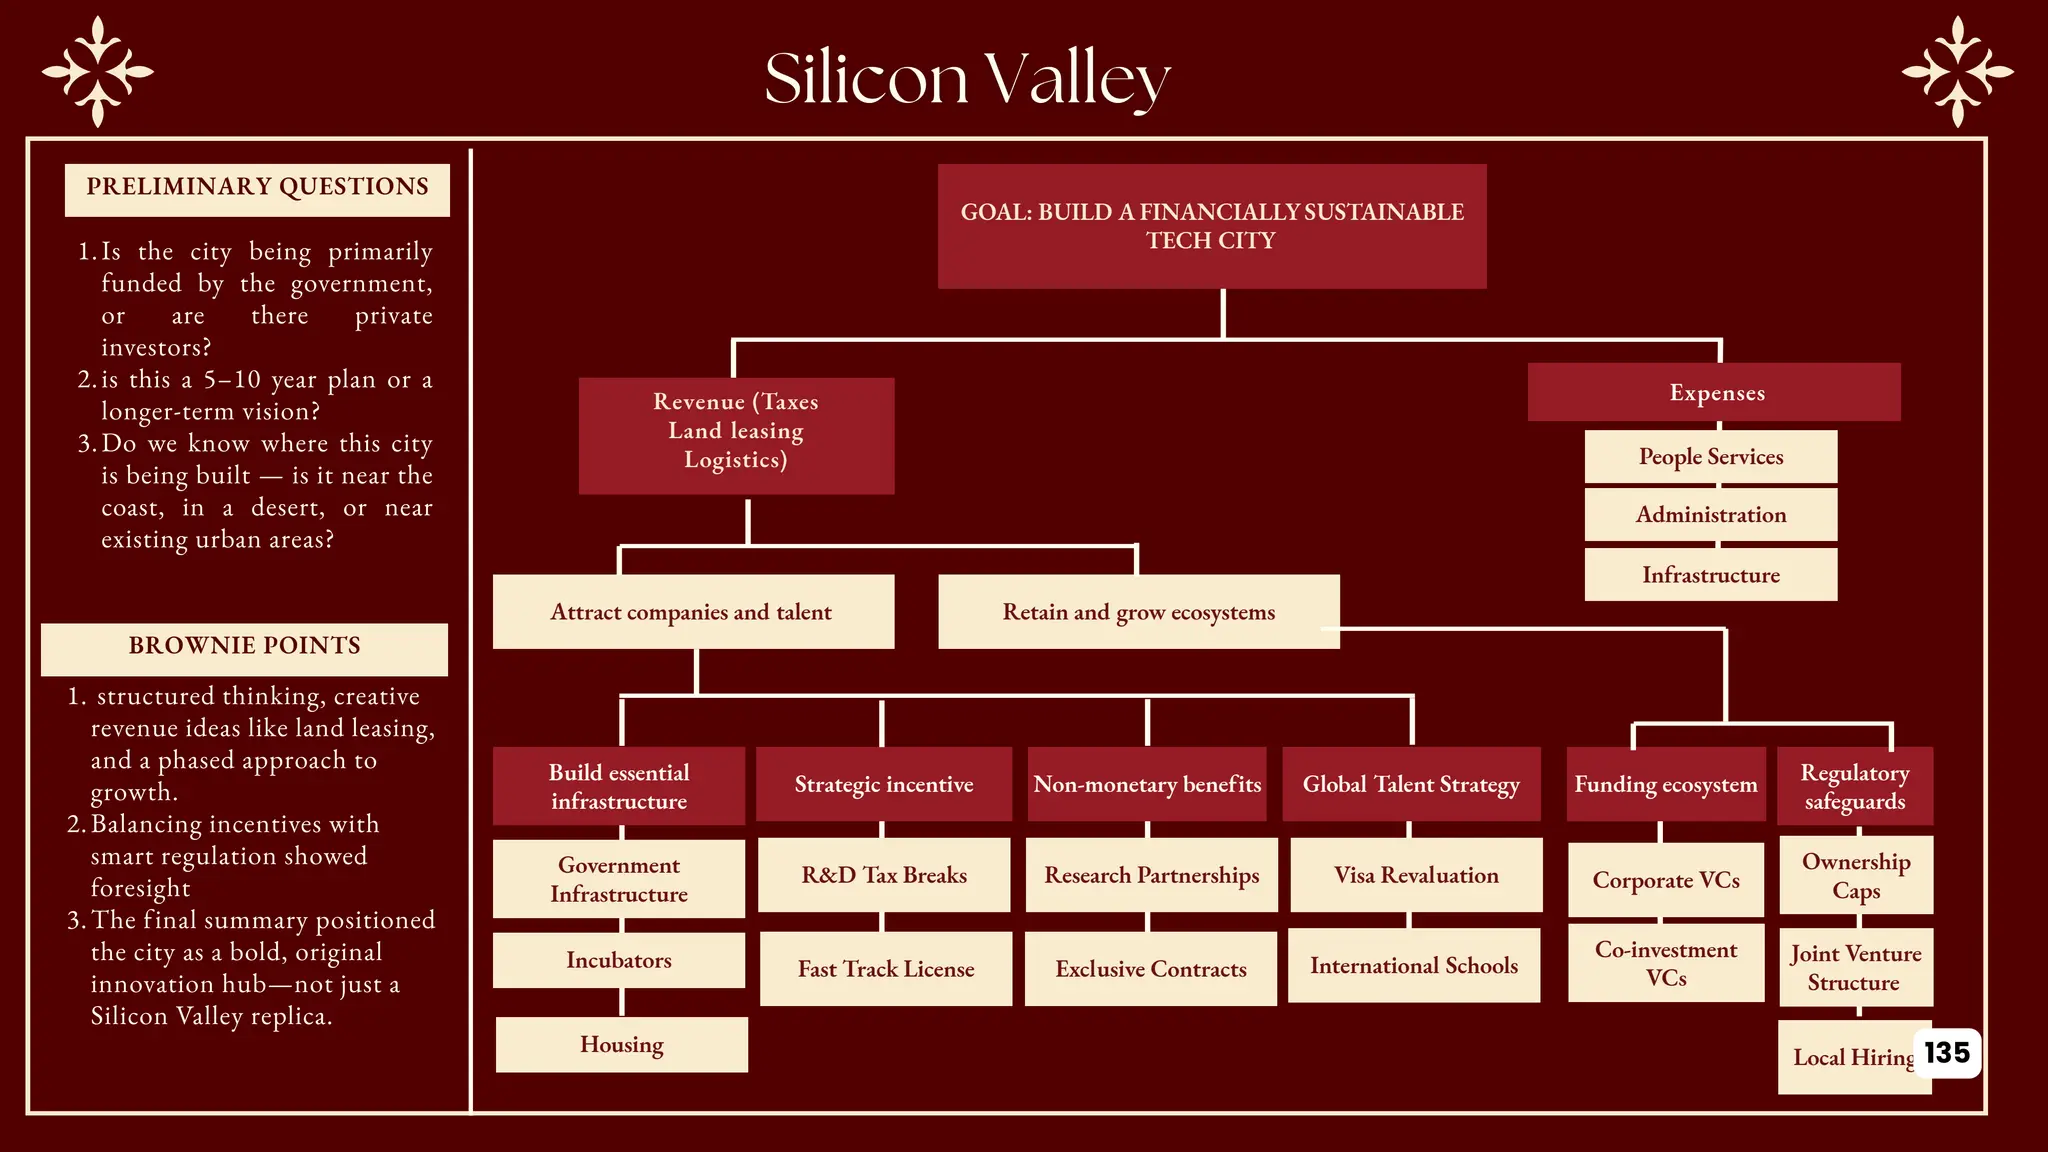
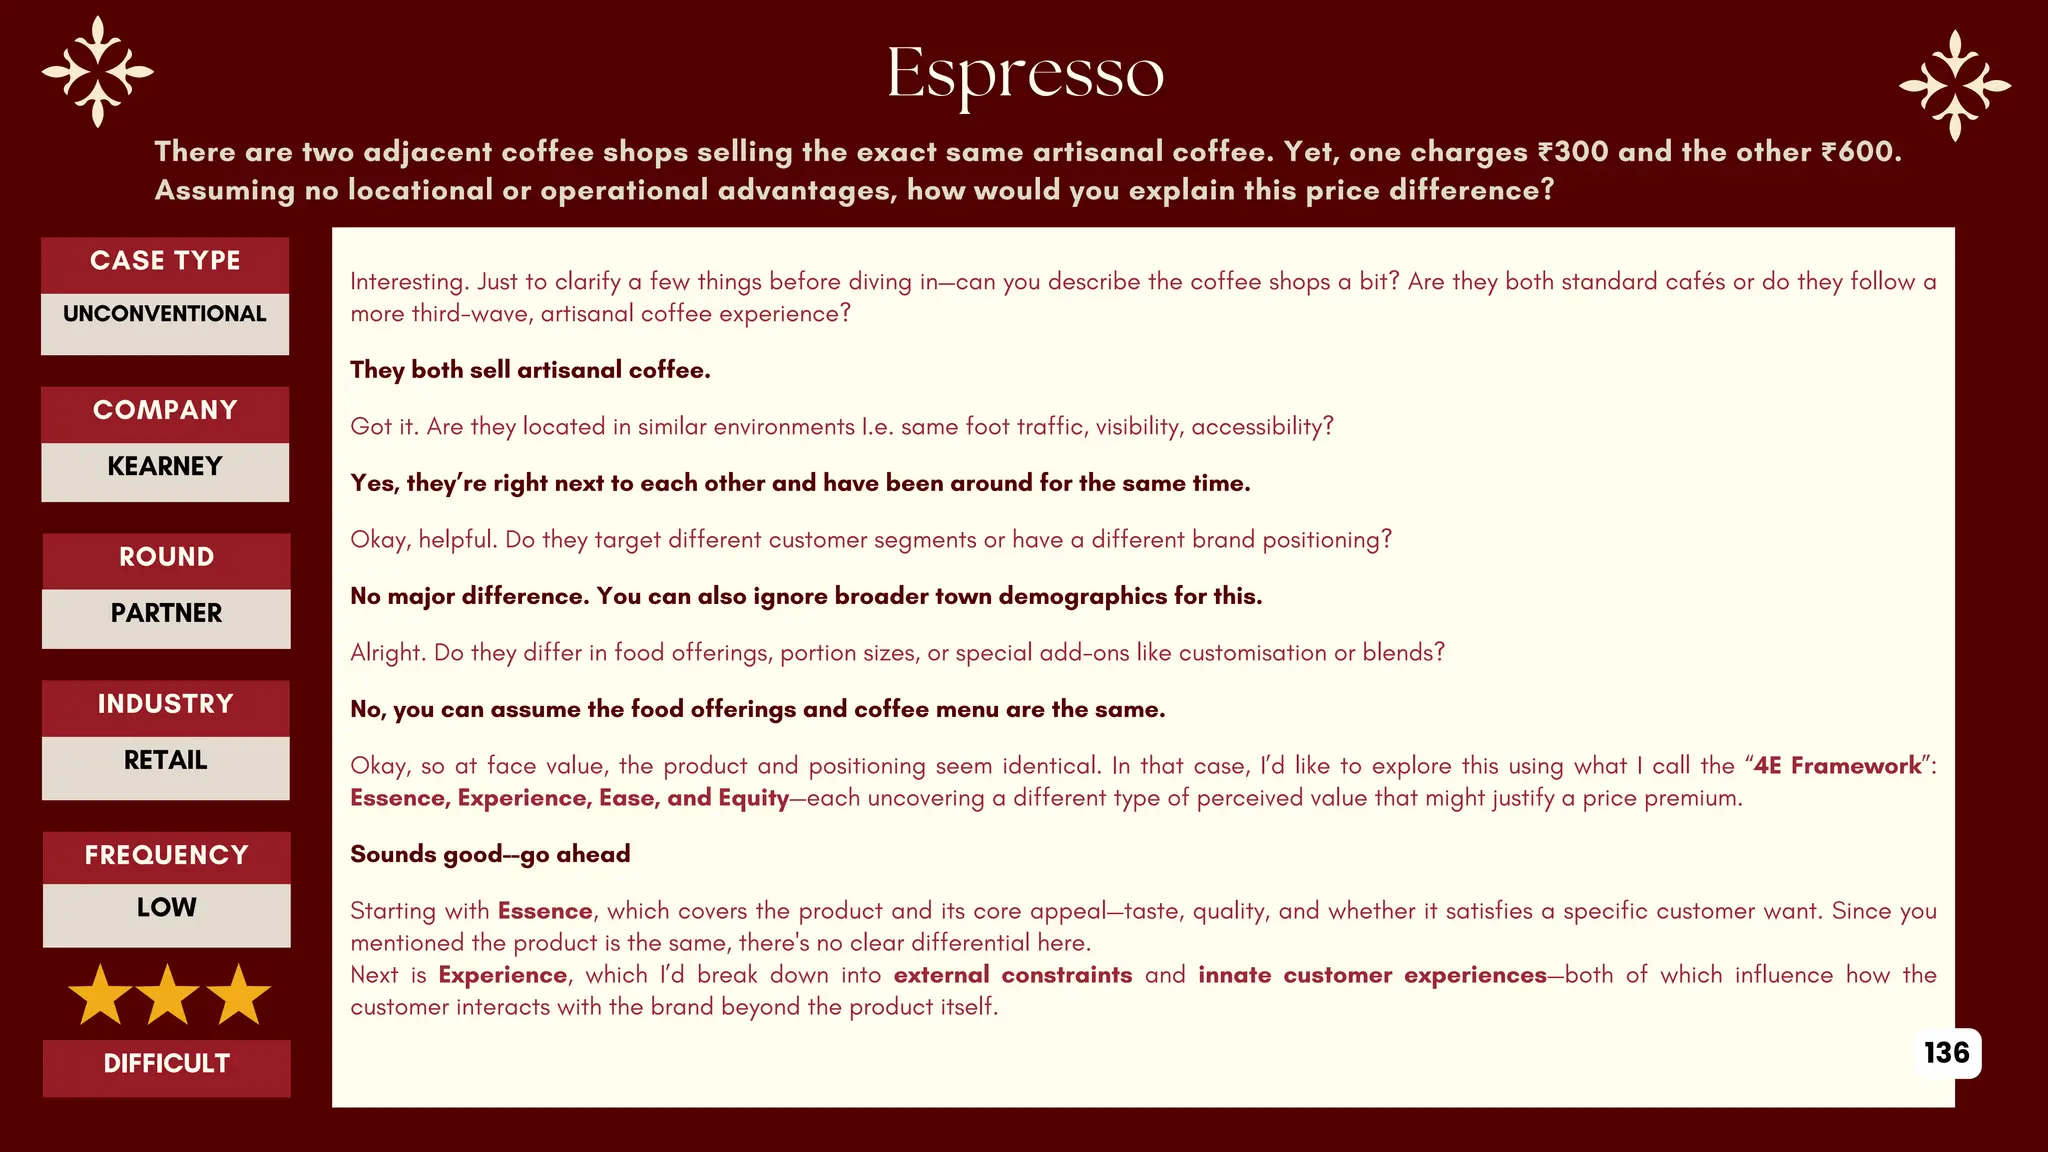

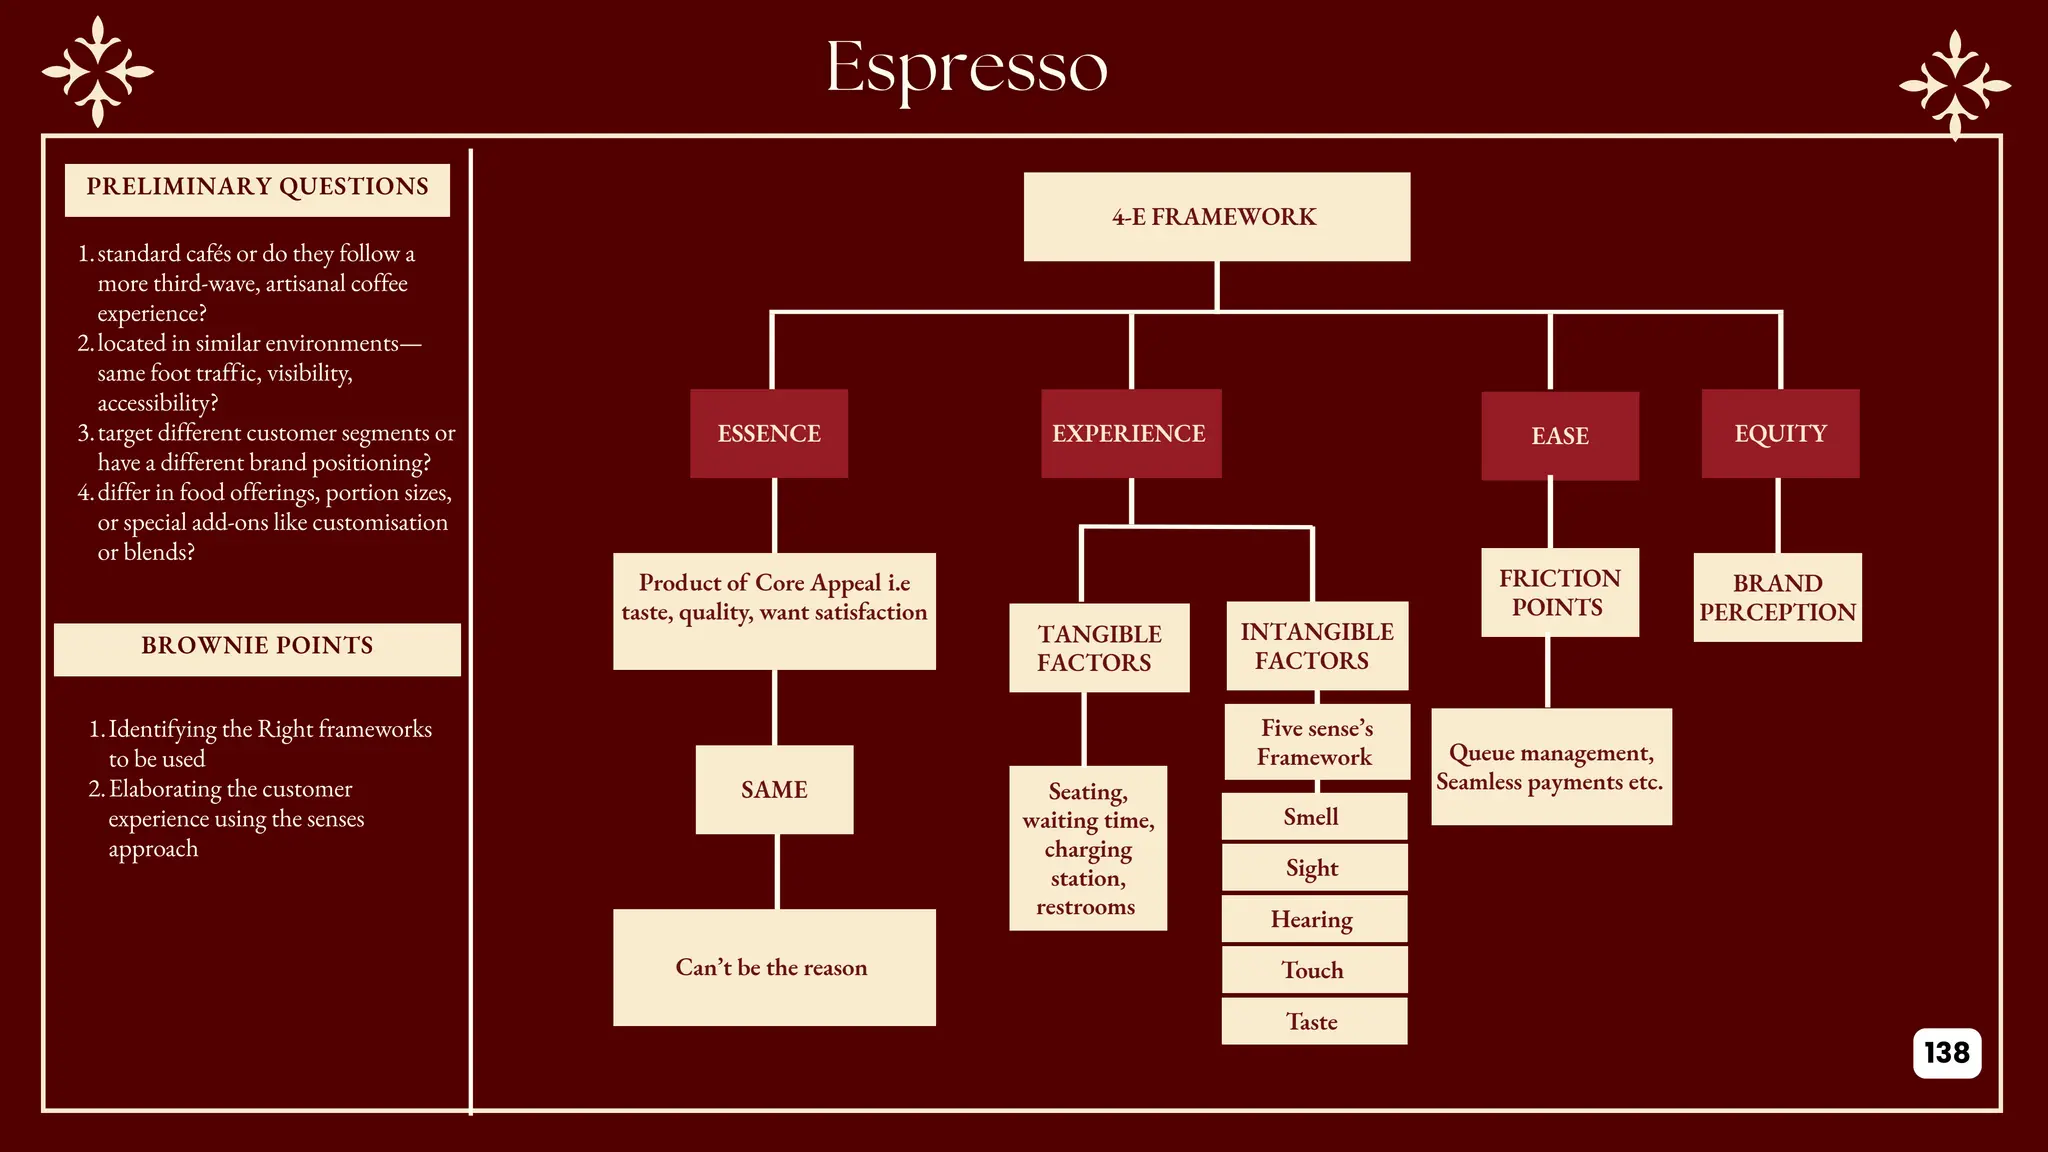

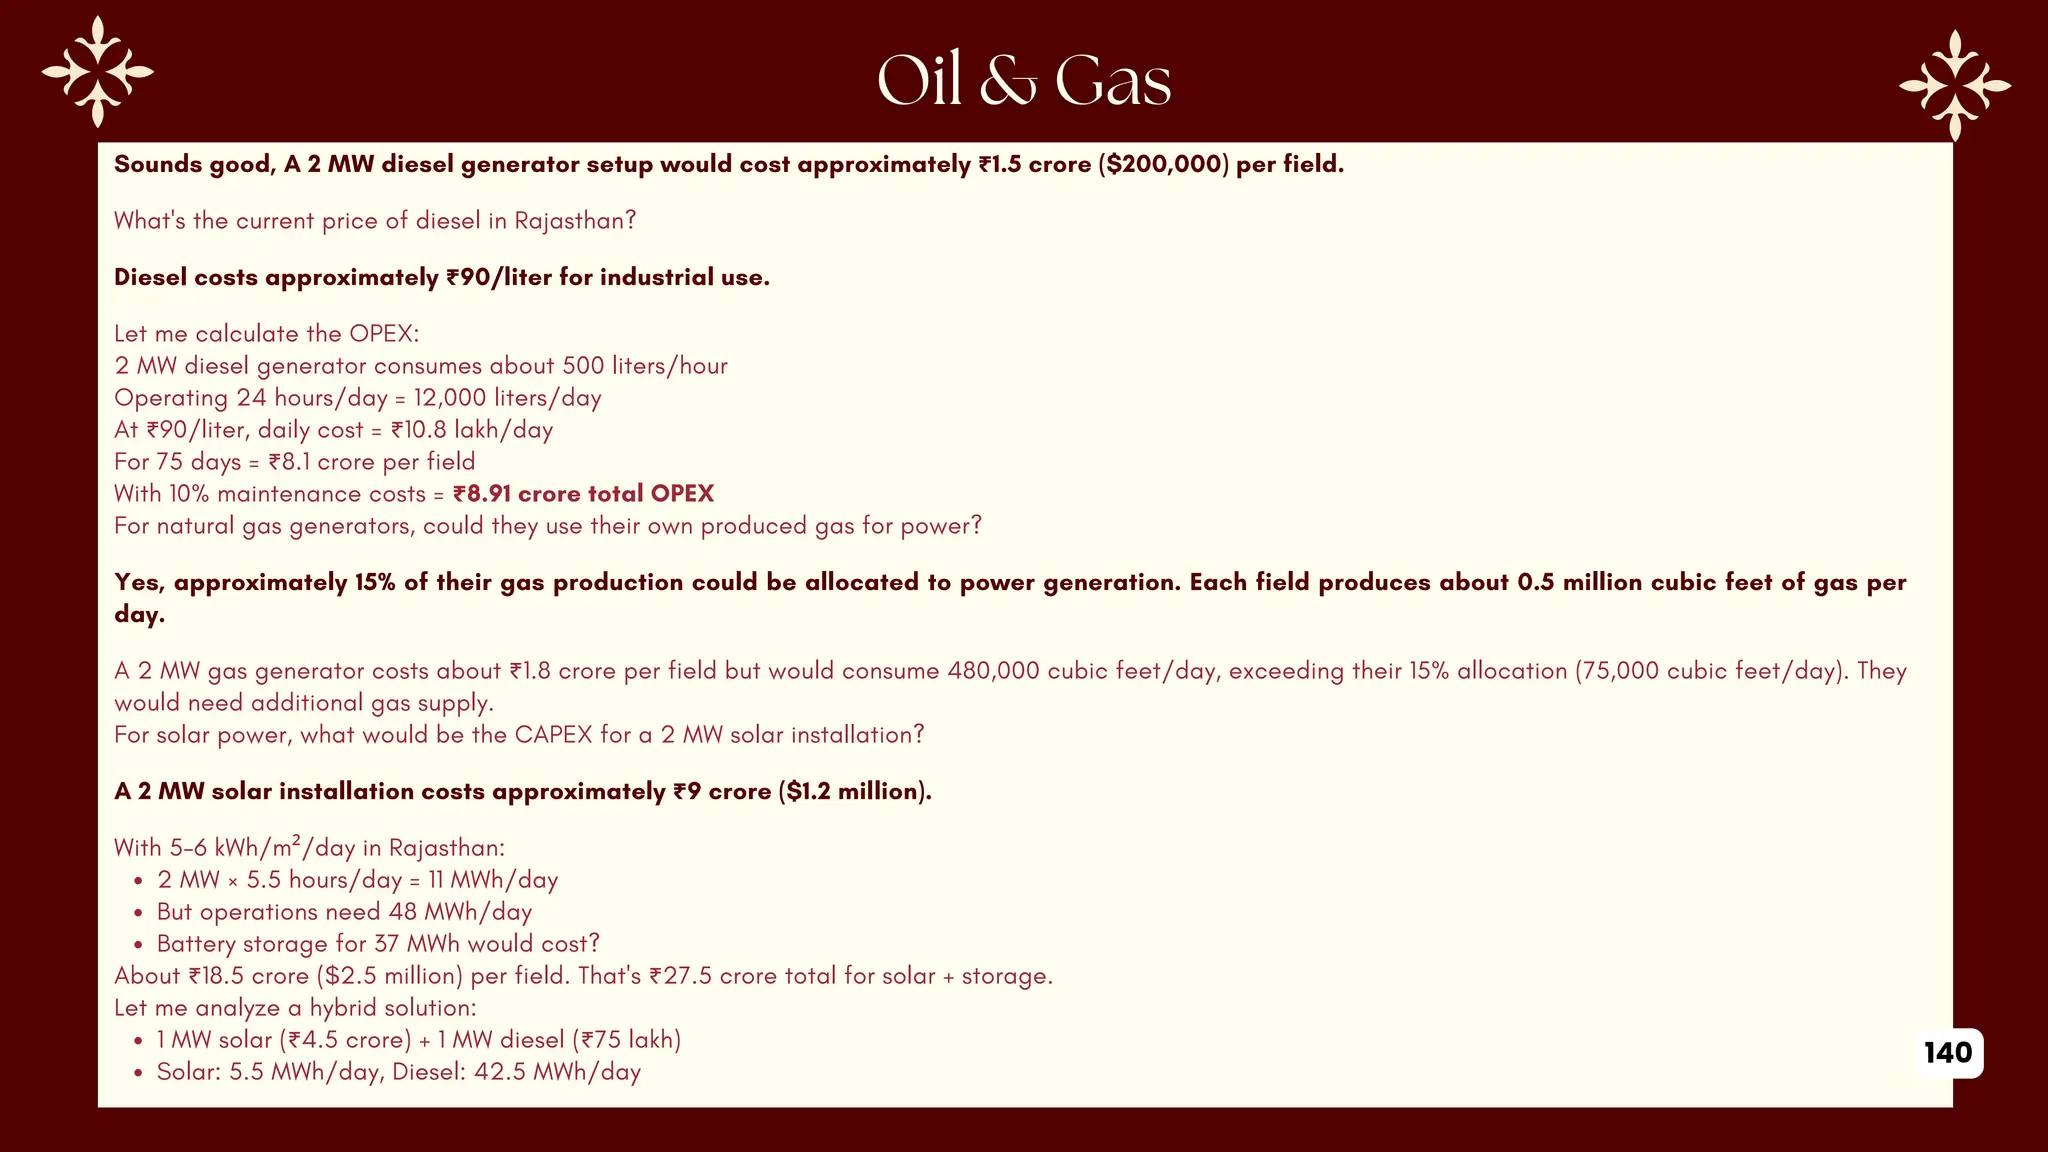
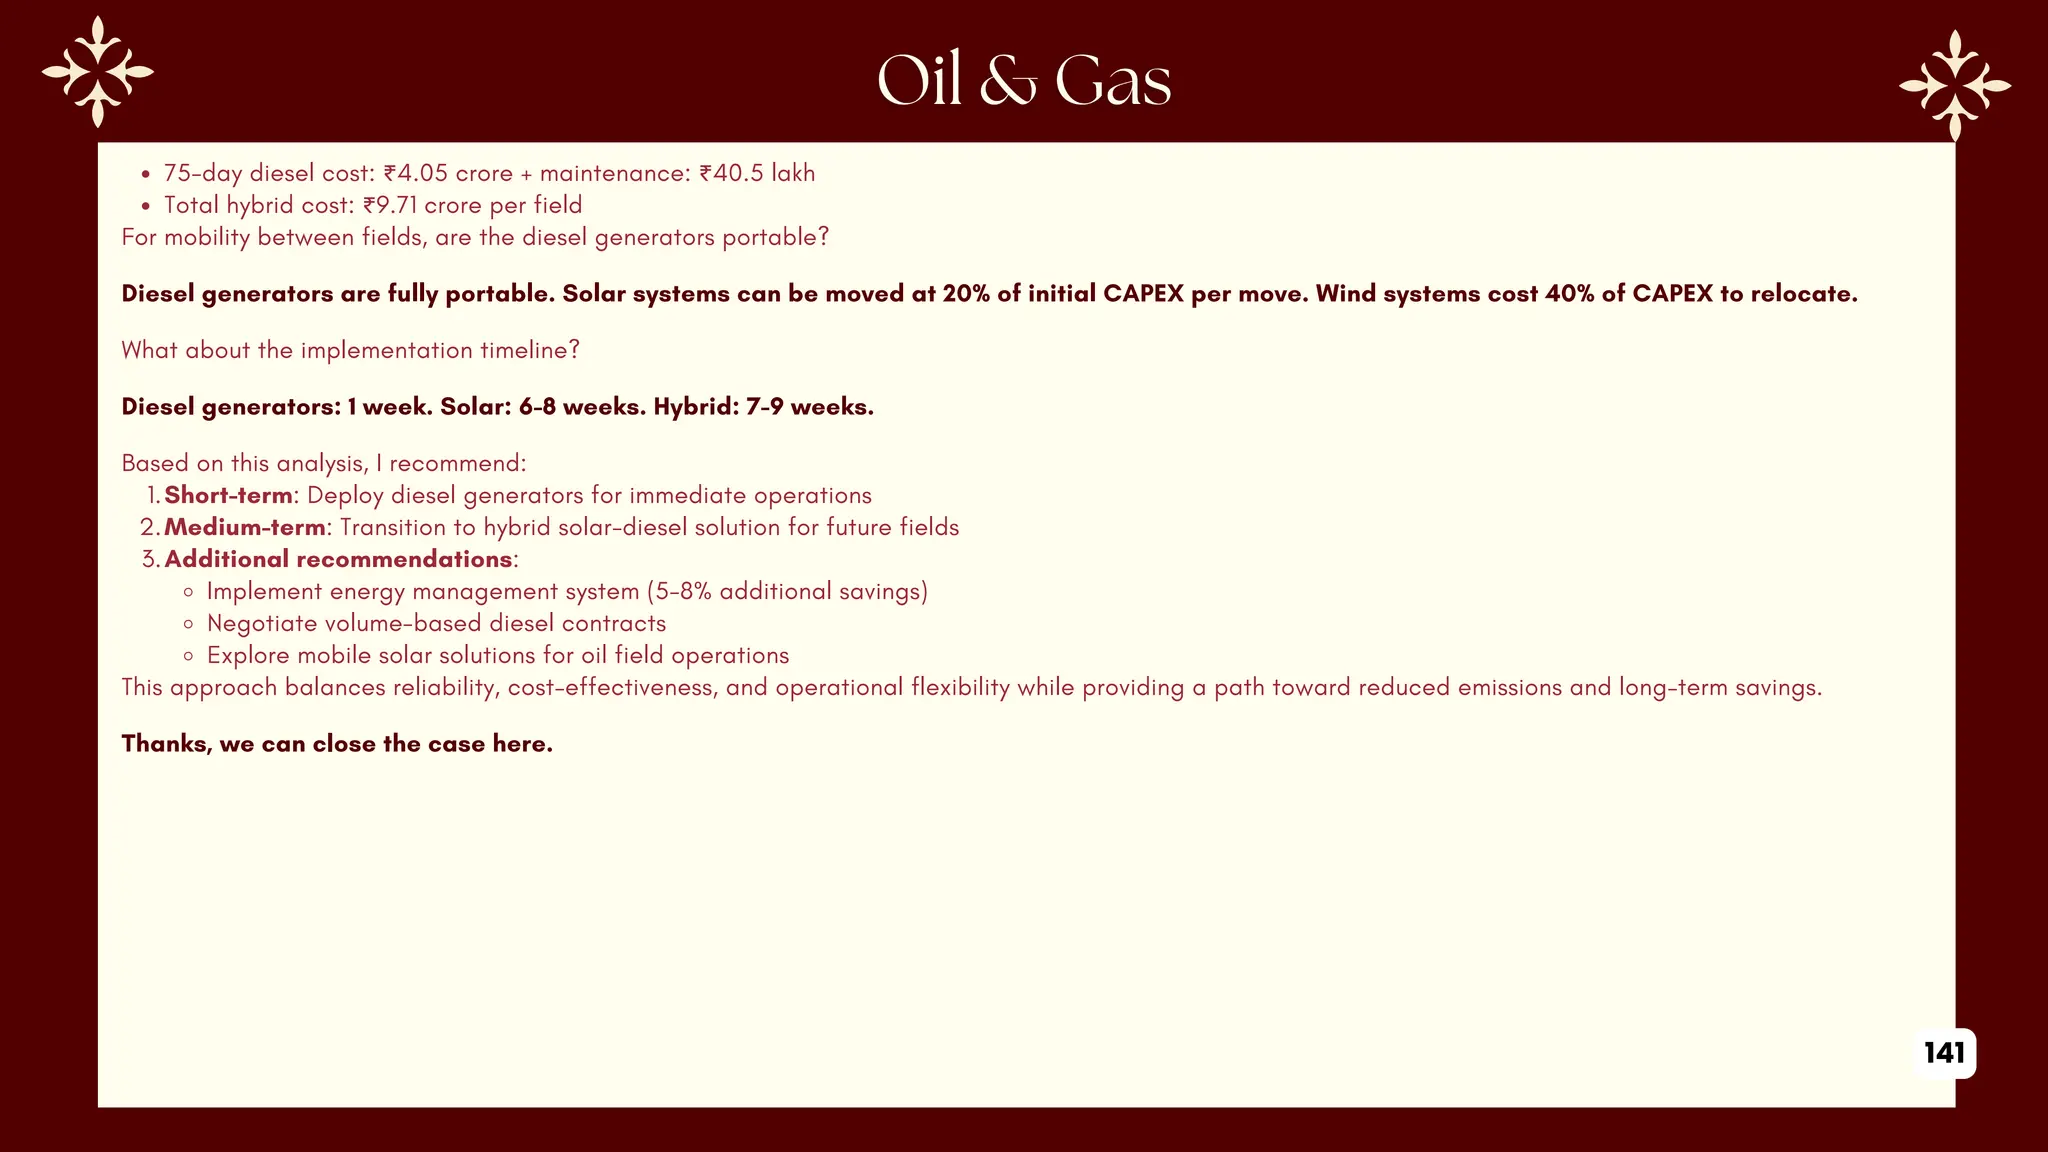


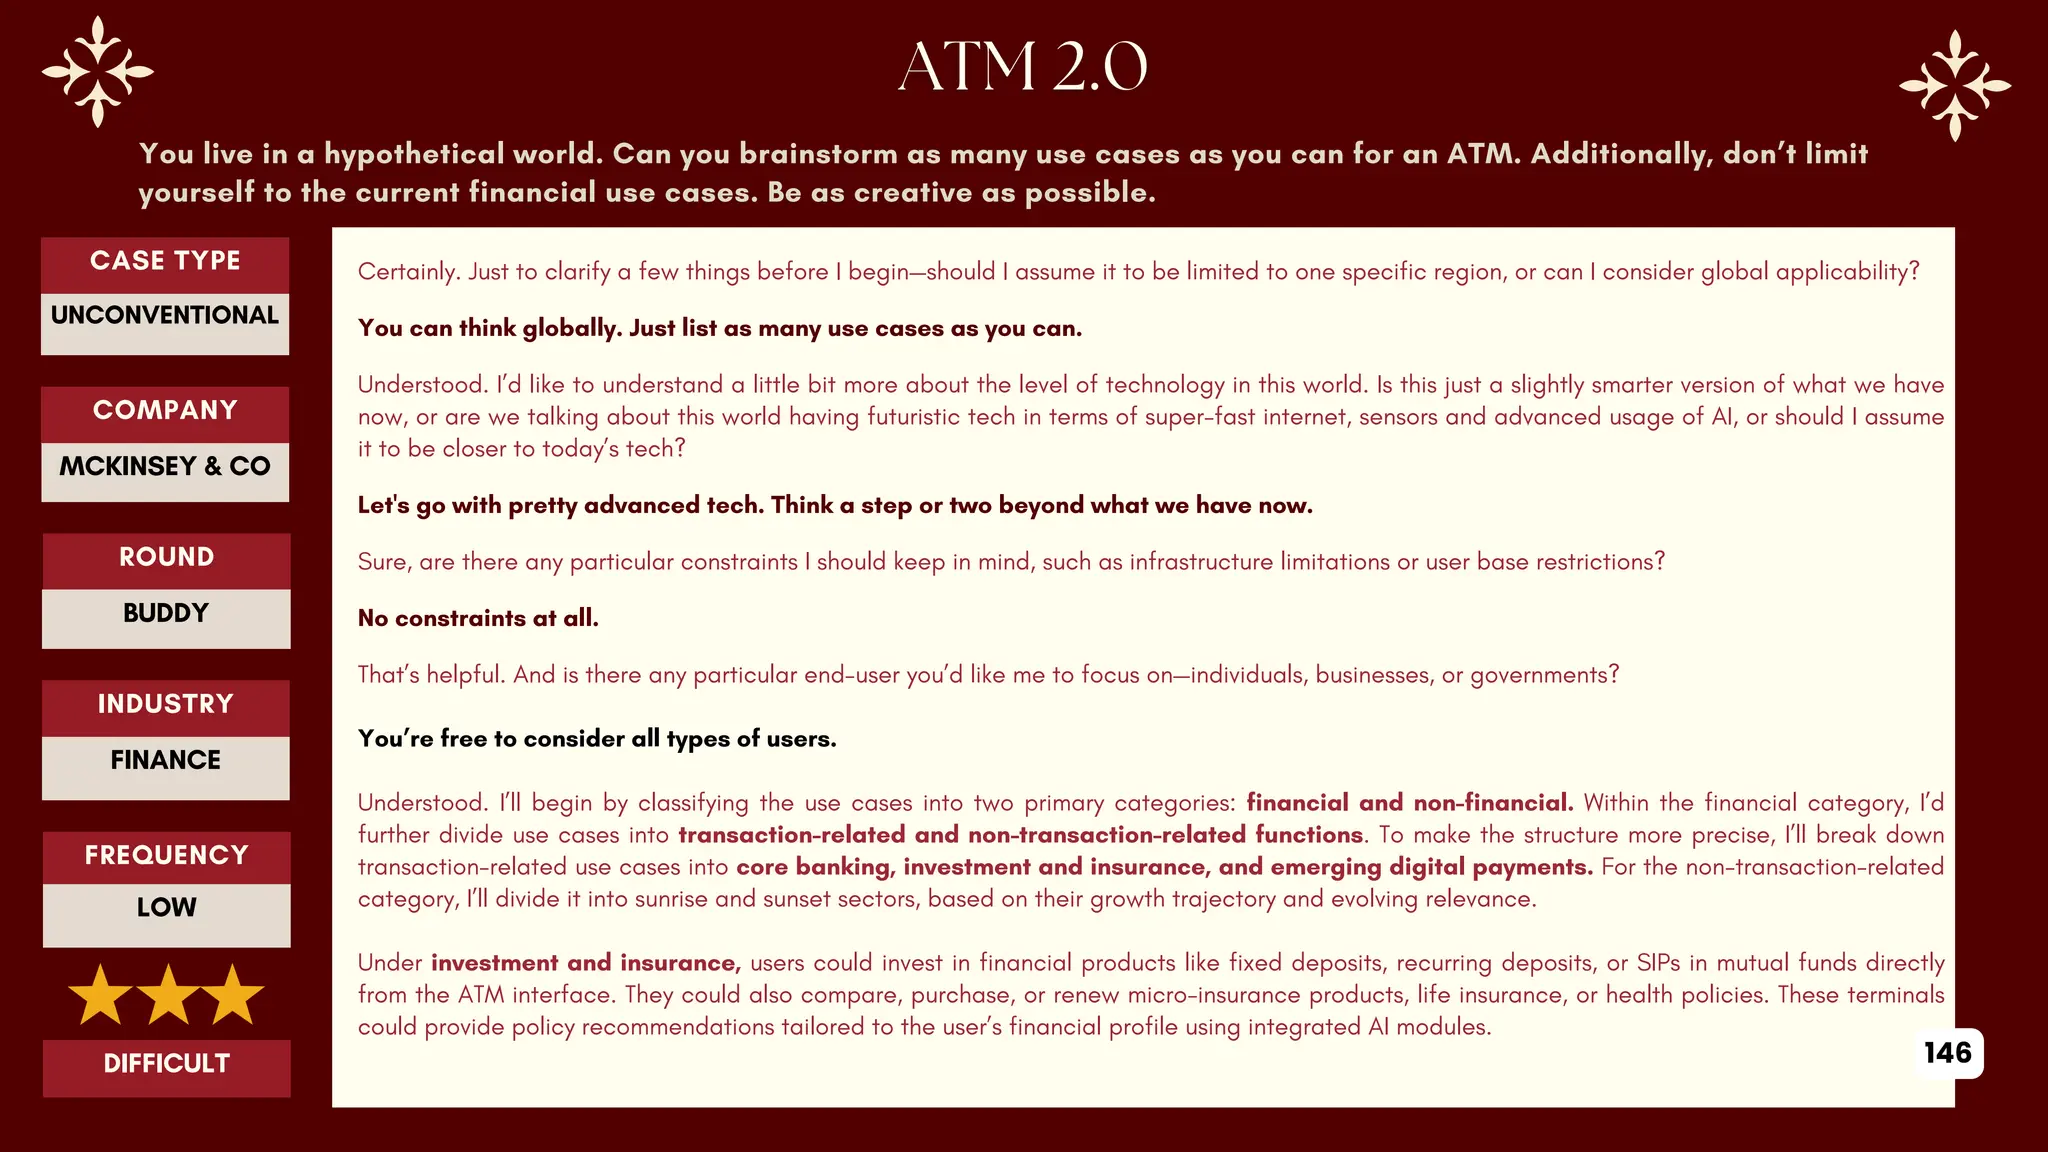

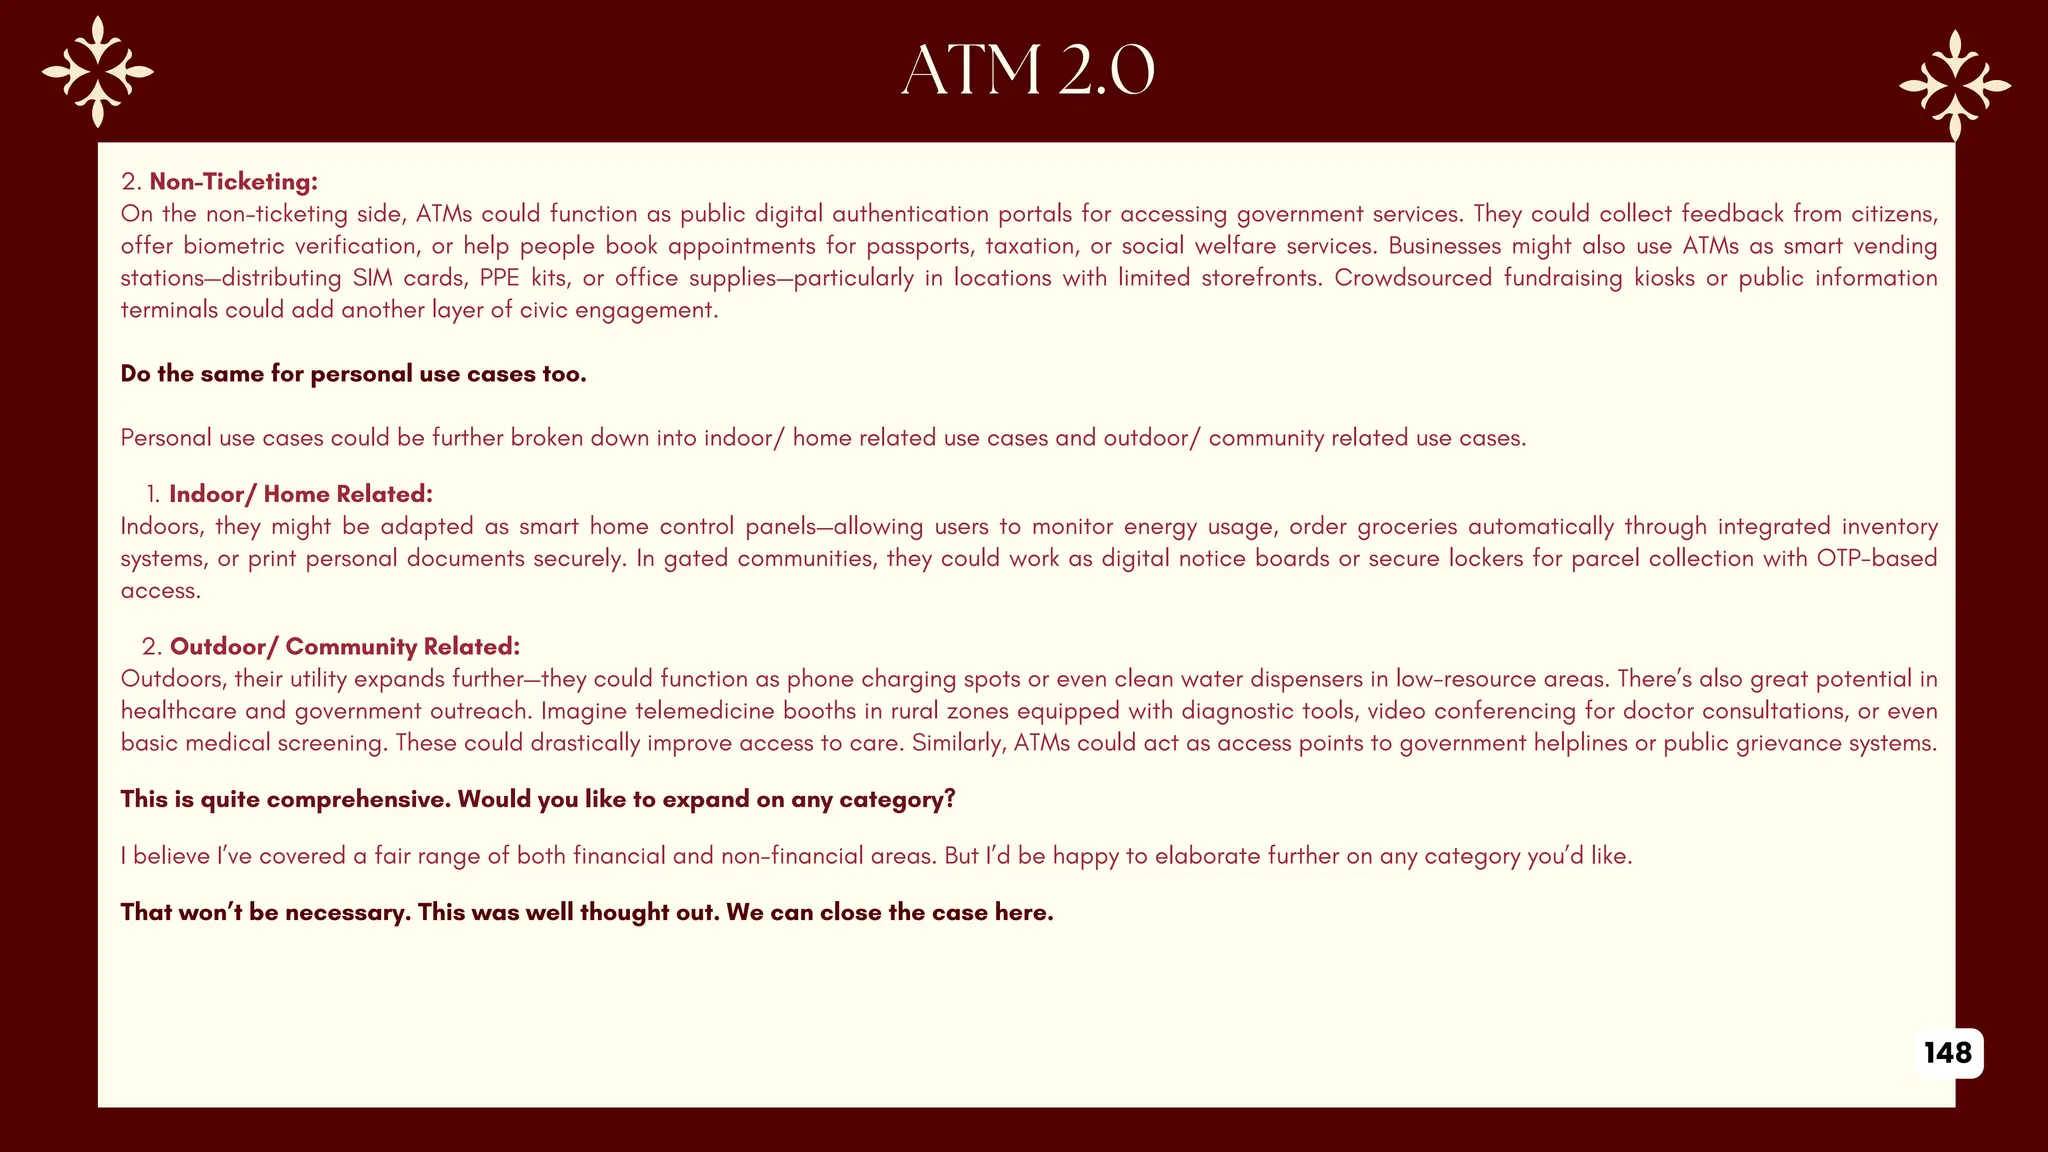


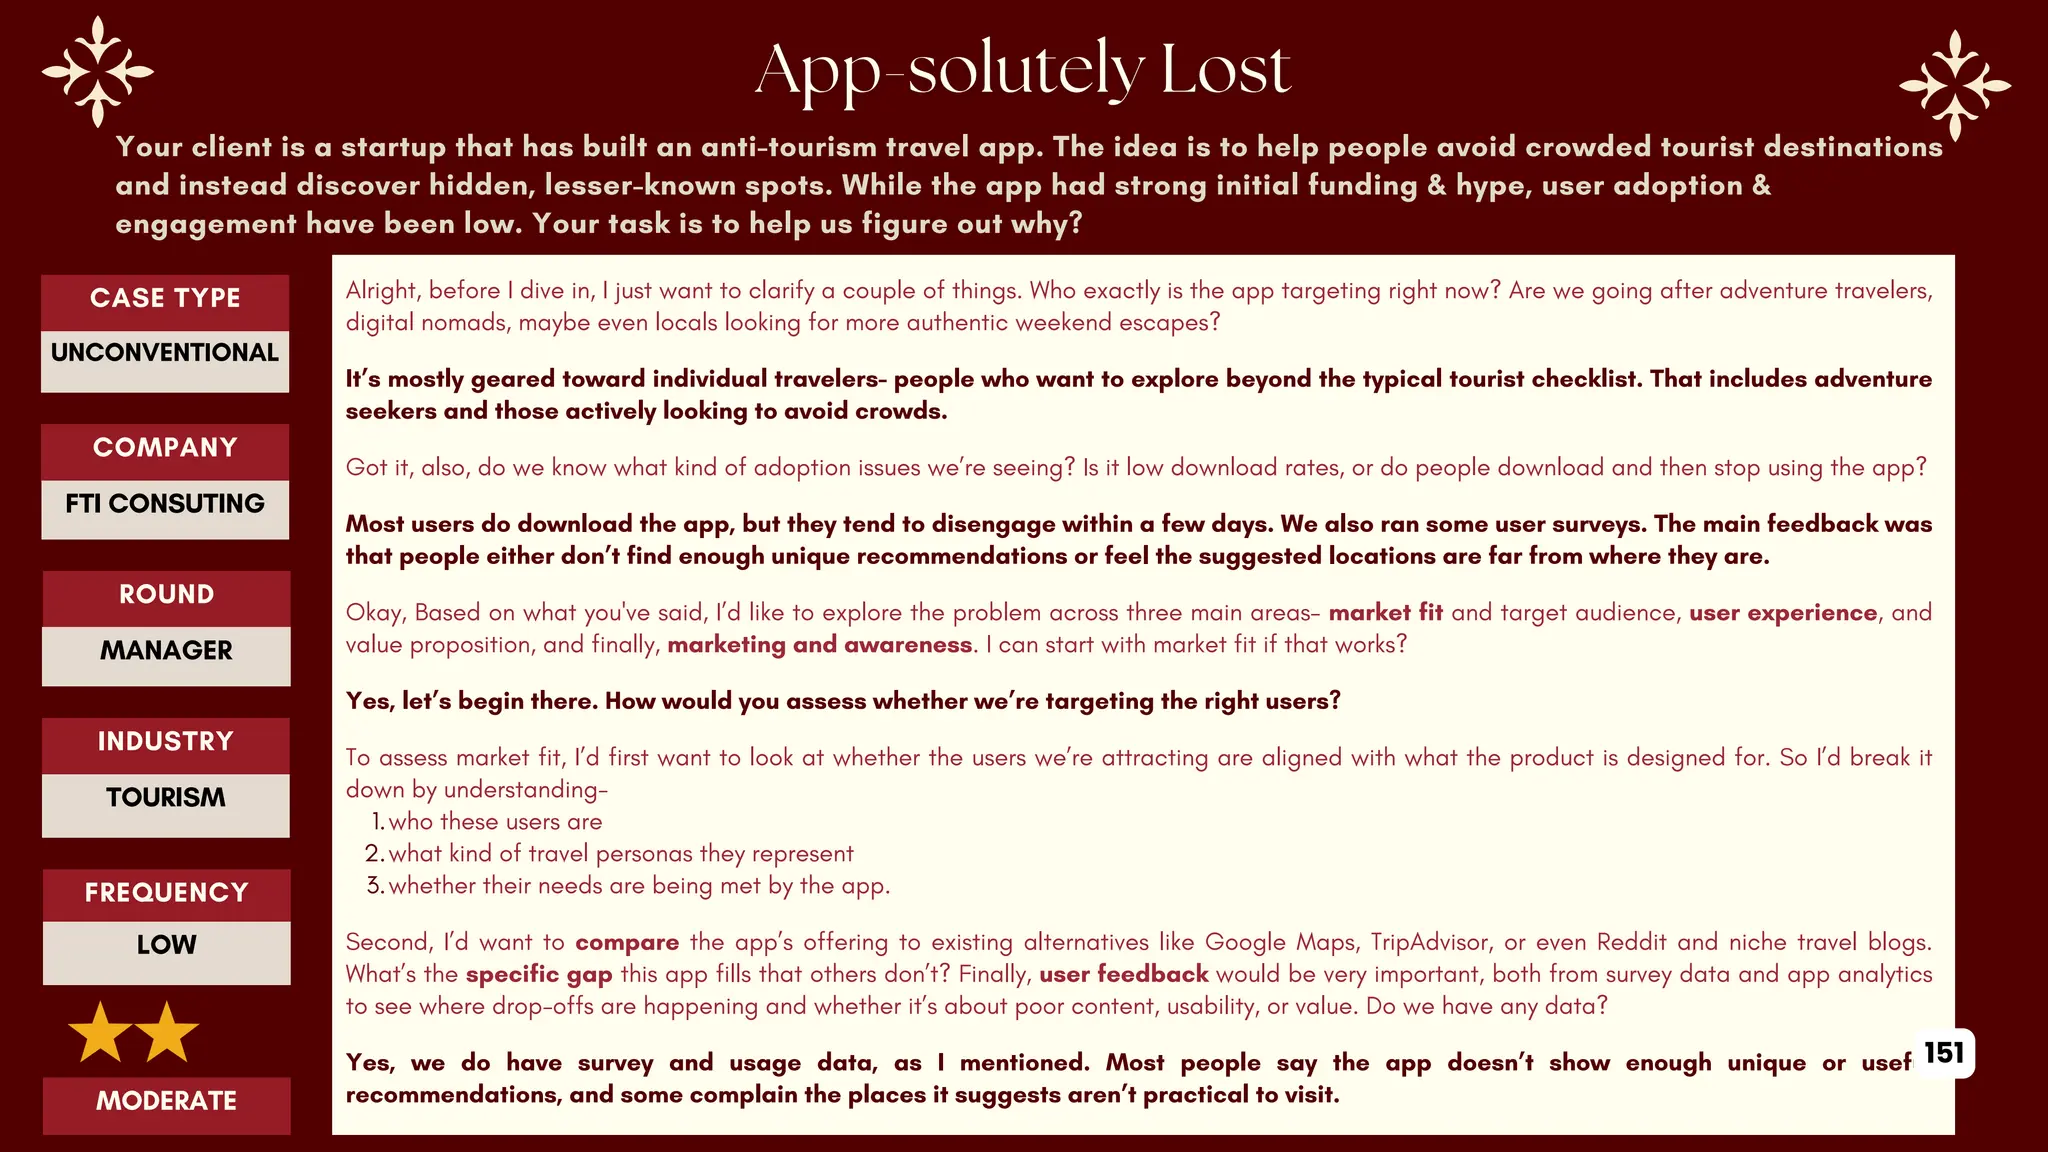
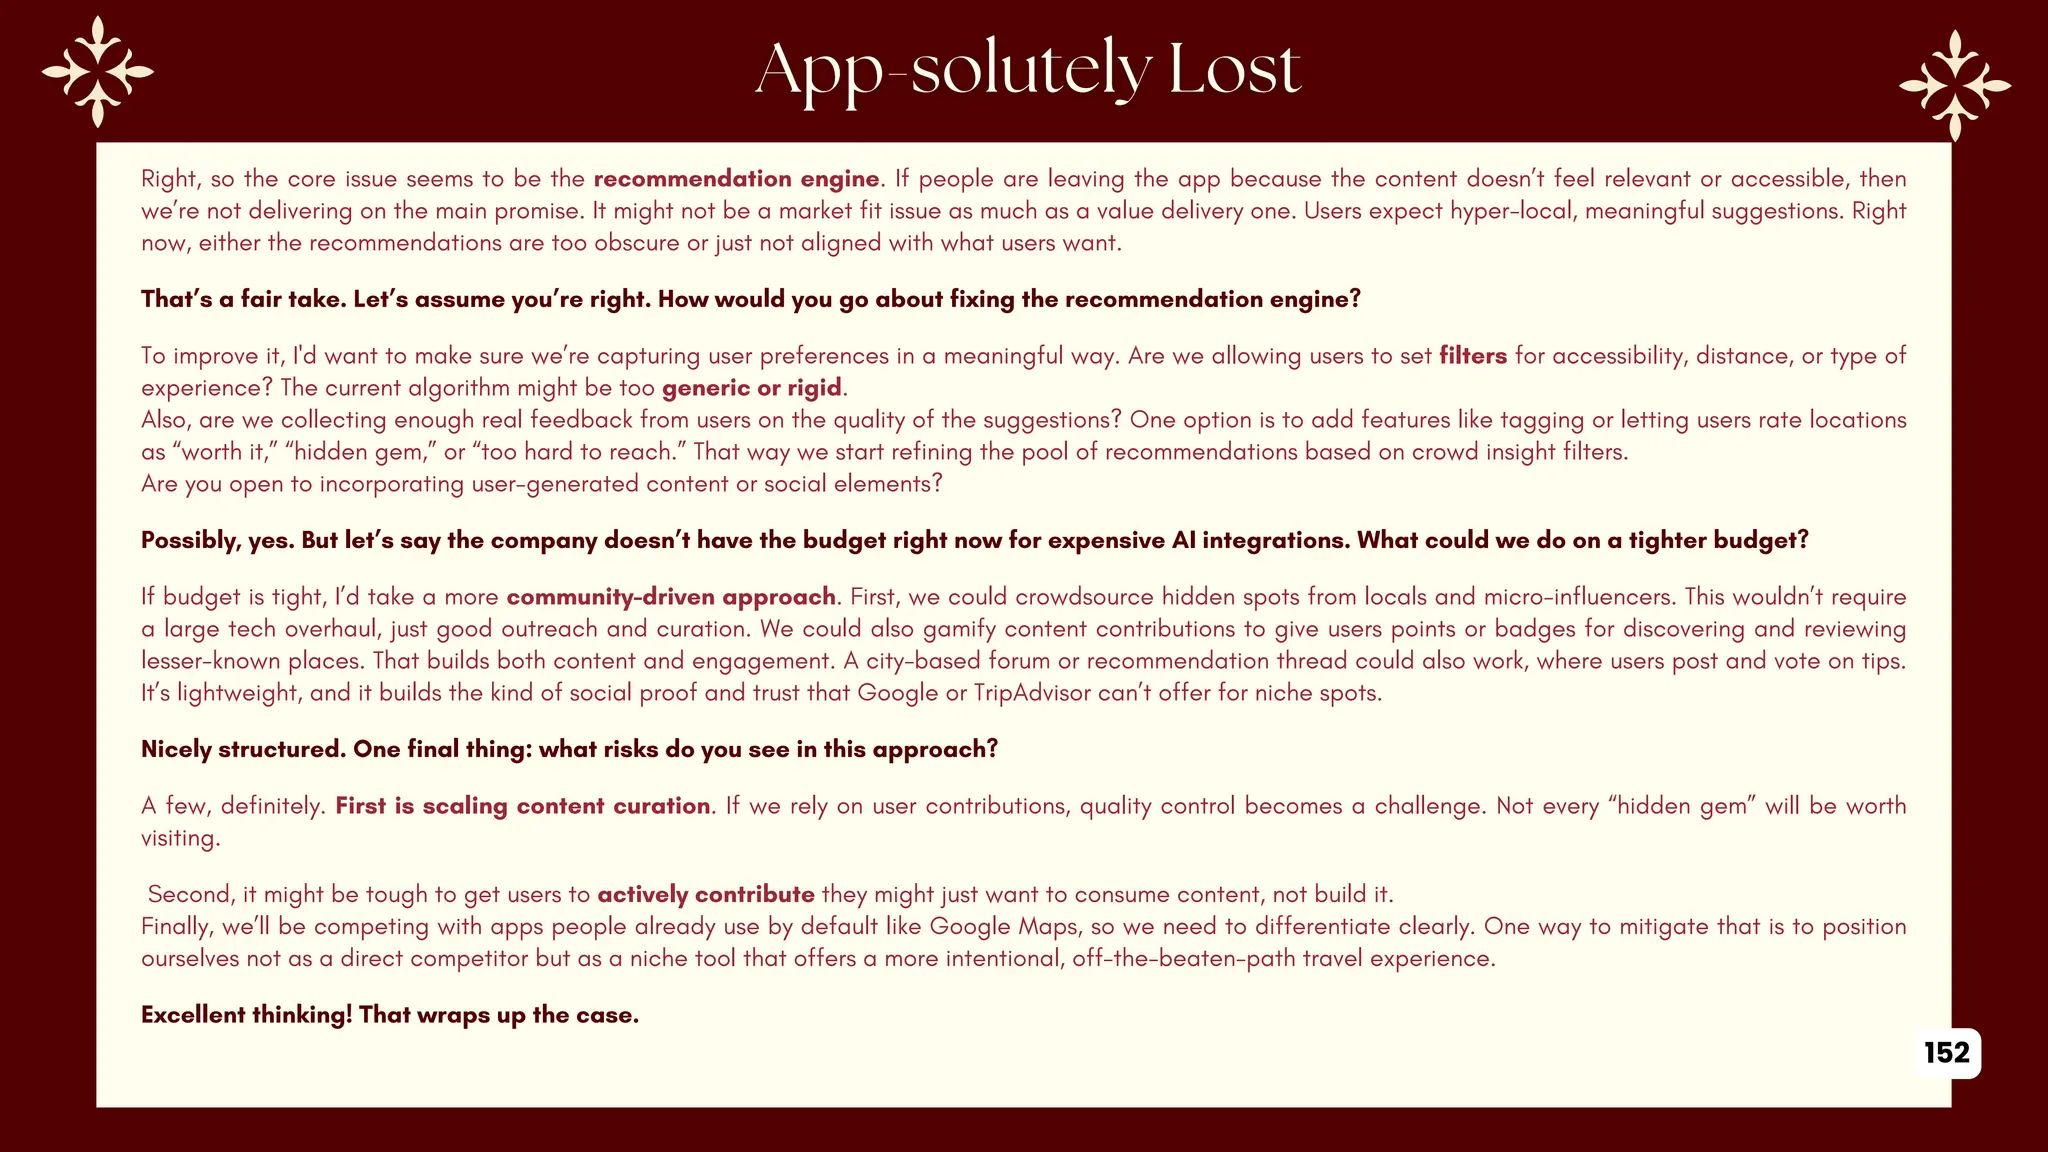
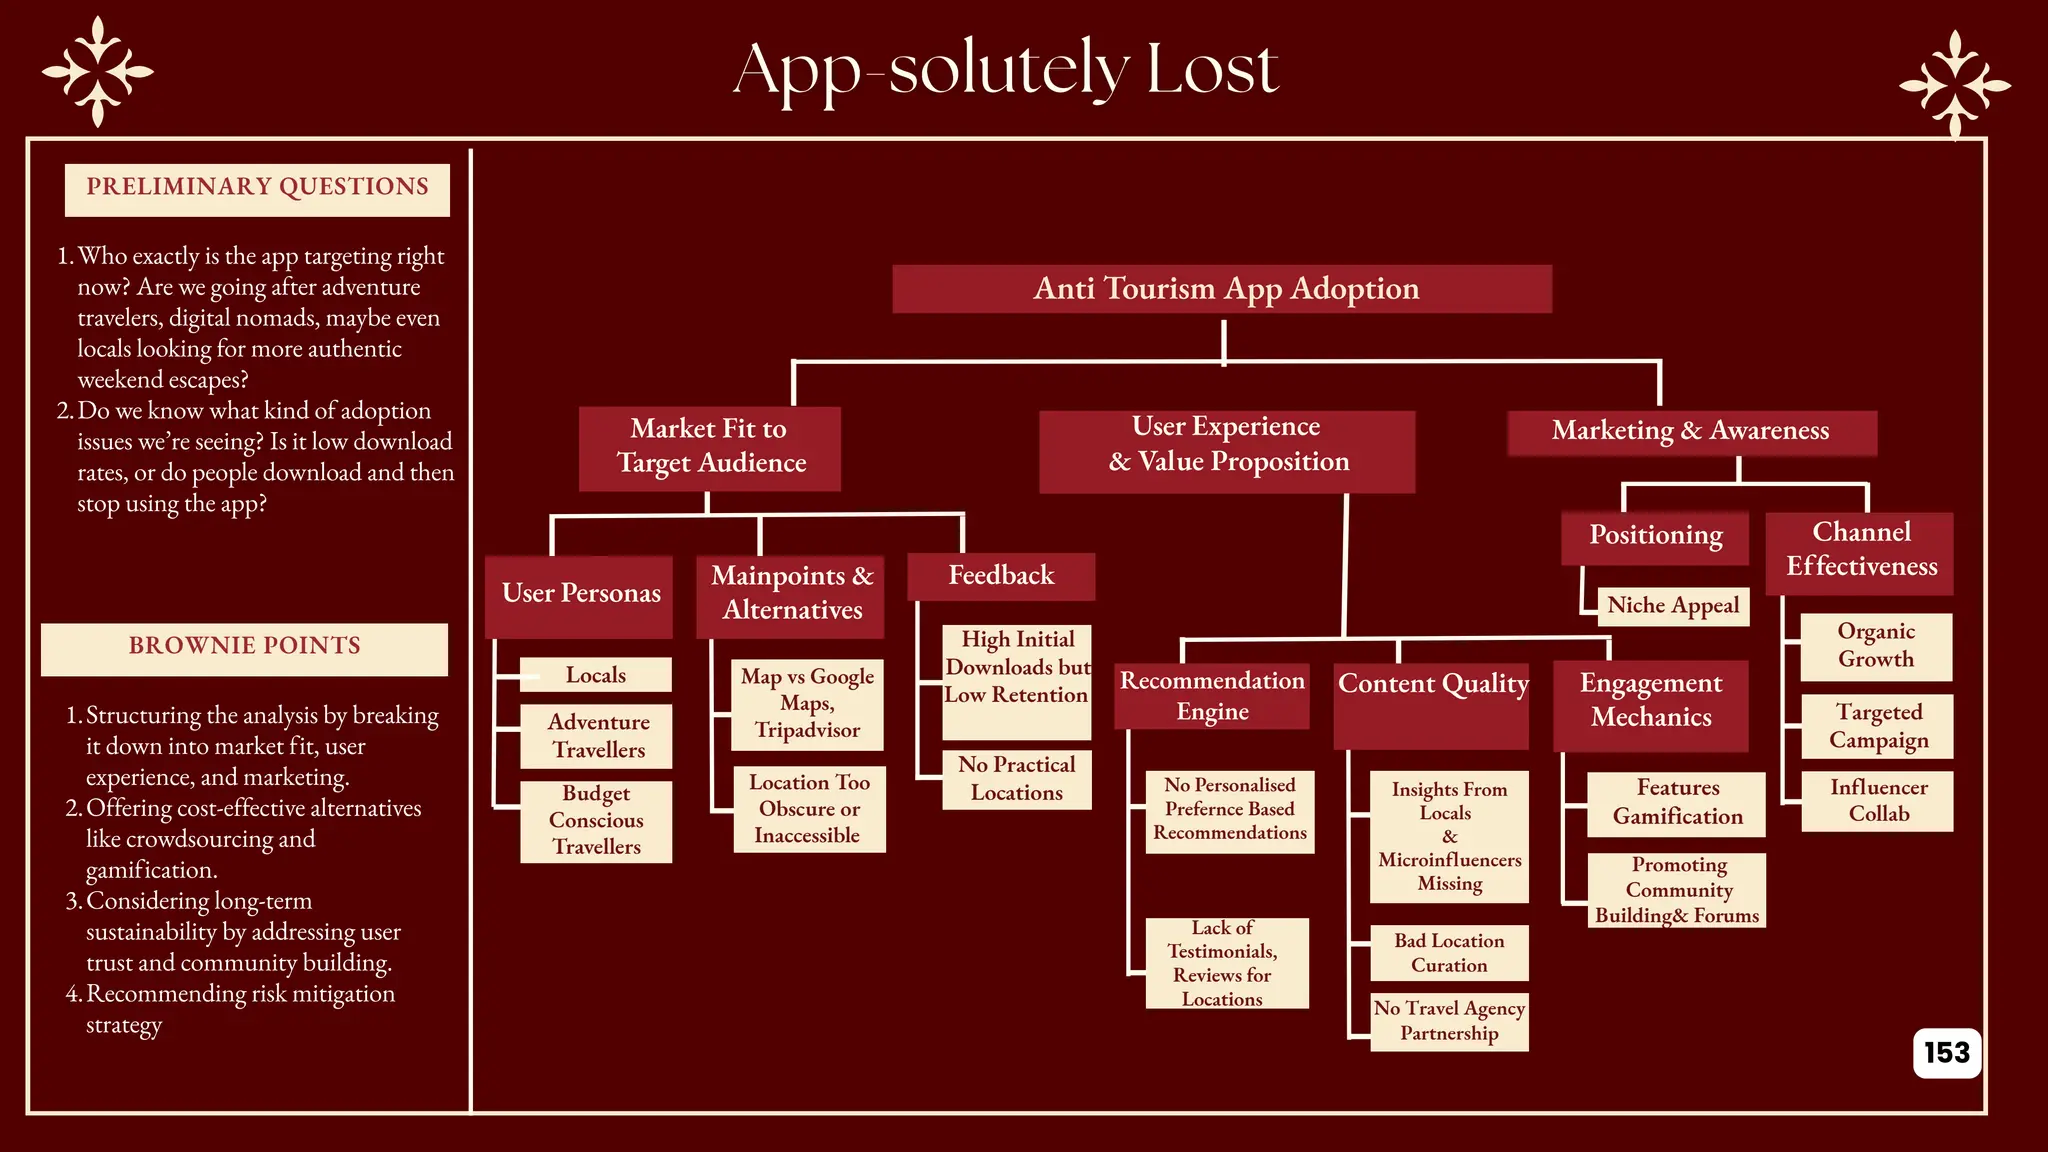
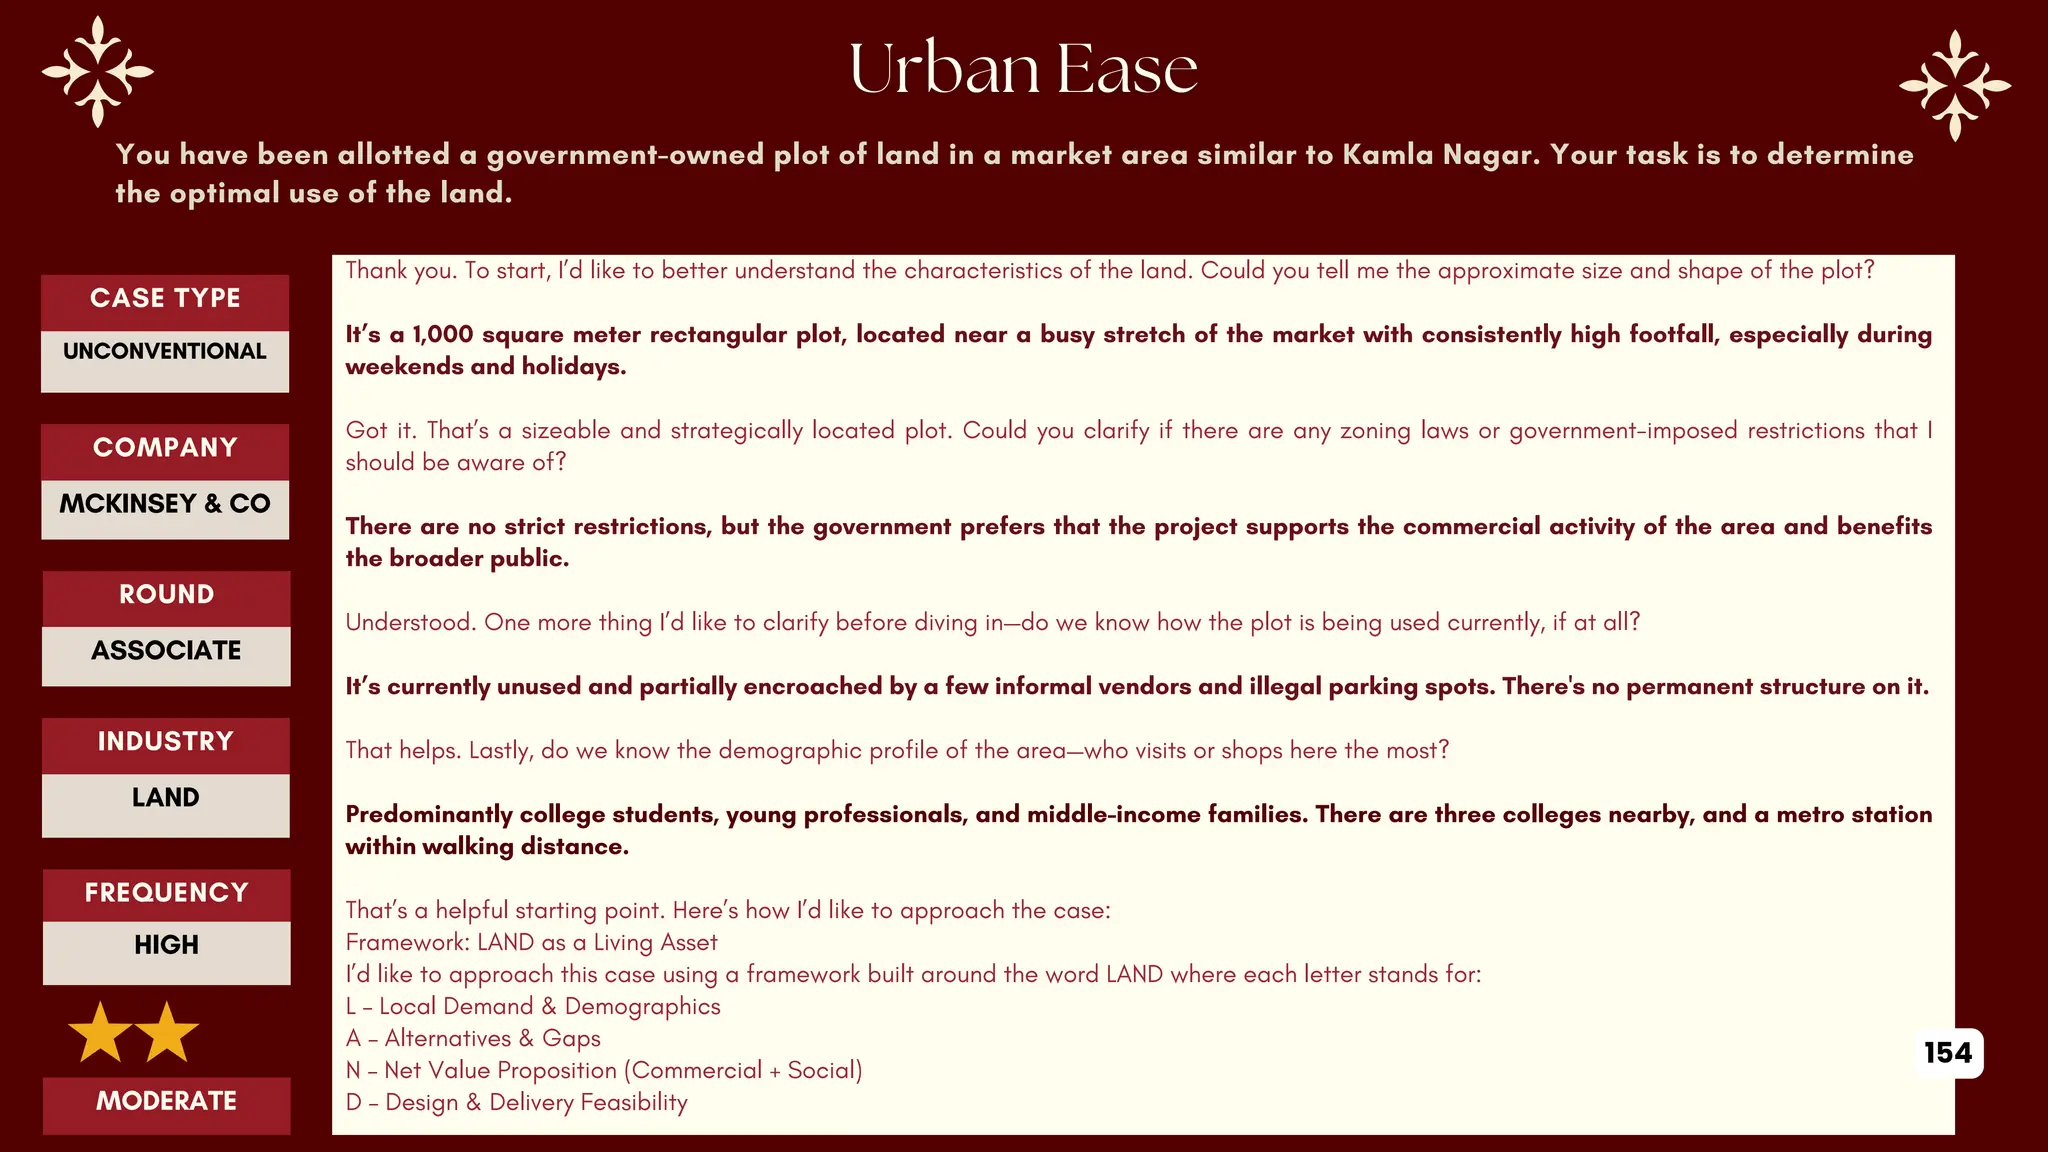
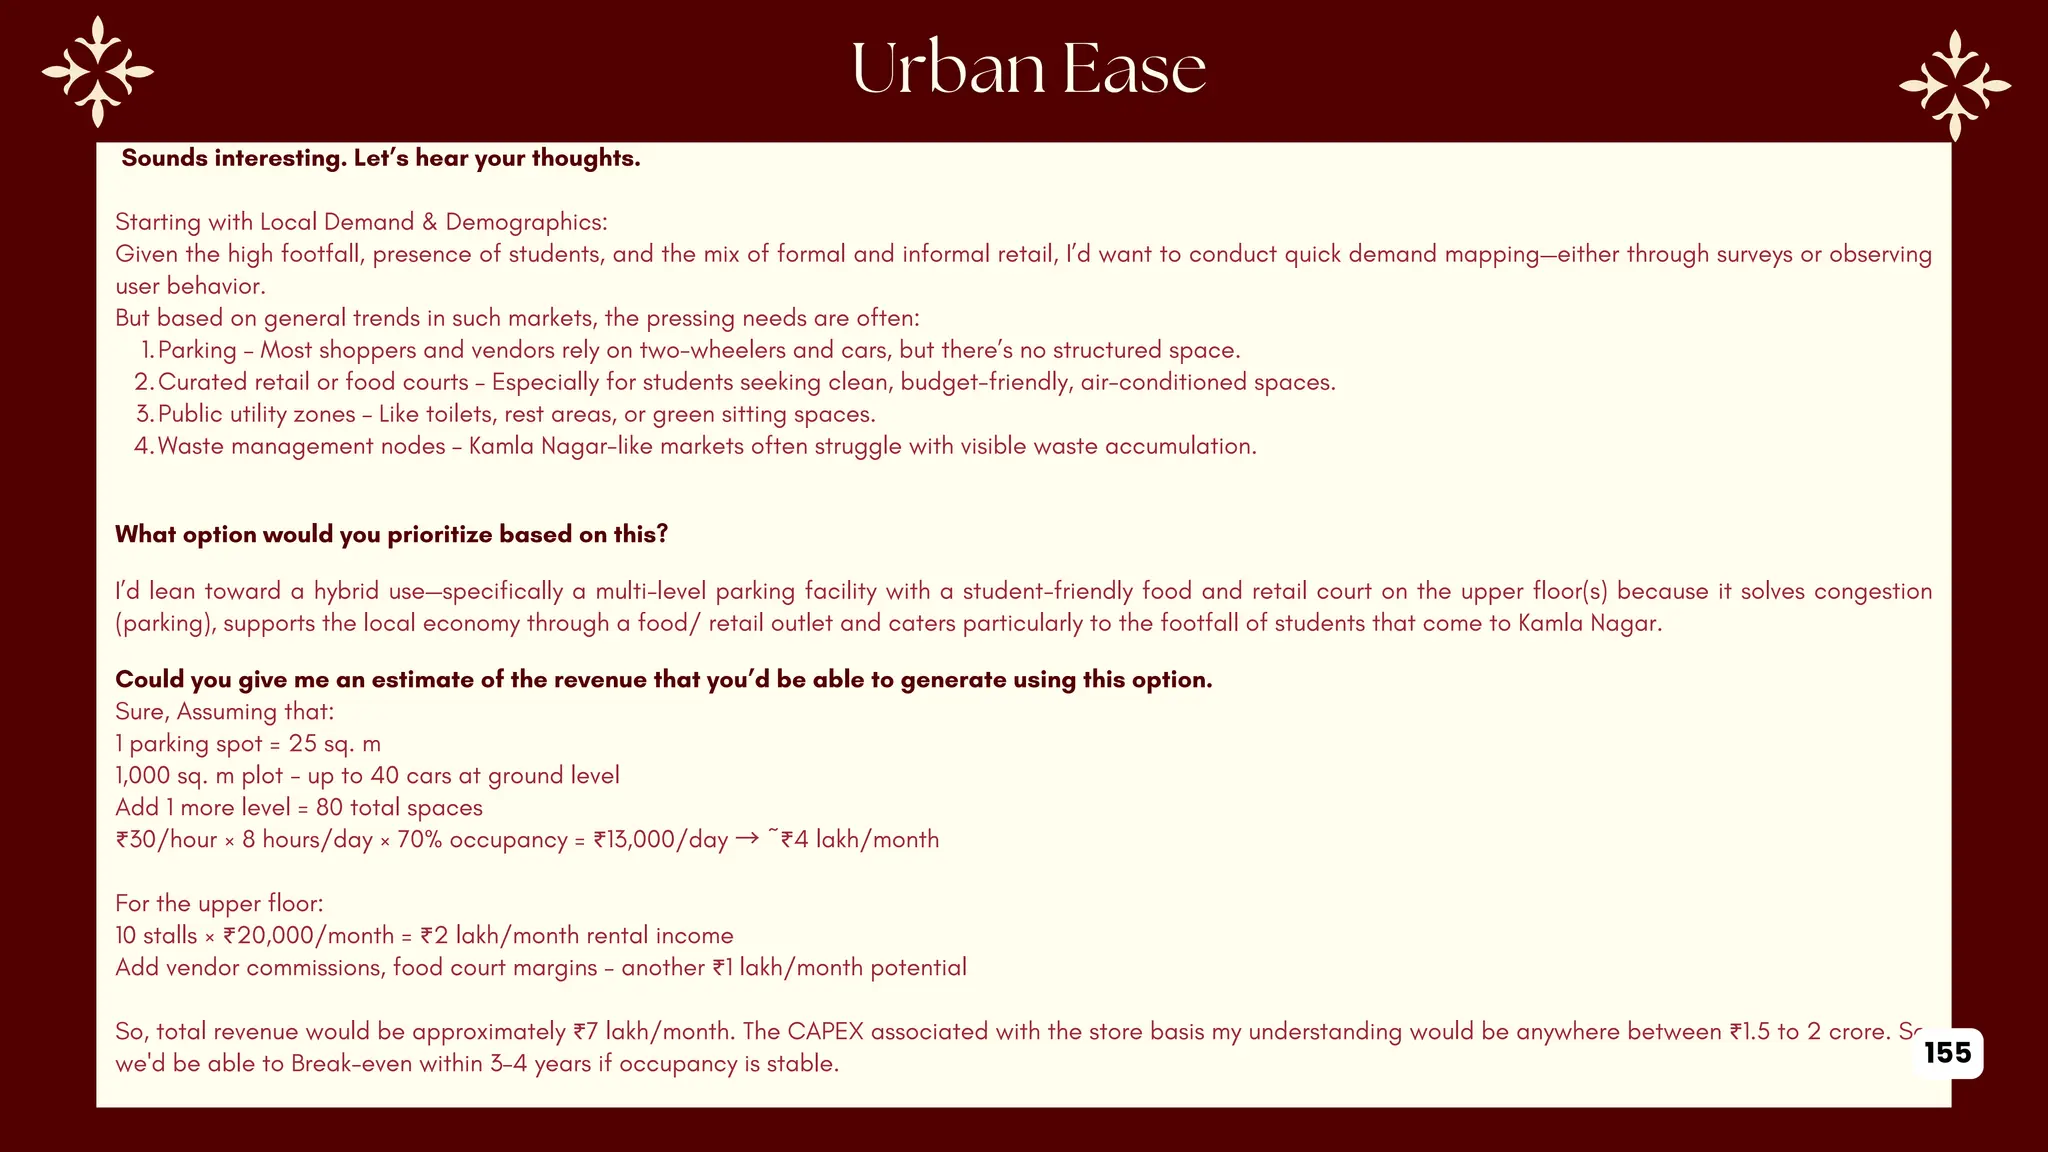
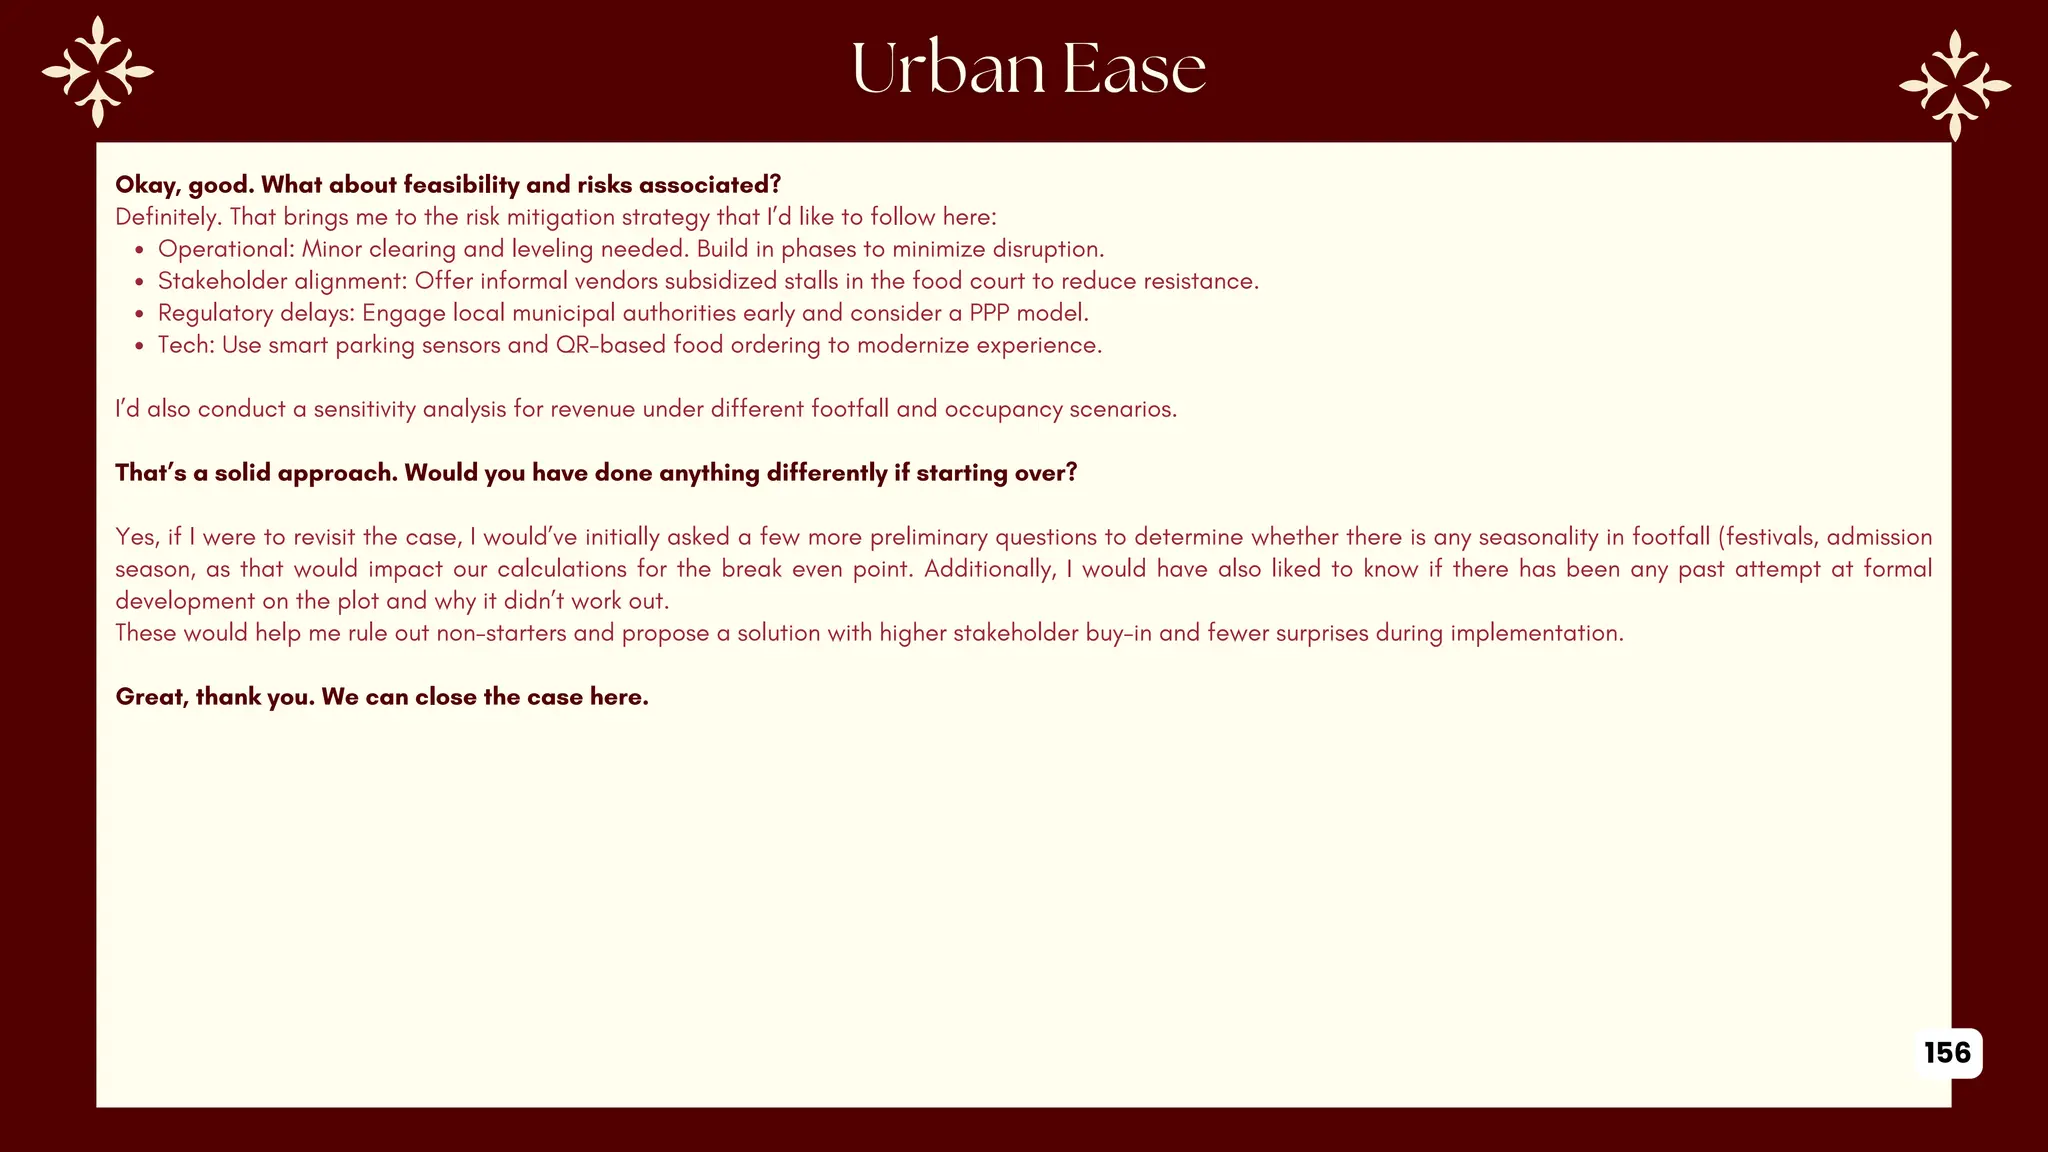
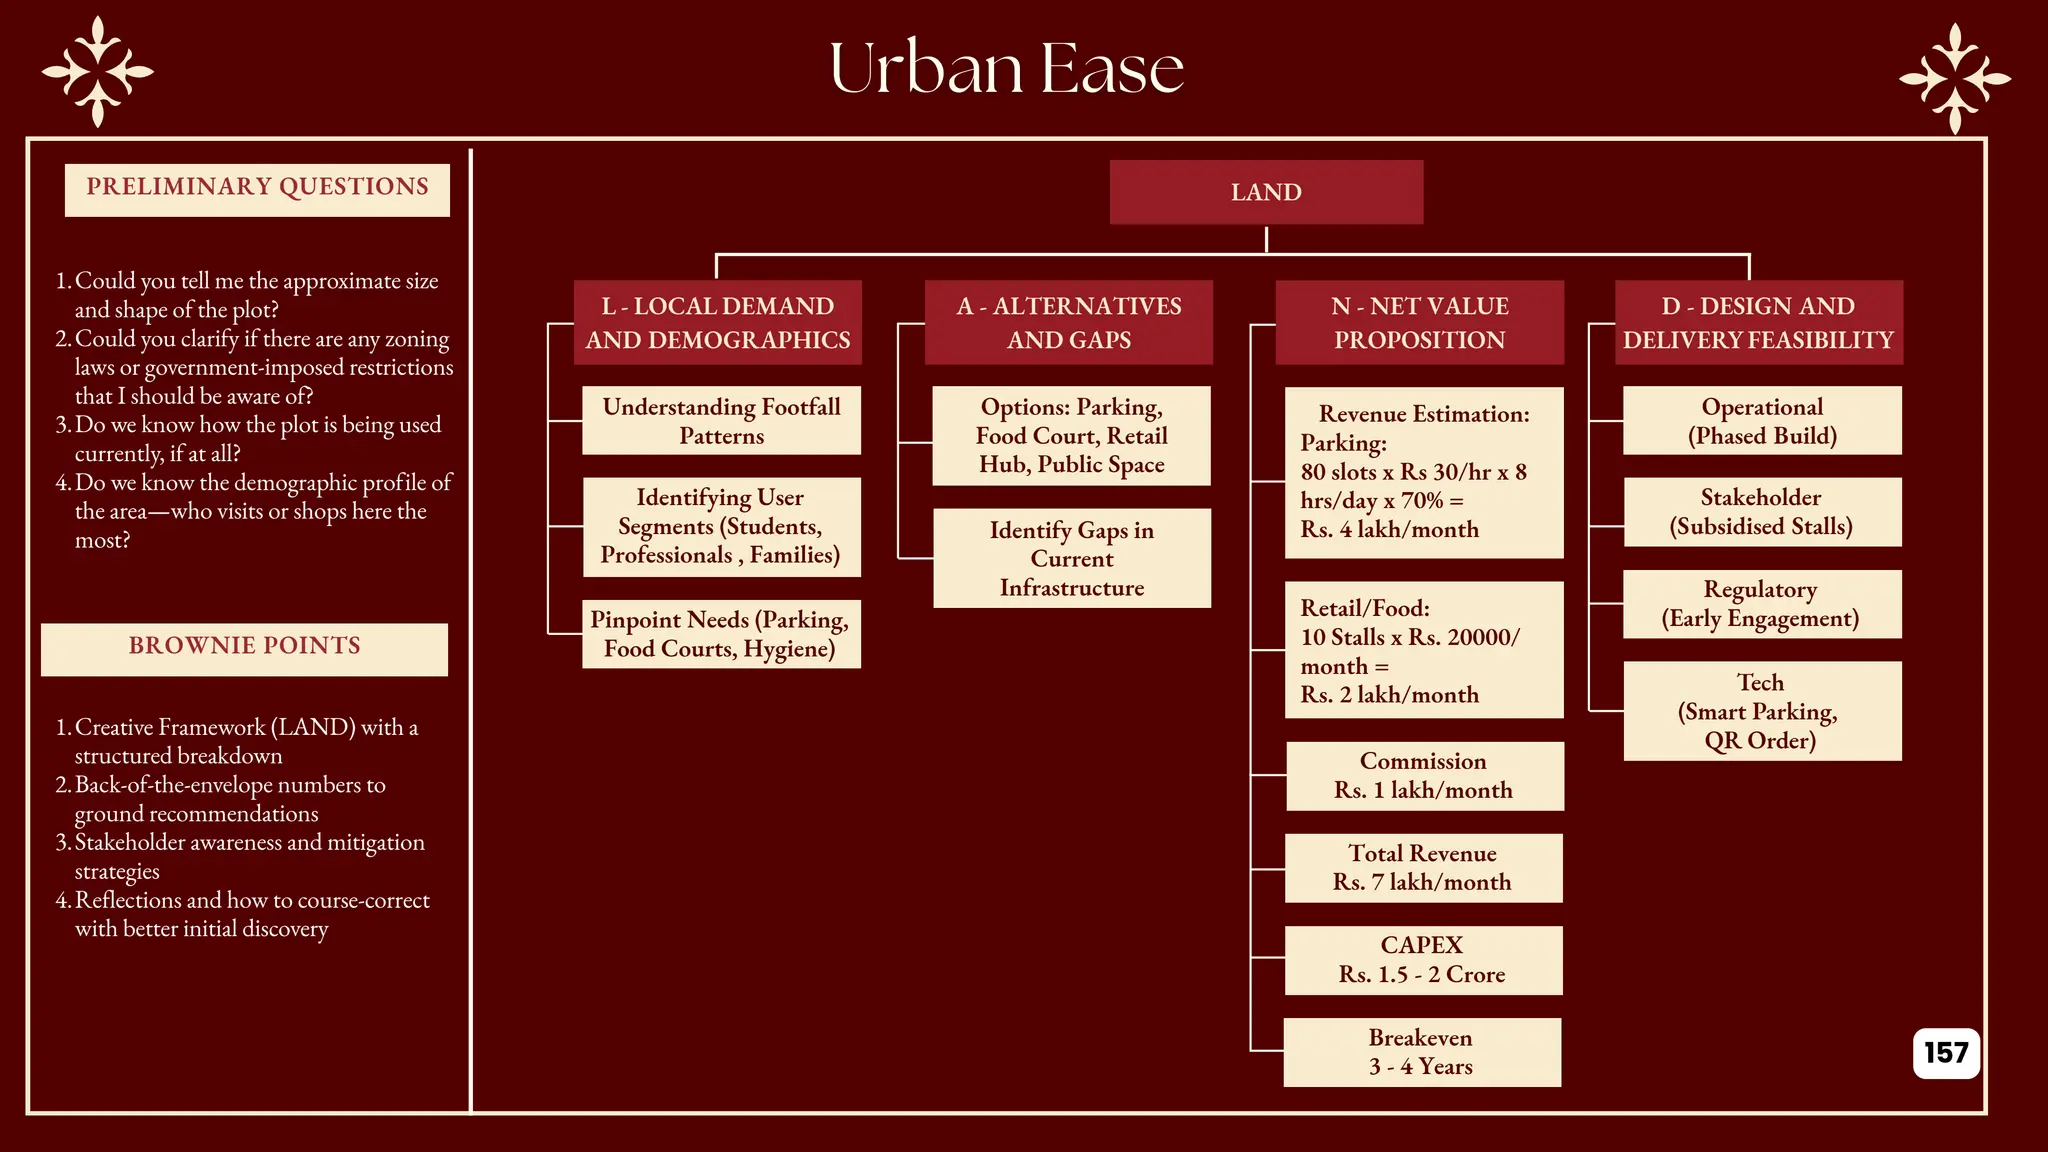

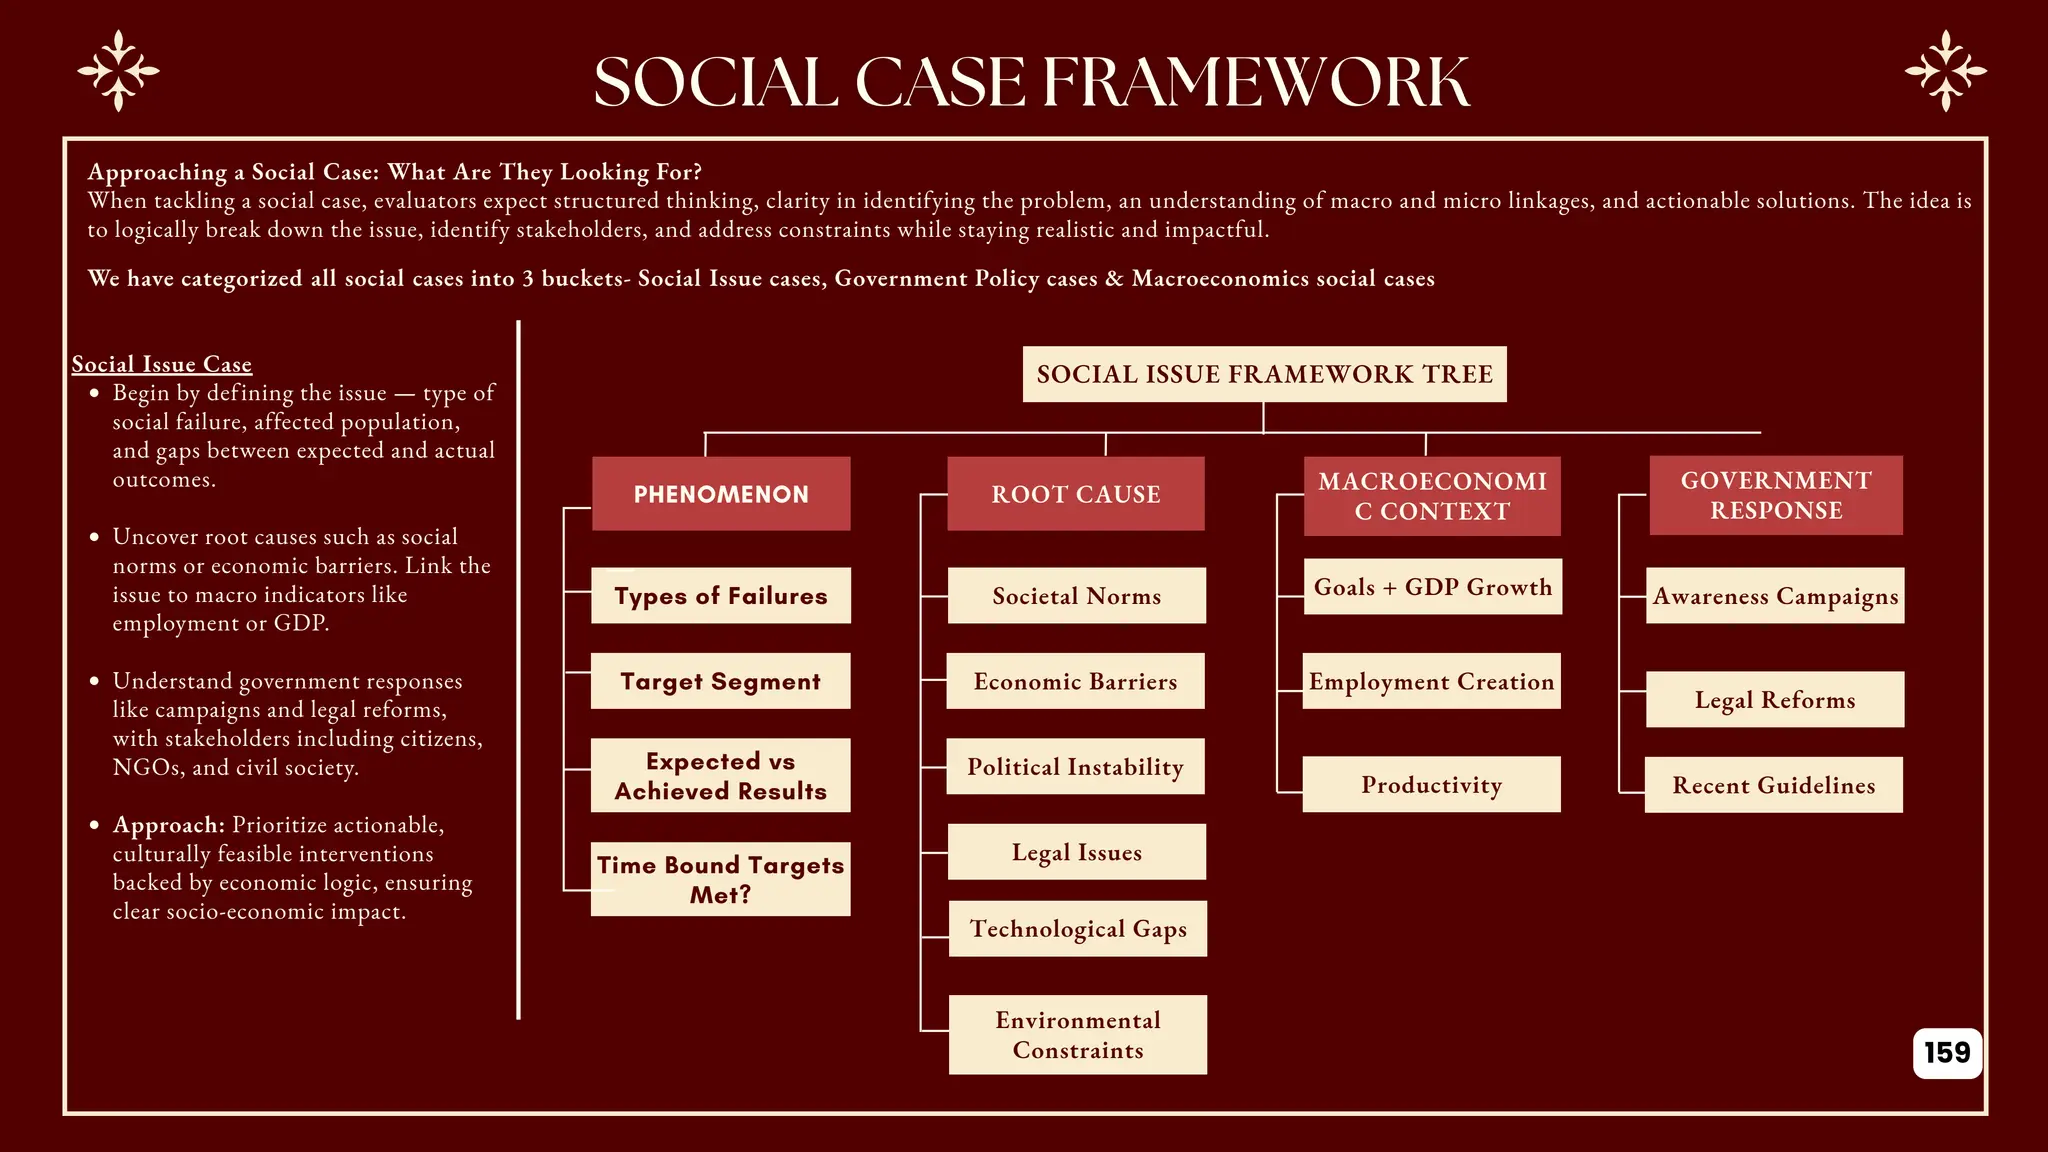
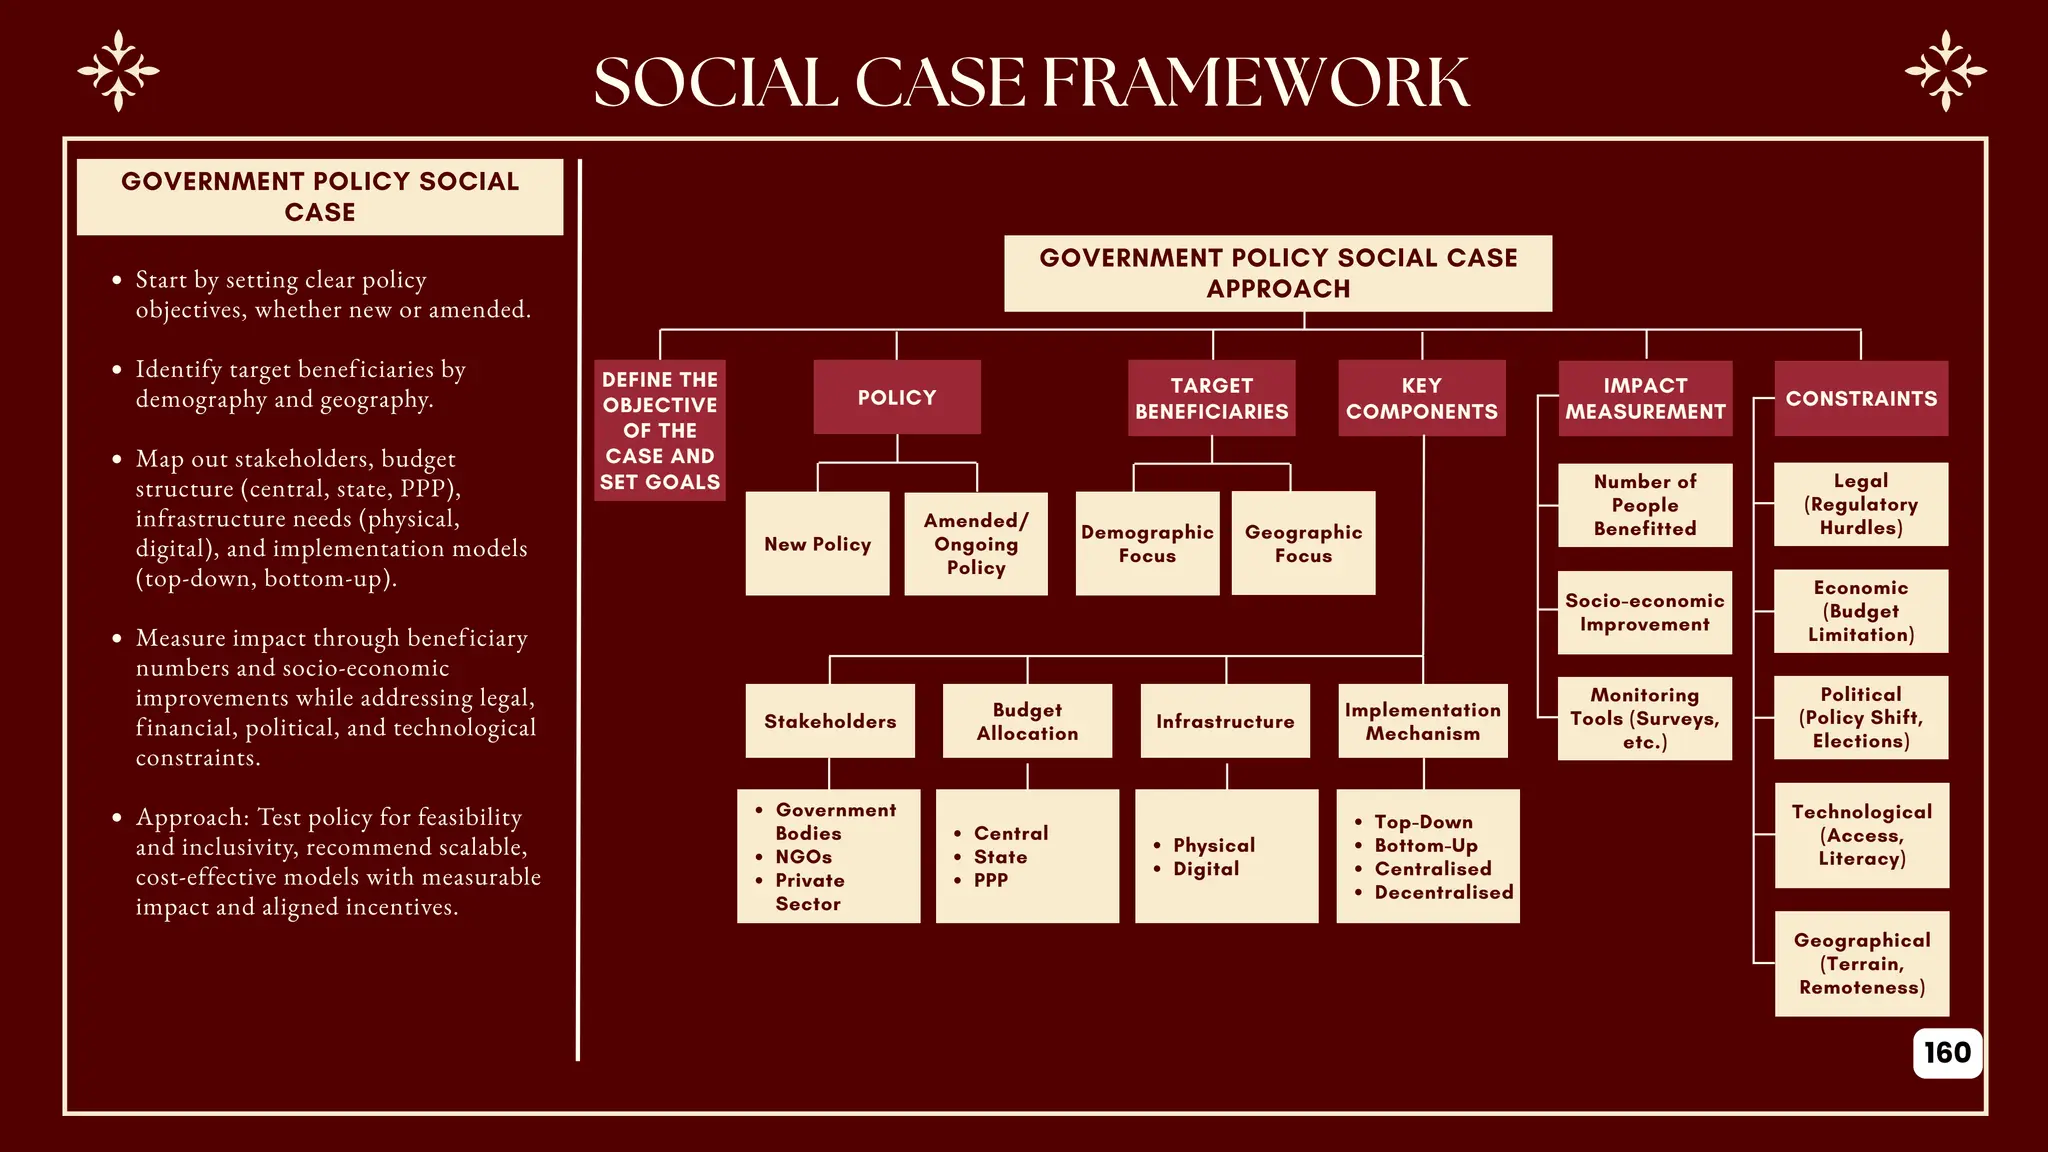
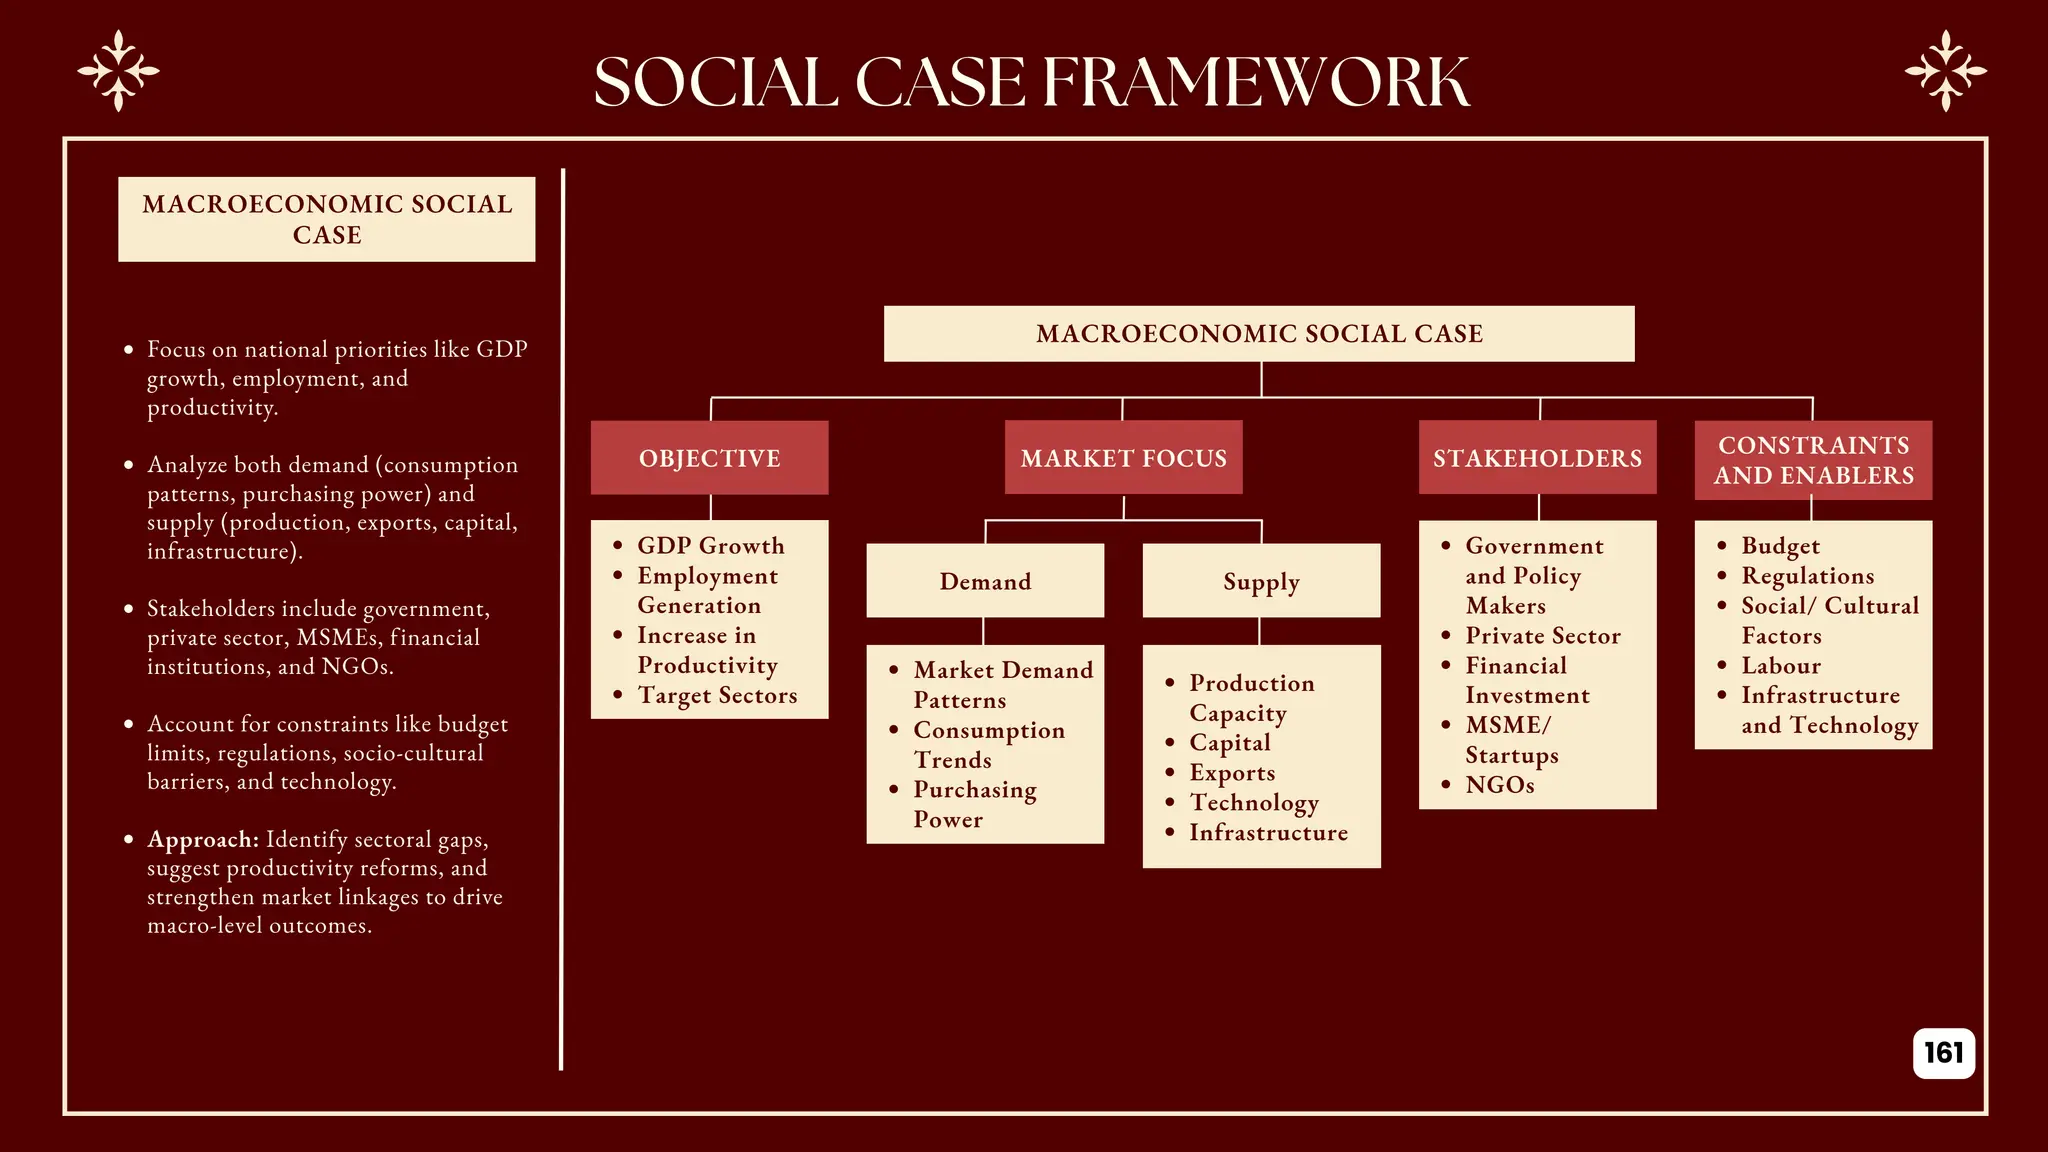


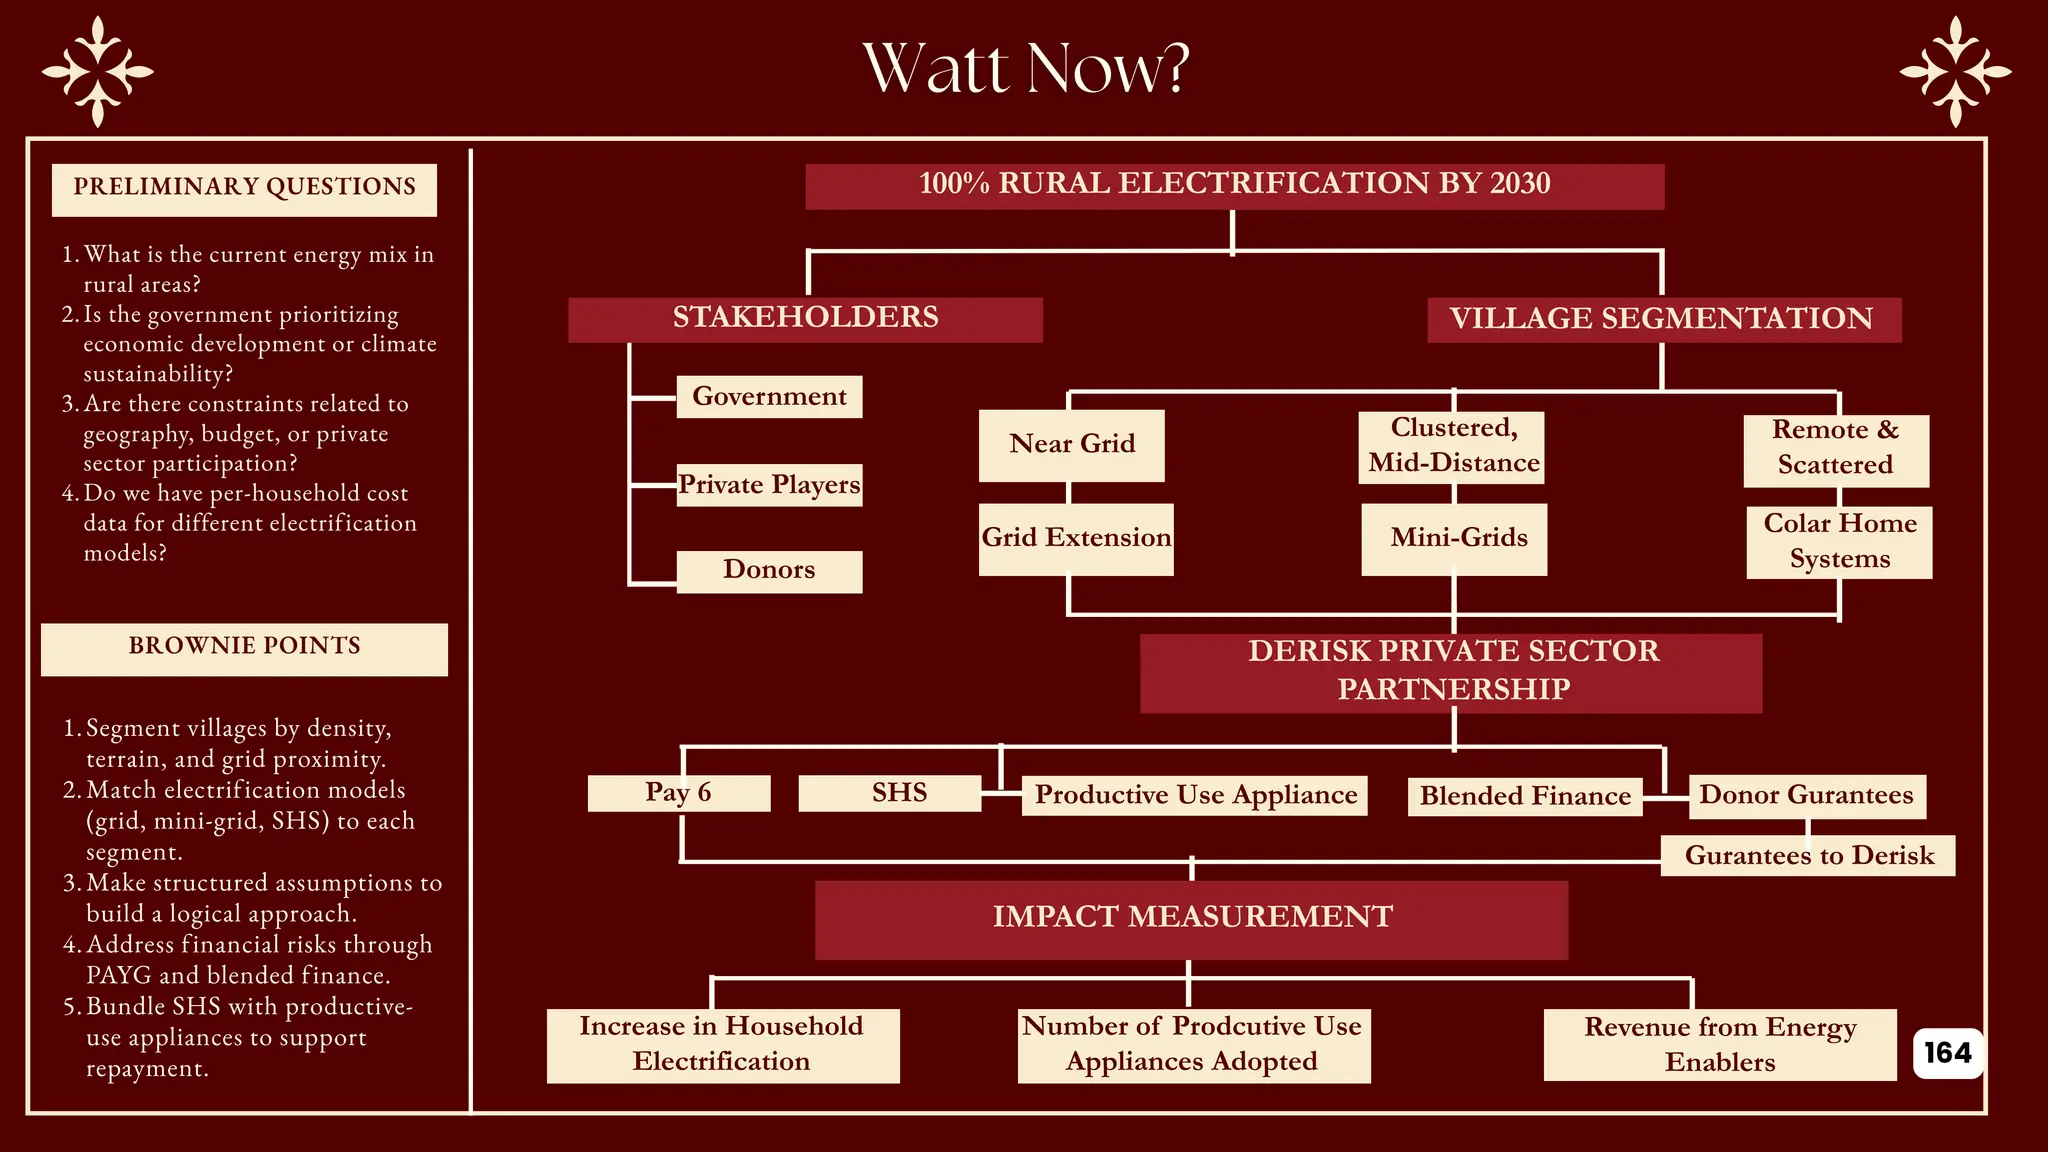

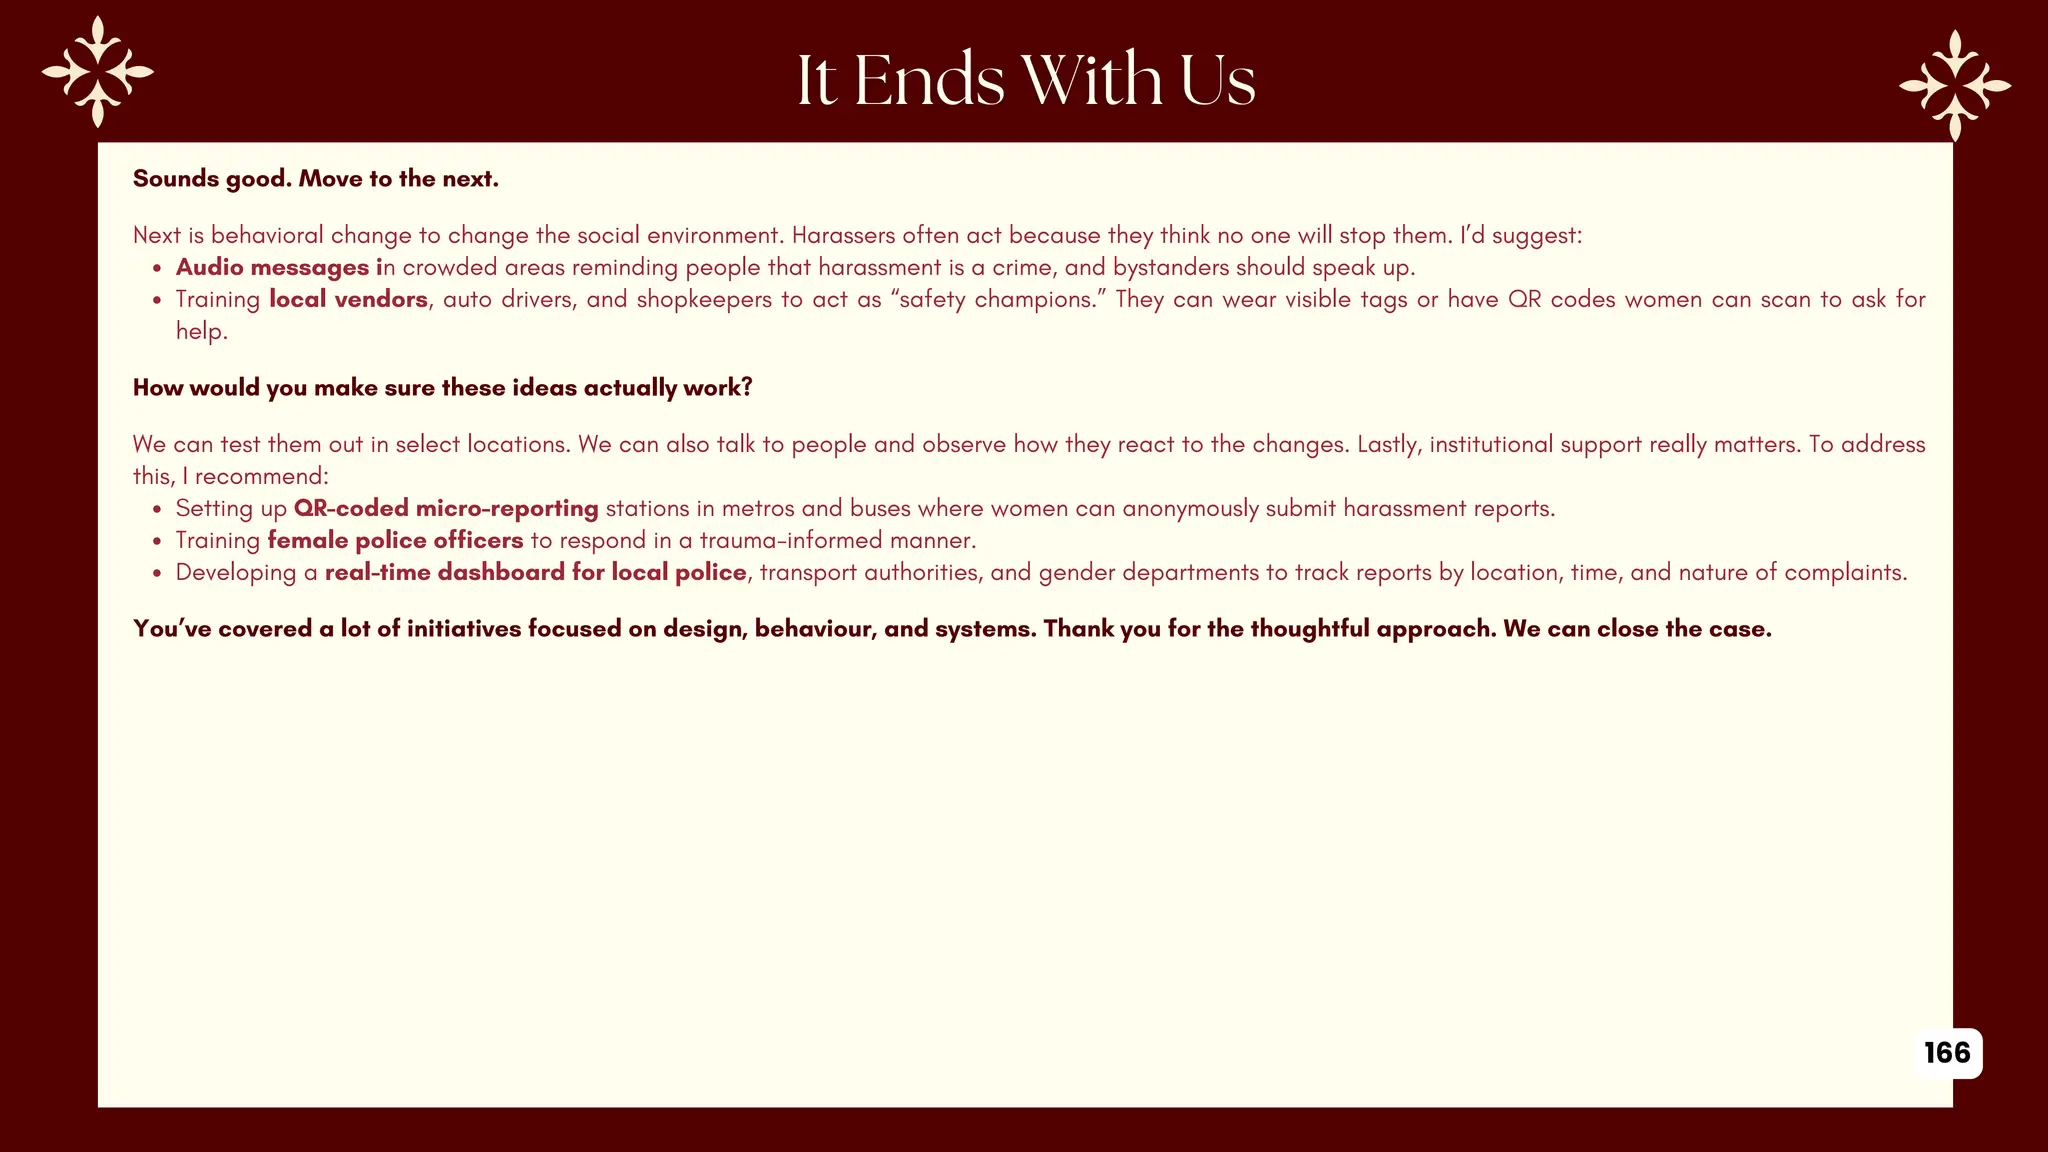

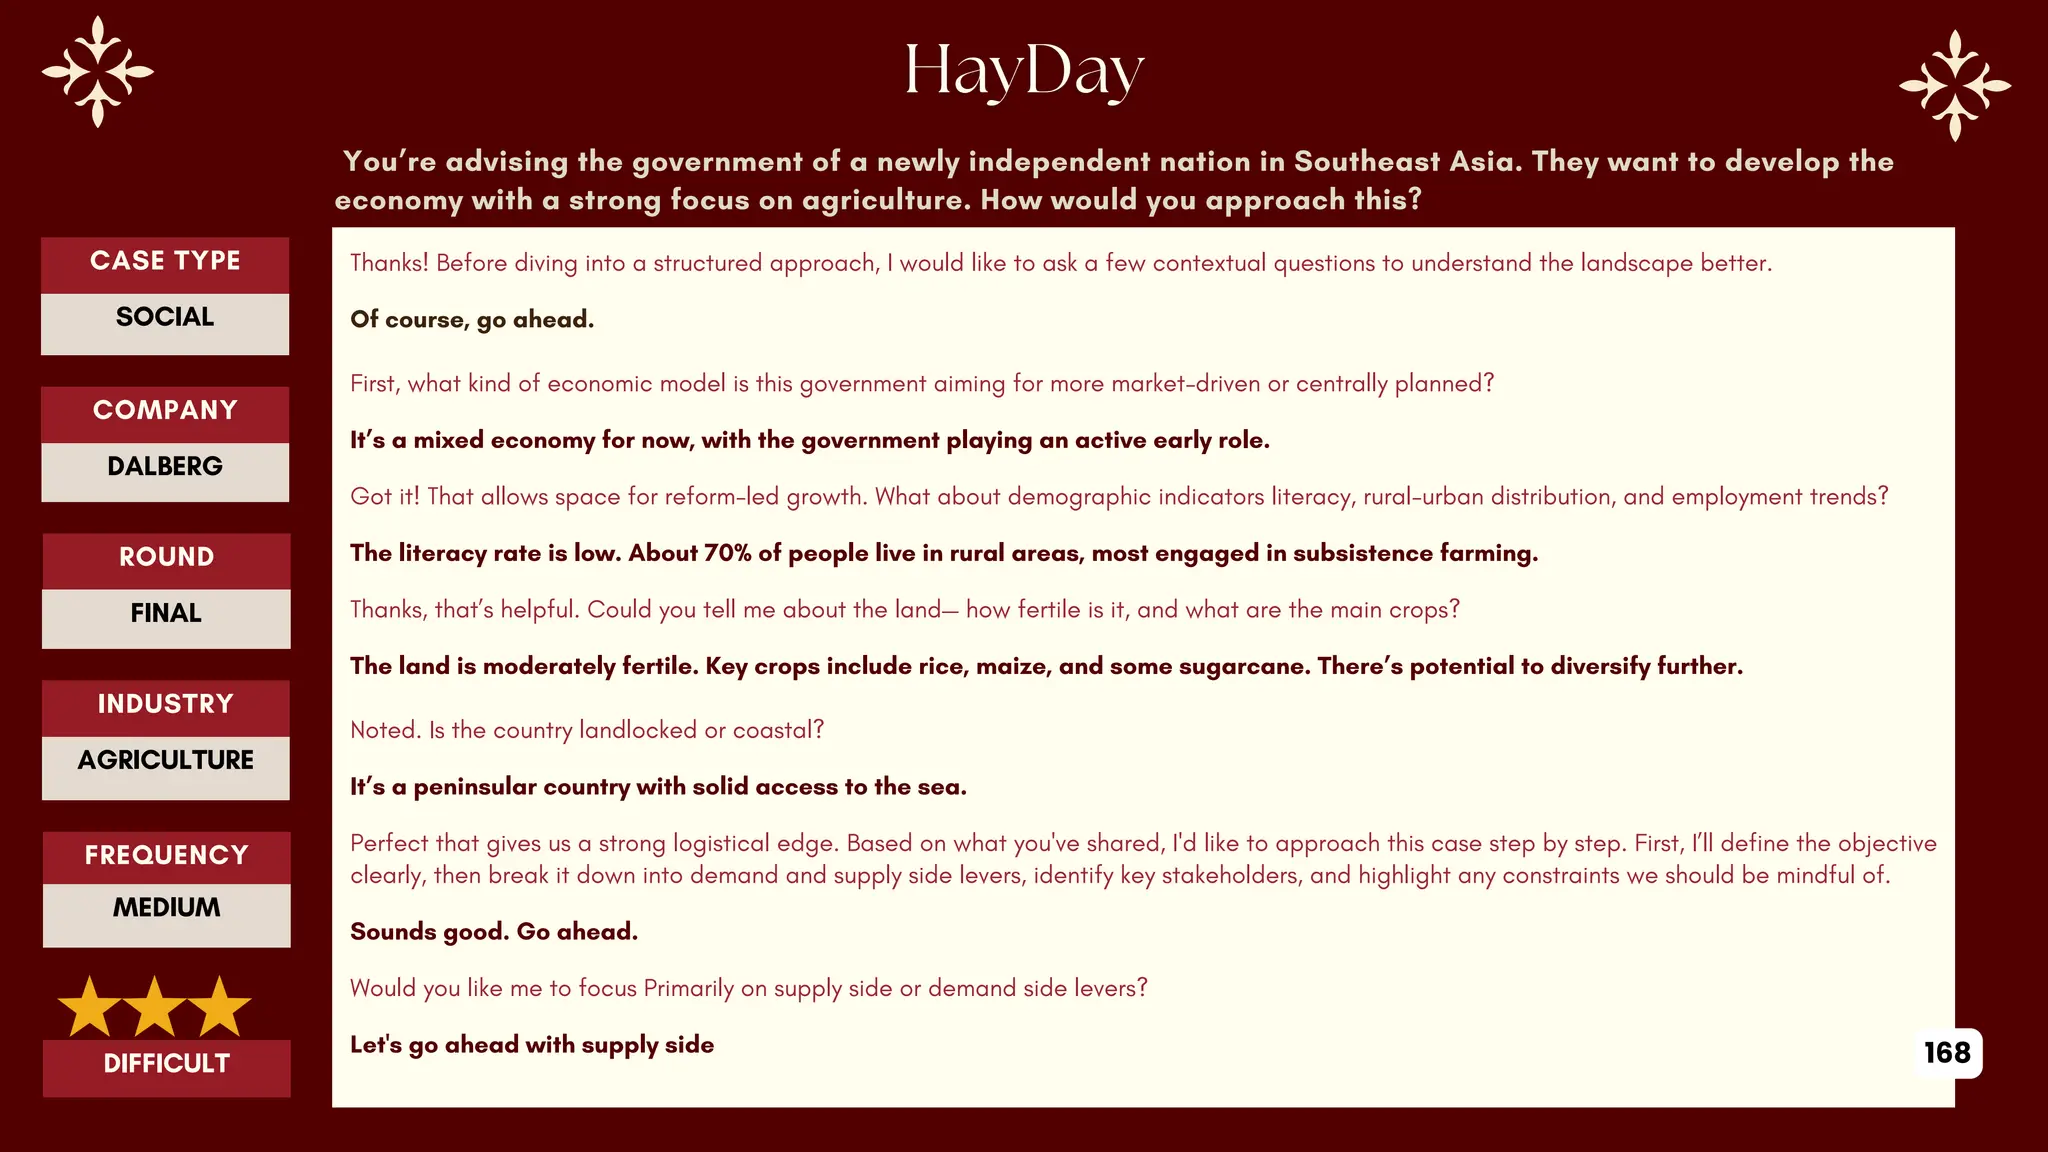


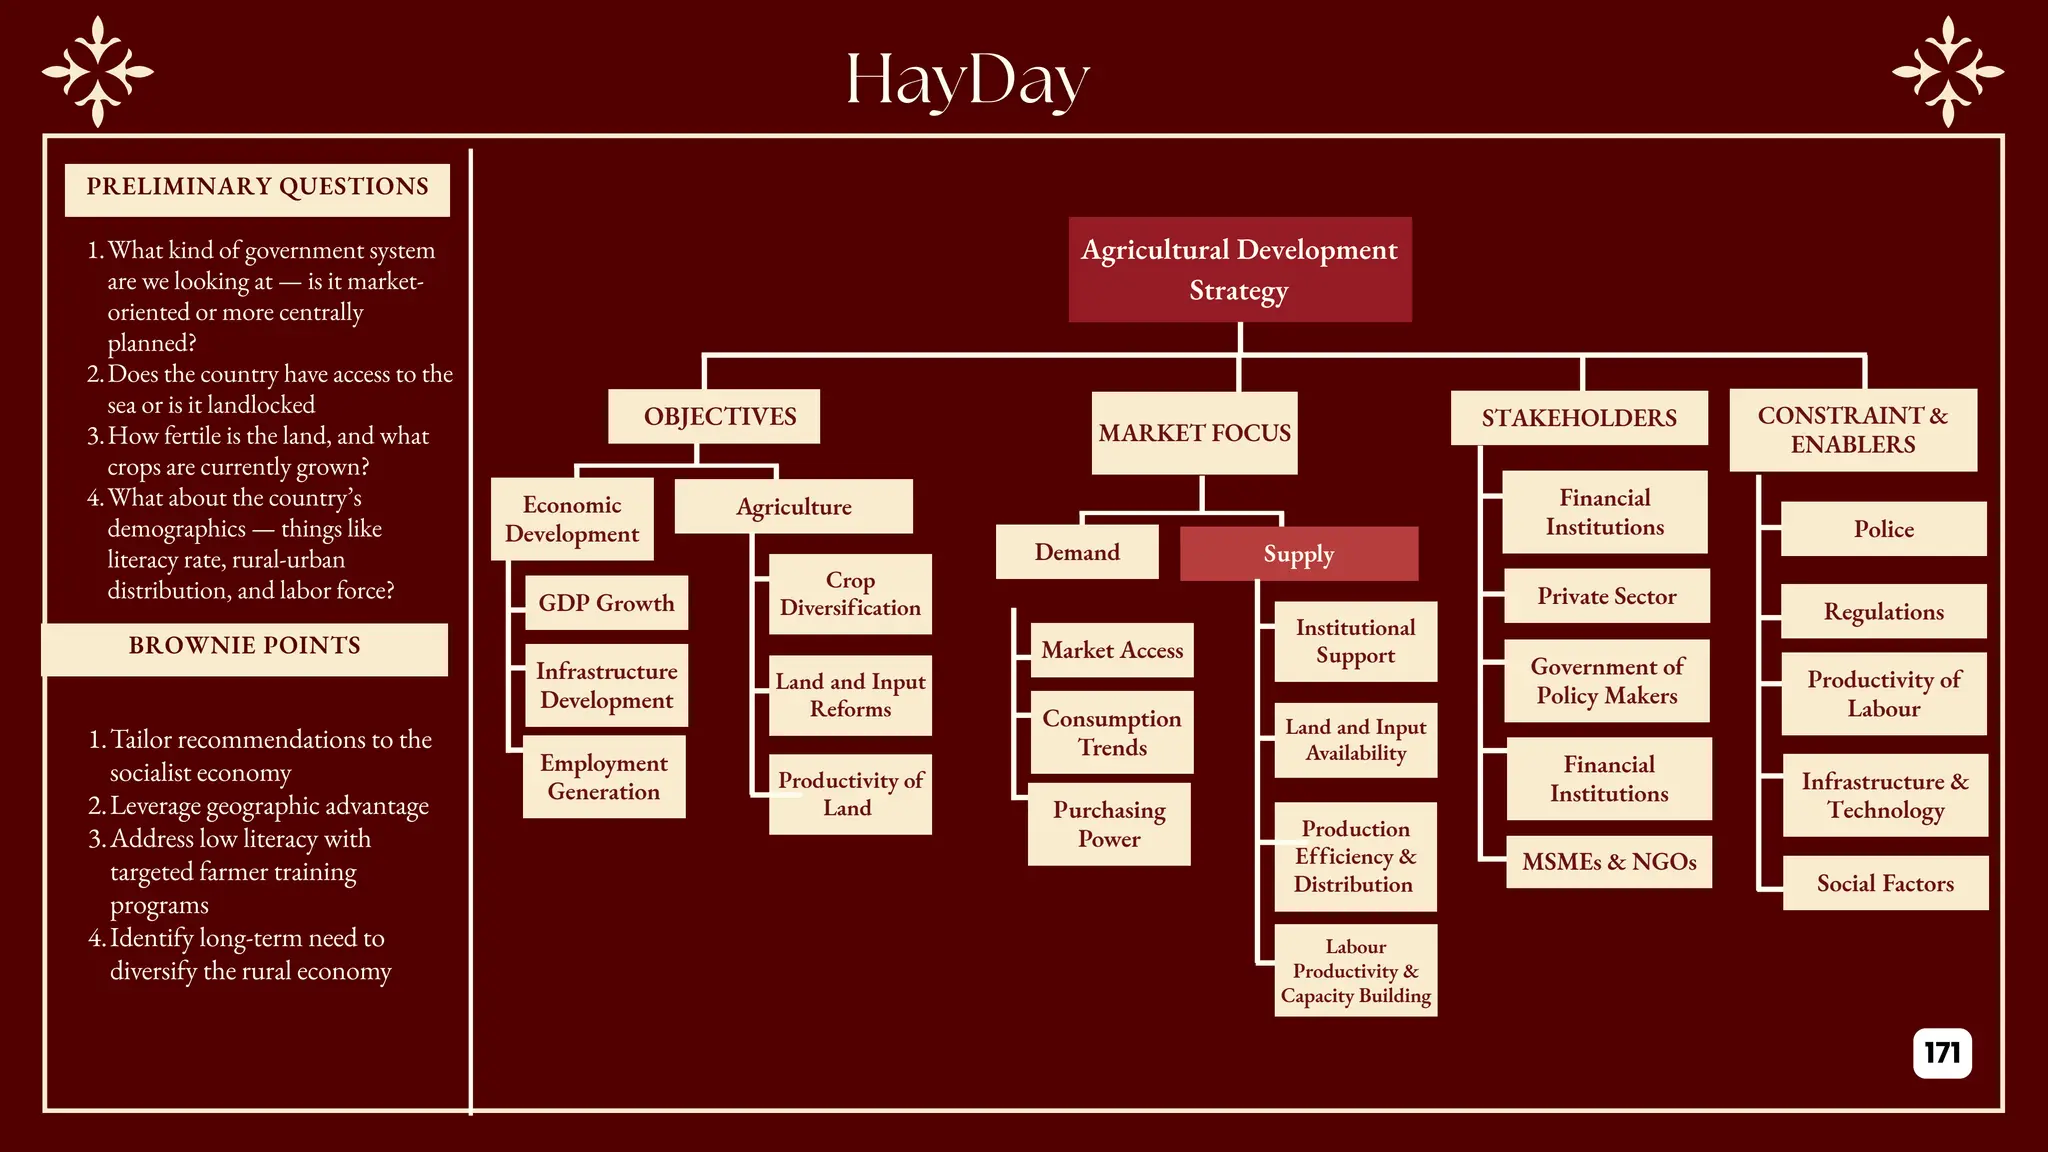
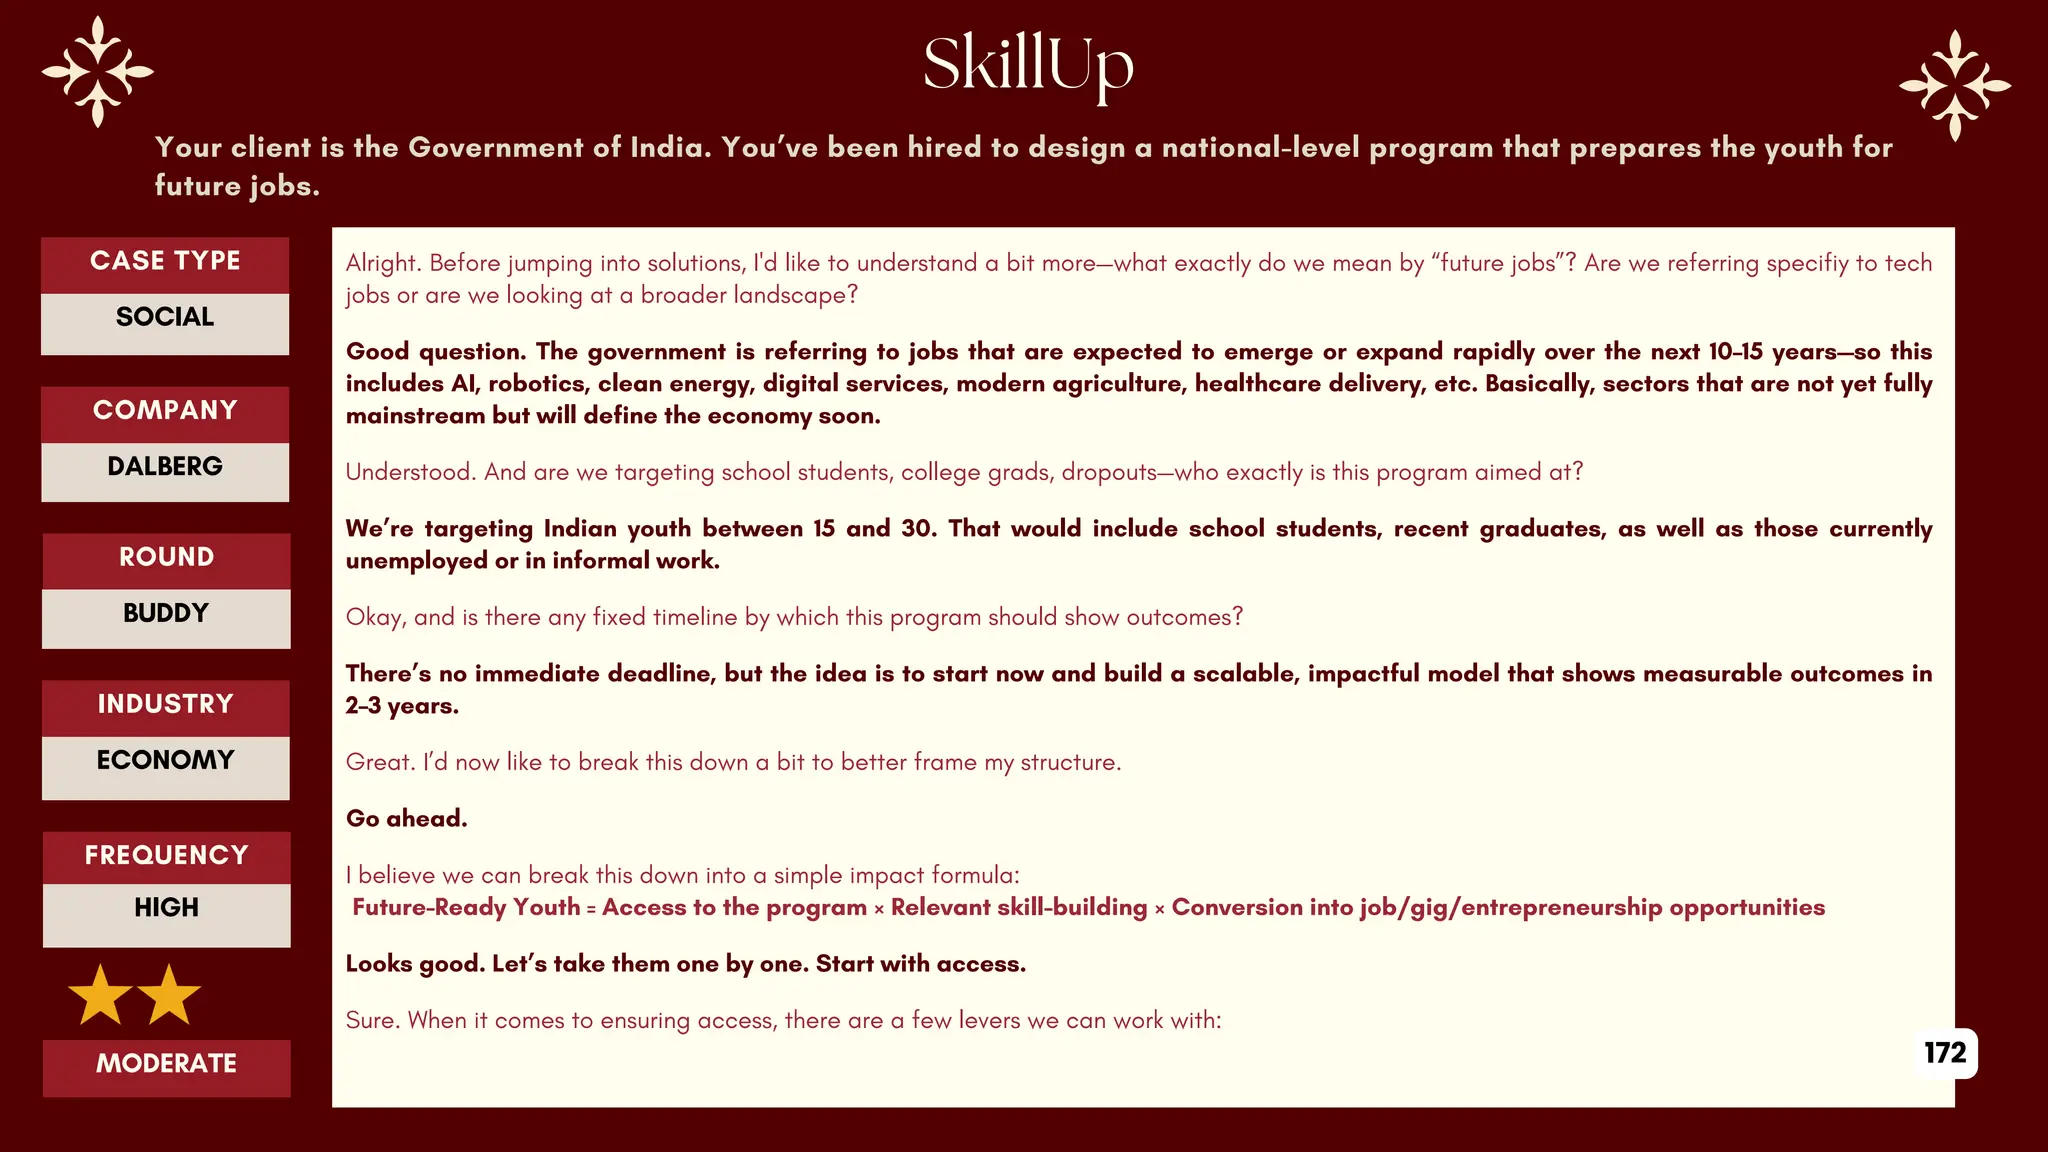
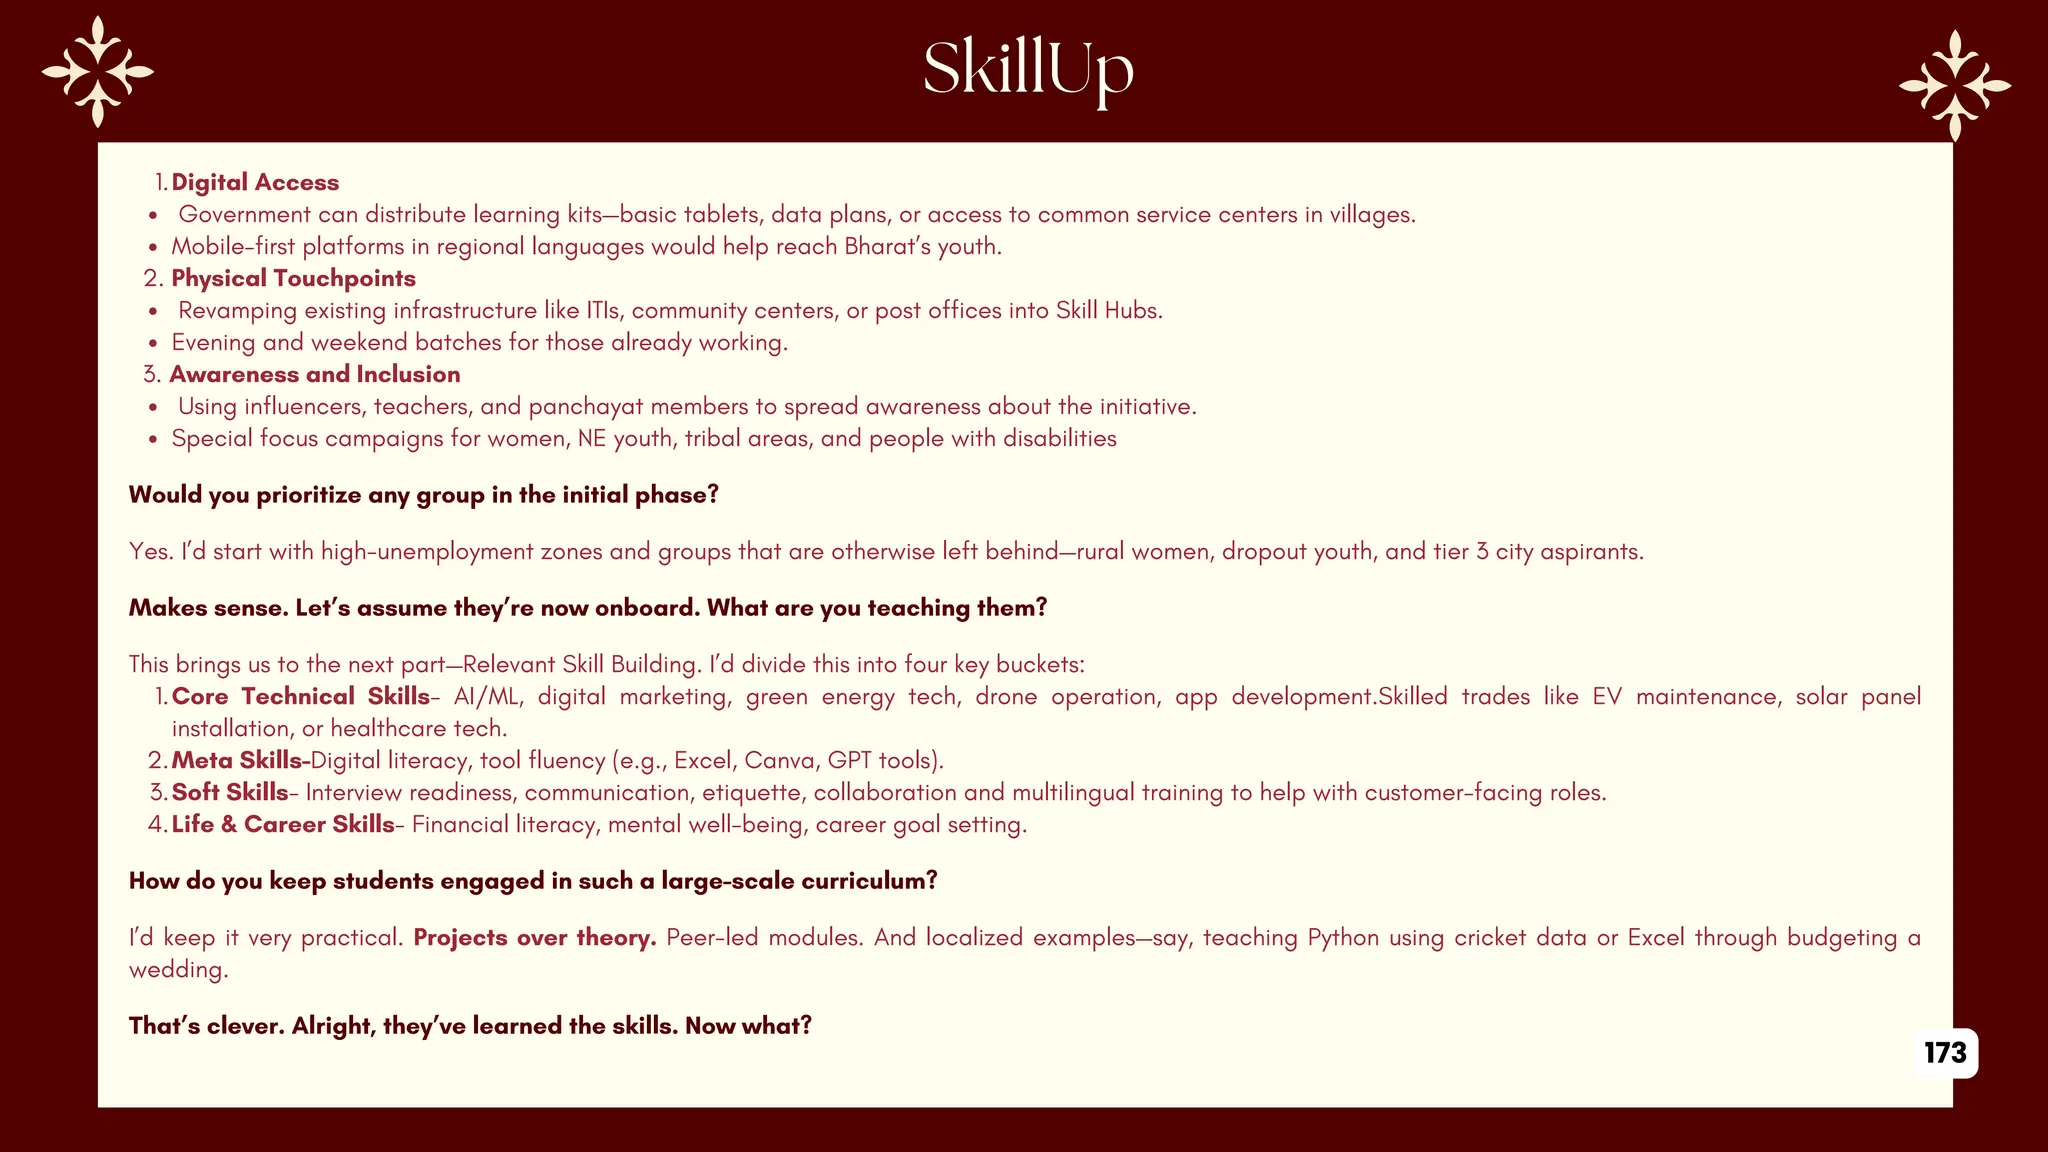

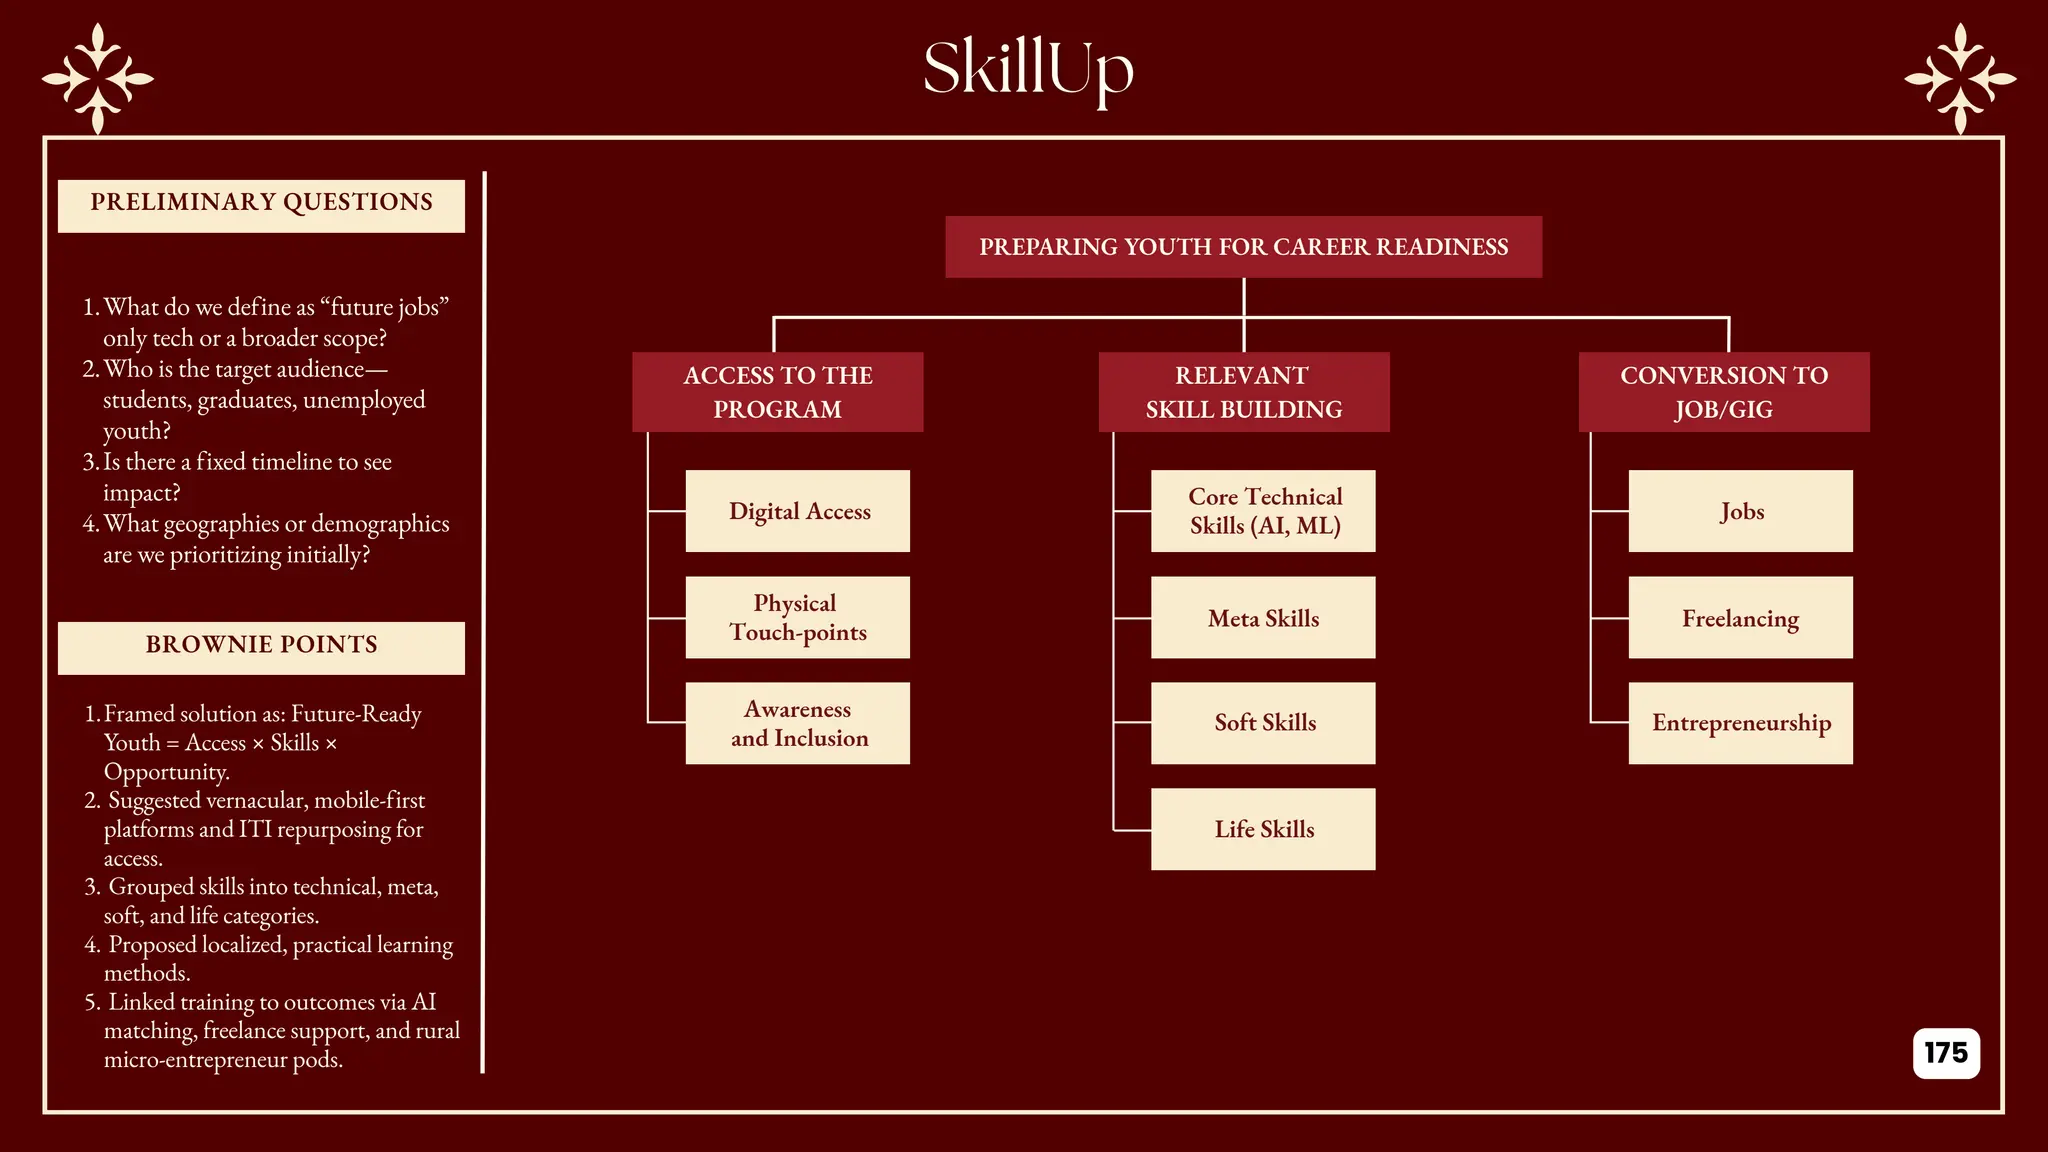
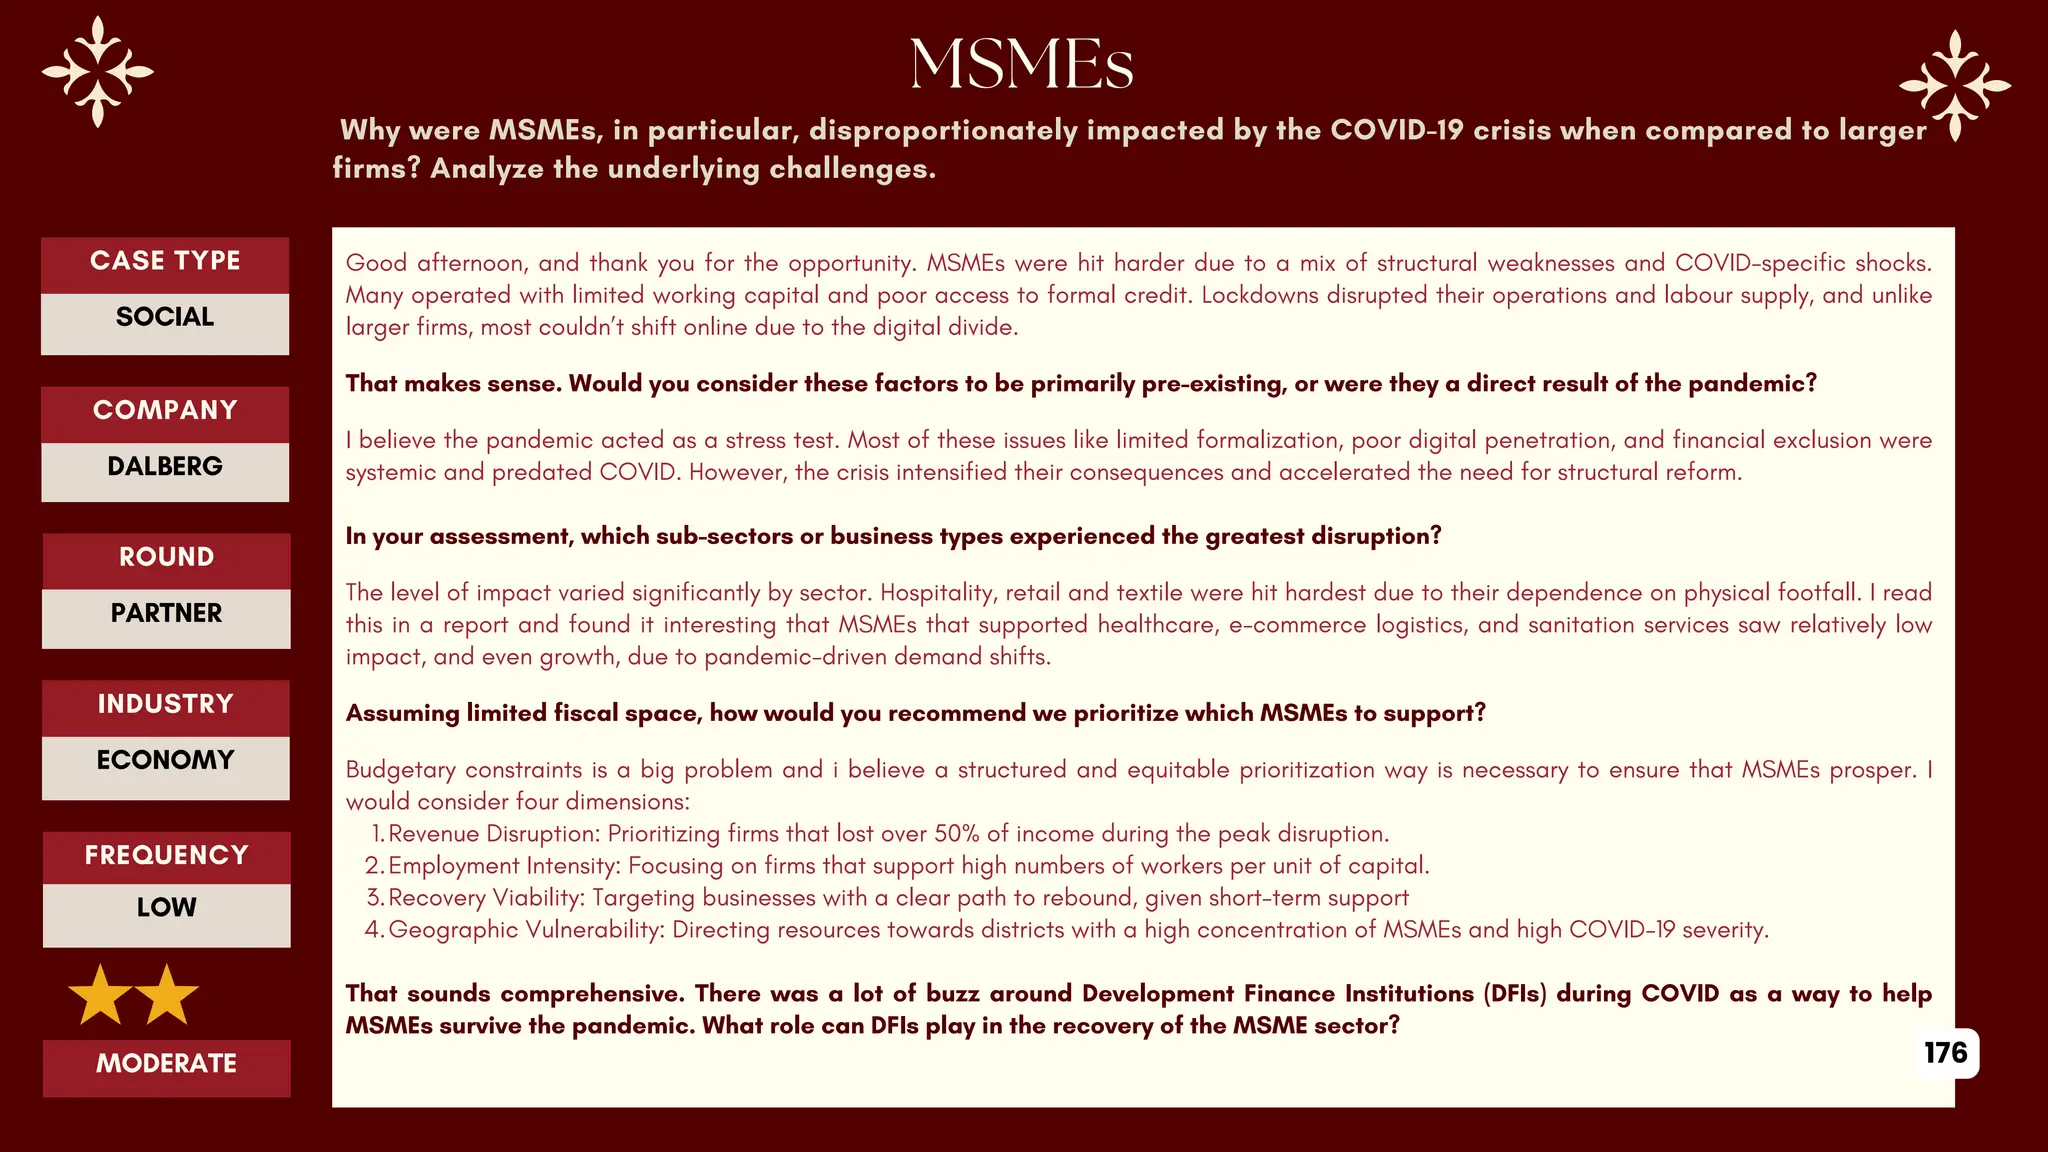
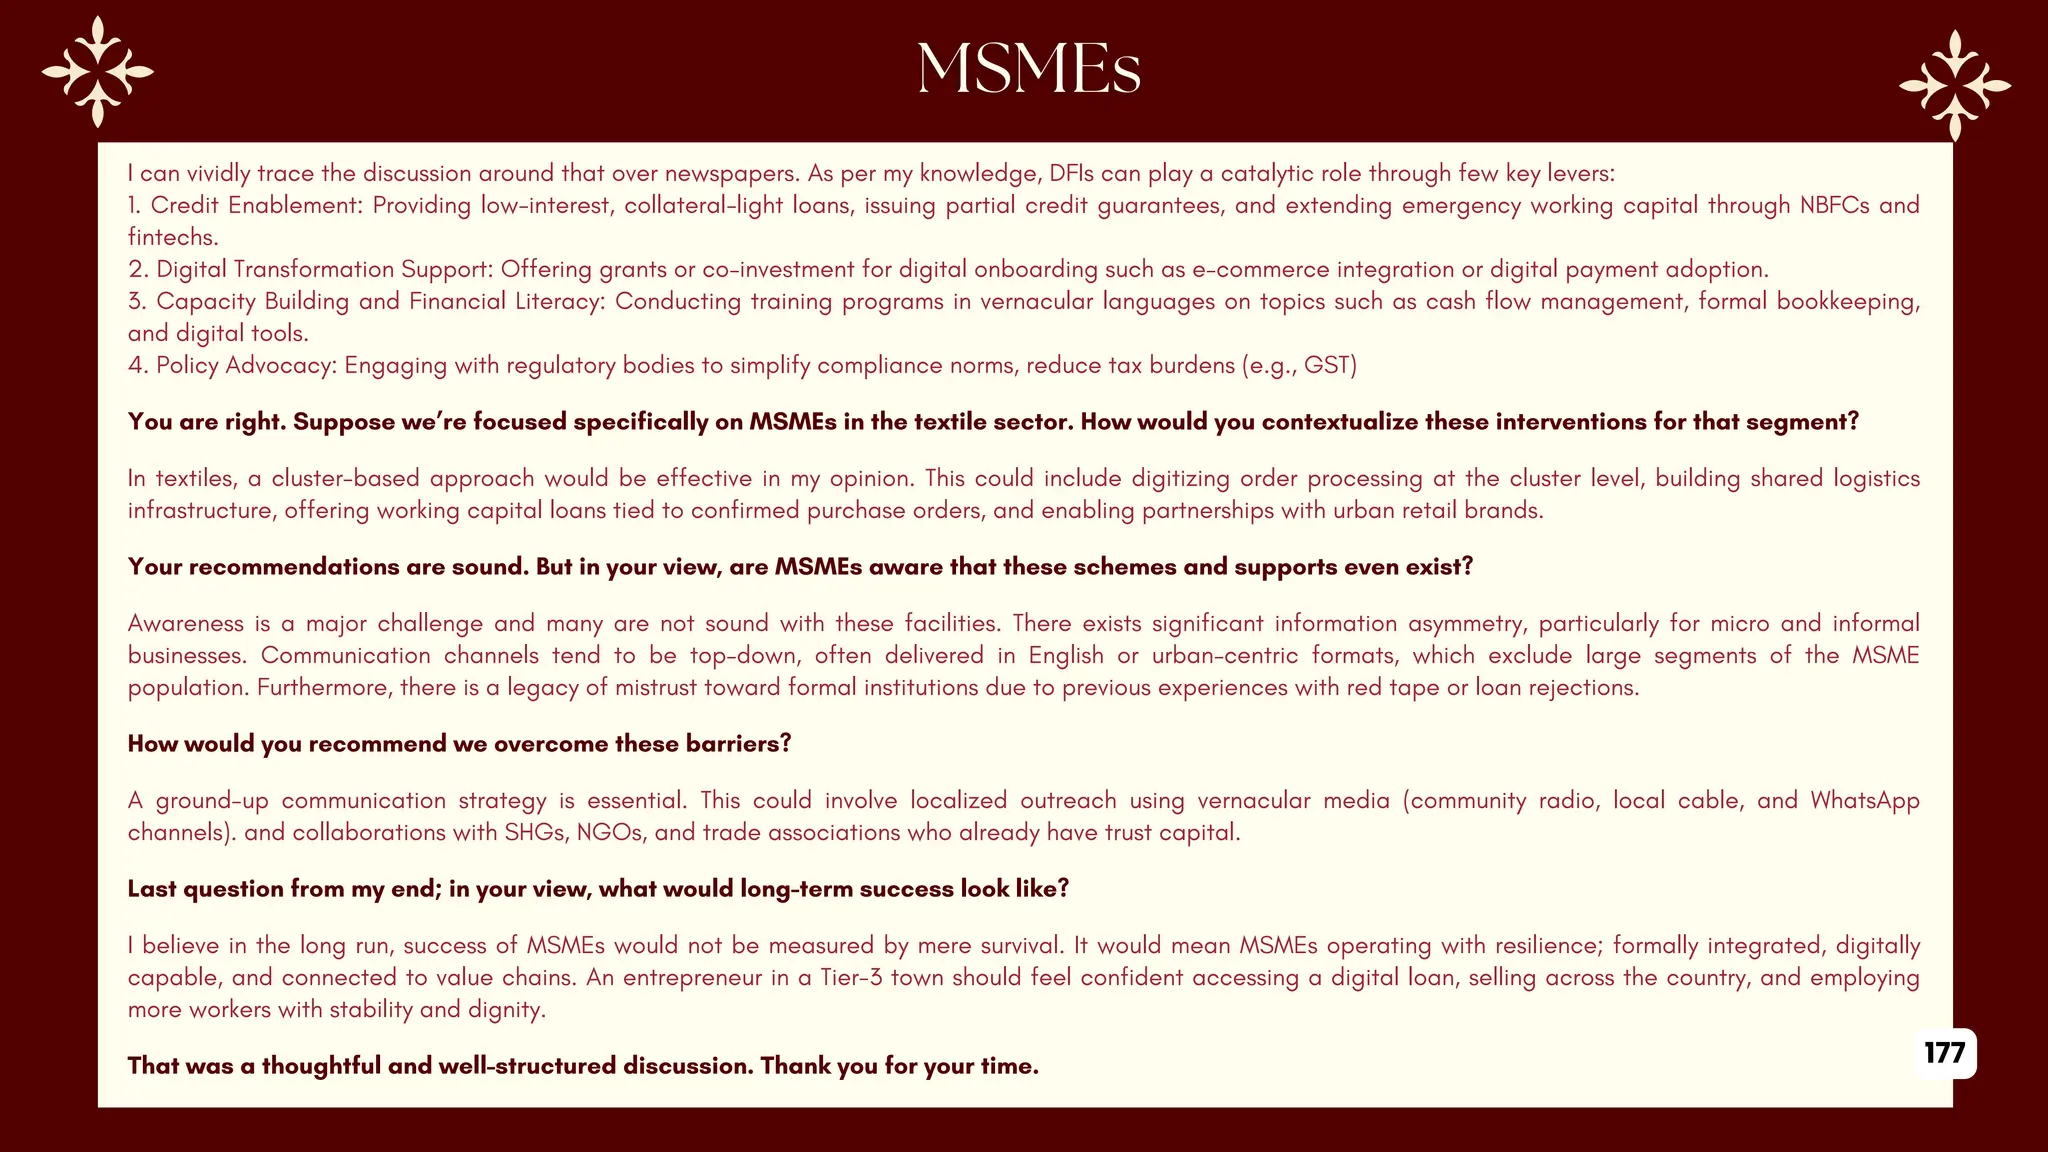


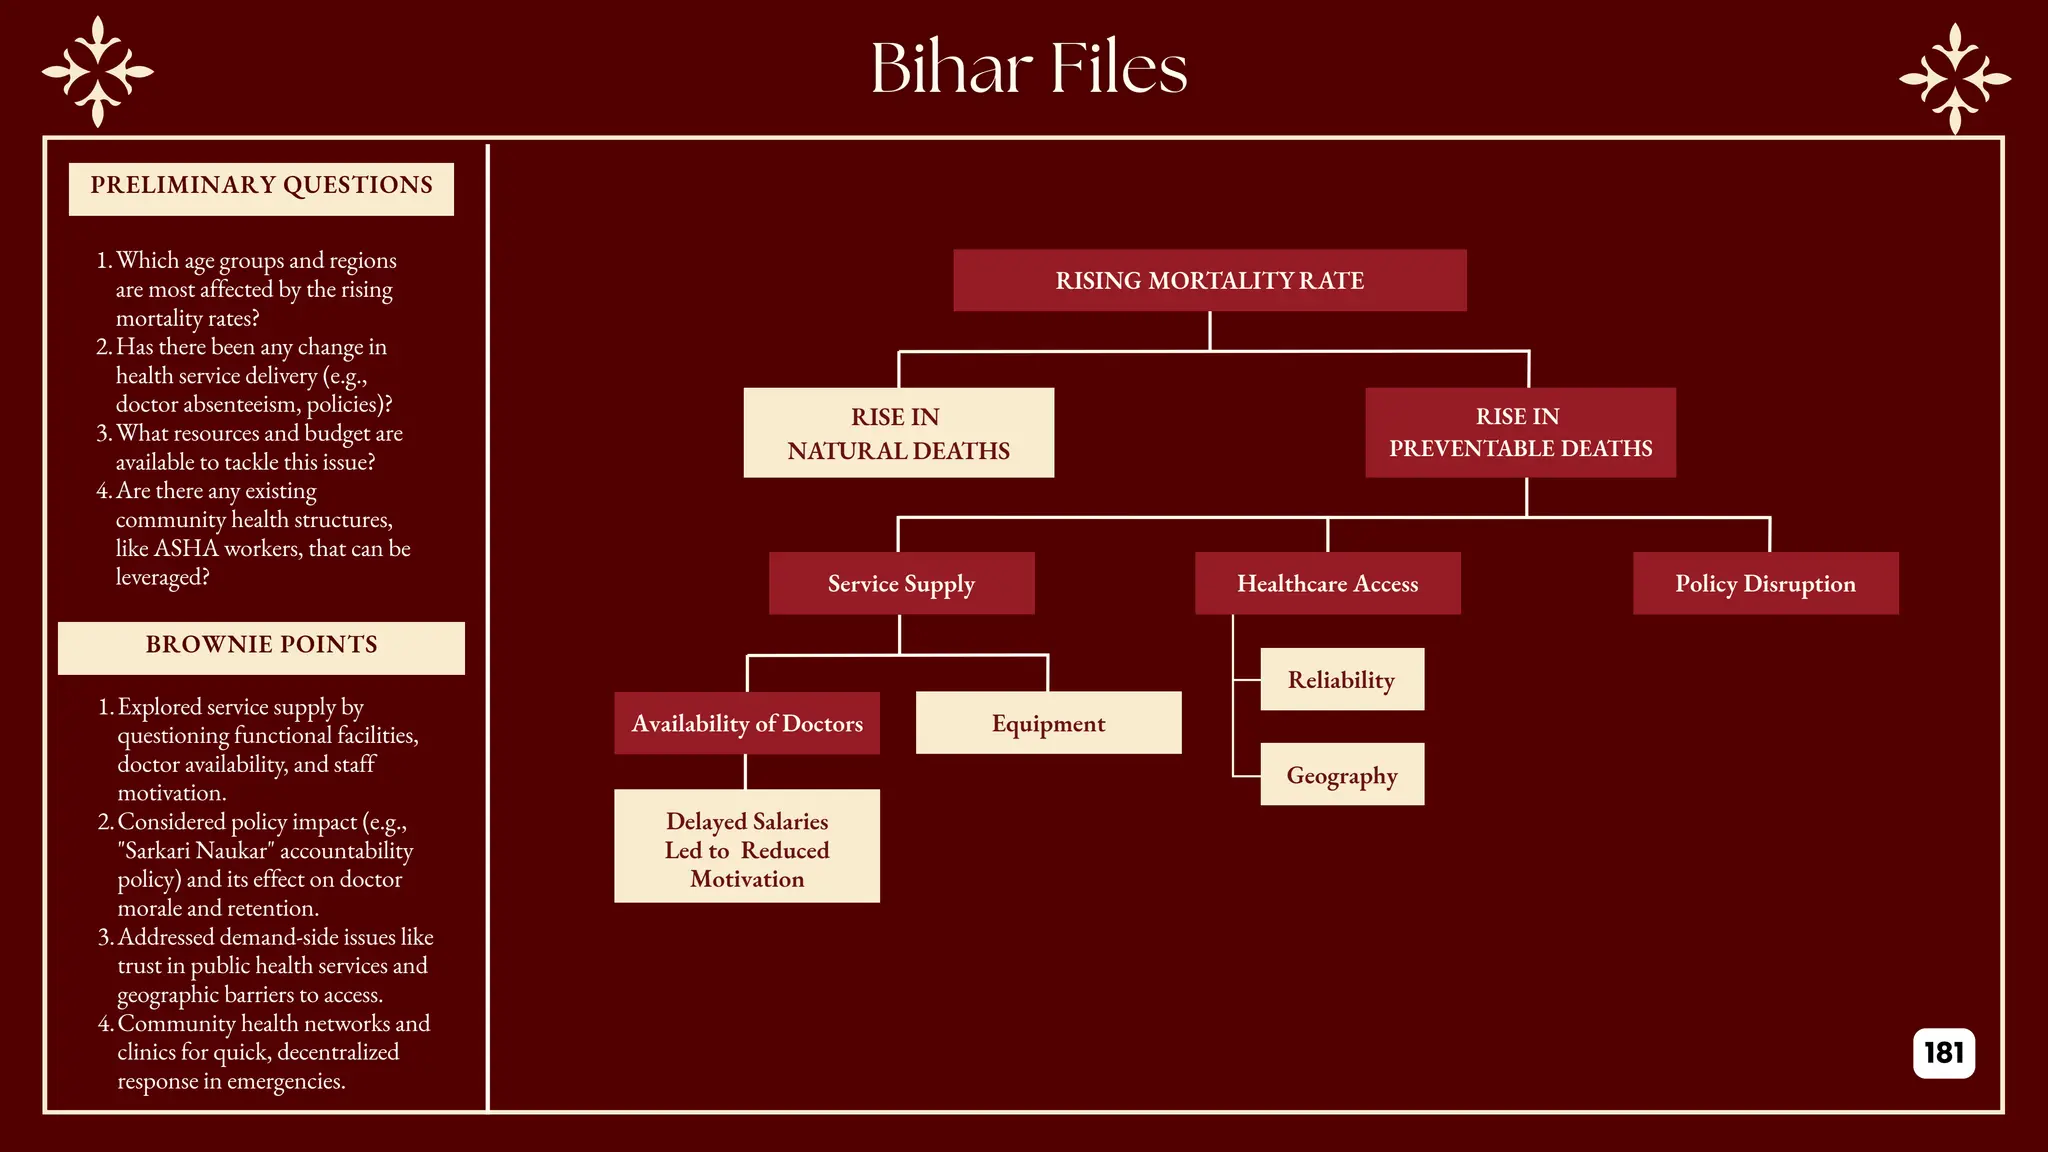
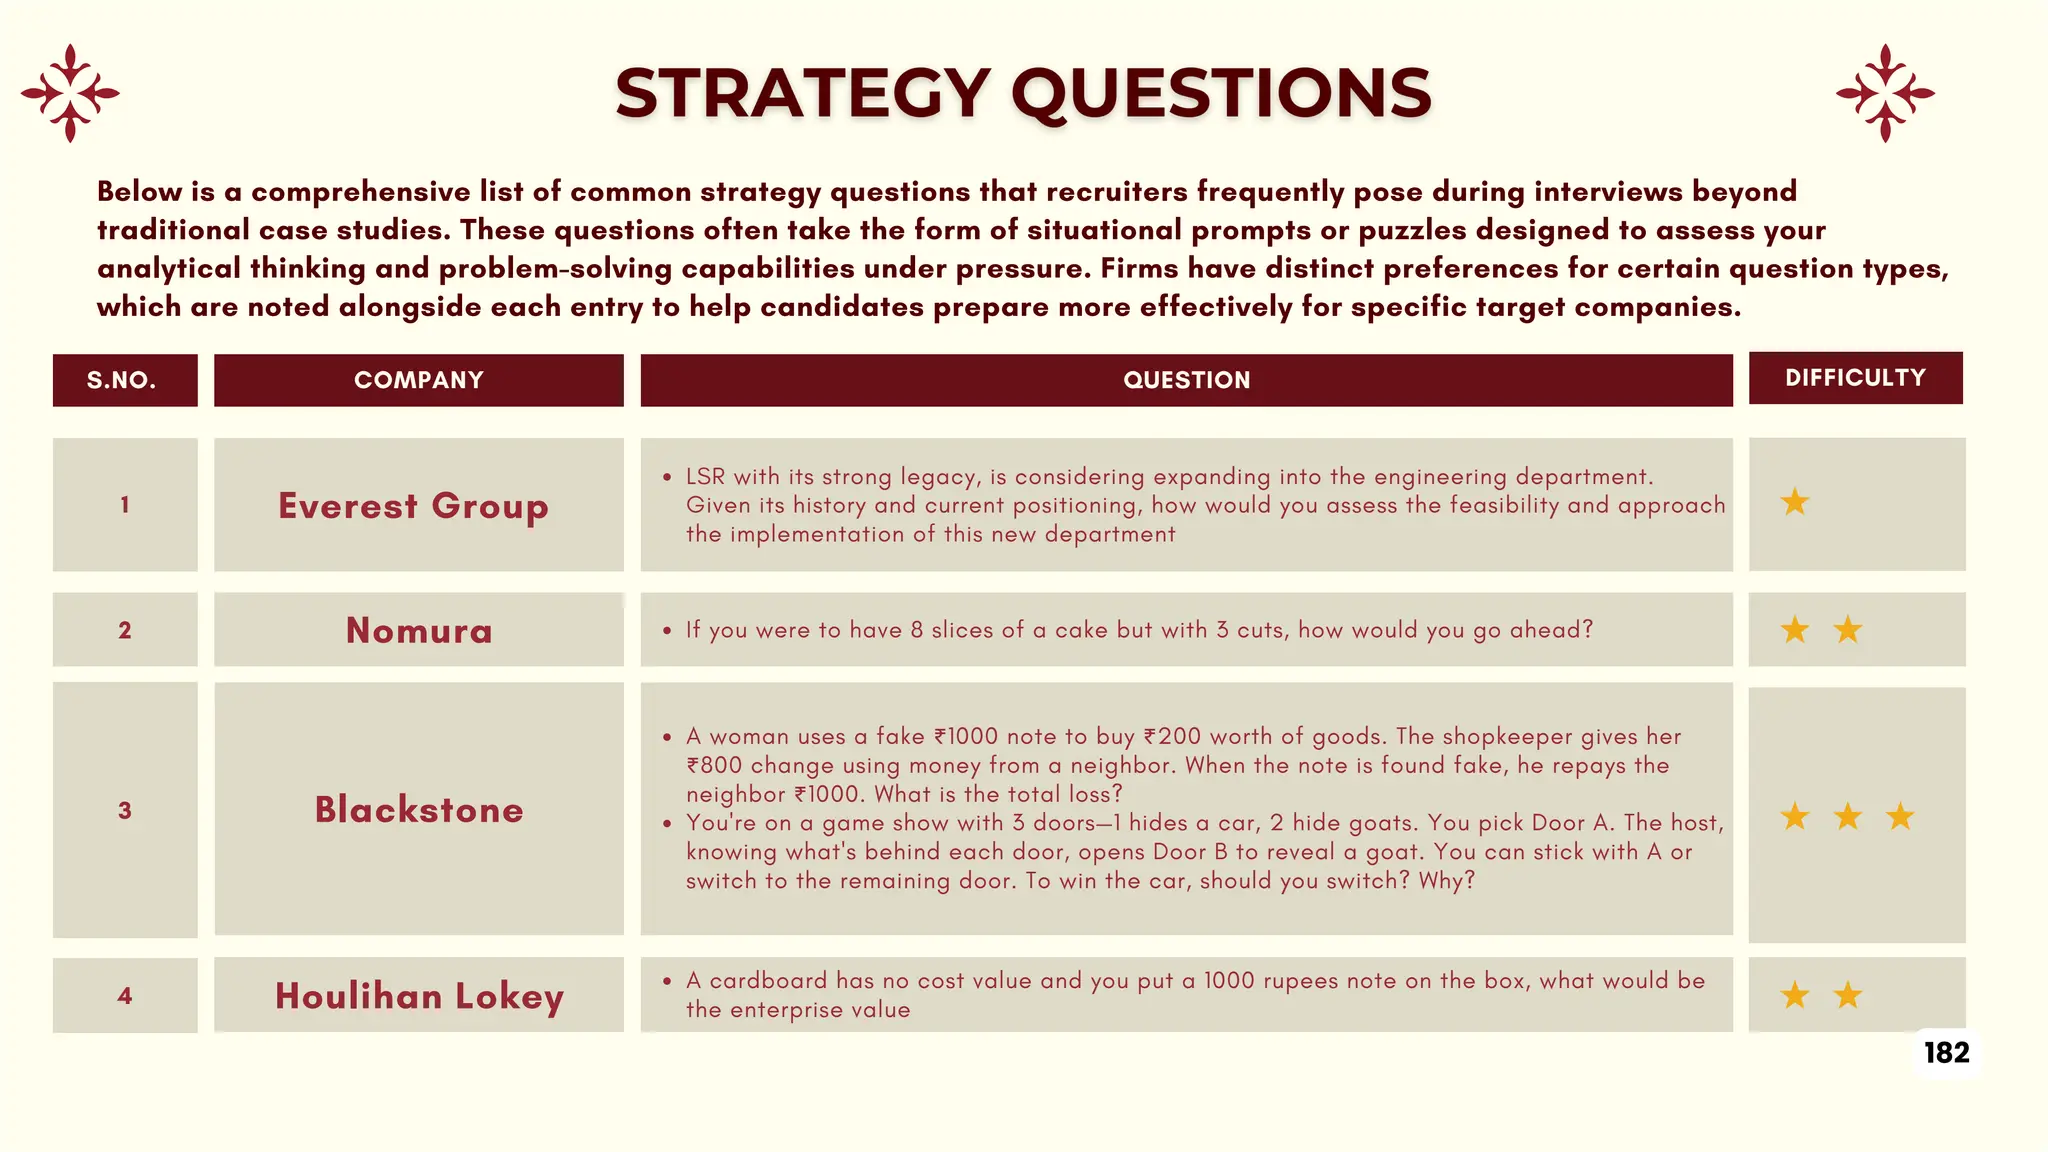
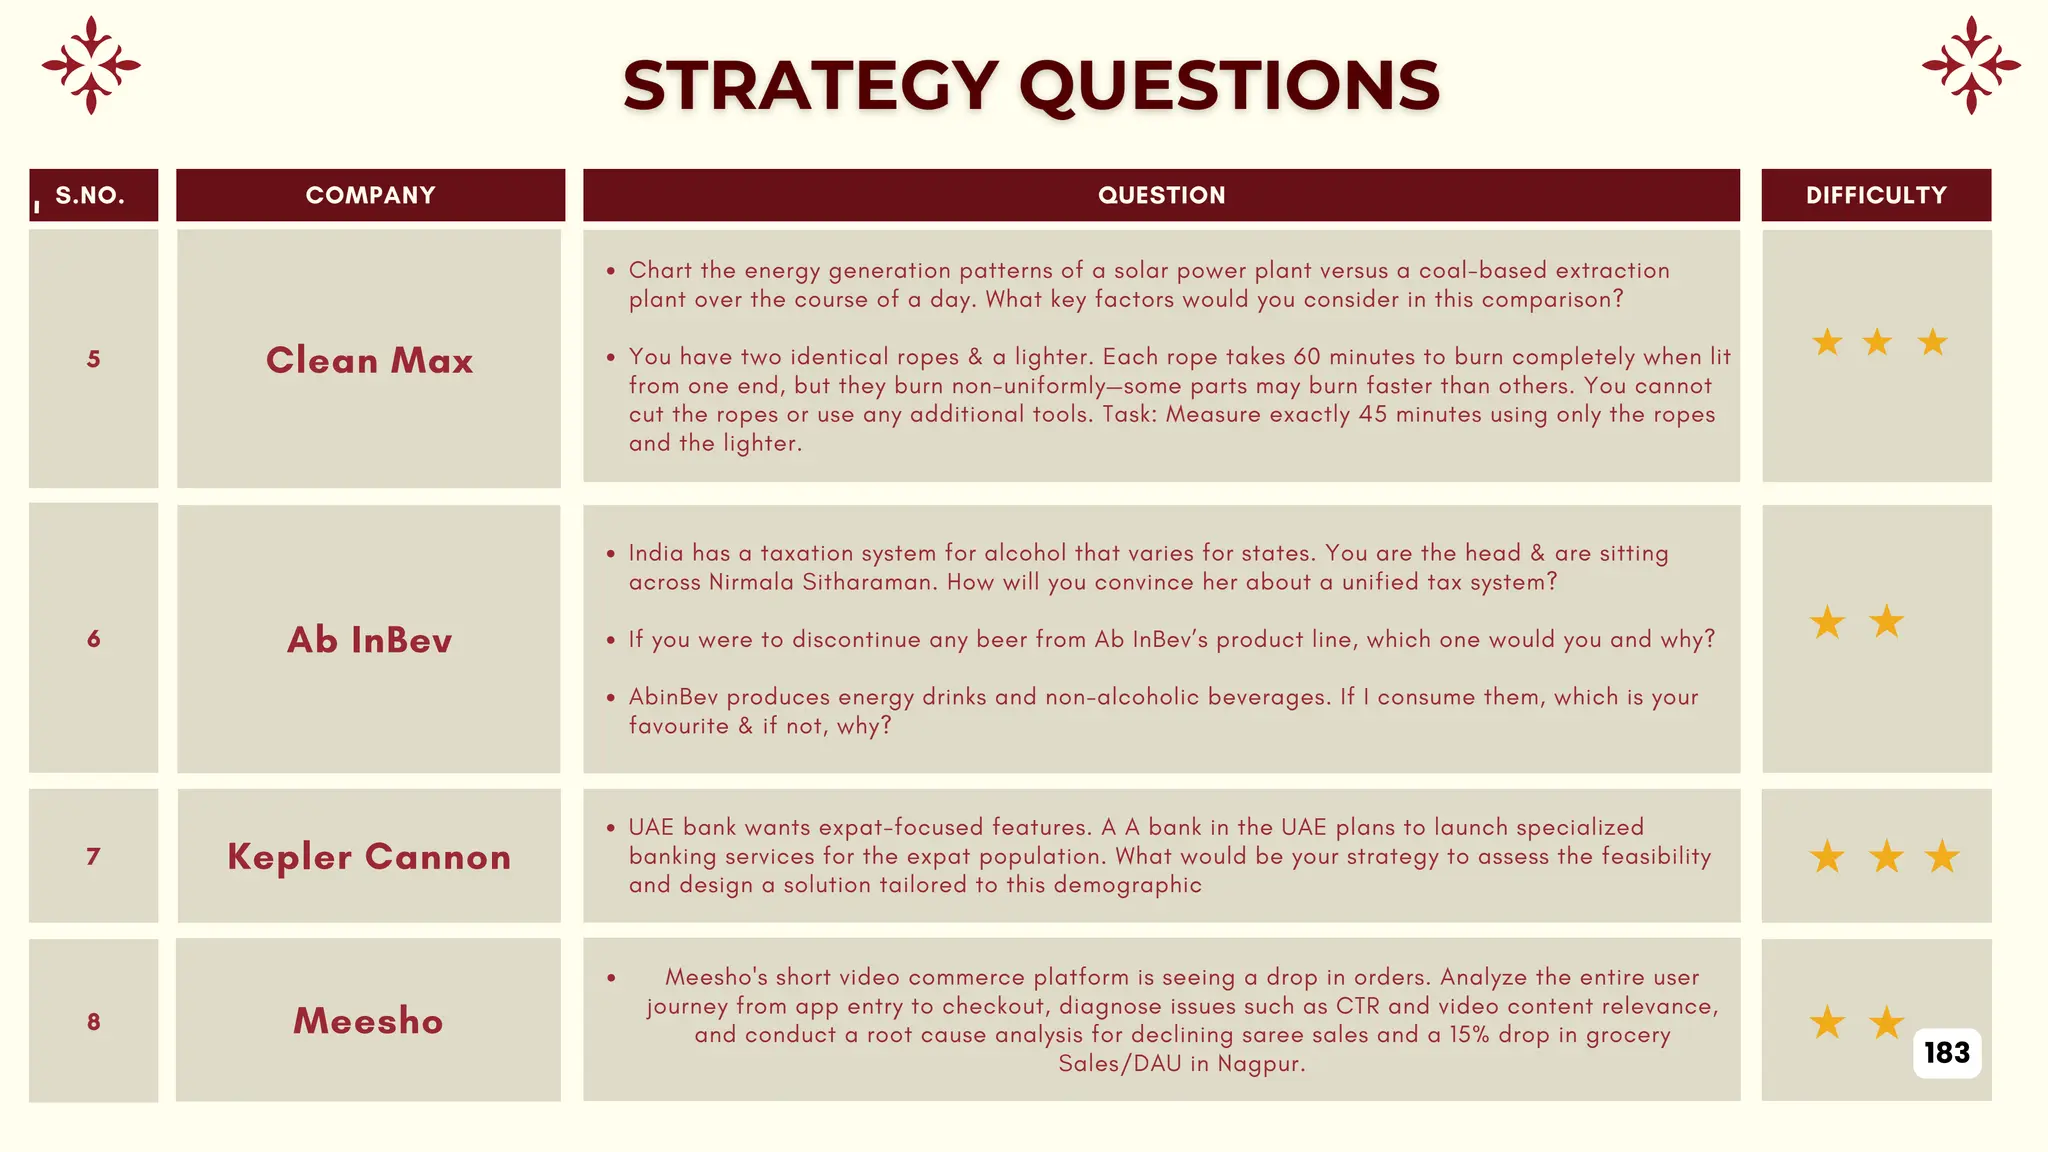


![[MET] Consulting Recruiting 101](https://cdn.slidesharecdn.com/ss_thumbnails/metconsultingrecruitment101-220128202253-thumbnail.jpg?width=640&height=640&fit=bounds)


![HANDOUT EP2 Les9 [Network 2A] .untuk belajar English](https://cdn.slidesharecdn.com/ss_thumbnails/handoutep2les9network2a-251129224226-58654b3c-thumbnail.jpg?width=640&height=640&fit=bounds)


