Download free for 30 days
Sign in
Upload
Language (EN)
Support
Business
Mobile
Social Media
Marketing
Technology
Art & Photos
Career
Design
Education
Presentations & Public Speaking
Government & Nonprofit
Healthcare
Internet
Law
Leadership & Management
Automotive
Engineering
Software
Recruiting & HR
Retail
Sales
Services
Science
Small Business & Entrepreneurship
Food
Environment
Economy & Finance
Data & Analytics
Investor Relations
Sports
Spiritual
News & Politics
Travel
Self Improvement
Real Estate
Entertainment & Humor
Health & Medicine
Devices & Hardware
Lifestyle
Change Language
Language
English
Español
Português
Français
Deutsche
Cancel
Save
Submit search
EN
Uploaded by
KeppelCorporation
9,879 views
Keppel Ltd. 1H 2025 Results Presentation Slides
31 July 2025
Business
◦
Read more
0
Save
Share
Embed
Embed presentation
Download
Downloaded 21 times
1
/ 56
2
/ 56
3
/ 56
4
/ 56
5
/ 56
6
/ 56
7
/ 56
8
/ 56
9
/ 56
10
/ 56
11
/ 56
12
/ 56
13
/ 56
14
/ 56
15
/ 56
16
/ 56
17
/ 56
18
/ 56
19
/ 56
20
/ 56
21
/ 56
22
/ 56
23
/ 56
24
/ 56
25
/ 56
26
/ 56
27
/ 56
28
/ 56
29
/ 56
30
/ 56
31
/ 56
32
/ 56
33
/ 56
34
/ 56
35
/ 56
36
/ 56
37
/ 56
38
/ 56
39
/ 56
40
/ 56
41
/ 56
Most read
42
/ 56
43
/ 56
44
/ 56
45
/ 56
46
/ 56
47
/ 56
48
/ 56
49
/ 56
50
/ 56
51
/ 56
52
/ 56
53
/ 56
54
/ 56
55
/ 56
Most read
56
/ 56
Most read
More Related Content
PDF
Keppel Ltd. 2H24 and FY24 Presentation Slides.pdf
by
KeppelCorporation
PPTX
Navigating a digital-first home furnishings market
by
L.E.K. Consulting
PPTX
The 4th Annual New Mobility Study 2019
by
L.E.K. Consulting
PDF
EY Price Point: global oil and gas market outlook
by
EY
PDF
Strategy Study 2014 | A.T. Kearney
by
Kearney
PDF
The Merchandising Evolution (and why NDC Matters)
by
L.E.K. Consulting
PDF
5 Opportunities in the Nutritional Supplements Industry
by
L.E.K. Consulting
PDF
China: Opportunities and Hot-Spots in the MedTech (Medical Device), Pharmaceu...
by
L.E.K. Consulting
Keppel Ltd. 2H24 and FY24 Presentation Slides.pdf
by
KeppelCorporation
Navigating a digital-first home furnishings market
by
L.E.K. Consulting
The 4th Annual New Mobility Study 2019
by
L.E.K. Consulting
EY Price Point: global oil and gas market outlook
by
EY
Strategy Study 2014 | A.T. Kearney
by
Kearney
The Merchandising Evolution (and why NDC Matters)
by
L.E.K. Consulting
5 Opportunities in the Nutritional Supplements Industry
by
L.E.K. Consulting
China: Opportunities and Hot-Spots in the MedTech (Medical Device), Pharmaceu...
by
L.E.K. Consulting
What's hot
PDF
Federal Technology Vision 2021: Full U.S. Federal Survey Findings | Accenture
by
accenture
PDF
Infrastructure Victoria - AZ/ZEV International Scan
by
L.E.K. Consulting
PDF
IBOR transition: Opportunities and challenges for the asset management industry
by
EY
PDF
Cracking the Code on Consumer Fraud | Accenture
by
accenture
PDF
e-Conomy SEA 2021: Kỷ nguyên số của Đông Nam Á
by
MarketingTrips
PDF
The Bionic Future - Future Work Summit
by
Miguel Carrasco
PDF
18th Annual Global CEO Survey - Technology industry key findings
by
PwC
PDF
Accenture Consumer Behavior Research: The value shake-up
by
accenture
PPTX
The FDA and industry: A recipe for collaborating in the New Health Economy
by
PwC
PDF
Australia: Taking Bigger Steps | A.T. Kearney
by
Kearney
PPTX
Joining Forces: Interagency Collaboration and "Smart Power"
by
Booz Allen Hamilton
PDF
EY Price Point: global oil and gas market outlook, Q2 | April 2022
by
EY
PPTX
BCG-Future-of-FMCG-Web-20201029-1.pptx
by
Self-Employed
PPTX
EY's European Banking Barometer – 2015
by
EY
PDF
Top 8 Insights From the 2018 Beauty, Health & Wellness Survey
by
L.E.K. Consulting
PDF
2019 Media and Entertainment Study
by
L.E.K. Consulting
PDF
2016 Strategic Hospital Priorities Study
by
L.E.K. Consulting
PDF
White Star Capital SEA 2022 Venture Capital Landscape
by
Sanjay Zimmermann
PDF
Quarterly analyst themes of oil and gas earnings, Q1 2022
by
EY
PPTX
Chad Cameroon pipeline Project Case study
by
Sharkhuu Munkhbat
Federal Technology Vision 2021: Full U.S. Federal Survey Findings | Accenture
by
accenture
Infrastructure Victoria - AZ/ZEV International Scan
by
L.E.K. Consulting
IBOR transition: Opportunities and challenges for the asset management industry
by
EY
Cracking the Code on Consumer Fraud | Accenture
by
accenture
e-Conomy SEA 2021: Kỷ nguyên số của Đông Nam Á
by
MarketingTrips
The Bionic Future - Future Work Summit
by
Miguel Carrasco
18th Annual Global CEO Survey - Technology industry key findings
by
PwC
Accenture Consumer Behavior Research: The value shake-up
by
accenture
The FDA and industry: A recipe for collaborating in the New Health Economy
by
PwC
Australia: Taking Bigger Steps | A.T. Kearney
by
Kearney
Joining Forces: Interagency Collaboration and "Smart Power"
by
Booz Allen Hamilton
EY Price Point: global oil and gas market outlook, Q2 | April 2022
by
EY
BCG-Future-of-FMCG-Web-20201029-1.pptx
by
Self-Employed
EY's European Banking Barometer – 2015
by
EY
Top 8 Insights From the 2018 Beauty, Health & Wellness Survey
by
L.E.K. Consulting
2019 Media and Entertainment Study
by
L.E.K. Consulting
2016 Strategic Hospital Priorities Study
by
L.E.K. Consulting
White Star Capital SEA 2022 Venture Capital Landscape
by
Sanjay Zimmermann
Quarterly analyst themes of oil and gas earnings, Q1 2022
by
EY
Chad Cameroon pipeline Project Case study
by
Sharkhuu Munkhbat
Similar to Keppel Ltd. 1H 2025 Results Presentation Slides
PDF
Keppel Ltd. 1Q 2025 Business Update Presentation Slides
by
KeppelCorporation
PDF
Keppel Investor Day 2024 Presentation Slides
by
KeppelCorporation
PDF
Annual General Meeting Presentation Slides
by
KeppelCorporation
PDF
Keppel Ltd. 9M 2025 Business Update Presentation Slides
by
KeppelCorporation
PDF
Keppel Corporation - Annual General Meeting CEO's Presentation Slides
by
KeppelCorporation
PDF
Keppel Corporation 1Q23 Business Update
by
KeppelCorporation
PDF
Keppel Ltd. 1Q 2024 Business Update Presentation Slides
by
KeppelCorporation
PDF
Keppel Corporation 2H & FY2022 Results Presentation Slides
by
KeppelCorporation
PDF
Keppel Investor Day 2025 Presentation Slides GCAT.pdf
by
KeppelCorporation
PDF
Keppel Corporation's 2H & FY 2021 Financial Results Presentation Slides
by
KeppelCorporation
PDF
Keppel Corporation 1H 2023 Financial Results Presentation
by
KeppelCorporation
PDF
Keppel Ltd. AGM 2025 CEO Presentation Slides
by
KeppelCorporation
PDF
Keppel-Ltd-2h23-fy23-presentation-slides
by
KeppelCorporation
PDF
Presentation Slides for HSBC Global Investment Summit
by
KeppelCorporation
PDF
Keppel Corporation's Vision 2030 Briefing to Analysts
by
KeppelCorporation
PDF
Keppel Corporation UK Non-deal Roadshow 2019
by
KeppelCorporation
PDF
Keppel's Presentation Slides to Investors
by
KeppelCorporation
PDF
2 keppel ltd 1h24 presentation slides.pdf
by
KeppelCorporation
PDF
Keppel Corporation - Briefing to media and analysts on accelerating transform...
by
KeppelCorporation
PDF
KCL_AR2016_Full_Report.pdf
by
leqhuy78
Keppel Ltd. 1Q 2025 Business Update Presentation Slides
by
KeppelCorporation
Keppel Investor Day 2024 Presentation Slides
by
KeppelCorporation
Annual General Meeting Presentation Slides
by
KeppelCorporation
Keppel Ltd. 9M 2025 Business Update Presentation Slides
by
KeppelCorporation
Keppel Corporation - Annual General Meeting CEO's Presentation Slides
by
KeppelCorporation
Keppel Corporation 1Q23 Business Update
by
KeppelCorporation
Keppel Ltd. 1Q 2024 Business Update Presentation Slides
by
KeppelCorporation
Keppel Corporation 2H & FY2022 Results Presentation Slides
by
KeppelCorporation
Keppel Investor Day 2025 Presentation Slides GCAT.pdf
by
KeppelCorporation
Keppel Corporation's 2H & FY 2021 Financial Results Presentation Slides
by
KeppelCorporation
Keppel Corporation 1H 2023 Financial Results Presentation
by
KeppelCorporation
Keppel Ltd. AGM 2025 CEO Presentation Slides
by
KeppelCorporation
Keppel-Ltd-2h23-fy23-presentation-slides
by
KeppelCorporation
Presentation Slides for HSBC Global Investment Summit
by
KeppelCorporation
Keppel Corporation's Vision 2030 Briefing to Analysts
by
KeppelCorporation
Keppel Corporation UK Non-deal Roadshow 2019
by
KeppelCorporation
Keppel's Presentation Slides to Investors
by
KeppelCorporation
2 keppel ltd 1h24 presentation slides.pdf
by
KeppelCorporation
Keppel Corporation - Briefing to media and analysts on accelerating transform...
by
KeppelCorporation
KCL_AR2016_Full_Report.pdf
by
leqhuy78
More from KeppelCorporation
PDF
Keppel Ltd. 3Q 2024 Business Update Presentation Slides
by
KeppelCorporation
PDF
Keppel Corporation AGM 2023 Presentation Slides
by
KeppelCorporation
PDF
Keppel Corporation's 1H22 Financial Results
by
KeppelCorporation
PDF
Keppel 3Q & 9M 2023 Business Update Presentation Slides
by
KeppelCorporation
PDF
Keppel Corporation's Presentation Slides for US Non-Deal Roadshow
by
KeppelCorporation
PDF
Keppel Corporation 3Q & 9M 2022 Business Update Presentation Slides
by
KeppelCorporation
PDF
keppel-ltd-3q-2024-business-update-presentation-slides.pdf
by
KeppelCorporation
PDF
Keppel Corporation non-deal roadshow slides
by
KeppelCorporation
PDF
SIAS-Keppel Briefing to Retail Shareholders 2023.pdf
by
KeppelCorporation
PDF
Presentation at Citi-SGX-REITAS REITs Sponsors Forum
by
KeppelCorporation
PDF
Keppel_Proposed Divestment of M1 Limited
by
KeppelCorporation
PDF
Presentation on proposed acquisition of leading European asset manager Aermon...
by
KeppelCorporation
PDF
Keppel Capital's Presentation Slides for REITs Symposium in Singapore
by
KeppelCorporation
PDF
Keppel Corporation signs definitive agreements in connection with proposed co...
by
KeppelCorporation
Keppel Ltd. 3Q 2024 Business Update Presentation Slides
by
KeppelCorporation
Keppel Corporation AGM 2023 Presentation Slides
by
KeppelCorporation
Keppel Corporation's 1H22 Financial Results
by
KeppelCorporation
Keppel 3Q & 9M 2023 Business Update Presentation Slides
by
KeppelCorporation
Keppel Corporation's Presentation Slides for US Non-Deal Roadshow
by
KeppelCorporation
Keppel Corporation 3Q & 9M 2022 Business Update Presentation Slides
by
KeppelCorporation
keppel-ltd-3q-2024-business-update-presentation-slides.pdf
by
KeppelCorporation
Keppel Corporation non-deal roadshow slides
by
KeppelCorporation
SIAS-Keppel Briefing to Retail Shareholders 2023.pdf
by
KeppelCorporation
Presentation at Citi-SGX-REITAS REITs Sponsors Forum
by
KeppelCorporation
Keppel_Proposed Divestment of M1 Limited
by
KeppelCorporation
Presentation on proposed acquisition of leading European asset manager Aermon...
by
KeppelCorporation
Keppel Capital's Presentation Slides for REITs Symposium in Singapore
by
KeppelCorporation
Keppel Corporation signs definitive agreements in connection with proposed co...
by
KeppelCorporation
Recently uploaded
PDF
How to Verify Your PayPal Account in 2025.pdf
by
5hb3cqye5o4j0o2dne3x
PDF
Lion One Corporate Presentation November 2025 Revised
by
Adnet Communications
PDF
Where to Buy LinkedIn Accounts_ [12 Best Sites] (3).pdf
by
a32sop3orzibld4x34e4
PDF
Strategic Thinking in Action: A conversation with Steven Haines
by
Cambridge Product Management Network
PDF
Top 5 Places to Buy Aged LinkedIn Accounts and Should ....pdf
by
5hb3cqye5o4j0o2dne3x
PDF
Humans cannot be transformed but we can help them - PLM Roadmap PDT Europe 20...
by
Jos Voskuil
PDF
How to Buy Verified Wise Accounts ,in 2025.pdf
by
a32sop3orzibld4x34e4
DOCX
7 Surprising Ways Metaverse Development Solutions Are Transforming Online Bus...
by
Ryan Wilson
PPTX
Shark Tank Project Presentation Sample 1.pptx
by
Abhishek436880
PDF
by Best Platforms to Buy Twitter Accounts in 2025.pdf
by
a32sop3orzibld4x34e4
PDF
How to Safely Buy Twitter Accounts A Complete Guide in ...pdf
by
usatrustacc5
PDF
Benefits of Buying Old GitHub Accounts for Your Projects
by
https://usashopcity.com/
PDF
Buy LinkedIn Connections _ Grow Your Network Fast.pdf
by
dubivgplc4wloha4rxsm
PDF
How To Safely Buy Instagram Accounts In 2025.pdf
by
dubivgplc4wloha4rxsm
PDF
Buy Verified PayPal Account A Complete Guide to Online Finance.pdf
by
Can I buy a verified Wise account?
PDF
The Most Recommended Commerce Colleges of the Year in 2025.pdf
by
EducationView
PDF
Where to Buy LinkedIn Accounts_ [12 Best Sites] (2).pdf
by
dubivgplc4wloha4rxsm
PDF
How do I subscribe to Snapchat in usa 2025+_.pdf
by
dubivgplc4wloha4rxsm
DOCX
Trusted Top Site to Buy Verified PayPal Account Online Finance.docx
by
Can I buy a verified Wise account?
PDF
HIROSHI BRYAN VO - A Bilingual Voice Actor
by
HIROSHI BRYAN VO
How to Verify Your PayPal Account in 2025.pdf
by
5hb3cqye5o4j0o2dne3x
Lion One Corporate Presentation November 2025 Revised
by
Adnet Communications
Where to Buy LinkedIn Accounts_ [12 Best Sites] (3).pdf
by
a32sop3orzibld4x34e4
Strategic Thinking in Action: A conversation with Steven Haines
by
Cambridge Product Management Network
Top 5 Places to Buy Aged LinkedIn Accounts and Should ....pdf
by
5hb3cqye5o4j0o2dne3x
Humans cannot be transformed but we can help them - PLM Roadmap PDT Europe 20...
by
Jos Voskuil
How to Buy Verified Wise Accounts ,in 2025.pdf
by
a32sop3orzibld4x34e4
7 Surprising Ways Metaverse Development Solutions Are Transforming Online Bus...
by
Ryan Wilson
Shark Tank Project Presentation Sample 1.pptx
by
Abhishek436880
by Best Platforms to Buy Twitter Accounts in 2025.pdf
by
a32sop3orzibld4x34e4
How to Safely Buy Twitter Accounts A Complete Guide in ...pdf
by
usatrustacc5
Benefits of Buying Old GitHub Accounts for Your Projects
by
https://usashopcity.com/
Buy LinkedIn Connections _ Grow Your Network Fast.pdf
by
dubivgplc4wloha4rxsm
How To Safely Buy Instagram Accounts In 2025.pdf
by
dubivgplc4wloha4rxsm
Buy Verified PayPal Account A Complete Guide to Online Finance.pdf
by
Can I buy a verified Wise account?
The Most Recommended Commerce Colleges of the Year in 2025.pdf
by
EducationView
Where to Buy LinkedIn Accounts_ [12 Best Sites] (2).pdf
by
dubivgplc4wloha4rxsm
How do I subscribe to Snapchat in usa 2025+_.pdf
by
dubivgplc4wloha4rxsm
Trusted Top Site to Buy Verified PayPal Account Online Finance.docx
by
Can I buy a verified Wise account?
HIROSHI BRYAN VO - A Bilingual Voice Actor
by
HIROSHI BRYAN VO
Keppel Ltd. 1H 2025 Results Presentation Slides
1.
1H 2025 Financial Results 31
July 2025
2.
© Keppel 2 Content 02 Financial highlights 03 Appendices 01 Address by
CEO
3.
Address by CEO 01 3
4.
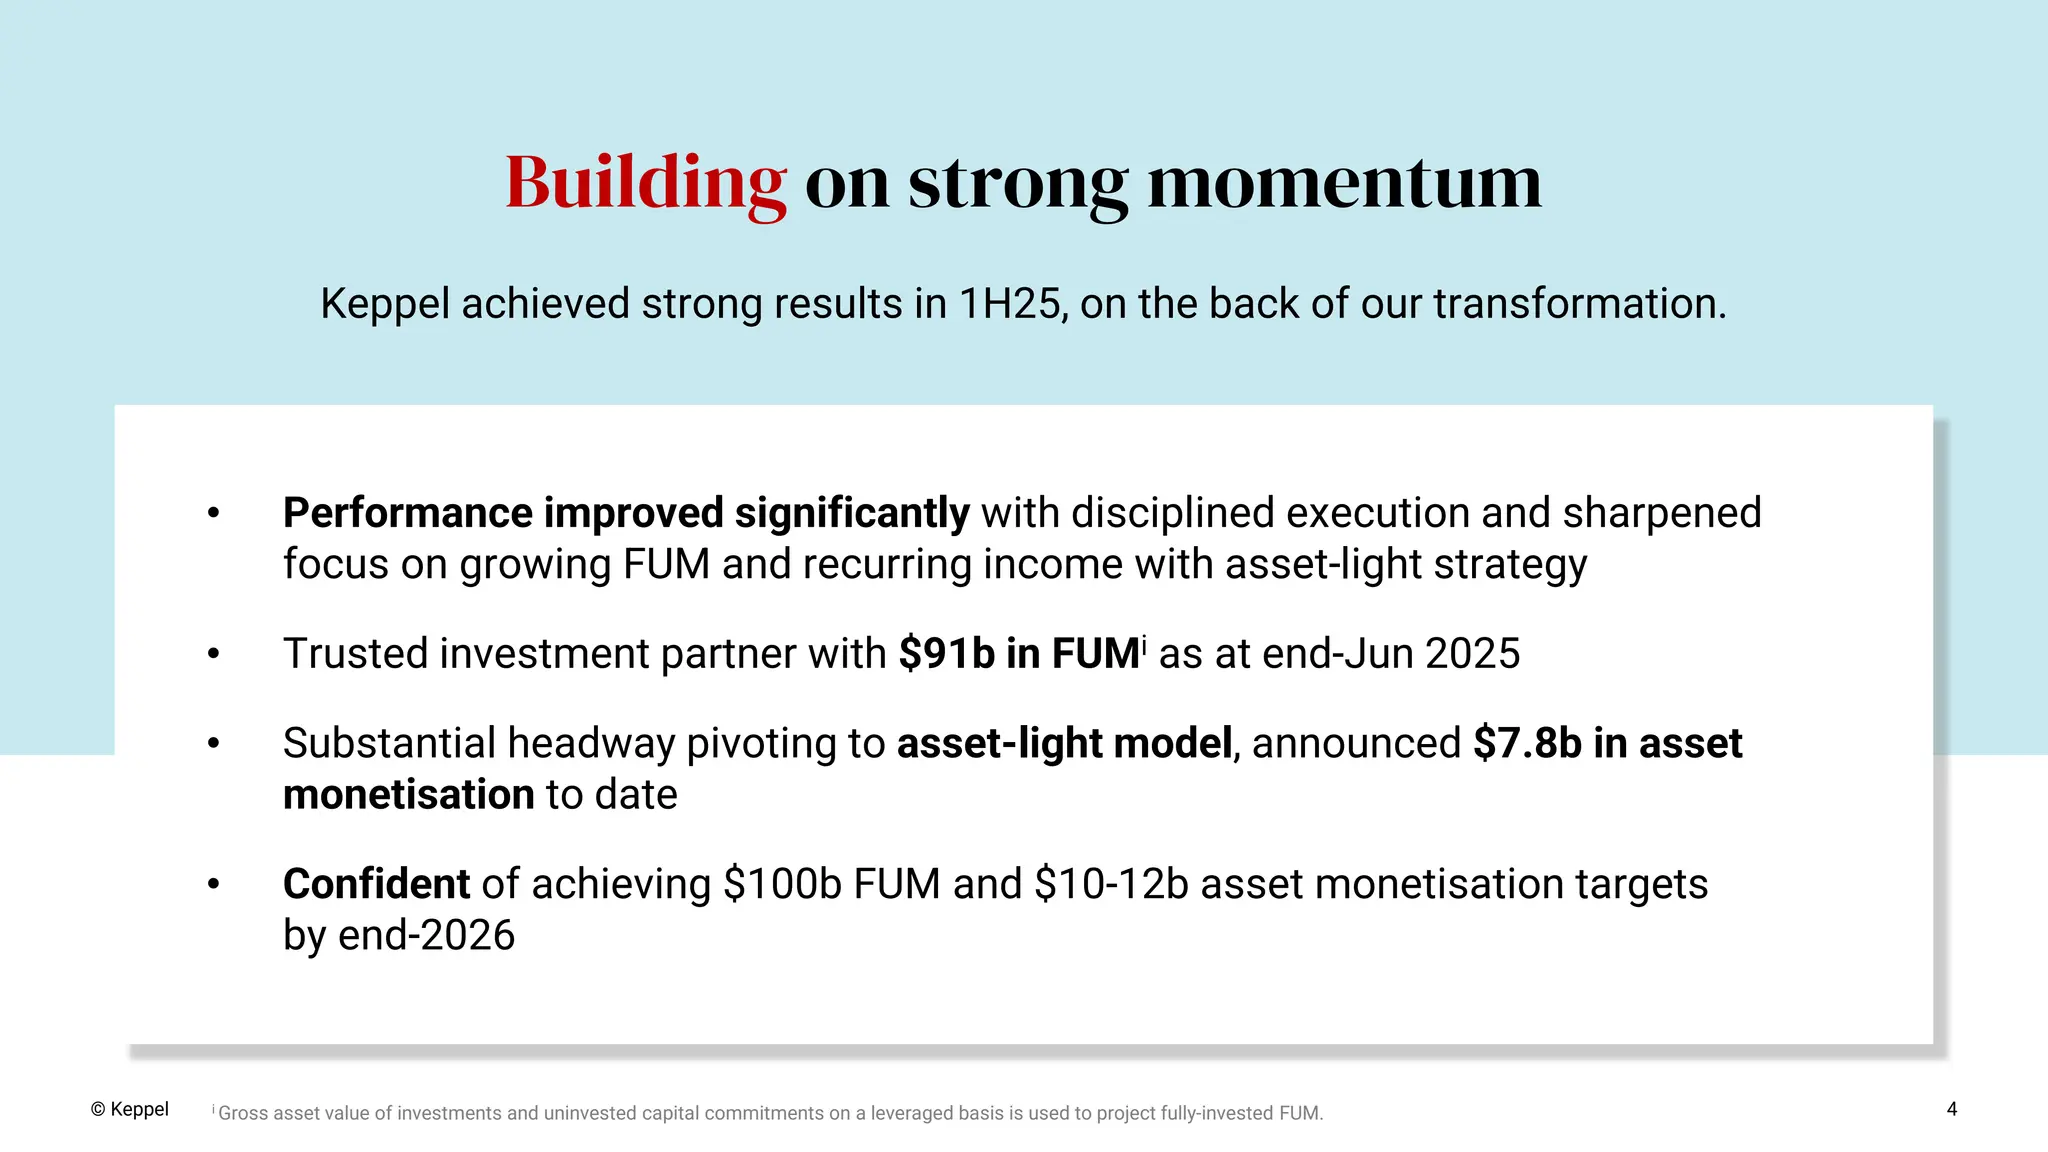
4 Building on strong
momentum © Keppel • Performance improved significantly with disciplined execution and sharpened focus on growing FUM and recurring income with asset-light strategy • Trusted investment partner with $91b in FUMi as at end-Jun 2025 • Substantial headway pivoting to asset-light model, announced $7.8b in asset monetisation to date • Confident of achieving $100b FUM and $10-12b asset monetisation targets by end-2026 Keppel achieved strong results in 1H25, on the back of our transformation. i Gross asset value of investments and uninvested capital commitments on a leveraged basis is used to project fully-invested FUM.
5.
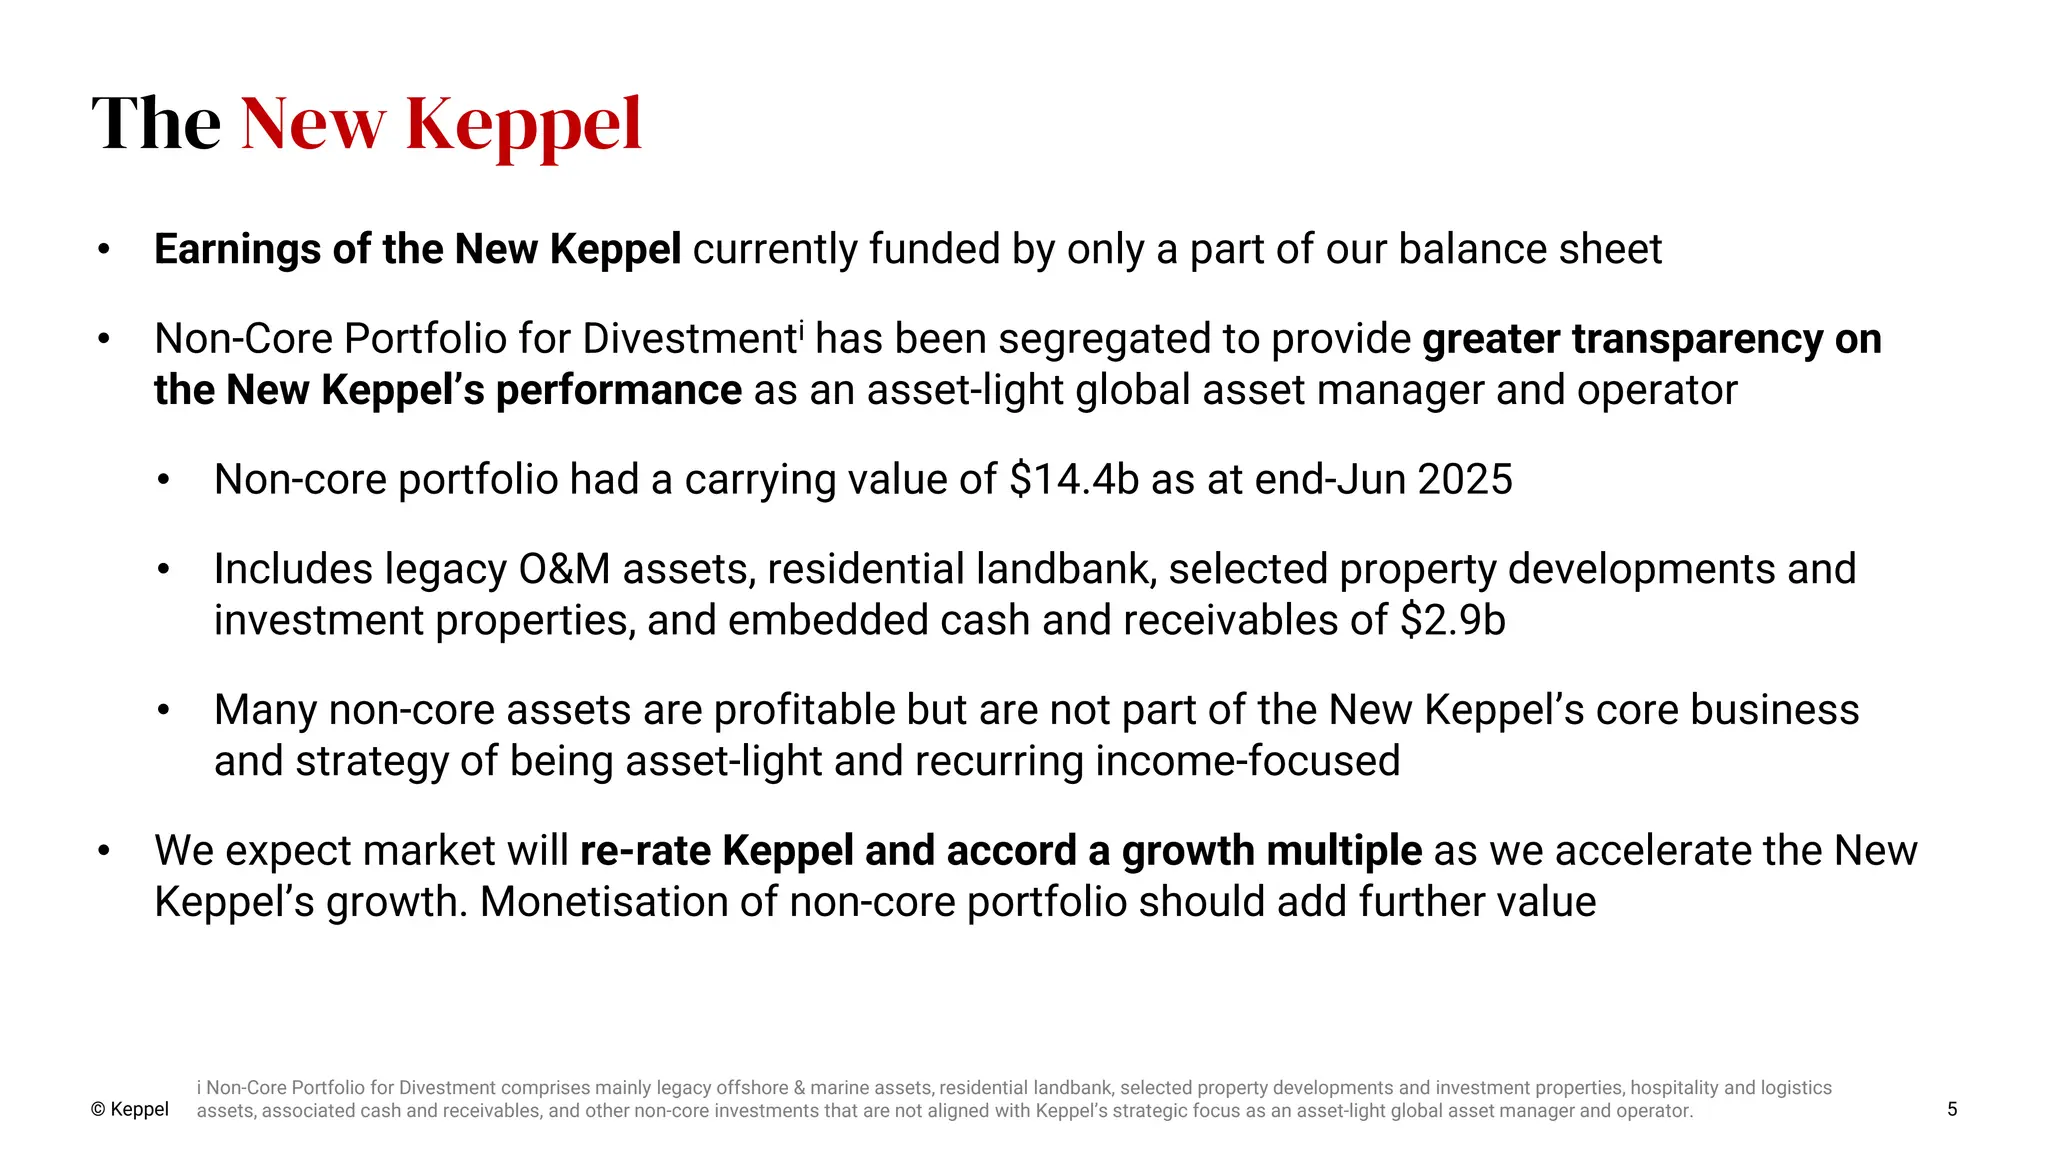
• Earnings of
the New Keppel currently funded by only a part of our balance sheet • Non-Core Portfolio for Divestmenti has been segregated to provide greater transparency on the New Keppel’s performance as an asset-light global asset manager and operator • Non-core portfolio had a carrying value of $14.4b as at end-Jun 2025 • Includes legacy O&M assets, residential landbank, selected property developments and investment properties, and embedded cash and receivables of $2.9b • Many non-core assets are profitable but are not part of the New Keppel’s core business and strategy of being asset-light and recurring income-focused • We expect market will re-rate Keppel and accord a growth multiple as we accelerate the New Keppel’s growth. Monetisation of non-core portfolio should add further value © Keppel 5 The New Keppel i Non-Core Portfolio for Divestment comprises mainly legacy offshore & marine assets, residential landbank, selected property developments and investment properties, hospitality and logistics assets, associated cash and receivables, and other non-core investments that are not aligned with Keppel’s strategic focus as an asset-light global asset manager and operator.
6.
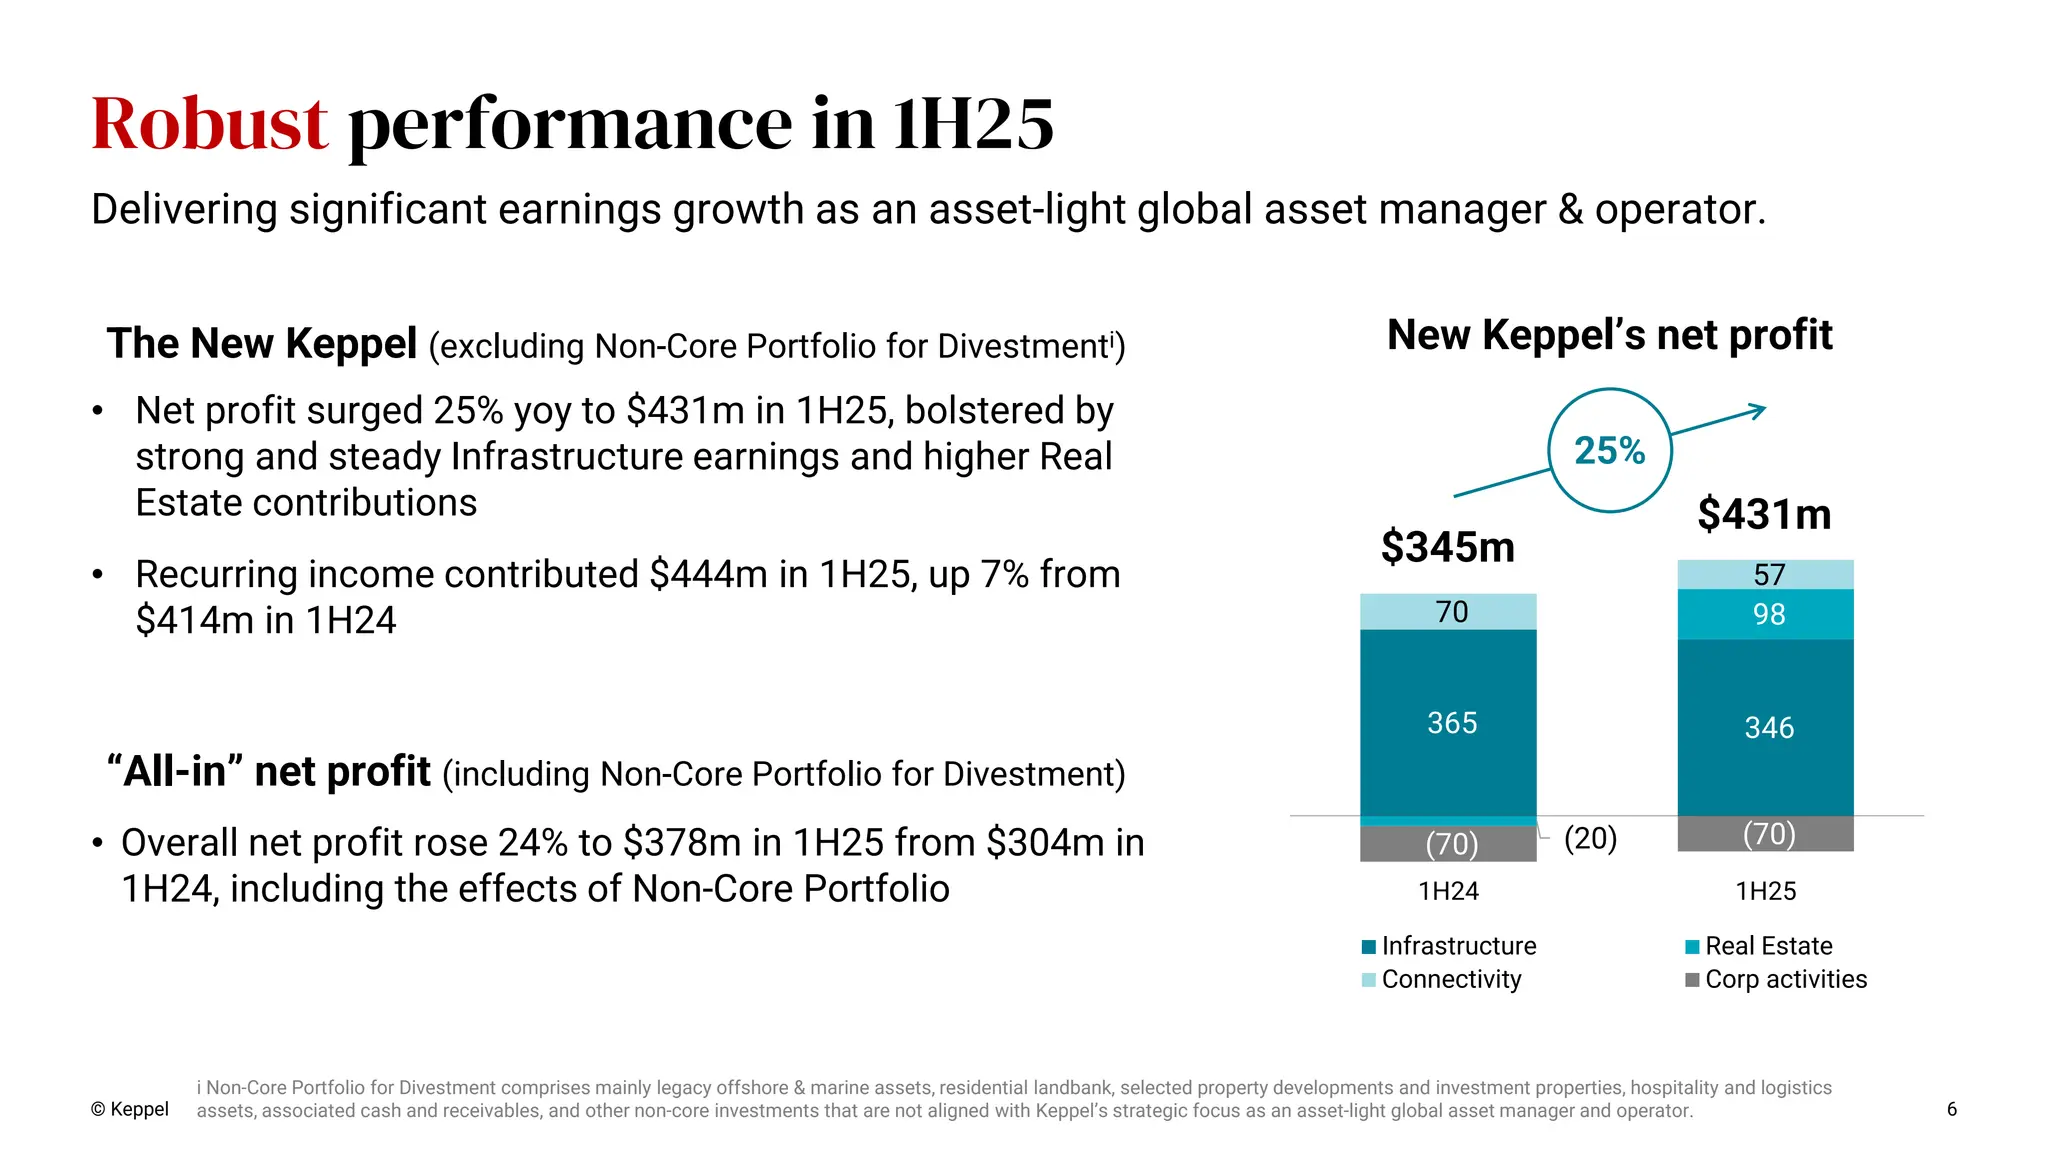
• Net profit
surged 25% yoy to $431m in 1H25, bolstered by strong and steady Infrastructure earnings and higher Real Estate contributions • Recurring income contributed $444m in 1H25, up 7% from $414m in 1H24 © Keppel 6 365 346 (20) 98 70 57 (70) (70) 1H24 1H25 Infrastructure Real Estate Connectivity Corp activities $431m $345m 25% The New Keppel (excluding Non-Core Portfolio for Divestmenti) Robust performance in 1H25 New Keppel’s net profit • Overall net profit rose 24% to $378m in 1H25 from $304m in 1H24, including the effects of Non-Core Portfolio “All-in” net profit (including Non-Core Portfolio for Divestment) Delivering significant earnings growth as an asset-light global asset manager & operator. i Non-Core Portfolio for Divestment comprises mainly legacy offshore & marine assets, residential landbank, selected property developments and investment properties, hospitality and logistics assets, associated cash and receivables, and other non-core investments that are not aligned with Keppel’s strategic focus as an asset-light global asset manager and operator.
7.
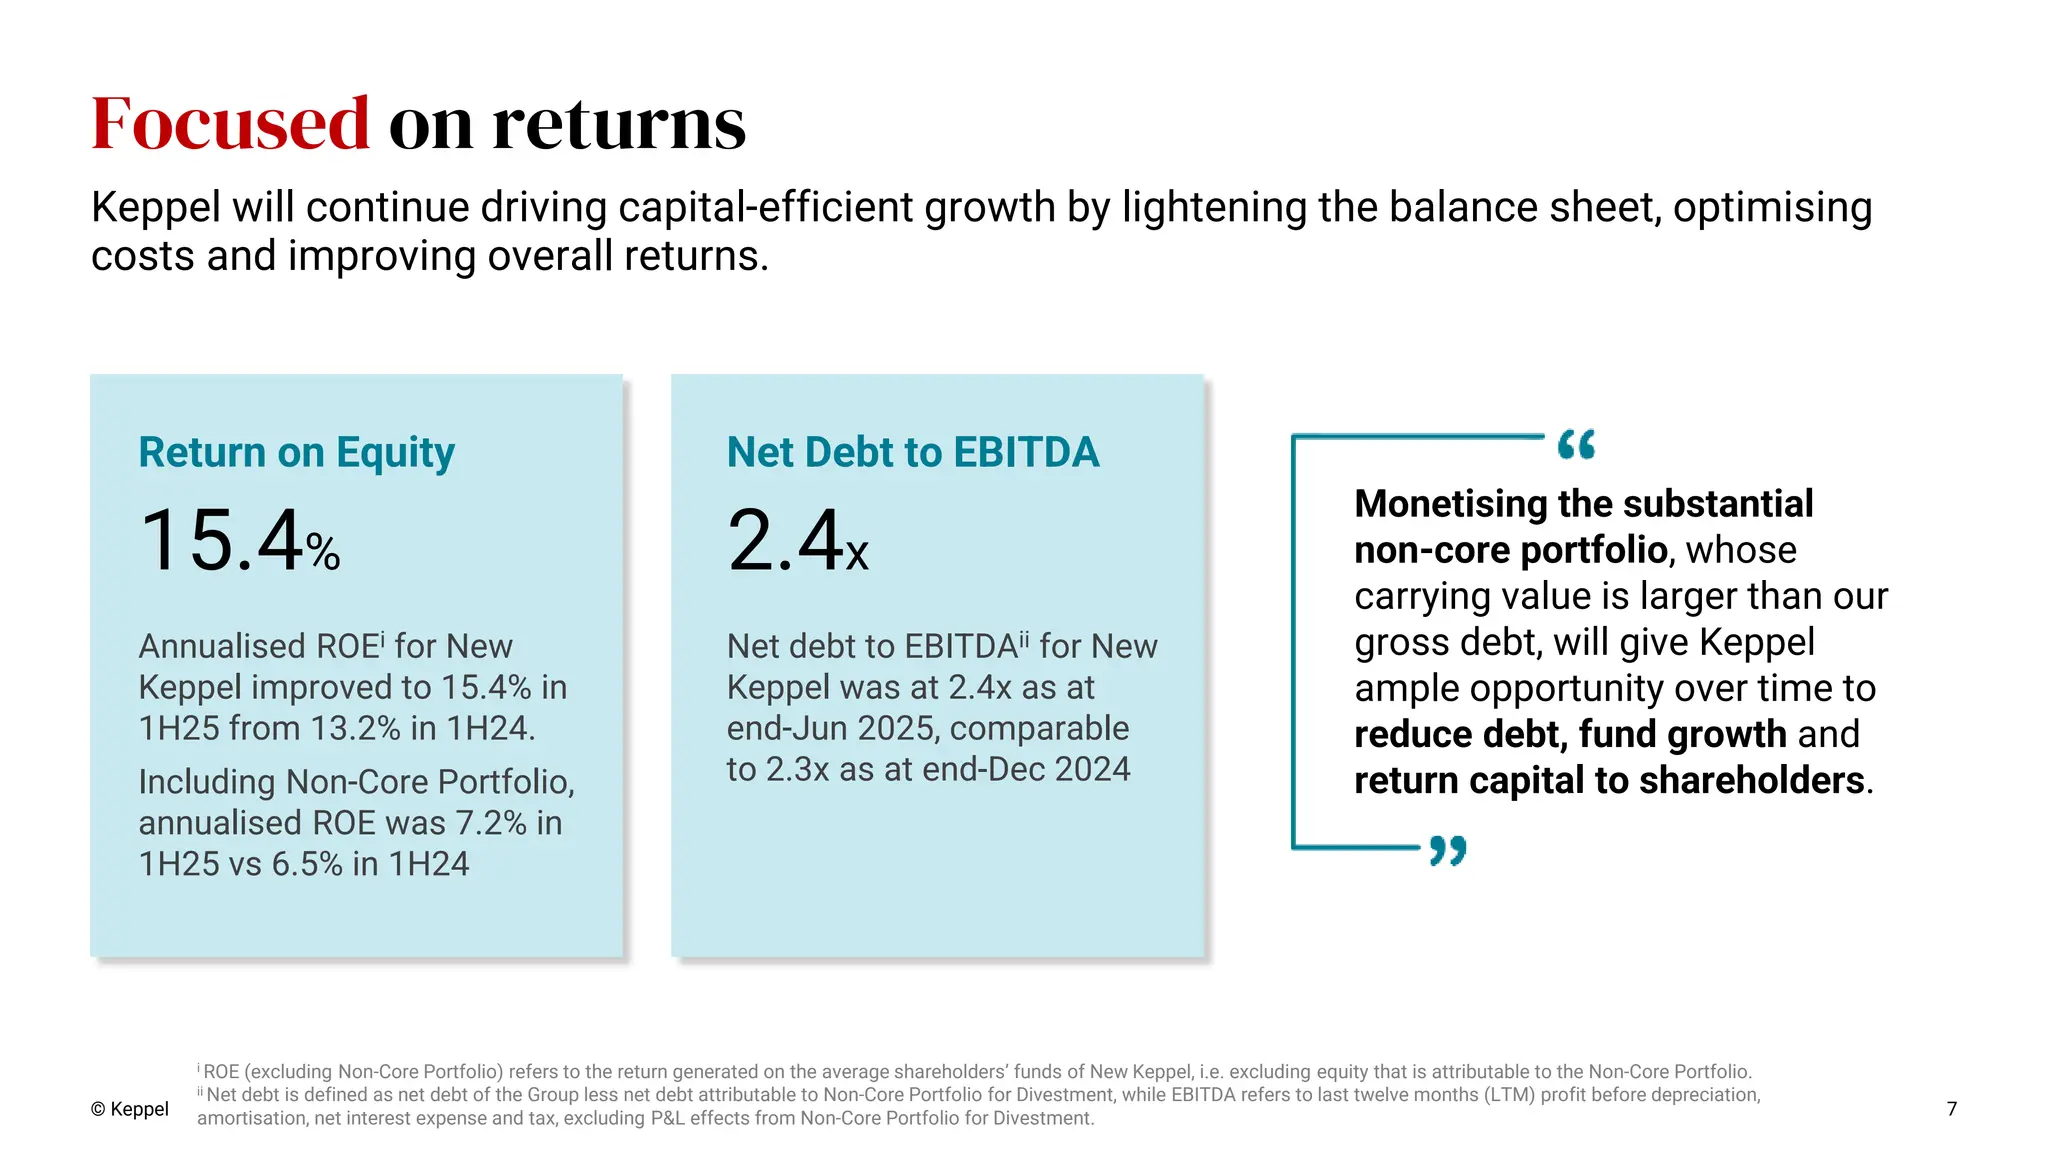
© Keppel 7 Focused
on returns 15.4% Return on Equity Annualised ROEi for New Keppel improved to 15.4% in 1H25 from 13.2% in 1H24. Including Non-Core Portfolio, annualised ROE was 7.2% in 1H25 vs 6.5% in 1H24 2.4x Net Debt to EBITDA Net debt to EBITDAii for New Keppel was at 2.4x as at end-Jun 2025, comparable to 2.3x as at end-Dec 2024 i ROE (excluding Non-Core Portfolio) refers to the return generated on the average shareholders’ funds of New Keppel, i.e. excluding equity that is attributable to the Non-Core Portfolio. ii Net debt is defined as net debt of the Group less net debt attributable to Non-Core Portfolio for Divestment, while EBITDA refers to last twelve months (LTM) profit before depreciation, amortisation, net interest expense and tax, excluding P&L effects from Non-Core Portfolio for Divestment. Keppel will continue driving capital-efficient growth by lightening the balance sheet, optimising costs and improving overall returns. Monetising the substantial non-core portfolio, whose carrying value is larger than our gross debt, will give Keppel ample opportunity over time to reduce debt, fund growth and return capital to shareholders.
8.
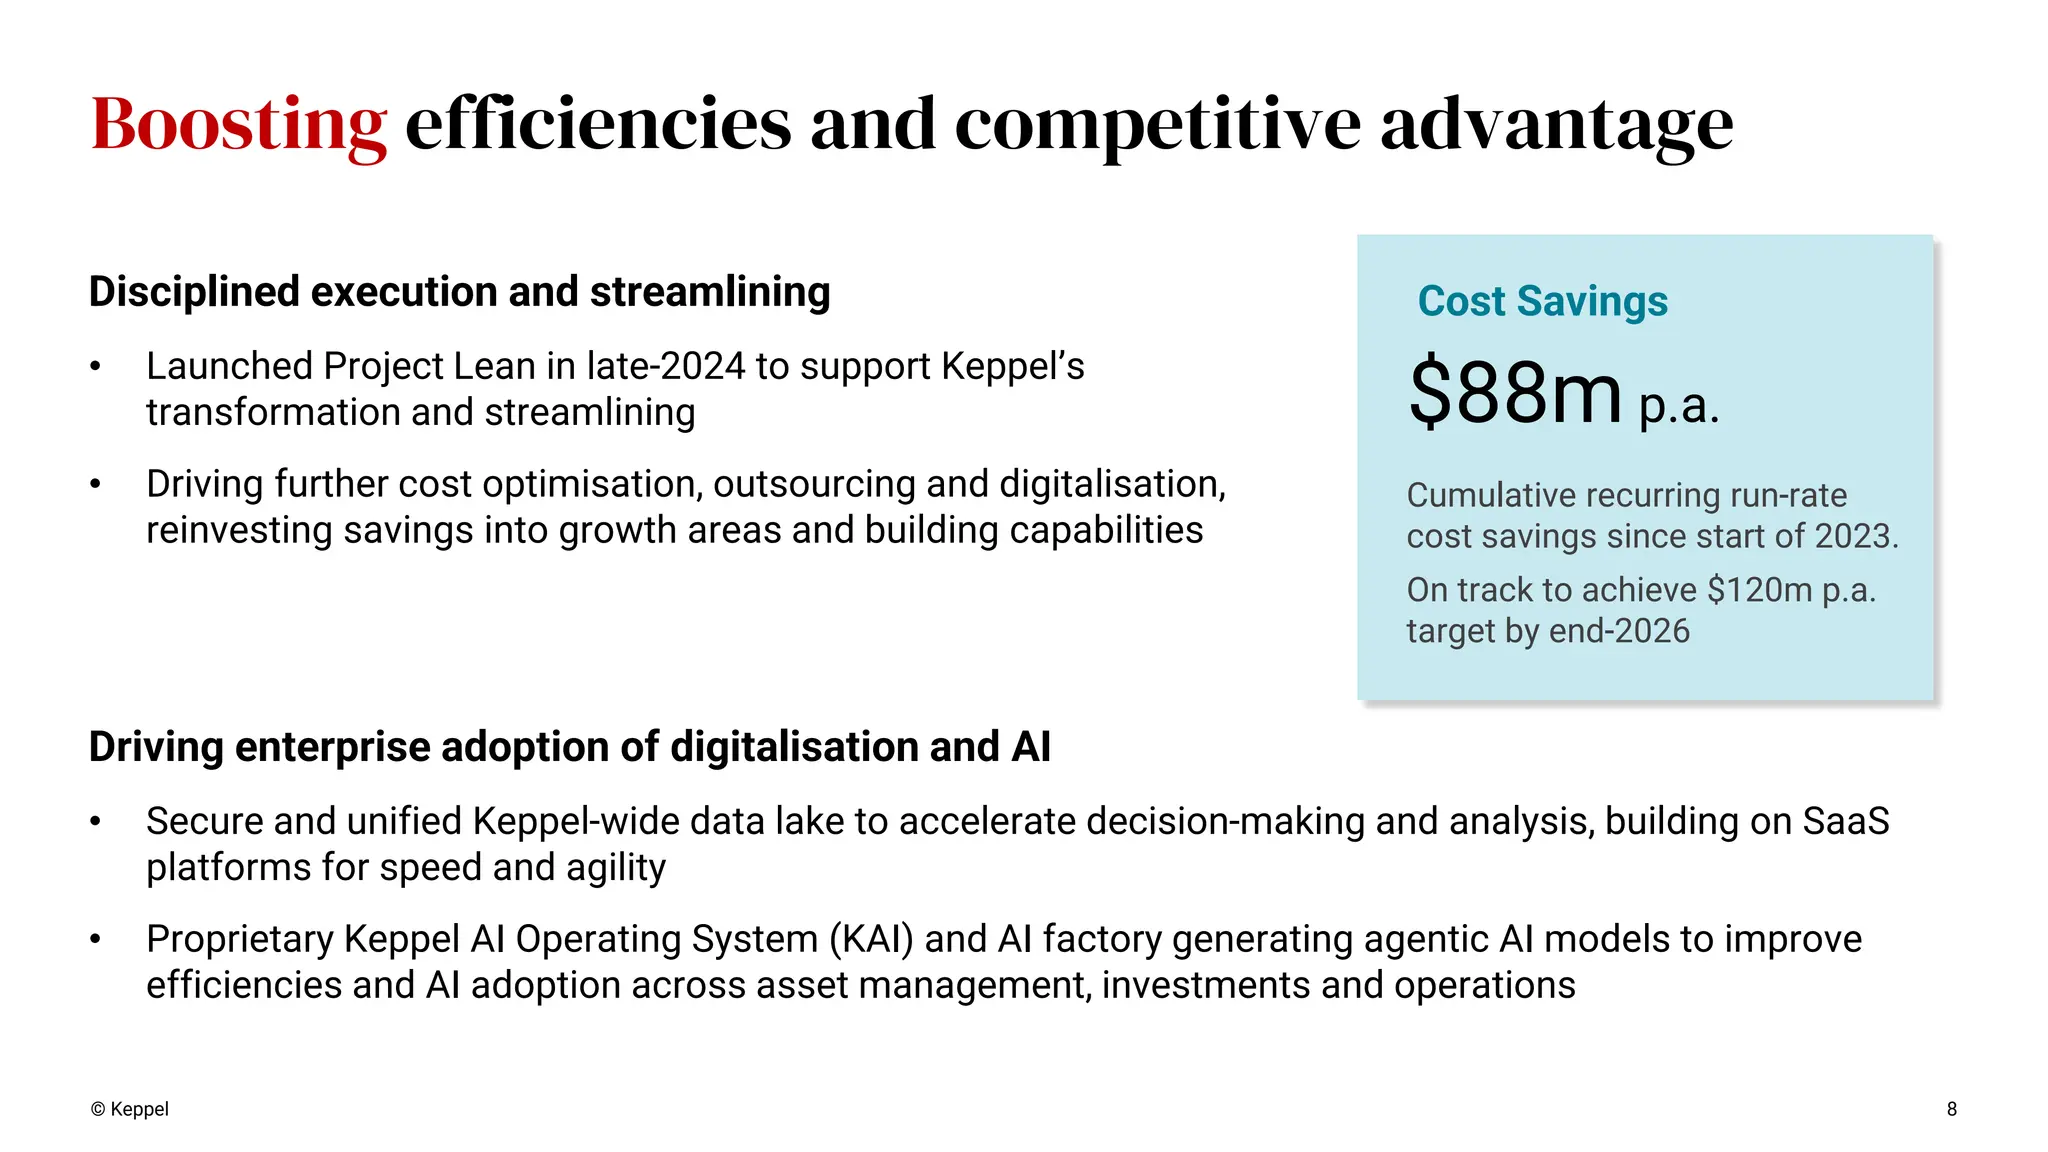
© Keppel 8 Boosting
efficiencies and competitive advantage Driving enterprise adoption of digitalisation and AI • Secure and unified Keppel-wide data lake to accelerate decision-making and analysis, building on SaaS platforms for speed and agility • Proprietary Keppel AI Operating System (KAI) and AI factory generating agentic AI models to improve efficiencies and AI adoption across asset management, investments and operations $88m p.a. Cost Savings Cumulative recurring run-rate cost savings since start of 2023. On track to achieve $120m p.a. target by end-2026 Disciplined execution and streamlining • Launched Project Lean in late-2024 to support Keppel’s transformation and streamlining • Driving further cost optimisation, outsourcing and digitalisation, reinvesting savings into growth areas and building capabilities
9.
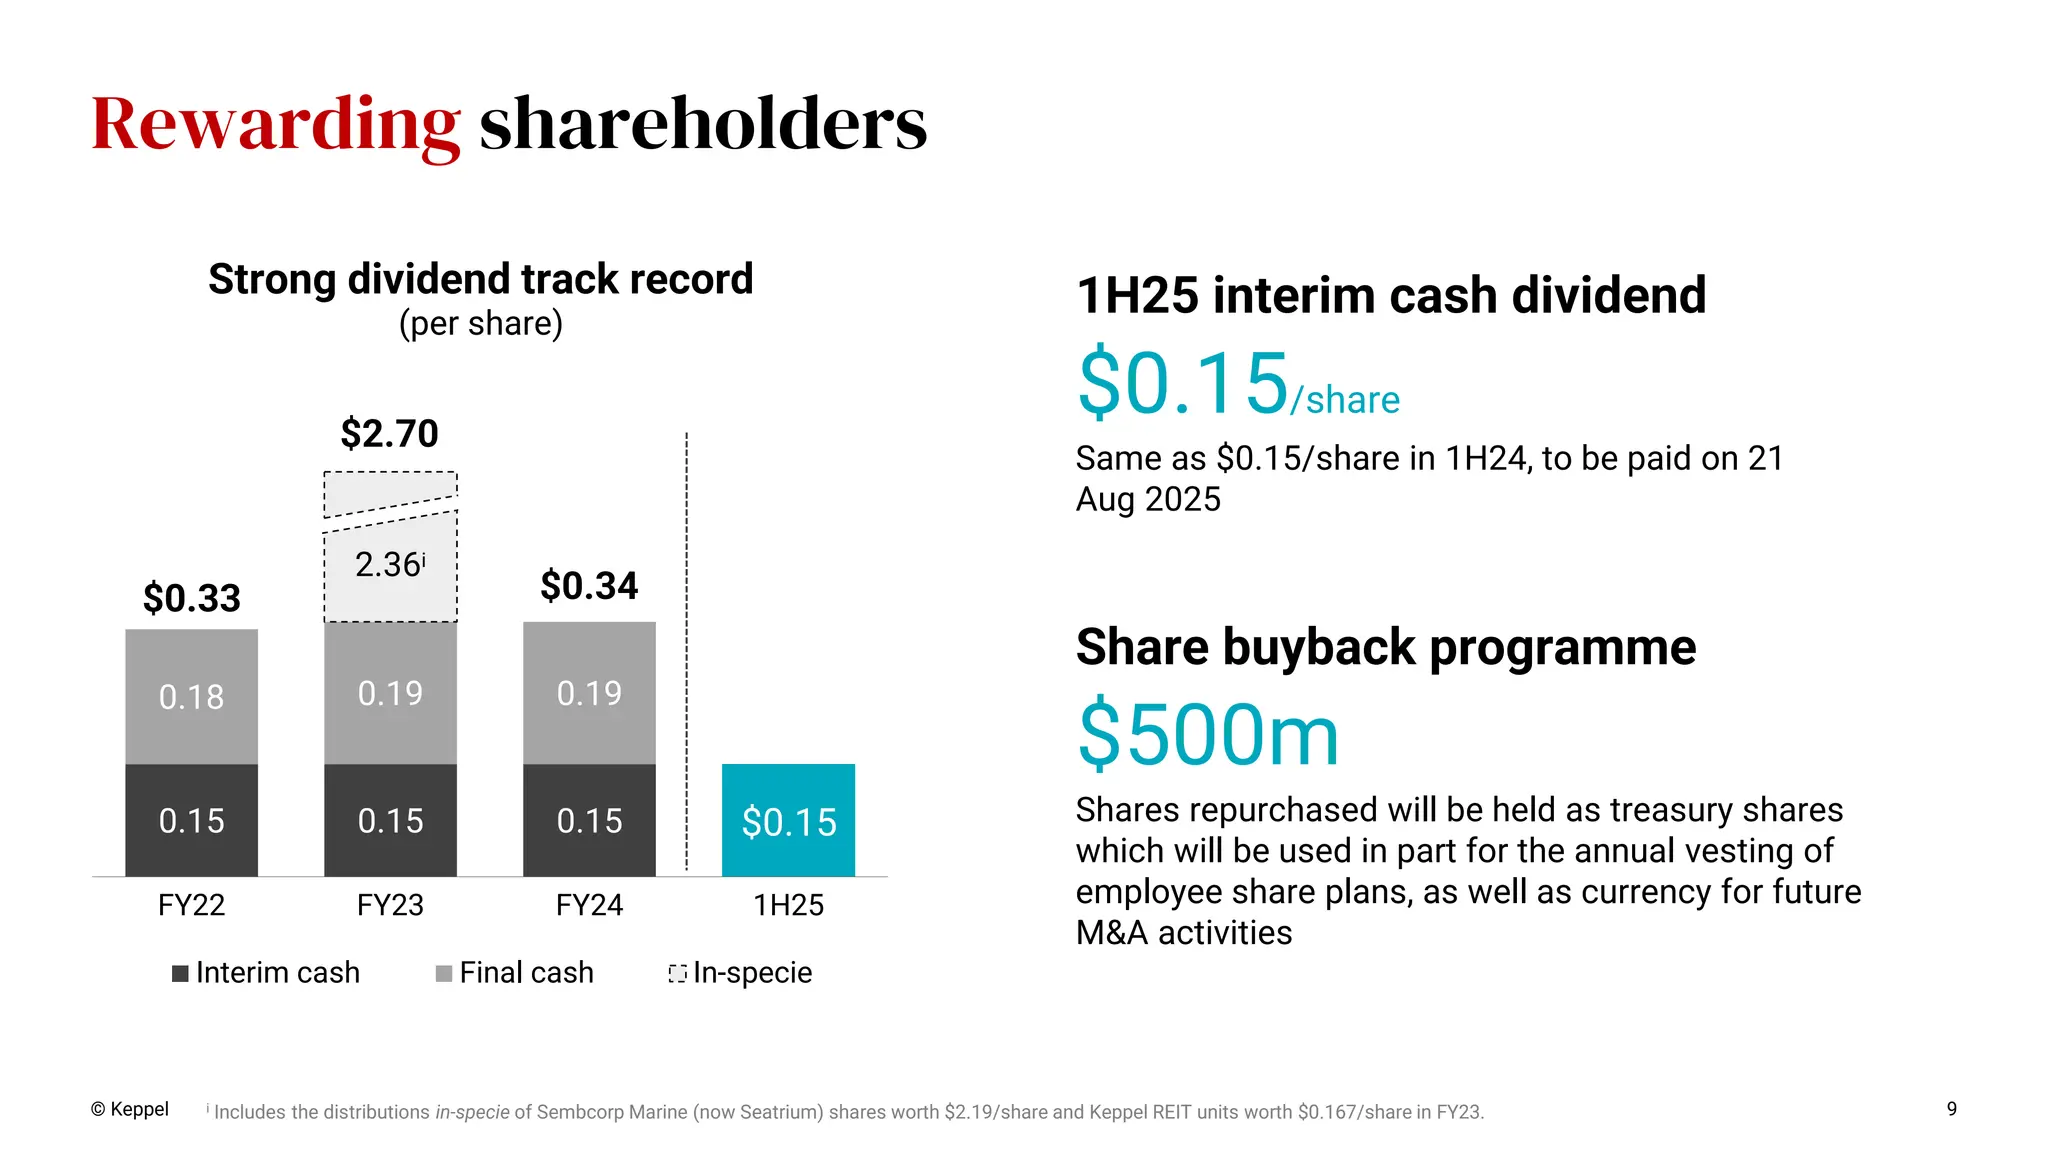
© Keppel 9 Rewarding
shareholders i Includes the distributions in-specie of Sembcorp Marine (now Seatrium) shares worth $2.19/share and Keppel REIT units worth $0.167/share in FY23. 0.15 0.15 0.15 0.18 0.19 0.19 2.36i FY22 FY23 FY24 1H25 Interim cash Final cash In-specie $0.33 $2.70 $0.34 Strong dividend track record (per share) $0.15 $0.15/share Same as $0.15/share in 1H24, to be paid on 21 Aug 2025 1H25 interim cash dividend $500m Shares repurchased will be held as treasury shares which will be used in part for the annual vesting of employee share plans, as well as currency for future M&A activities Share buyback programme
10.
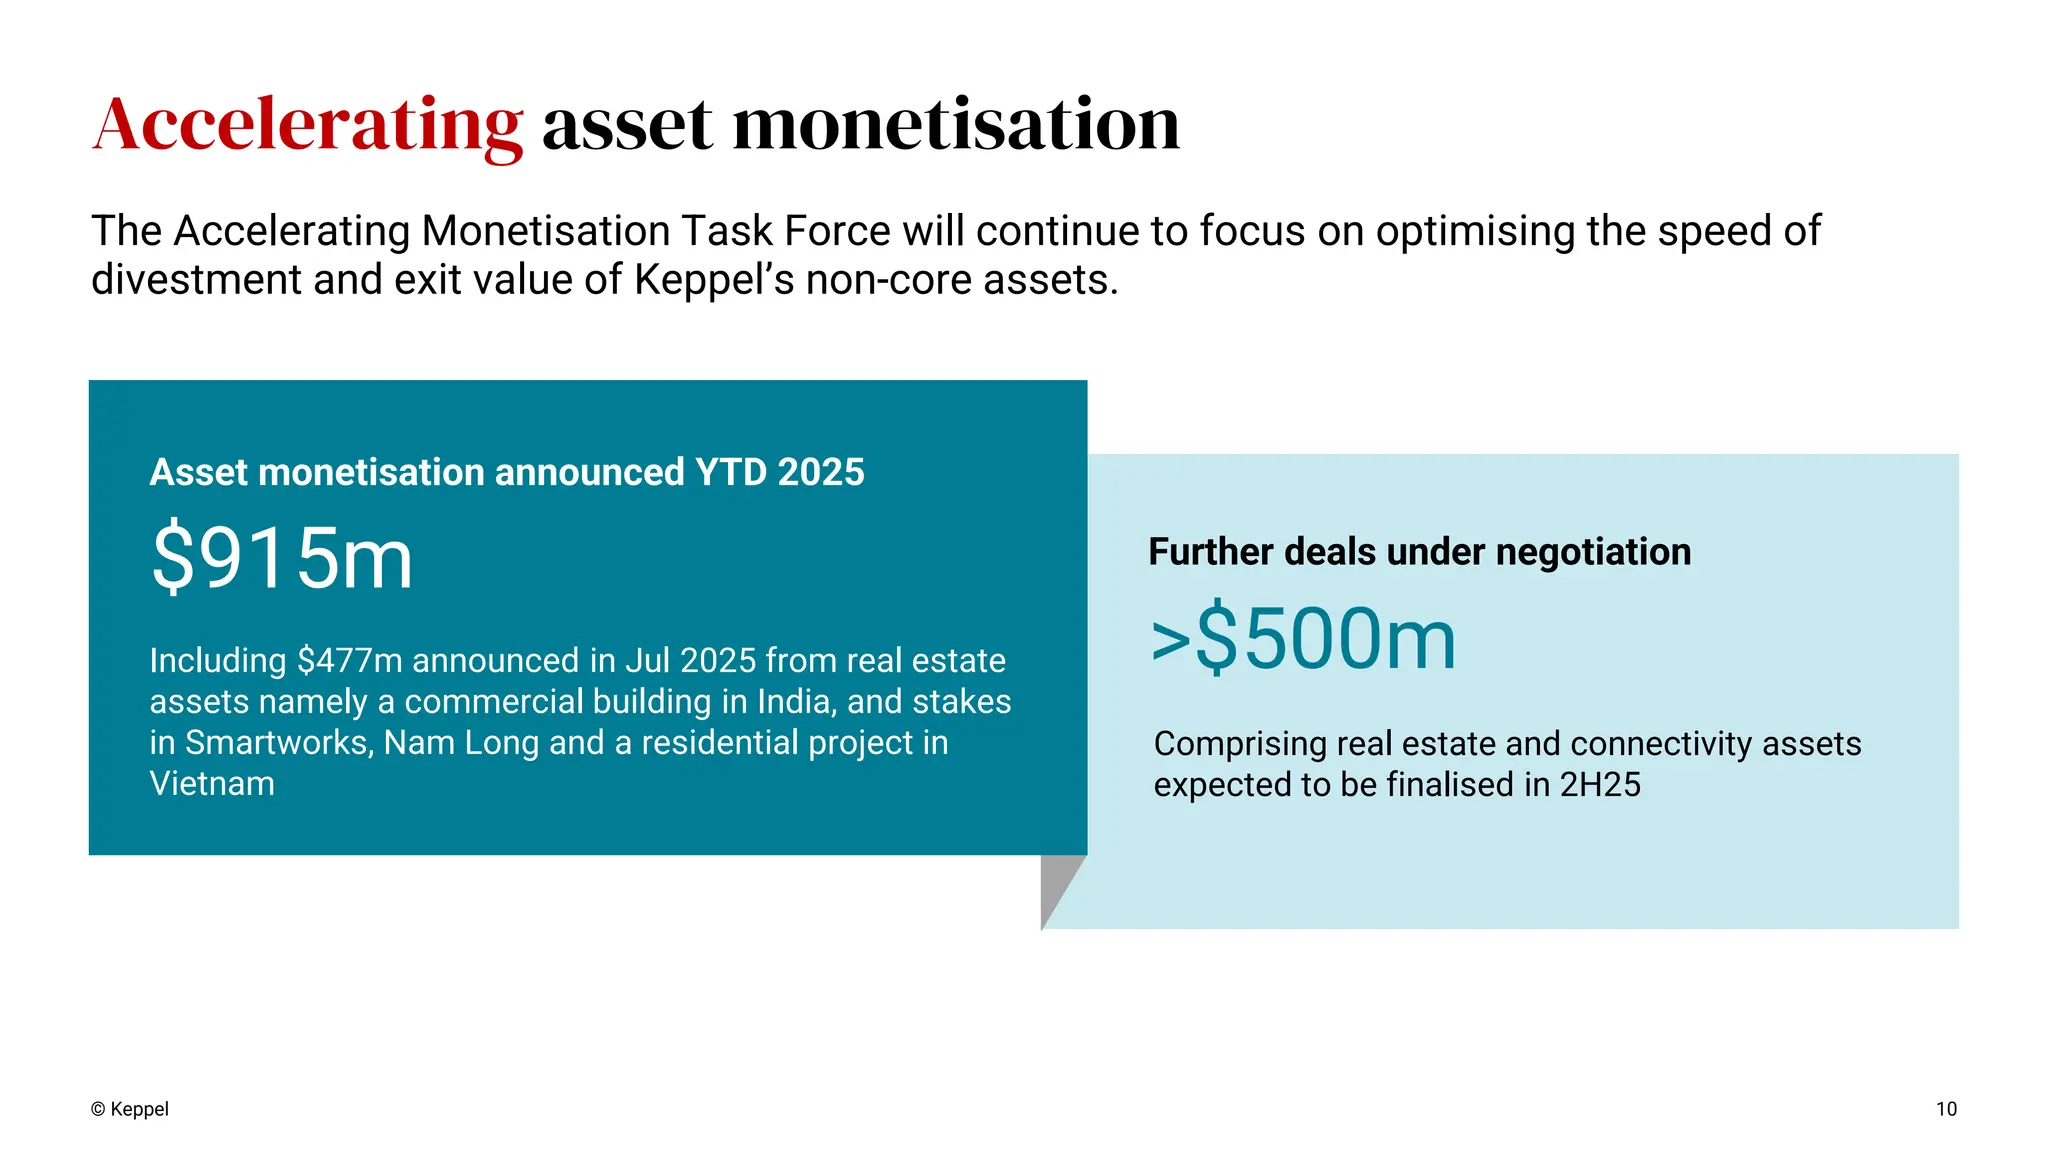
Accelerating asset monetisation ©
Keppel 10 Comprising real estate and connectivity assets expected to be finalised in 2H25 The Accelerating Monetisation Task Force will continue to focus on optimising the speed of divestment and exit value of Keppel’s non-core assets. Further deals under negotiation >$500m Including $477m announced in Jul 2025 from real estate assets namely a commercial building in India, and stakes in Smartworks, Nam Long and a residential project in Vietnam Asset monetisation announced YTD 2025 $915m
11.
Growing asset management
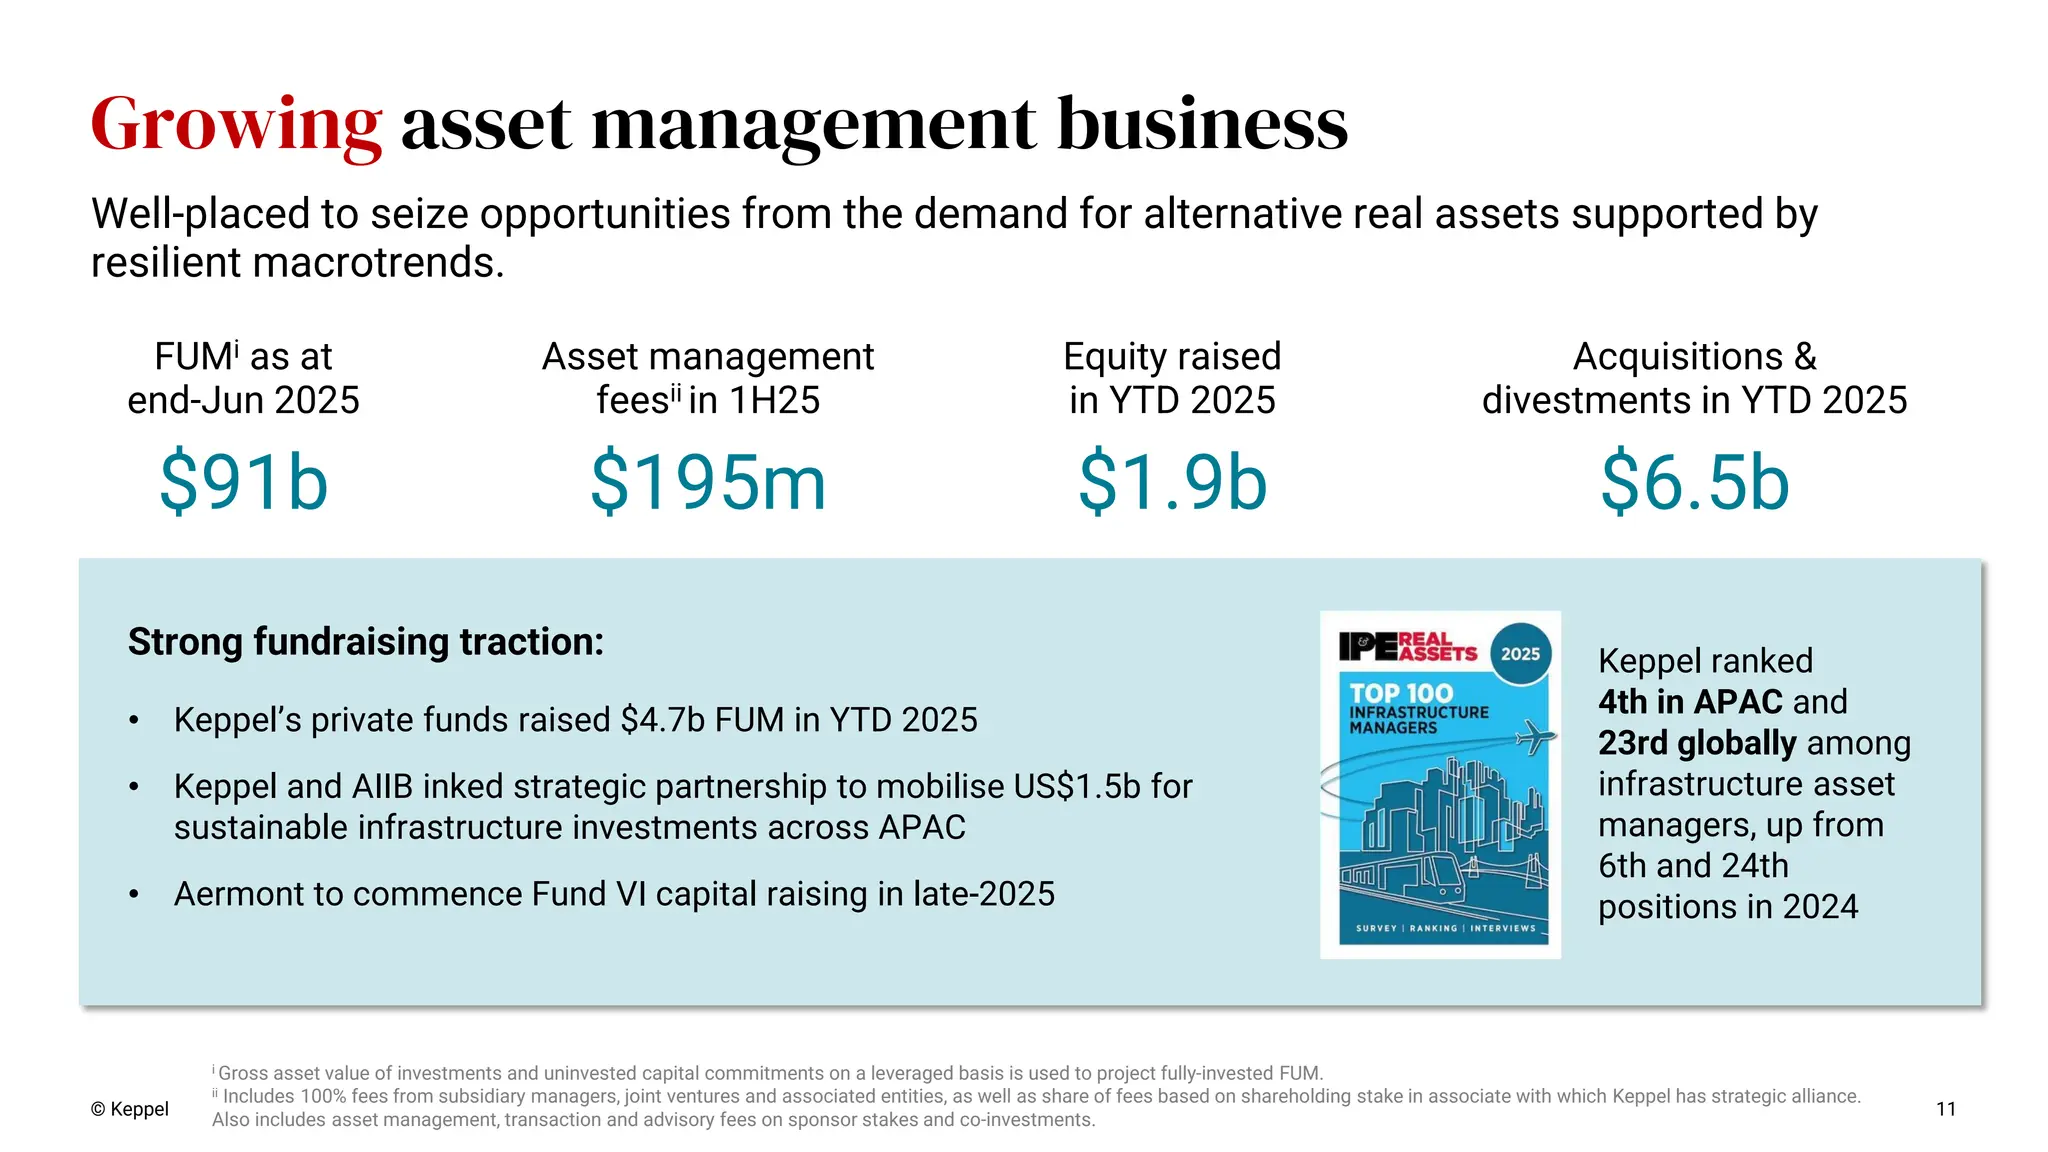
business © Keppel 11 i Gross asset value of investments and uninvested capital commitments on a leveraged basis is used to project fully-invested FUM. ii Includes 100% fees from subsidiary managers, joint ventures and associated entities, as well as share of fees based on shareholding stake in associate with which Keppel has strategic alliance. Also includes asset management, transaction and advisory fees on sponsor stakes and co-investments. $1.9b Equity raised in YTD 2025 $6.5b Acquisitions & divestments in YTD 2025 $195m Asset management feesii in 1H25 Well-placed to seize opportunities from the demand for alternative real assets supported by resilient macrotrends. • Keppel’s private funds raised $4.7b FUM in YTD 2025 • Keppel and AIIB inked strategic partnership to mobilise US$1.5b for sustainable infrastructure investments across APAC • Aermont to commence Fund VI capital raising in late-2025 $91b FUMi as at end-Jun 2025 Strong fundraising traction: Keppel ranked 4th in APAC and 23rd globally among infrastructure asset managers, up from 6th and 24th positions in 2024
12.
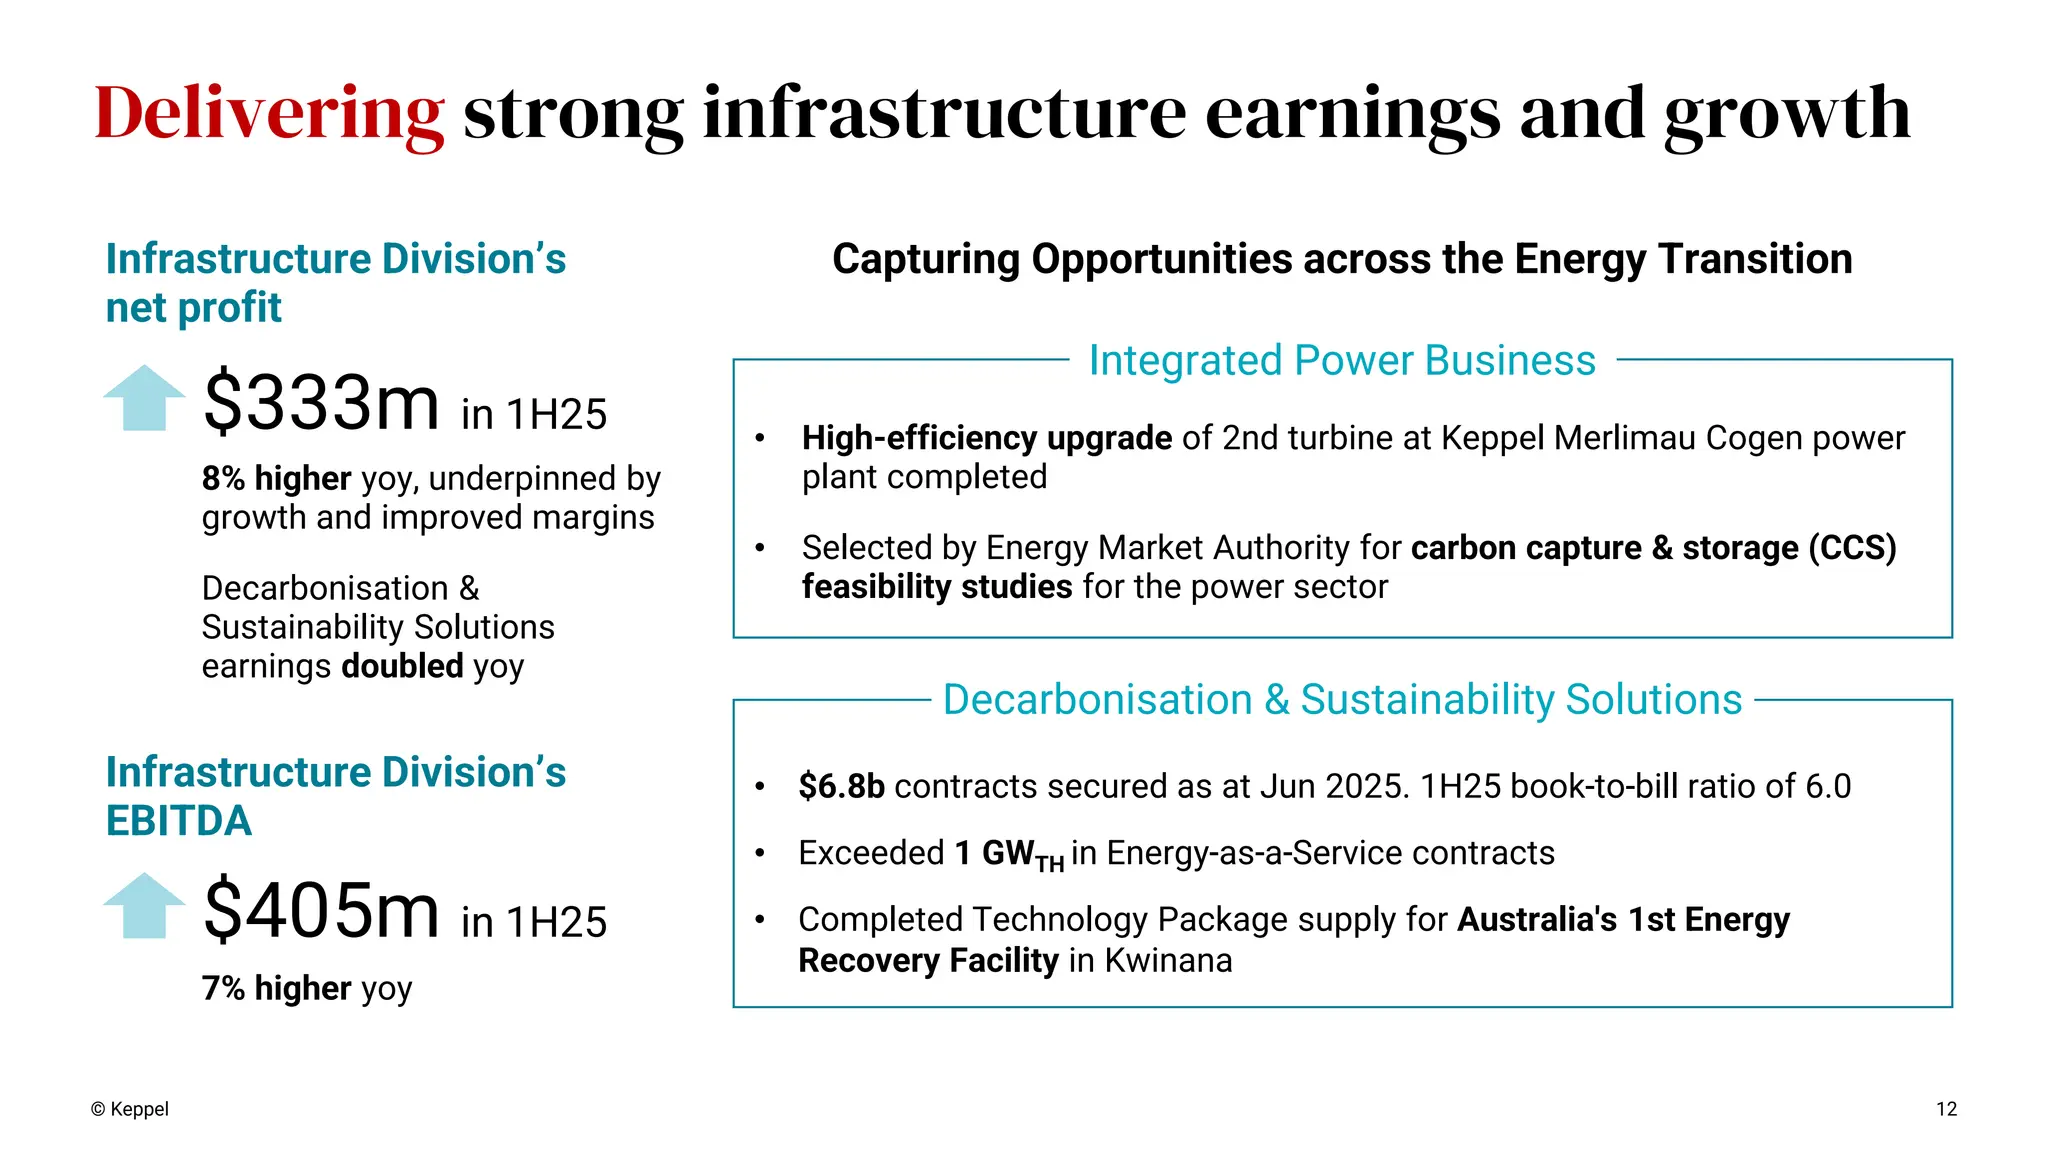
© Keppel 12 Delivering
strong infrastructure earnings and growth Infrastructure Division’s net profit Infrastructure Division’s EBITDA $333m in 1H25 $405m in 1H25 8% higher yoy, underpinned by growth and improved margins Decarbonisation & Sustainability Solutions earnings doubled yoy 7% higher yoy • $6.8b contracts secured as at Jun 2025. 1H25 book-to-bill ratio of 6.0 • Exceeded 1 GWTH in Energy-as-a-Service contracts • Completed Technology Package supply for Australia's 1st Energy Recovery Facility in Kwinana Capturing Opportunities across the Energy Transition Integrated Power Business • High-efficiency upgrade of 2nd turbine at Keppel Merlimau Cogen power plant completed • Selected by Energy Market Authority for carbon capture & storage (CCS) feasibility studies for the power sector Decarbonisation & Sustainability Solutions
13.
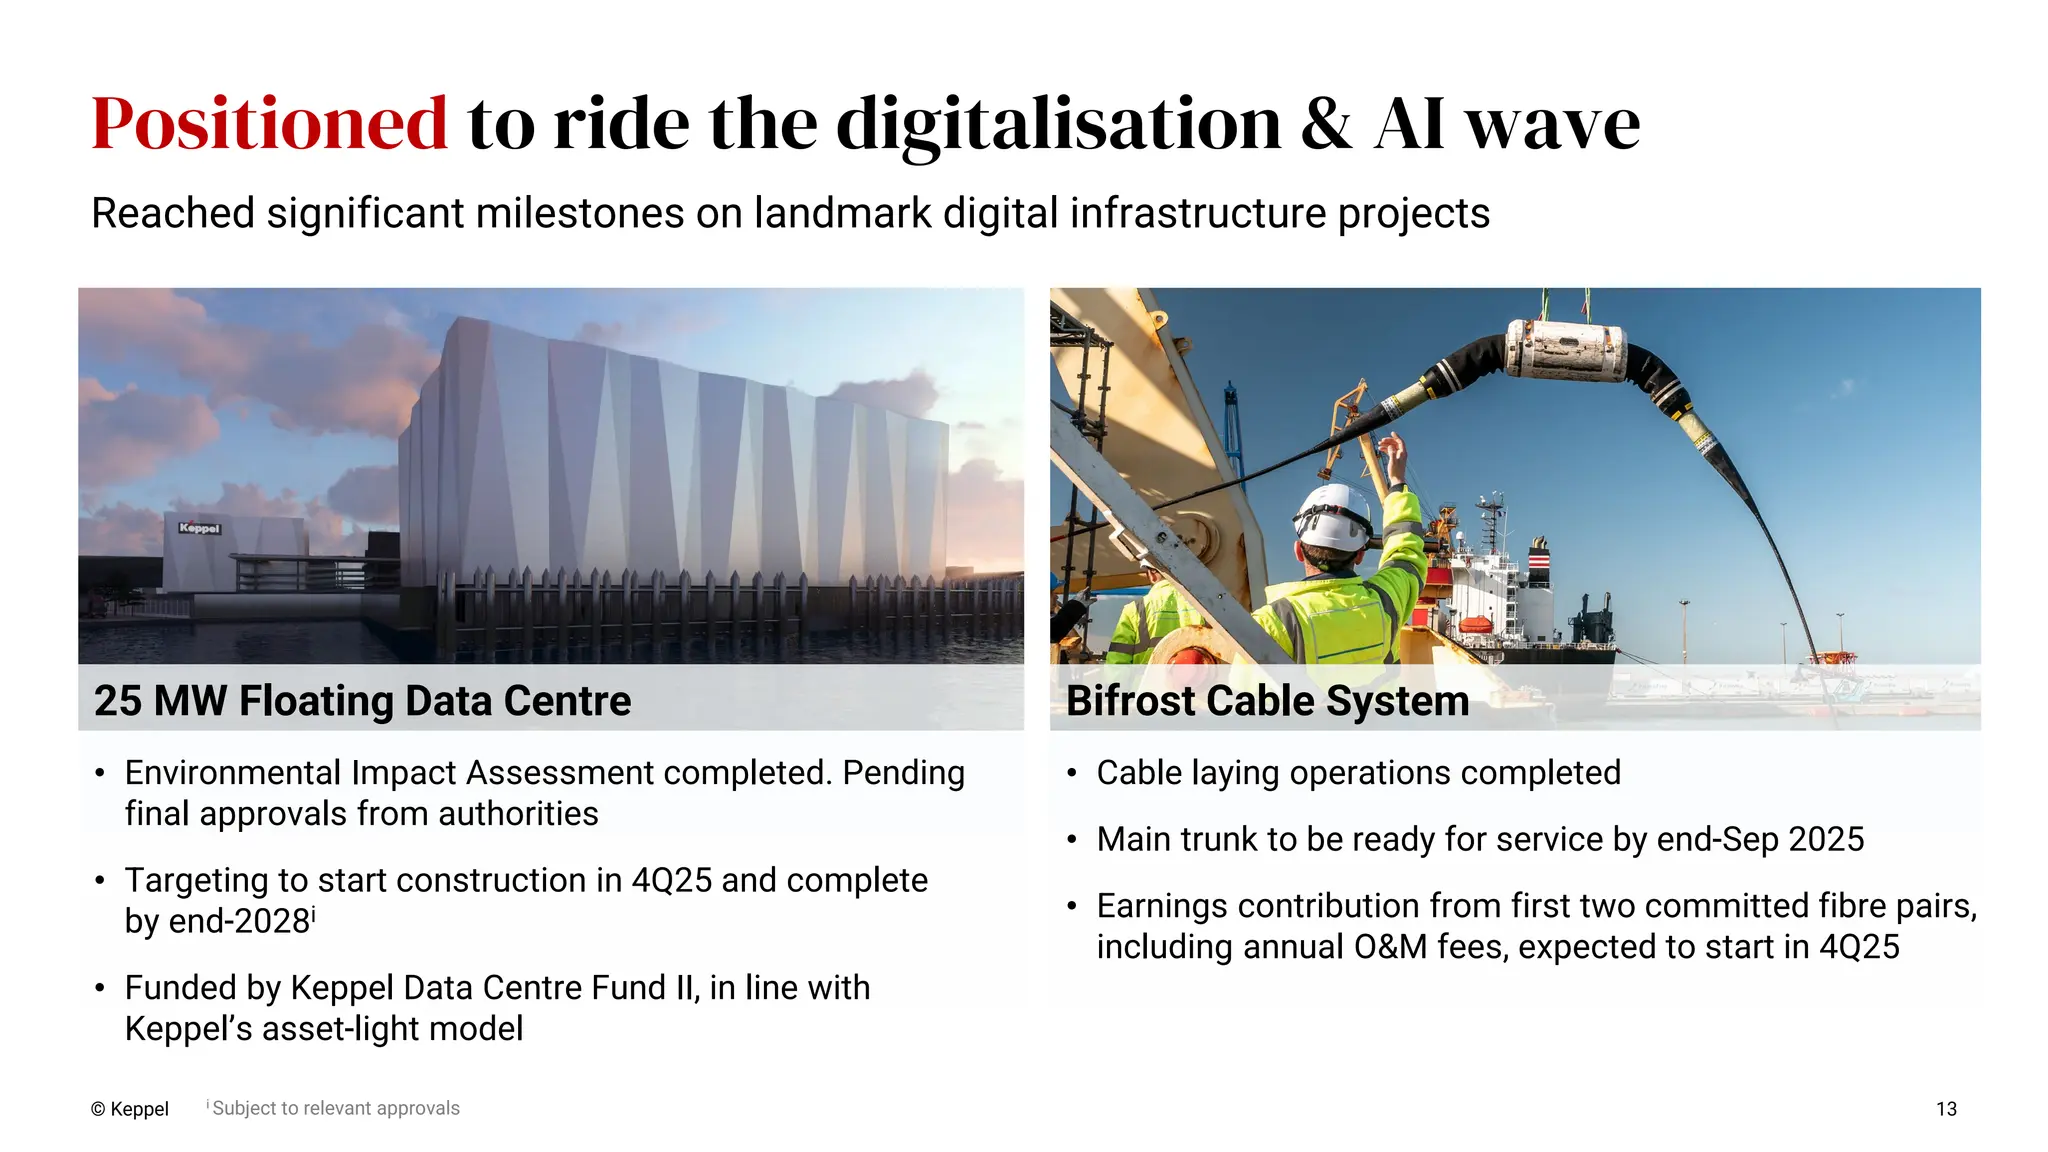
© Keppel 13 Positioned
to ride the digitalisation & AI wave i Subject to relevant approvals Bifrost Cable System • Cable laying operations completed • Main trunk to be ready for service by end-Sep 2025 • Earnings contribution from first two committed fibre pairs, including annual O&M fees, expected to start in 4Q25 25 MW Floating Data Centre • Environmental Impact Assessment completed. Pending final approvals from authorities • Targeting to start construction in 4Q25 and complete by end-2028i • Funded by Keppel Data Centre Fund II, in line with Keppel’s asset-light model Reached significant milestones on landmark digital infrastructure projects
14.
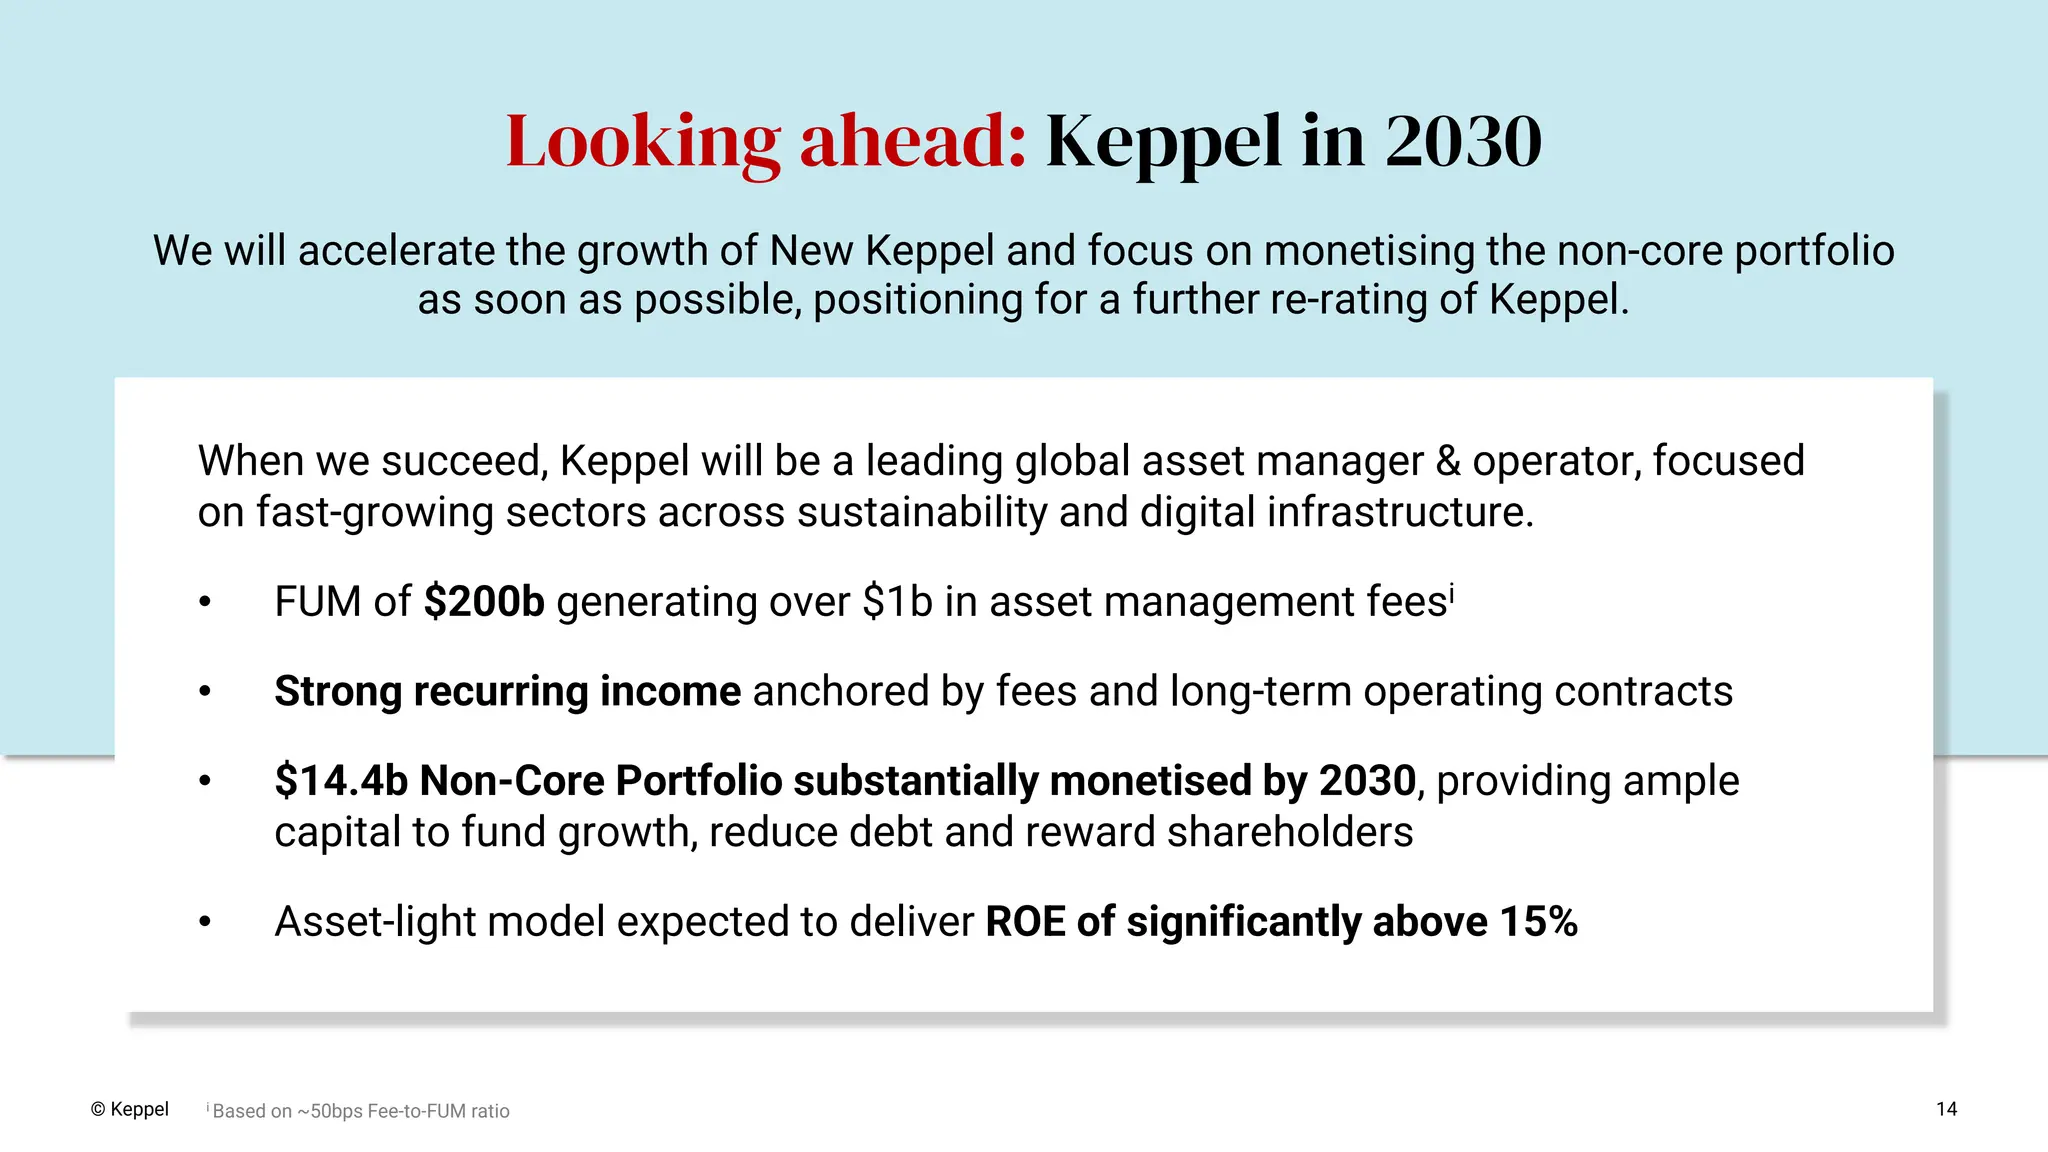
© Keppel 14 Looking
ahead: Keppel in 2030 We will accelerate the growth of New Keppel and focus on monetising the non-core portfolio as soon as possible, positioning for a further re-rating of Keppel. When we succeed, Keppel will be a leading global asset manager & operator, focused on fast-growing sectors across sustainability and digital infrastructure. • FUM of $200b generating over $1b in asset management feesi • Strong recurring income anchored by fees and long-term operating contracts • $14.4b Non-Core Portfolio substantially monetised by 2030, providing ample capital to fund growth, reduce debt and reward shareholders • Asset-light model expected to deliver ROE of significantly above 15% i Based on ~50bps Fee-to-FUM ratio
15.
Financial highlights 02 15
16.
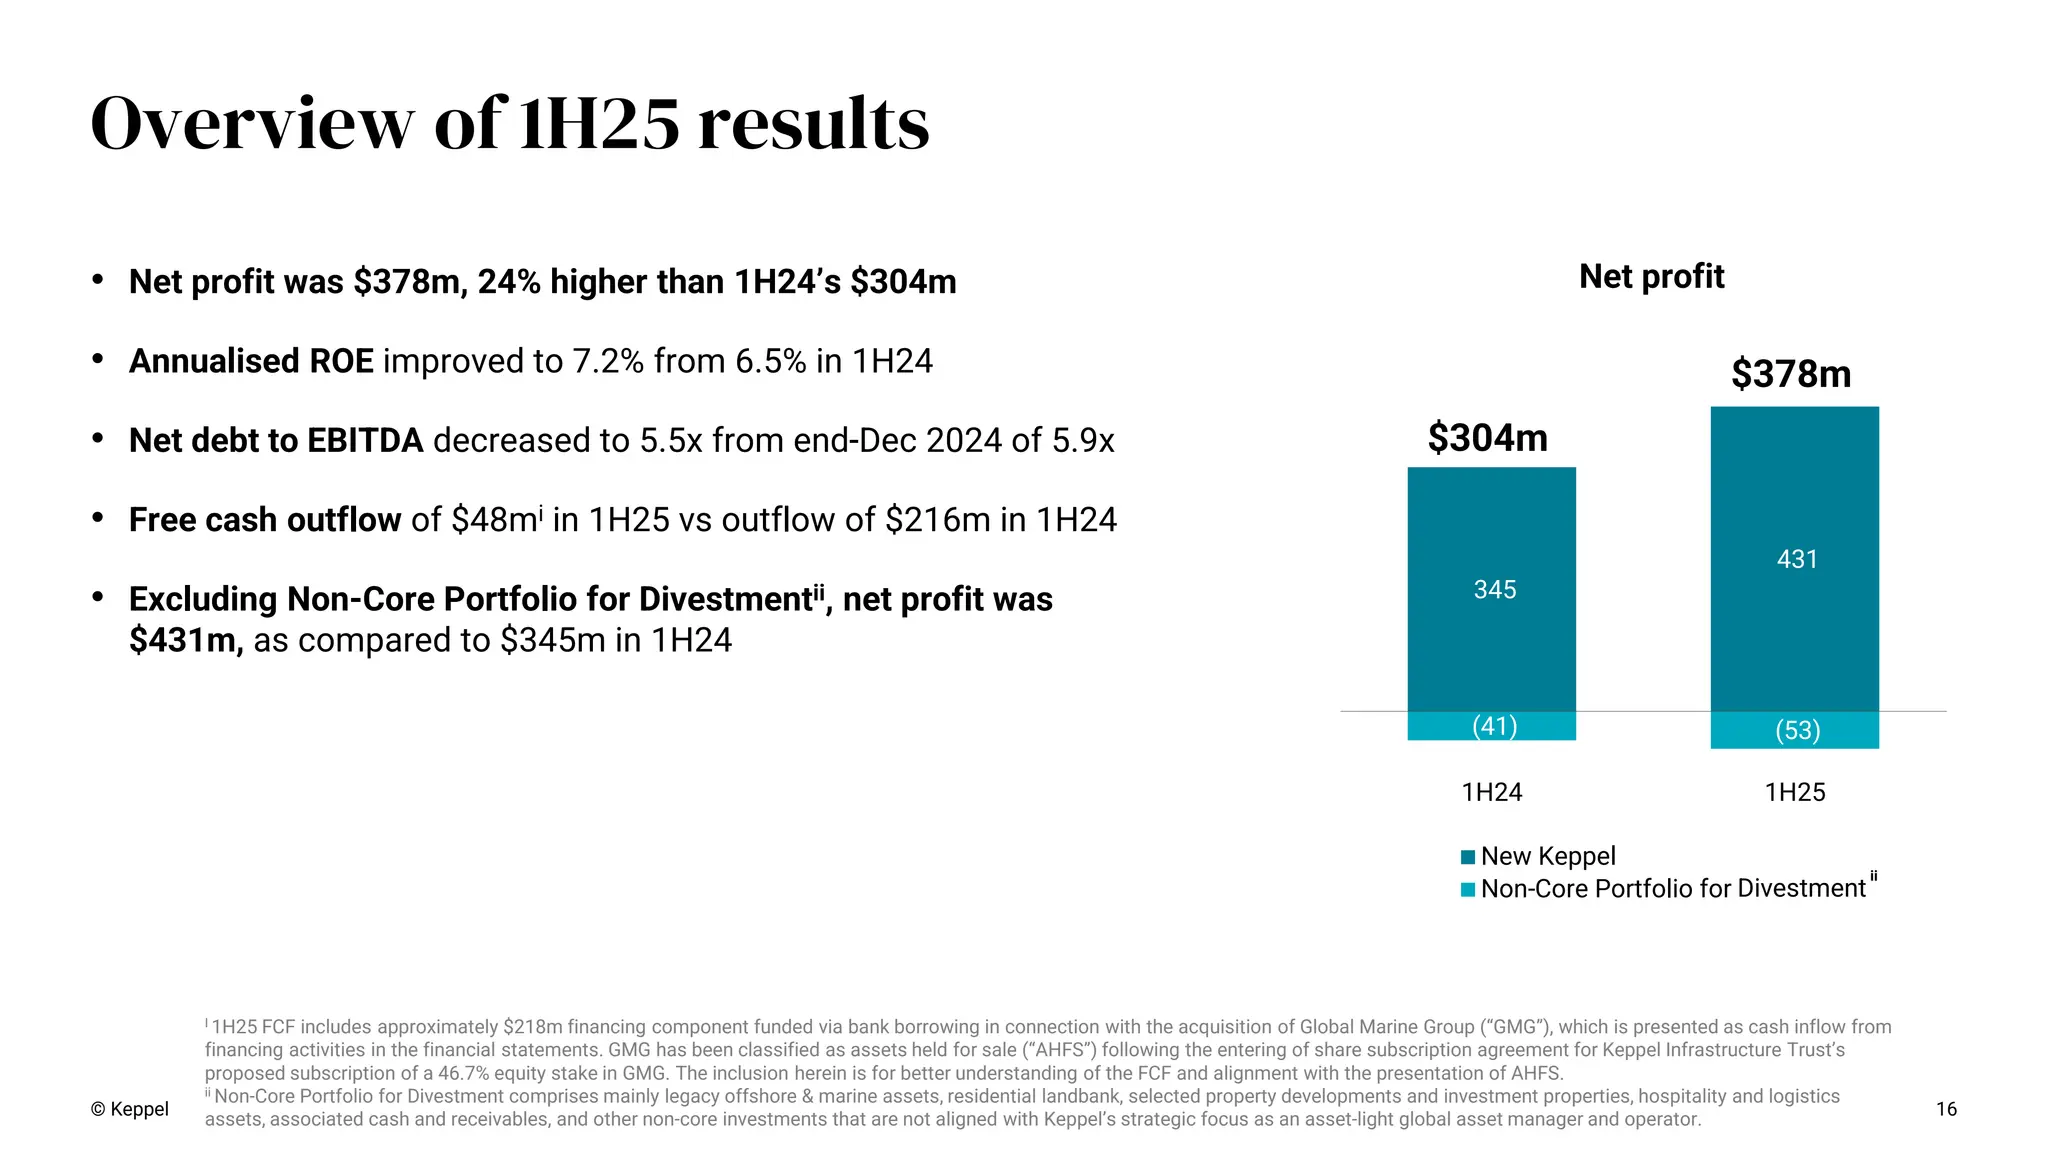
Net profit 16 Overview of
1H25 results © Keppel • Net profit was $378m, 24% higher than 1H24’s $304m • Annualised ROE improved to 7.2% from 6.5% in 1H24 • Net debt to EBITDA decreased to 5.5x from end-Dec 2024 of 5.9x • Free cash outflow of $48mi in 1H25 vs outflow of $216m in 1H24 • Excluding Non-Core Portfolio for Divestmentii, net profit was $431m, as compared to $345m in 1H24 345 431 (41) (53) 1H24 1H25 New Keppel Non-Core Portfolio for Divestment $378m $304m I 1H25 FCF includes approximately $218m financing component funded via bank borrowing in connection with the acquisition of Global Marine Group (“GMG”), which is presented as cash inflow from financing activities in the financial statements. GMG has been classified as assets held for sale (“AHFS”) following the entering of share subscription agreement for Keppel Infrastructure Trust’s proposed subscription of a 46.7% equity stake in GMG. The inclusion herein is for better understanding of the FCF and alignment with the presentation of AHFS. ii Non-Core Portfolio for Divestment comprises mainly legacy offshore & marine assets, residential landbank, selected property developments and investment properties, hospitality and logistics assets, associated cash and receivables, and other non-core investments that are not aligned with Keppel’s strategic focus as an asset-light global asset manager and operator. ii
17.
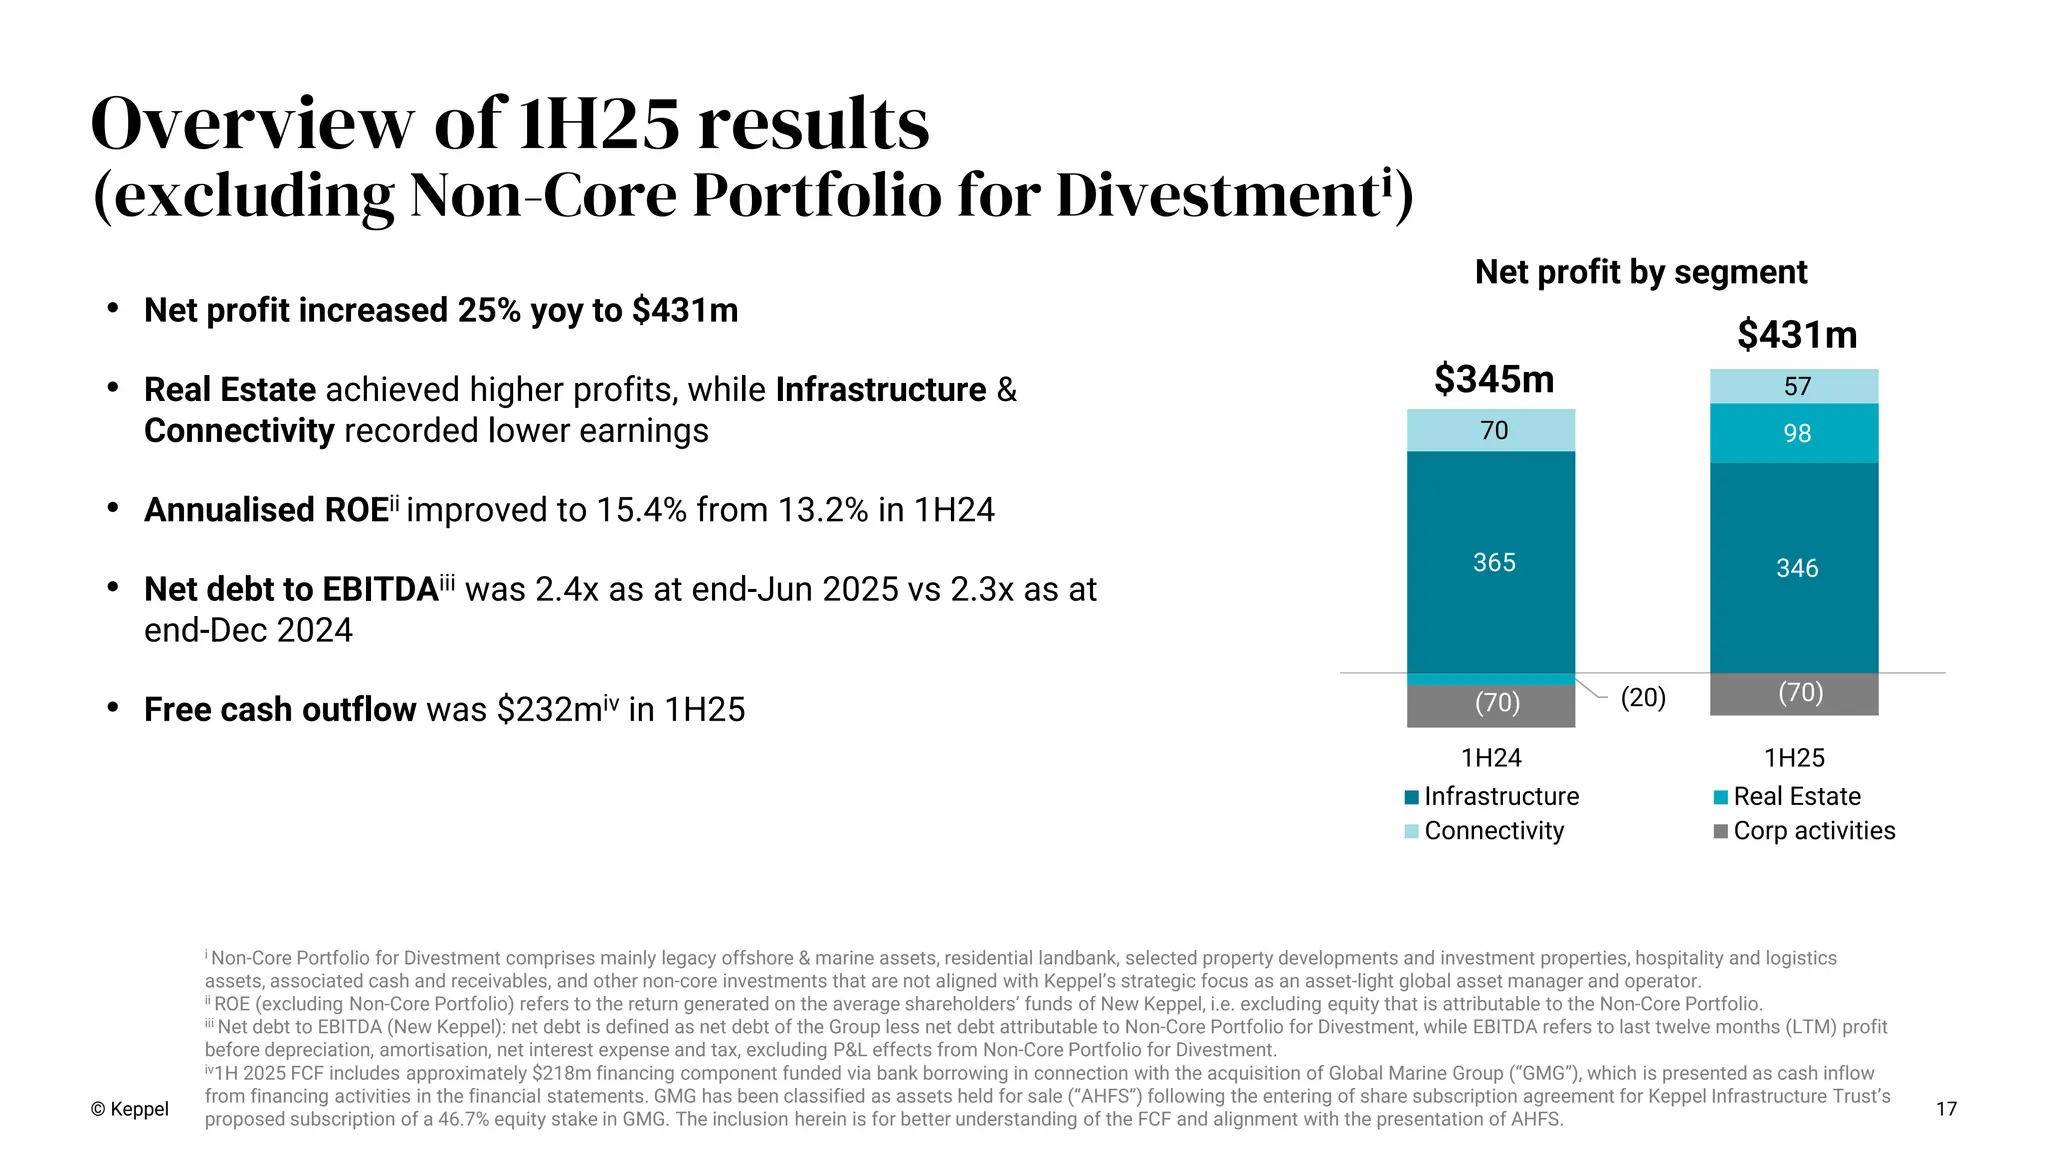
365 346 (20) 98 70 57 (70) (70) 1H24
1H25 Infrastructure Real Estate Connectivity Corp activities $431m $345m 17 Overview of 1H25 results (excluding Non-Core Portfolio for Divestmenti) Net profit by segment © Keppel • Net profit increased 25% yoy to $431m • Real Estate achieved higher profits, while Infrastructure & Connectivity recorded lower earnings • Annualised ROEii improved to 15.4% from 13.2% in 1H24 • Net debt to EBITDAiii was 2.4x as at end-Jun 2025 vs 2.3x as at end-Dec 2024 • Free cash outflow was $232miv in 1H25 i Non-Core Portfolio for Divestment comprises mainly legacy offshore & marine assets, residential landbank, selected property developments and investment properties, hospitality and logistics assets, associated cash and receivables, and other non-core investments that are not aligned with Keppel’s strategic focus as an asset-light global asset manager and operator. ii ROE (excluding Non-Core Portfolio) refers to the return generated on the average shareholders’ funds of New Keppel, i.e. excluding equity that is attributable to the Non-Core Portfolio. iii Net debt to EBITDA (New Keppel): net debt is defined as net debt of the Group less net debt attributable to Non-Core Portfolio for Divestment, while EBITDA refers to last twelve months (LTM) profit before depreciation, amortisation, net interest expense and tax, excluding P&L effects from Non-Core Portfolio for Divestment. iv1H 2025 FCF includes approximately $218m financing component funded via bank borrowing in connection with the acquisition of Global Marine Group (“GMG”), which is presented as cash inflow from financing activities in the financial statements. GMG has been classified as assets held for sale (“AHFS”) following the entering of share subscription agreement for Keppel Infrastructure Trust’s proposed subscription of a 46.7% equity stake in GMG. The inclusion herein is for better understanding of the FCF and alignment with the presentation of AHFS.
18.
Horizontal reporting (excluding Non-Core
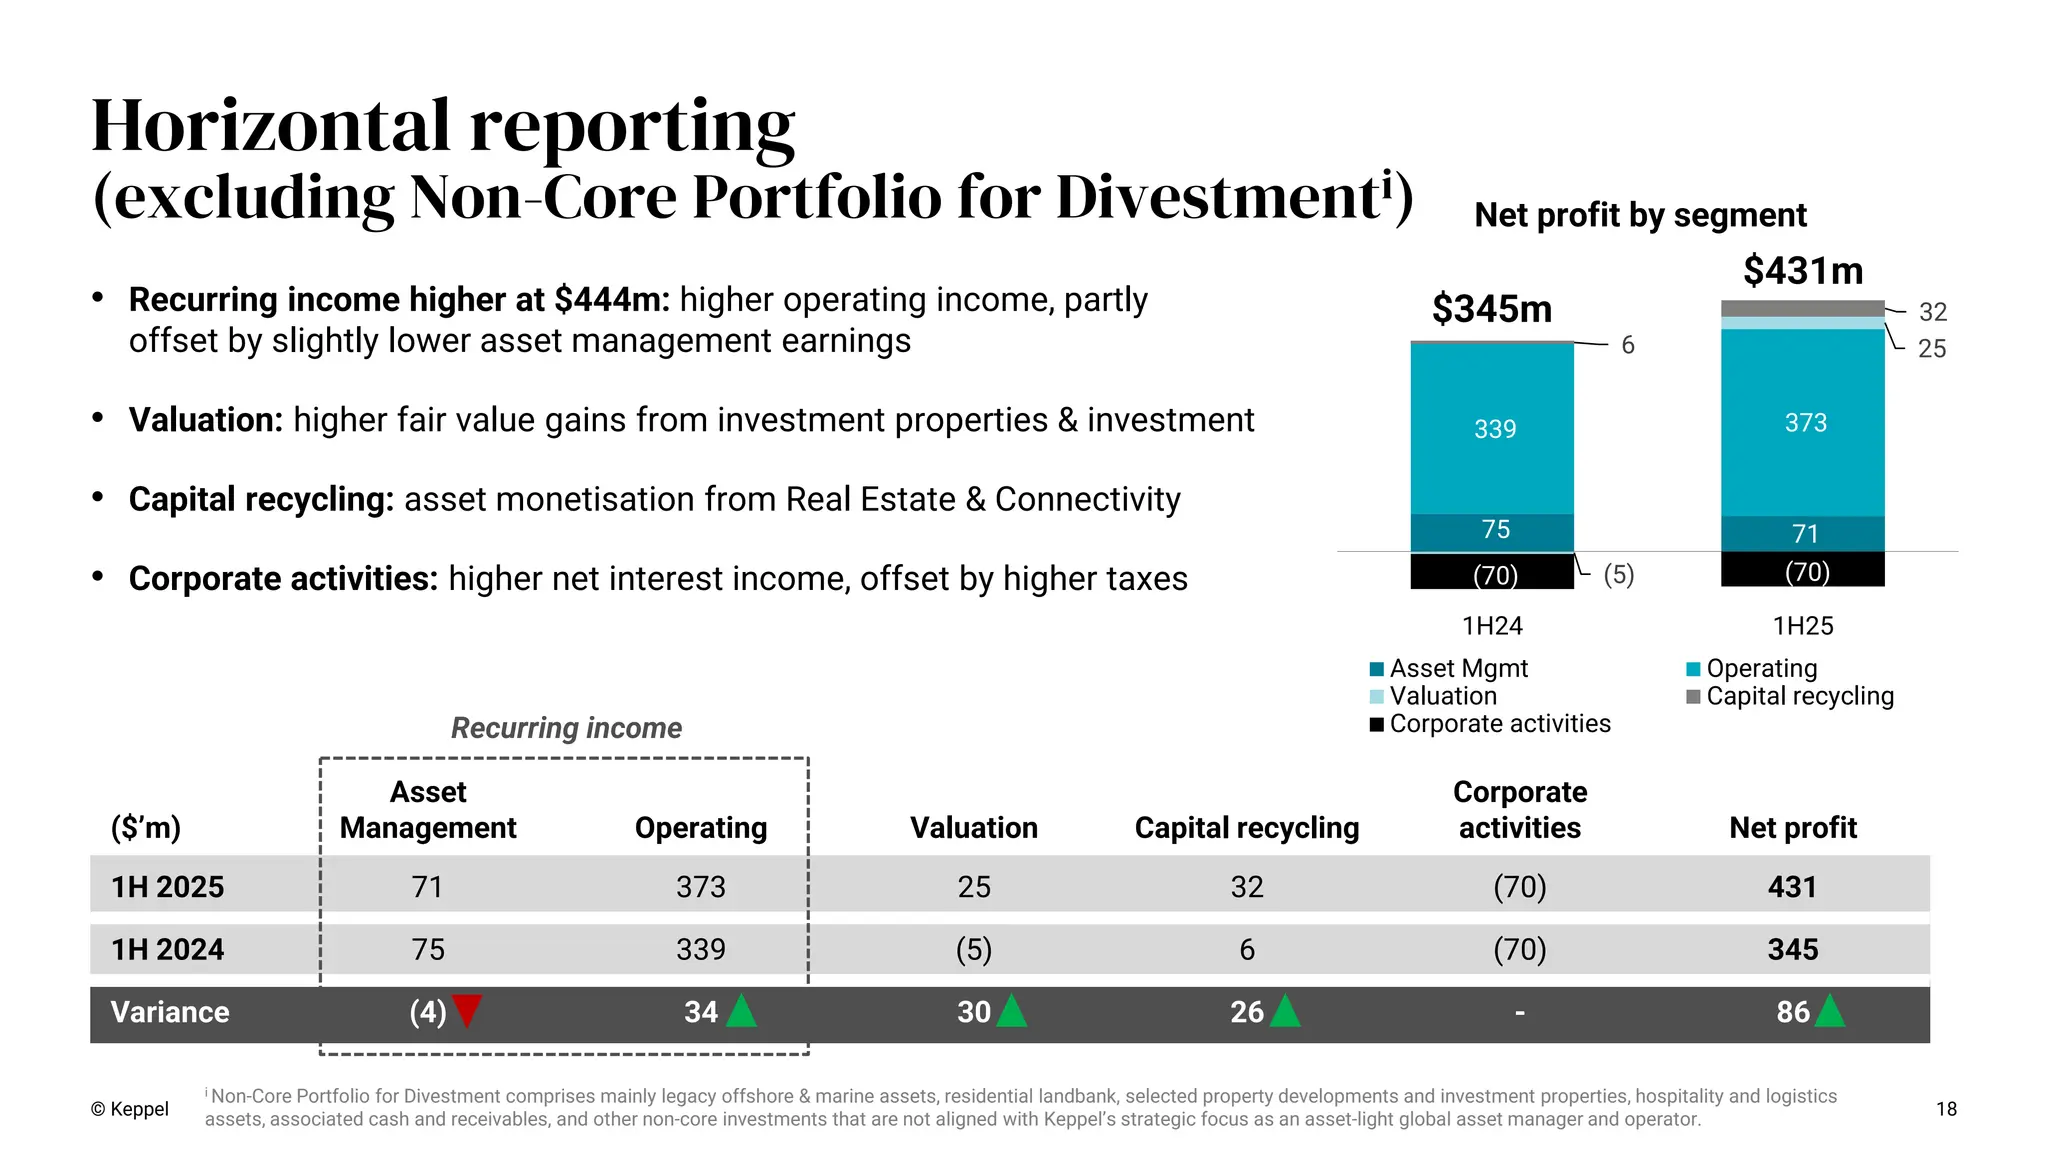
Portfolio for Divestmenti) © Keppel 18 Net profit by segment 75 71 339 373 (5) 25 6 32 (70) (70) 1H24 1H25 Asset Mgmt Operating Valuation Capital recycling Corporate activities $345m $431m • Recurring income higher at $444m: higher operating income, partly offset by slightly lower asset management earnings • Valuation: higher fair value gains from investment properties & investment • Capital recycling: asset monetisation from Real Estate & Connectivity • Corporate activities: higher net interest income, offset by higher taxes ($’m) Asset Management Operating Valuation Capital recycling Corporate activities Net profit 1H 2025 71 373 25 32 (70) 431 1H 2024 75 339 (5) 6 (70) 345 Variance (4) 34 30 26 - 86 Recurring income i Non-Core Portfolio for Divestment comprises mainly legacy offshore & marine assets, residential landbank, selected property developments and investment properties, hospitality and logistics assets, associated cash and receivables, and other non-core investments that are not aligned with Keppel’s strategic focus as an asset-light global asset manager and operator.
19.
© Keppel 19 1H
2025 net profit (horizontal reporting) i Includes asset management, transaction and advisory fees on sponsor stakes and co-investments. ii Includes returns (net of financing costs attributable to such stakes) from equity accounted stakes in listed and private funds – Infrastructure [$6m from listed funds]; Real Estate [$15m from listed funds], and Connectivity [$16m from listed funds]. iii Includes overheads and financing costs which have not been attributed to segments. iv Non-Core Portfolio for Divestment comprises mainly legacy offshore & marine assets, residential landbank, selected property developments and investment properties, hospitality and logistics assets, associated cash and receivables, and other non-core investments that are not aligned with Keppel’s strategic focus as an asset-light global asset manager and operator. ($’m) Asset Managementi Operatingii Valuation Capital recycling Net profit Infrastructure 16 333 (3) – 346 80% Real Estate 41 - 27 30 98 23% Connectivity 14 40 1 2 57 13% Corporate activitiesiii (70) (16%) New Keppel 71 373 25 32 431 100% Non-Core Portfolio for Divestmentiv (53) Net profit 71 373 25 32 378
20.
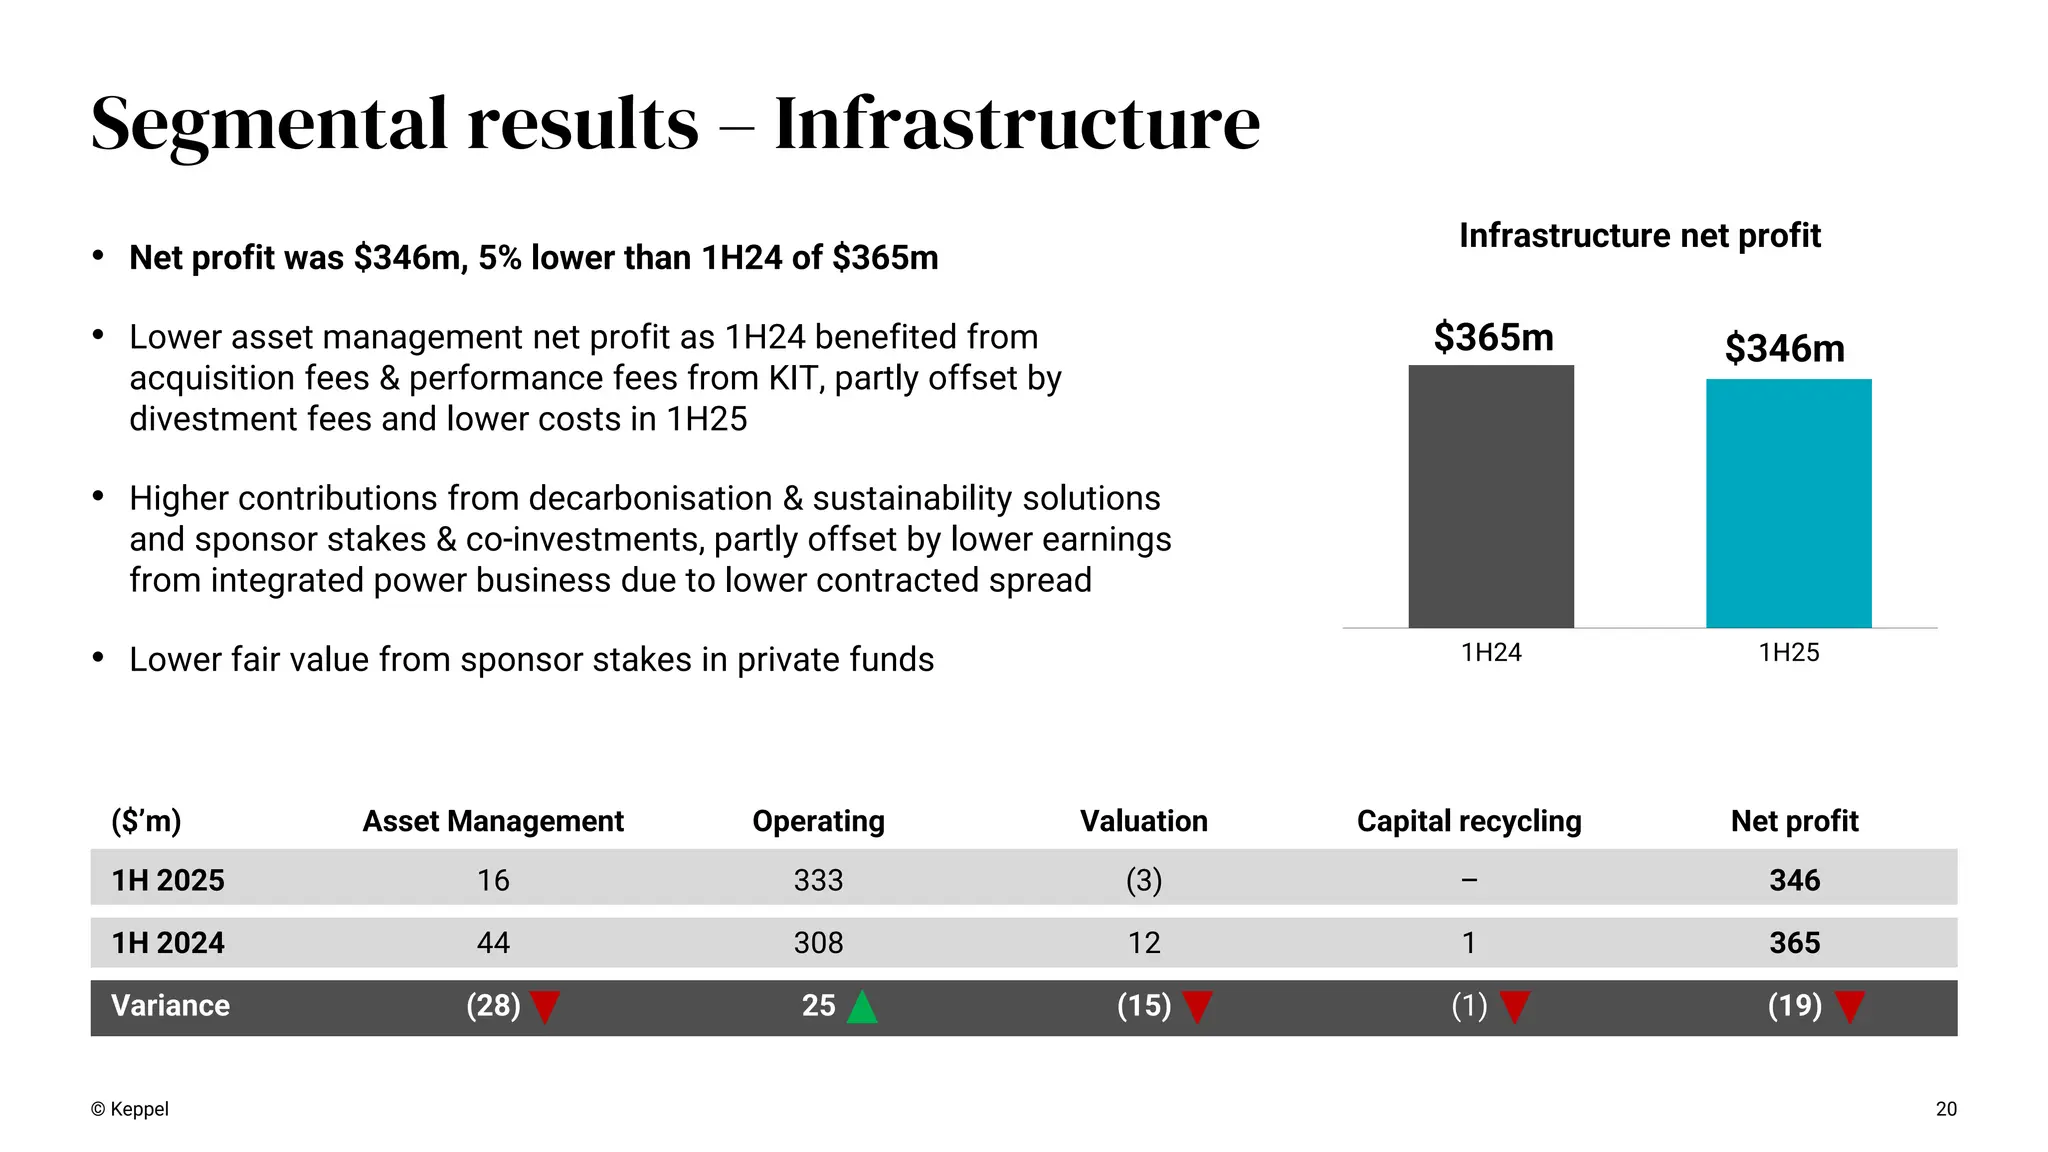
1H24 1H25 $365m $346m 20 Segmental
results – Infrastructure Infrastructure net profit © Keppel • Net profit was $346m, 5% lower than 1H24 of $365m • Lower asset management net profit as 1H24 benefited from acquisition fees & performance fees from KIT, partly offset by divestment fees and lower costs in 1H25 • Higher contributions from decarbonisation & sustainability solutions and sponsor stakes & co-investments, partly offset by lower earnings from integrated power business due to lower contracted spread • Lower fair value from sponsor stakes in private funds ($’m) Asset Management Operating Valuation Capital recycling Net profit 1H 2025 16 333 (3) – 346 1H 2024 44 308 12 1 365 Variance (28) 25 (15) (1) (19)
21.
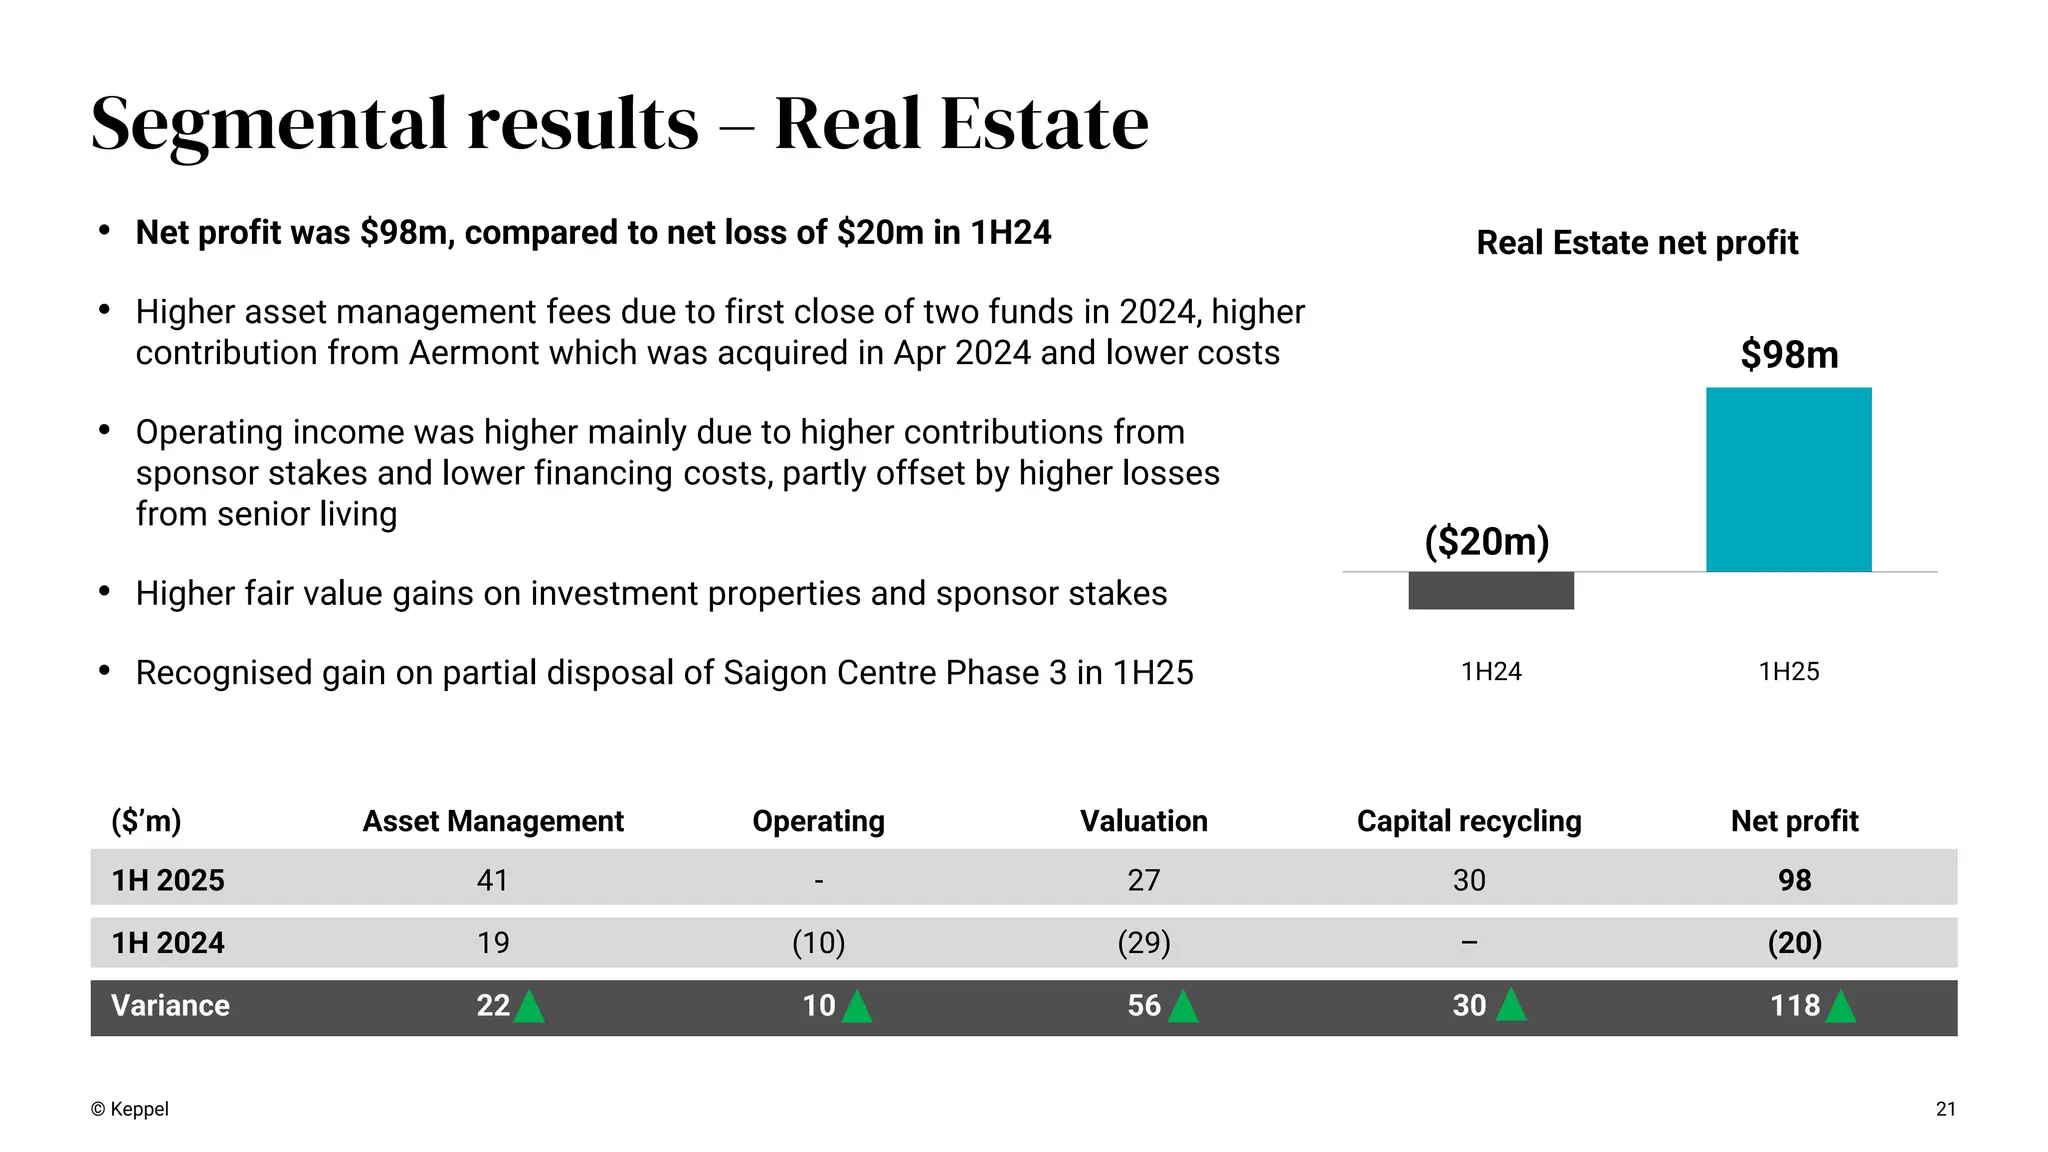
1H24 1H25 ($20m) $98m 21 Segmental results
– Real Estate Real Estate net profit © Keppel • Net profit was $98m, compared to net loss of $20m in 1H24 • Higher asset management fees due to first close of two funds in 2024, higher contribution from Aermont which was acquired in Apr 2024 and lower costs • Operating income was higher mainly due to higher contributions from sponsor stakes and lower financing costs, partly offset by higher losses from senior living • Higher fair value gains on investment properties and sponsor stakes • Recognised gain on partial disposal of Saigon Centre Phase 3 in 1H25 ($’m) Asset Management Operating Valuation Capital recycling Net profit 1H 2025 41 - 27 30 98 1H 2024 19 (10) (29) – (20) Variance 22 10 56 30 118
22.
22 Segmental results –
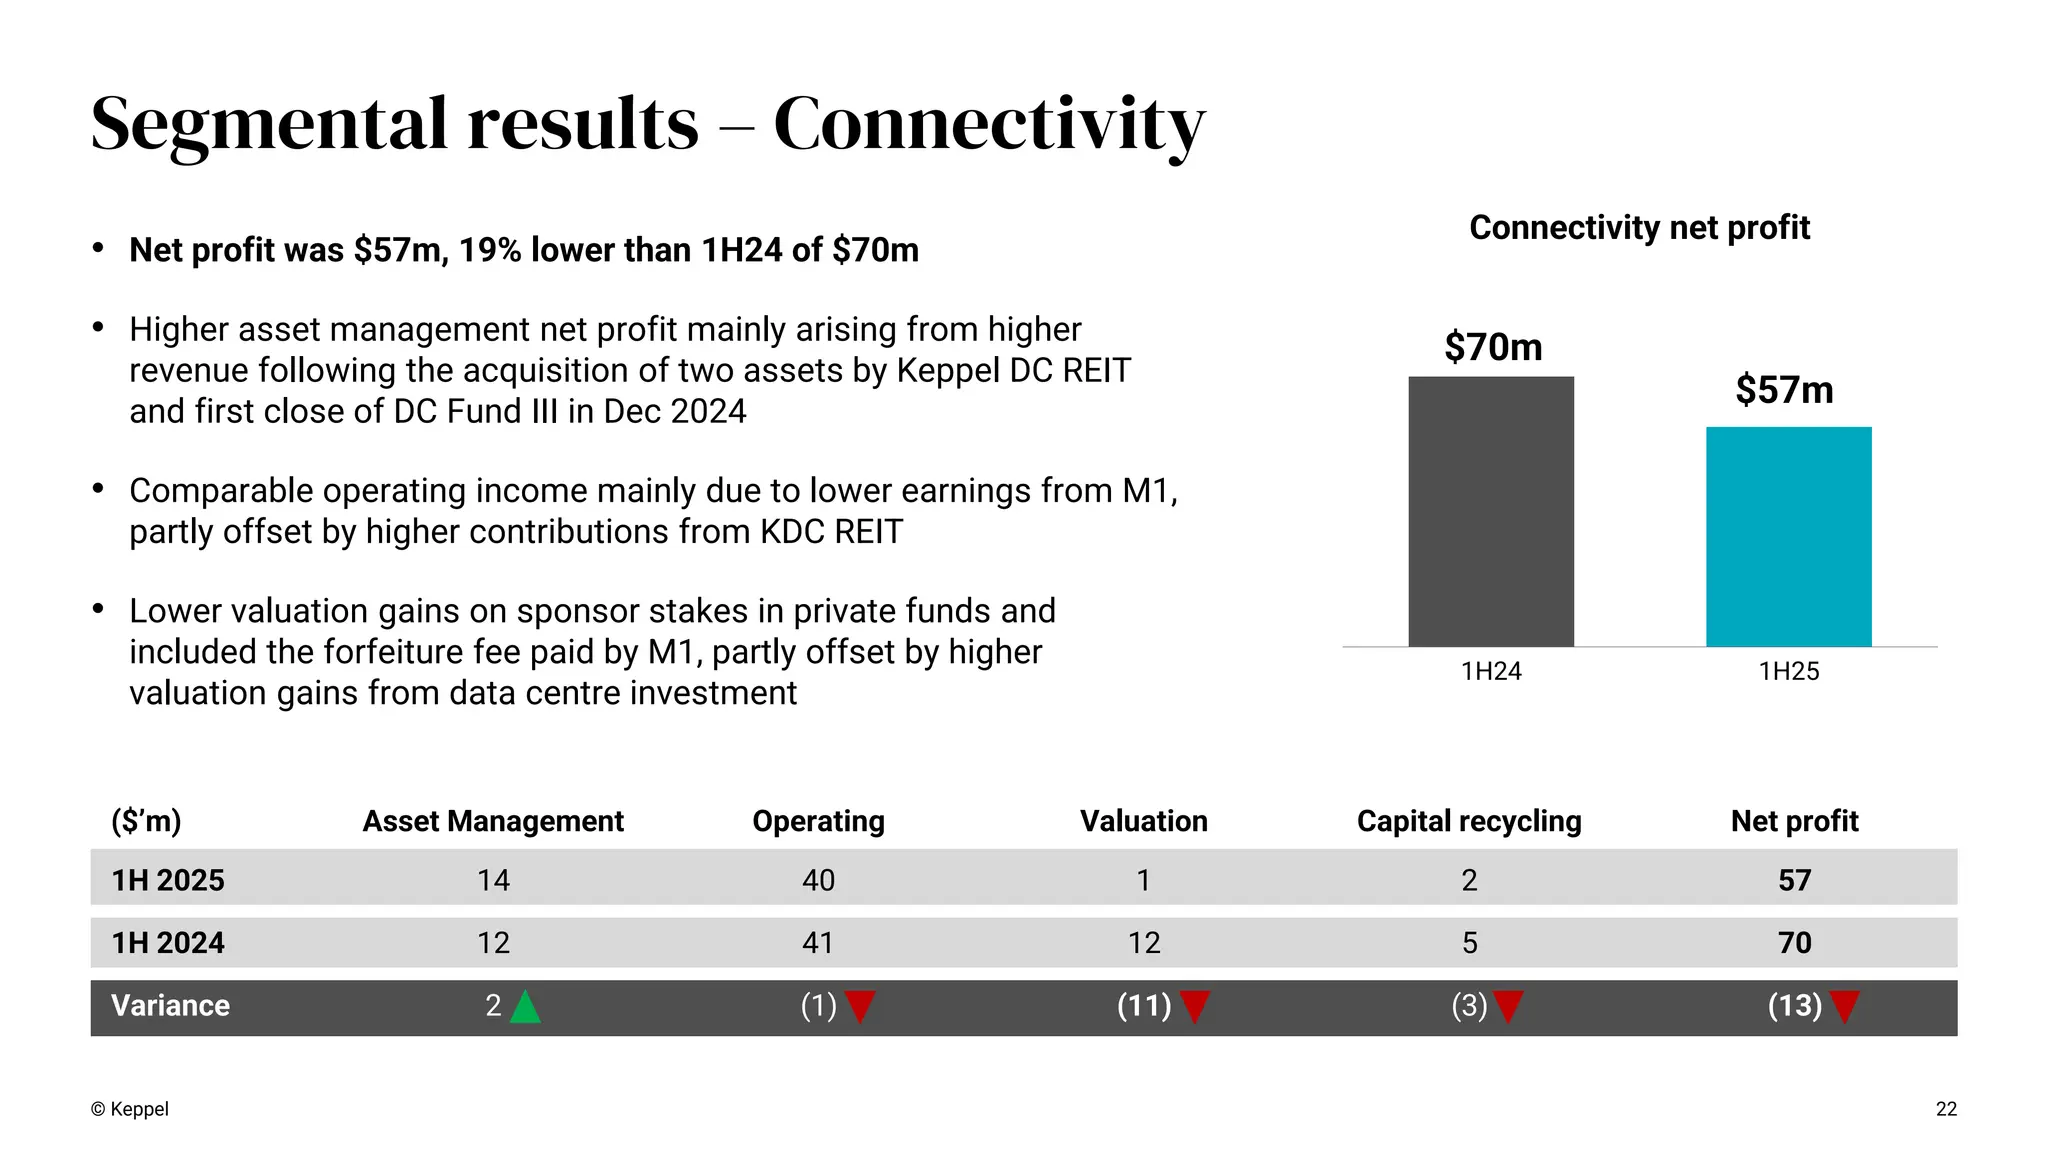
Connectivity 1H24 1H25 $70m $57m Connectivity net profit © Keppel • Net profit was $57m, 19% lower than 1H24 of $70m • Higher asset management net profit mainly arising from higher revenue following the acquisition of two assets by Keppel DC REIT and first close of DC Fund III in Dec 2024 • Comparable operating income mainly due to lower earnings from M1, partly offset by higher contributions from KDC REIT • Lower valuation gains on sponsor stakes in private funds and included the forfeiture fee paid by M1, partly offset by higher valuation gains from data centre investment ($’m) Asset Management Operating Valuation Capital recycling Net profit 1H 2025 14 40 1 2 57 1H 2024 12 41 12 5 70 Variance 2 (1) (11) (3) (13)
23.
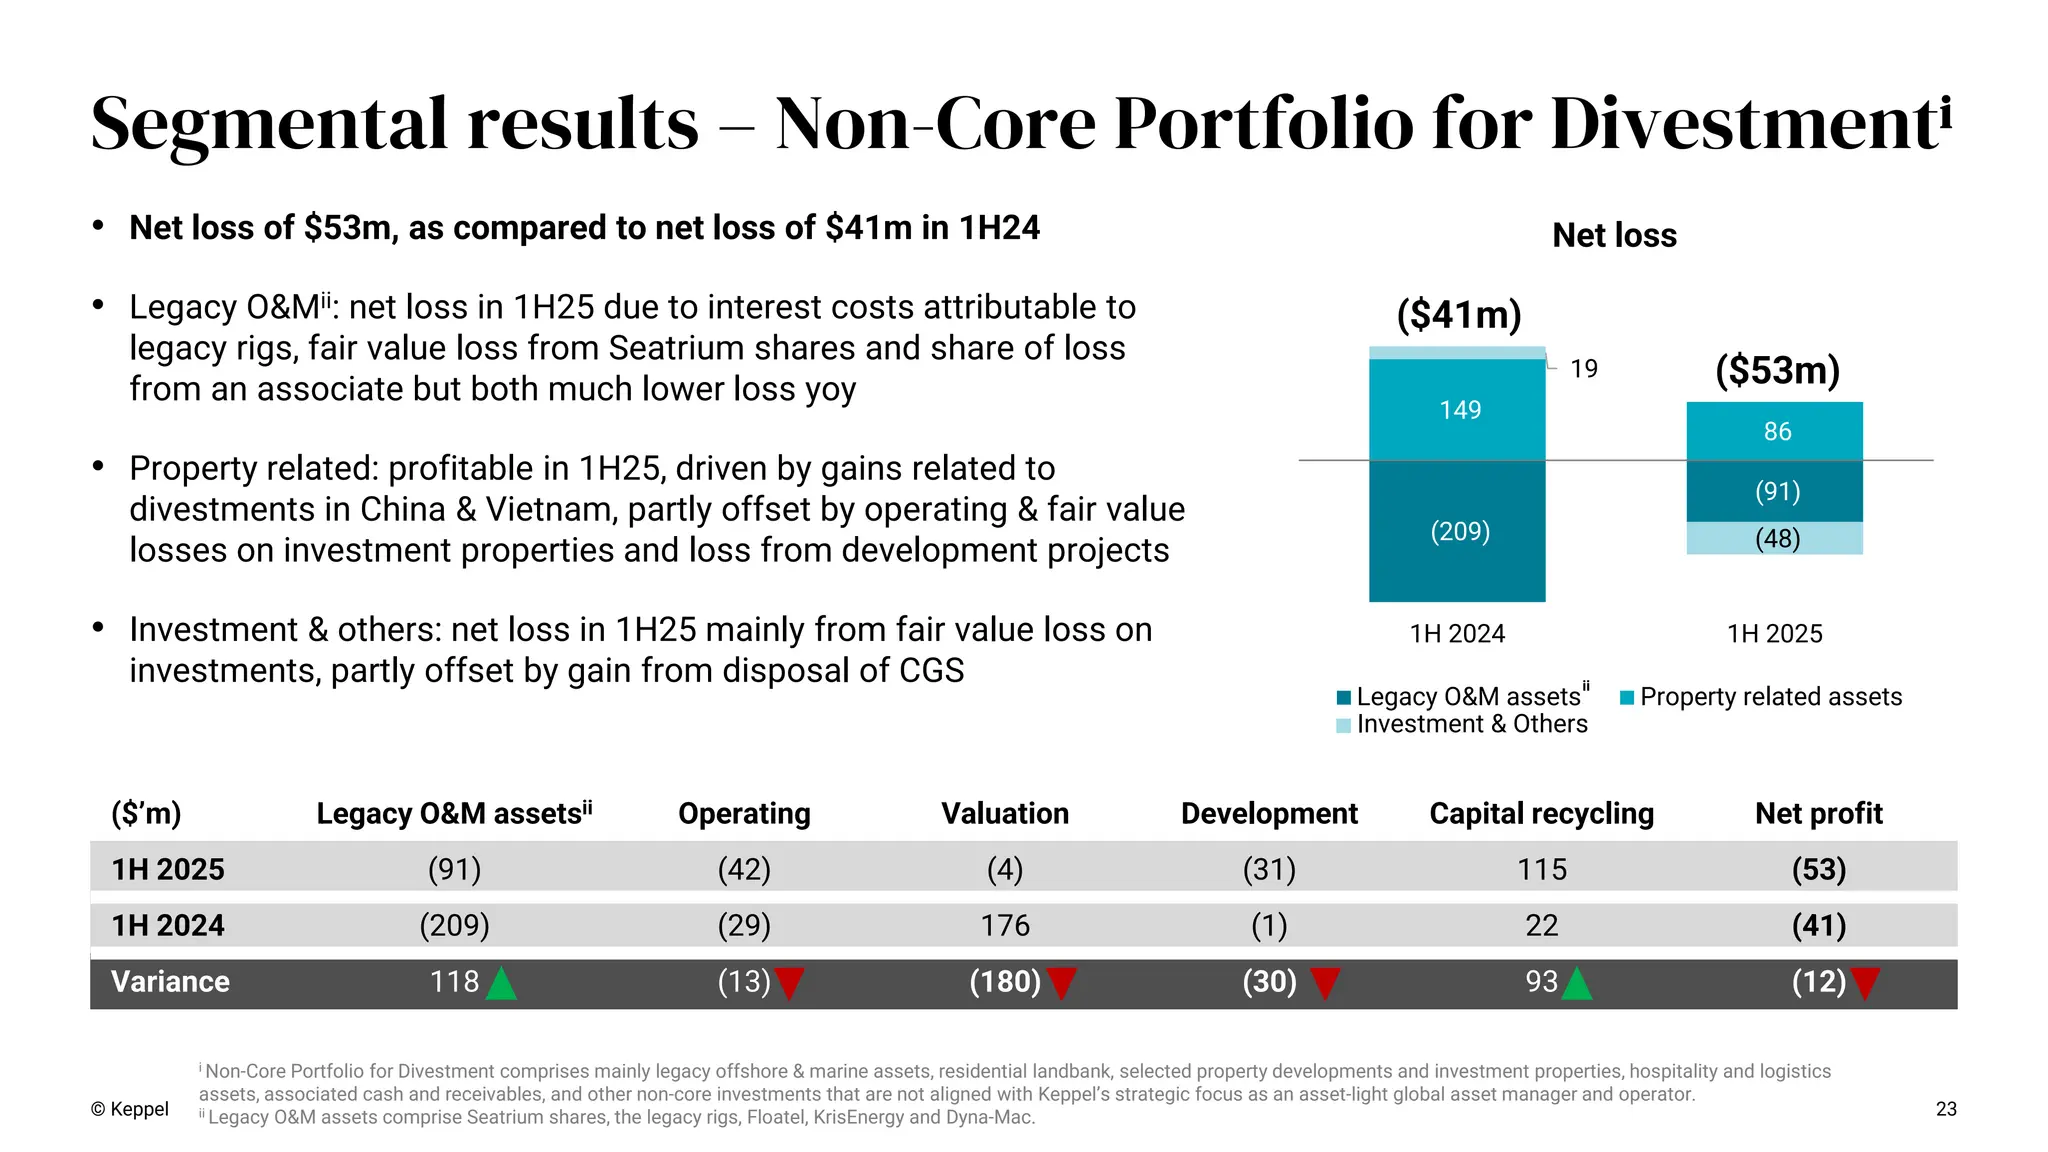
($’m) Legacy O&M
assetsii Operating Valuation Development Capital recycling Net profit 1H 2025 (91) (42) (4) (31) 115 (53) 1H 2024 (209) (29) 176 (1) 22 (41) Variance 118 (13) (180) (30) 93 (12) • Net loss of $53m, as compared to net loss of $41m in 1H24 • Legacy O&Mii: net loss in 1H25 due to interest costs attributable to legacy rigs, fair value loss from Seatrium shares and share of loss from an associate but both much lower loss yoy • Property related: profitable in 1H25, driven by gains related to divestments in China & Vietnam, partly offset by operating & fair value losses on investment properties and loss from development projects • Investment & others: net loss in 1H25 mainly from fair value loss on investments, partly offset by gain from disposal of CGS © Keppel 23 Segmental results – Non-Core Portfolio for Divestmenti (209) (91) 149 86 19 (48) 1H 2024 1H 2025 Legacy O&M assets Property related assets ($41m) ($53m) ii i Non-Core Portfolio for Divestment comprises mainly legacy offshore & marine assets, residential landbank, selected property developments and investment properties, hospitality and logistics assets, associated cash and receivables, and other non-core investments that are not aligned with Keppel’s strategic focus as an asset-light global asset manager and operator. ii Legacy O&M assets comprise Seatrium shares, the legacy rigs, Floatel, KrisEnergy and Dyna-Mac. Net loss Investment & Others
24.
Appendices -Operational updates 03 24
25.
i Gross asset
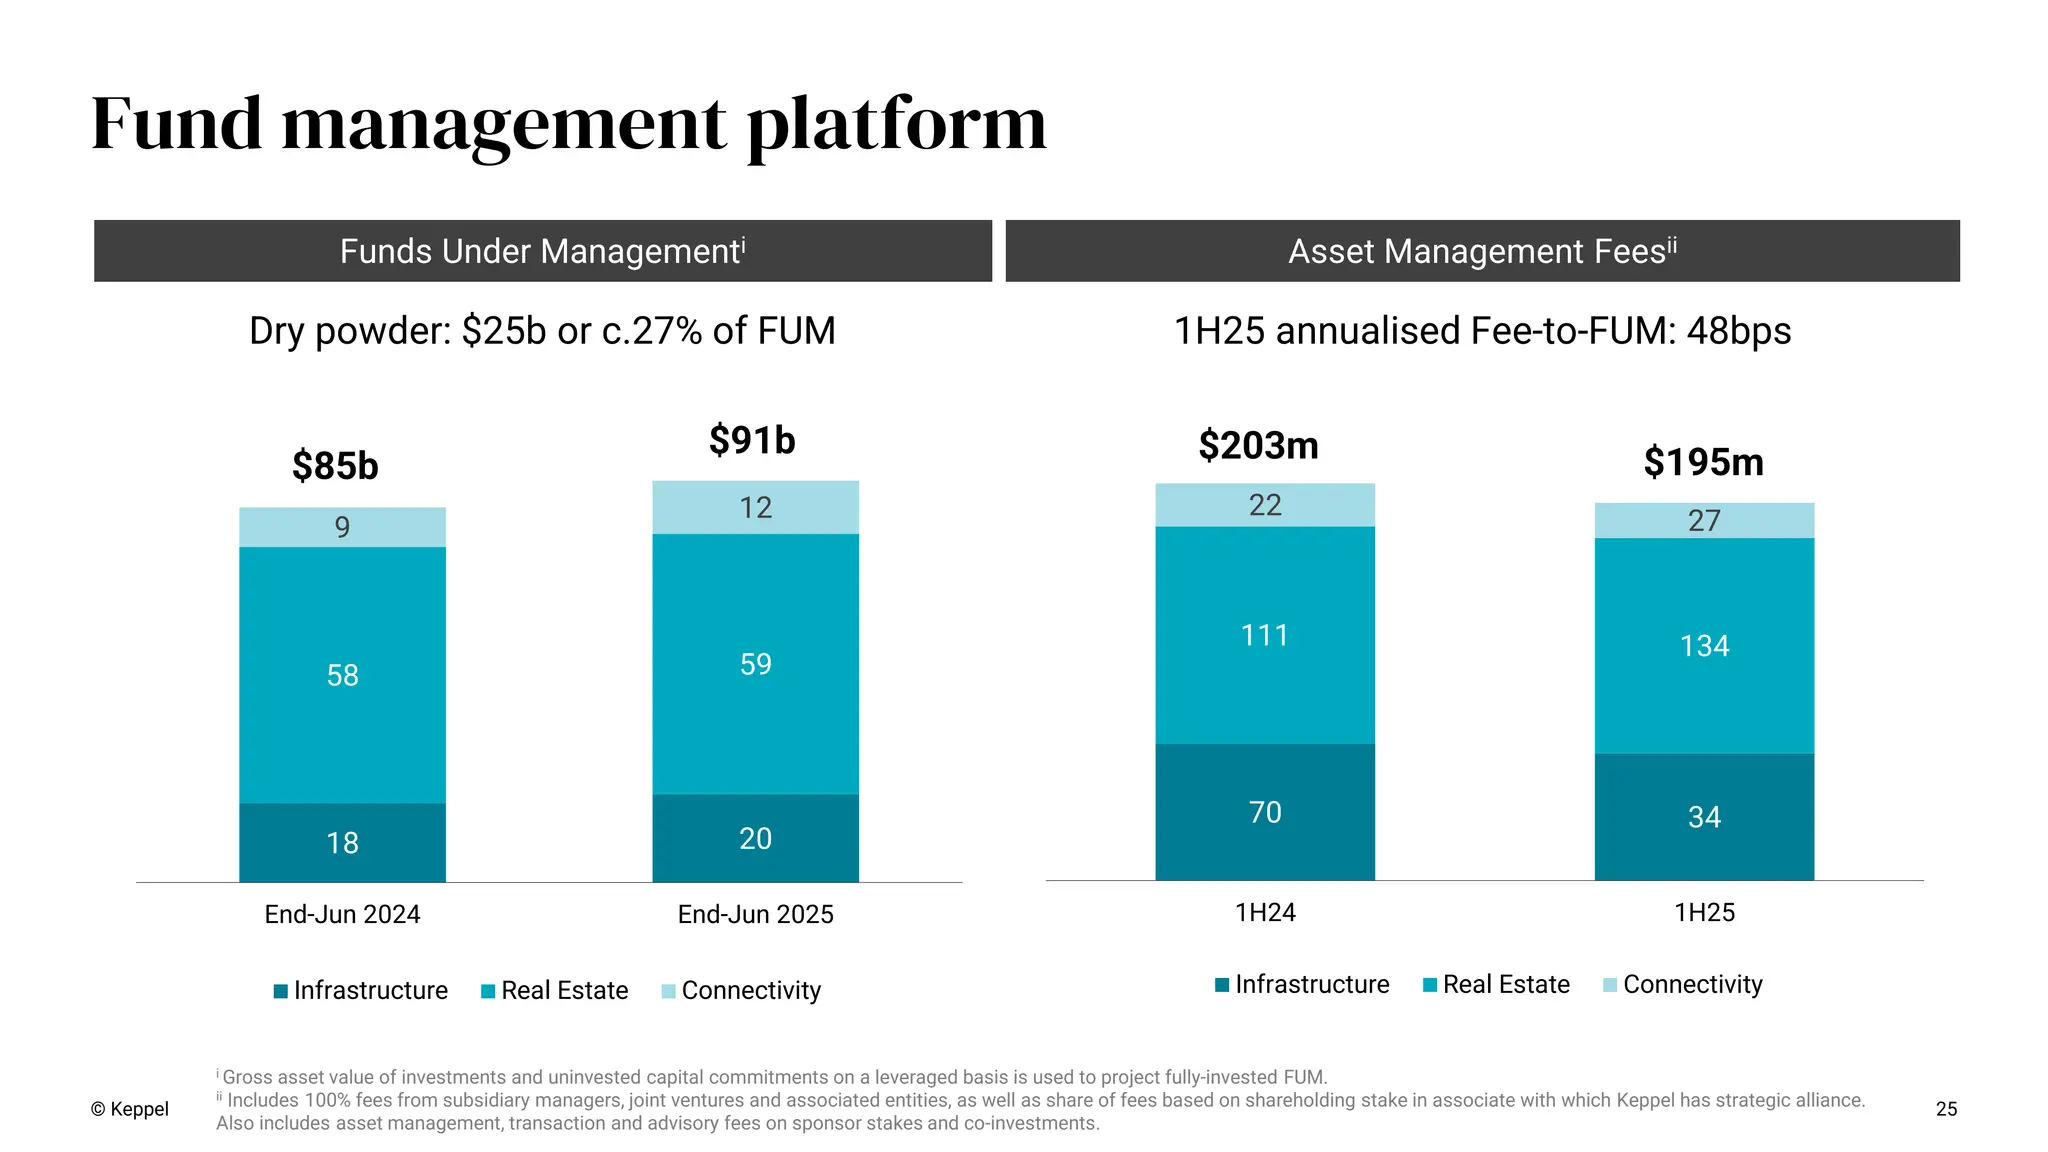
value of investments and uninvested capital commitments on a leveraged basis is used to project fully-invested FUM. ii Includes 100% fees from subsidiary managers, joint ventures and associated entities, as well as share of fees based on shareholding stake in associate with which Keppel has strategic alliance. Also includes asset management, transaction and advisory fees on sponsor stakes and co-investments. 70 34 111 134 22 27 1H24 1H25 Infrastructure Real Estate Connectivity $203m $195m 18 20 58 59 9 12 End-Jun 2024 End-Jun 2025 Infrastructure Real Estate Connectivity $85b $91b 1H25 annualised Fee-to-FUM: 48bps Dry powder: $25b or c.27% of FUM 25 © Keppel Fund management platform Asset Management Feesii Funds Under Managementi
26.
26 List of REITs/Trust No
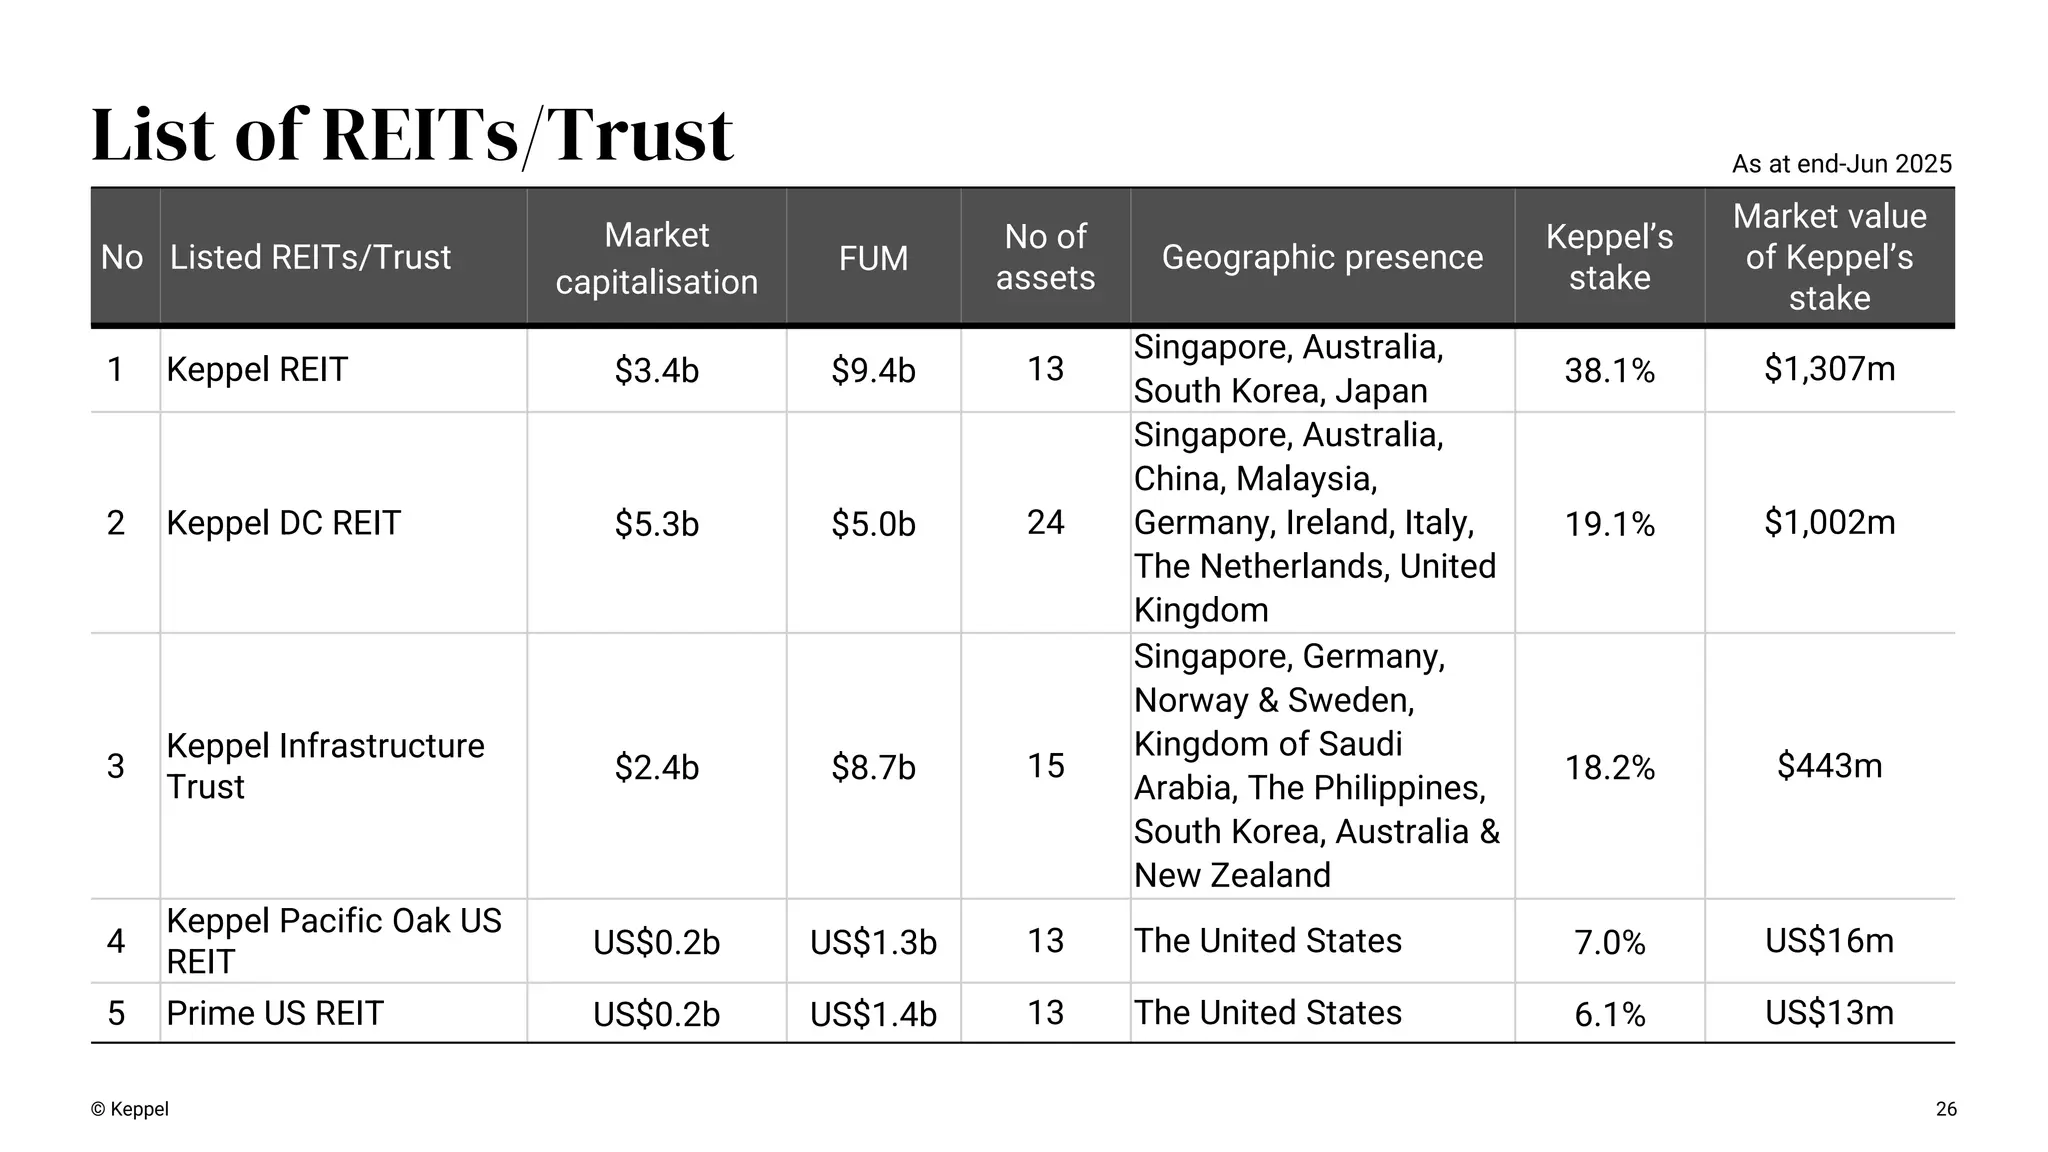
Listed REITs/Trust Market capitalisation FUM No of assets Geographic presence Keppel’s stake Market value of Keppel’s stake 1 Keppel REIT $3.4b $9.4b 13 Singapore, Australia, South Korea, Japan 38.1% $1,307m 2 Keppel DC REIT $5.3b $5.0b 24 Singapore, Australia, China, Malaysia, Germany, Ireland, Italy, The Netherlands, United Kingdom 19.1% $1,002m 3 Keppel Infrastructure Trust $2.4b $8.7b 15 Singapore, Germany, Norway & Sweden, Kingdom of Saudi Arabia, The Philippines, South Korea, Australia & New Zealand 18.2% $443m 4 Keppel Pacific Oak US REIT US$0.2b US$1.3b 13 The United States 7.0% US$16m 5 Prime US REIT US$0.2b US$1.4b 13 The United States 6.1% US$13m As at end-Jun 2025 © Keppel
27.
© Keppel 27 List
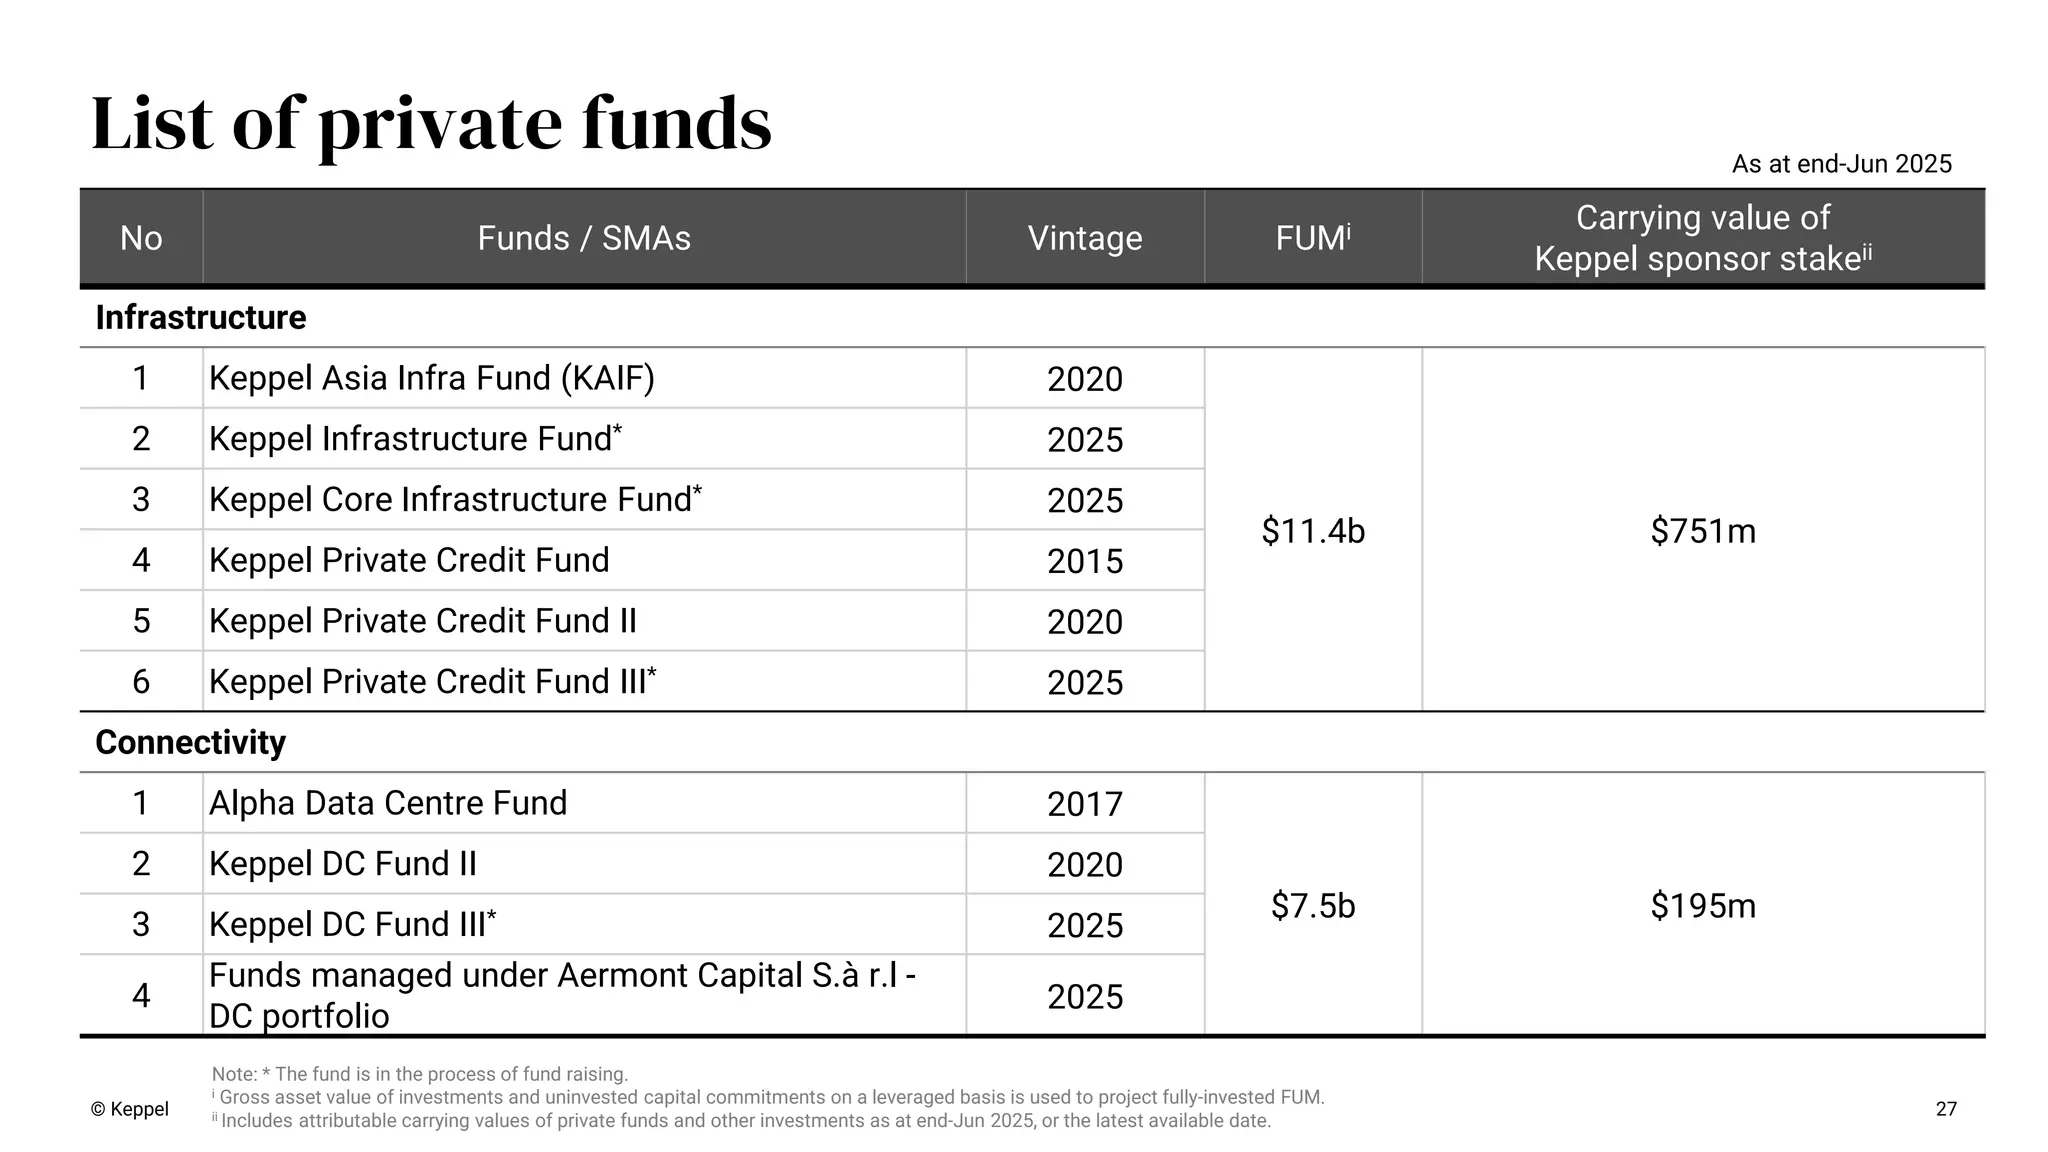
of private funds No Funds / SMAs Vintage FUMi Carrying value of Keppel sponsor stakeii Infrastructure 1 Keppel Asia Infra Fund (KAIF) 2020 $11.4b $751m 2 Keppel Infrastructure Fund* 2025 3 Keppel Core Infrastructure Fund* 2025 4 Keppel Private Credit Fund 2015 5 Keppel Private Credit Fund II 2020 6 Keppel Private Credit Fund III* 2025 Connectivity 1 Alpha Data Centre Fund 2017 $7.5b $195m 2 Keppel DC Fund II 2020 3 Keppel DC Fund III* 2025 4 Funds managed under Aermont Capital S.à r.l - DC portfolio 2025 Note: * The fund is in the process of fund raising. i Gross asset value of investments and uninvested capital commitments on a leveraged basis is used to project fully-invested FUM. ii Includes attributable carrying values of private funds and other investments as at end-Jun 2025, or the latest available date. As at end-Jun 2025
28.
© Keppel 28 List
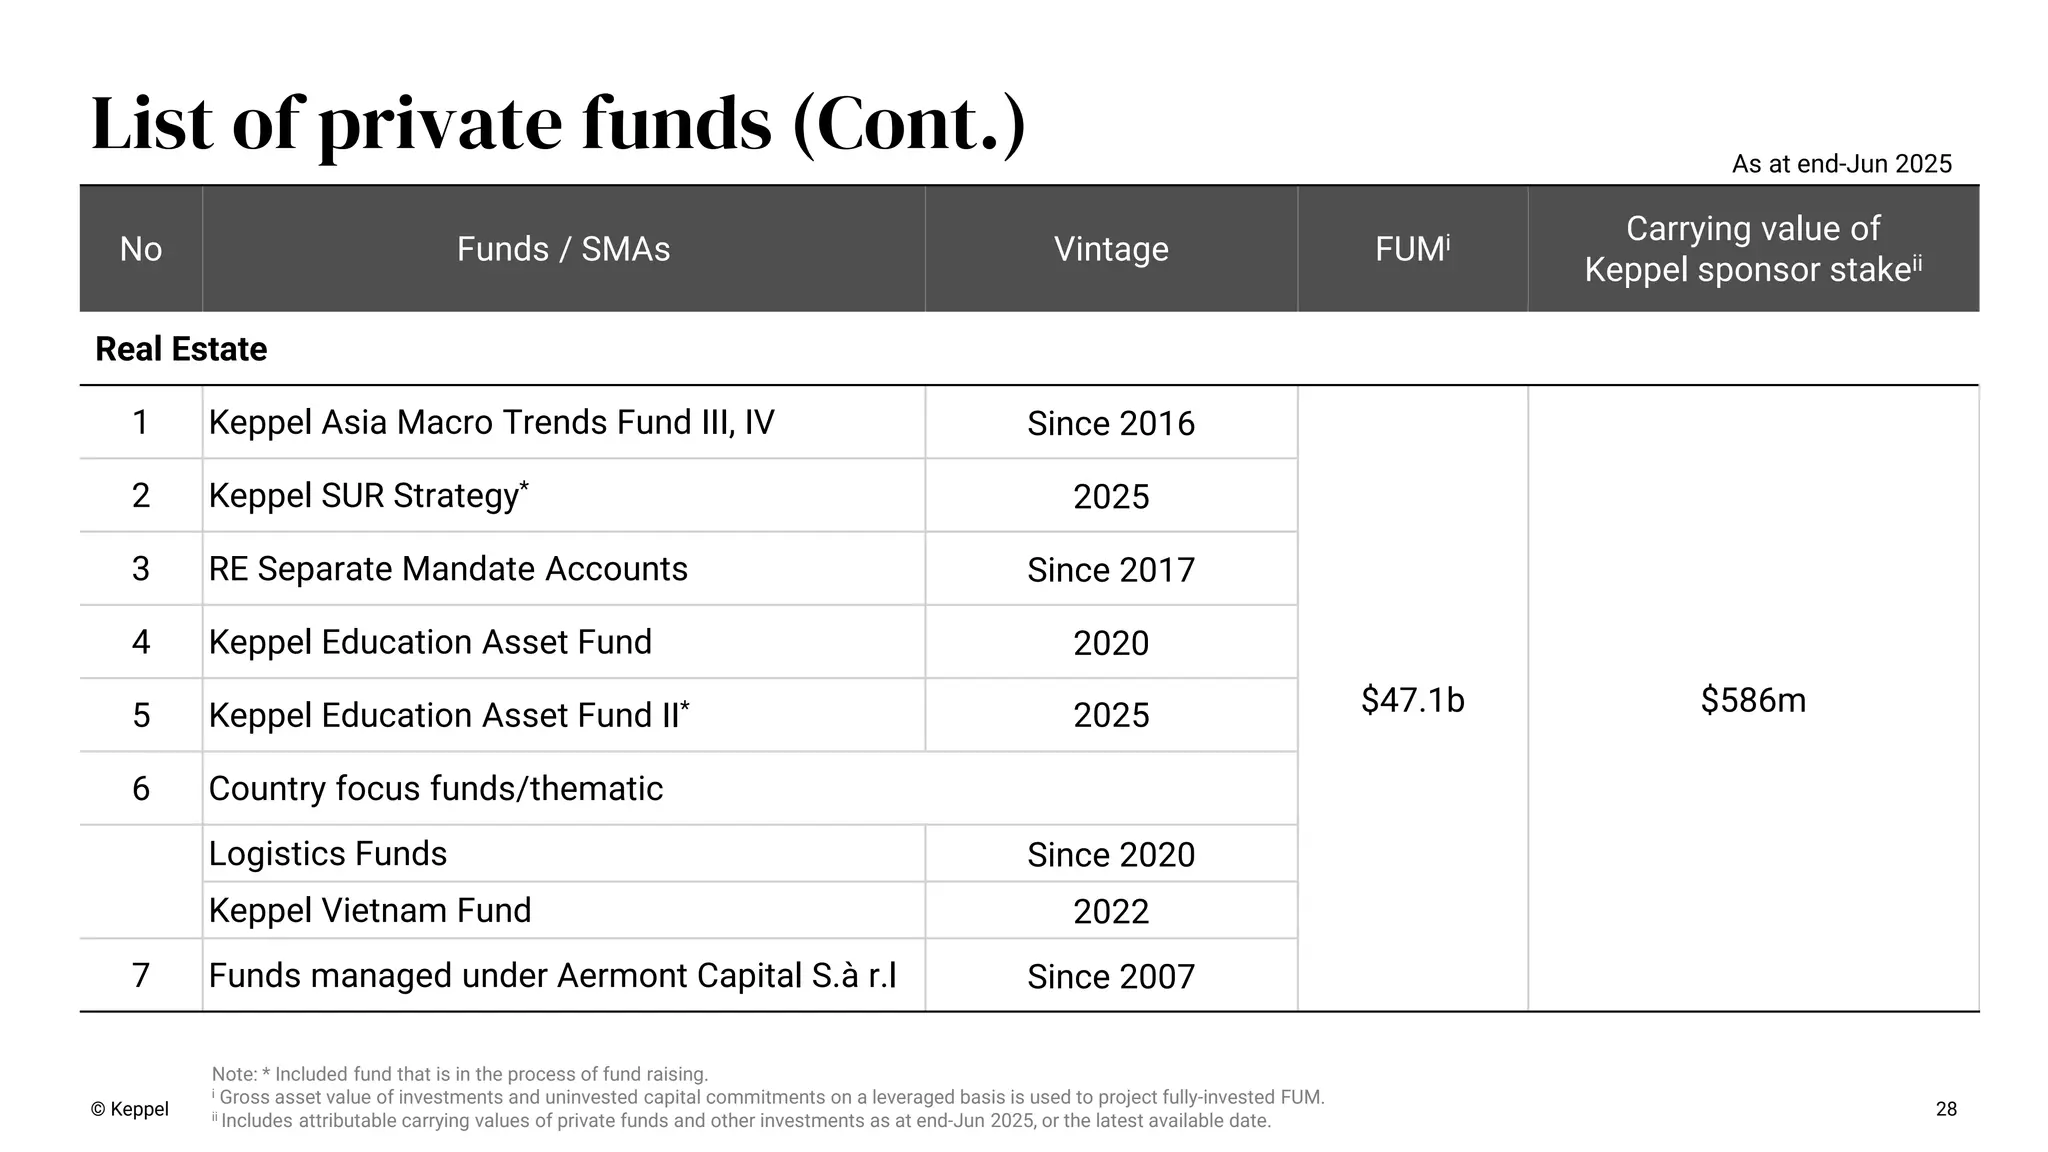
of private funds (Cont.) No Funds / SMAs Vintage FUMi Carrying value of Keppel sponsor stakeii Real Estate 1 Keppel Asia Macro Trends Fund III, IV Since 2016 $47.1b $586m 2 Keppel SUR Strategy* 2025 3 RE Separate Mandate Accounts Since 2017 4 Keppel Education Asset Fund 2020 5 Keppel Education Asset Fund II* 2025 6 Country focus funds/thematic Logistics Funds Since 2020 Keppel Vietnam Fund 2022 7 Funds managed under Aermont Capital S.à r.l Since 2007 Note: * Included fund that is in the process of fund raising. i Gross asset value of investments and uninvested capital commitments on a leveraged basis is used to project fully-invested FUM. ii Includes attributable carrying values of private funds and other investments as at end-Jun 2025, or the latest available date. As at end-Jun 2025
29.
29 Infrastructure Division updates ©
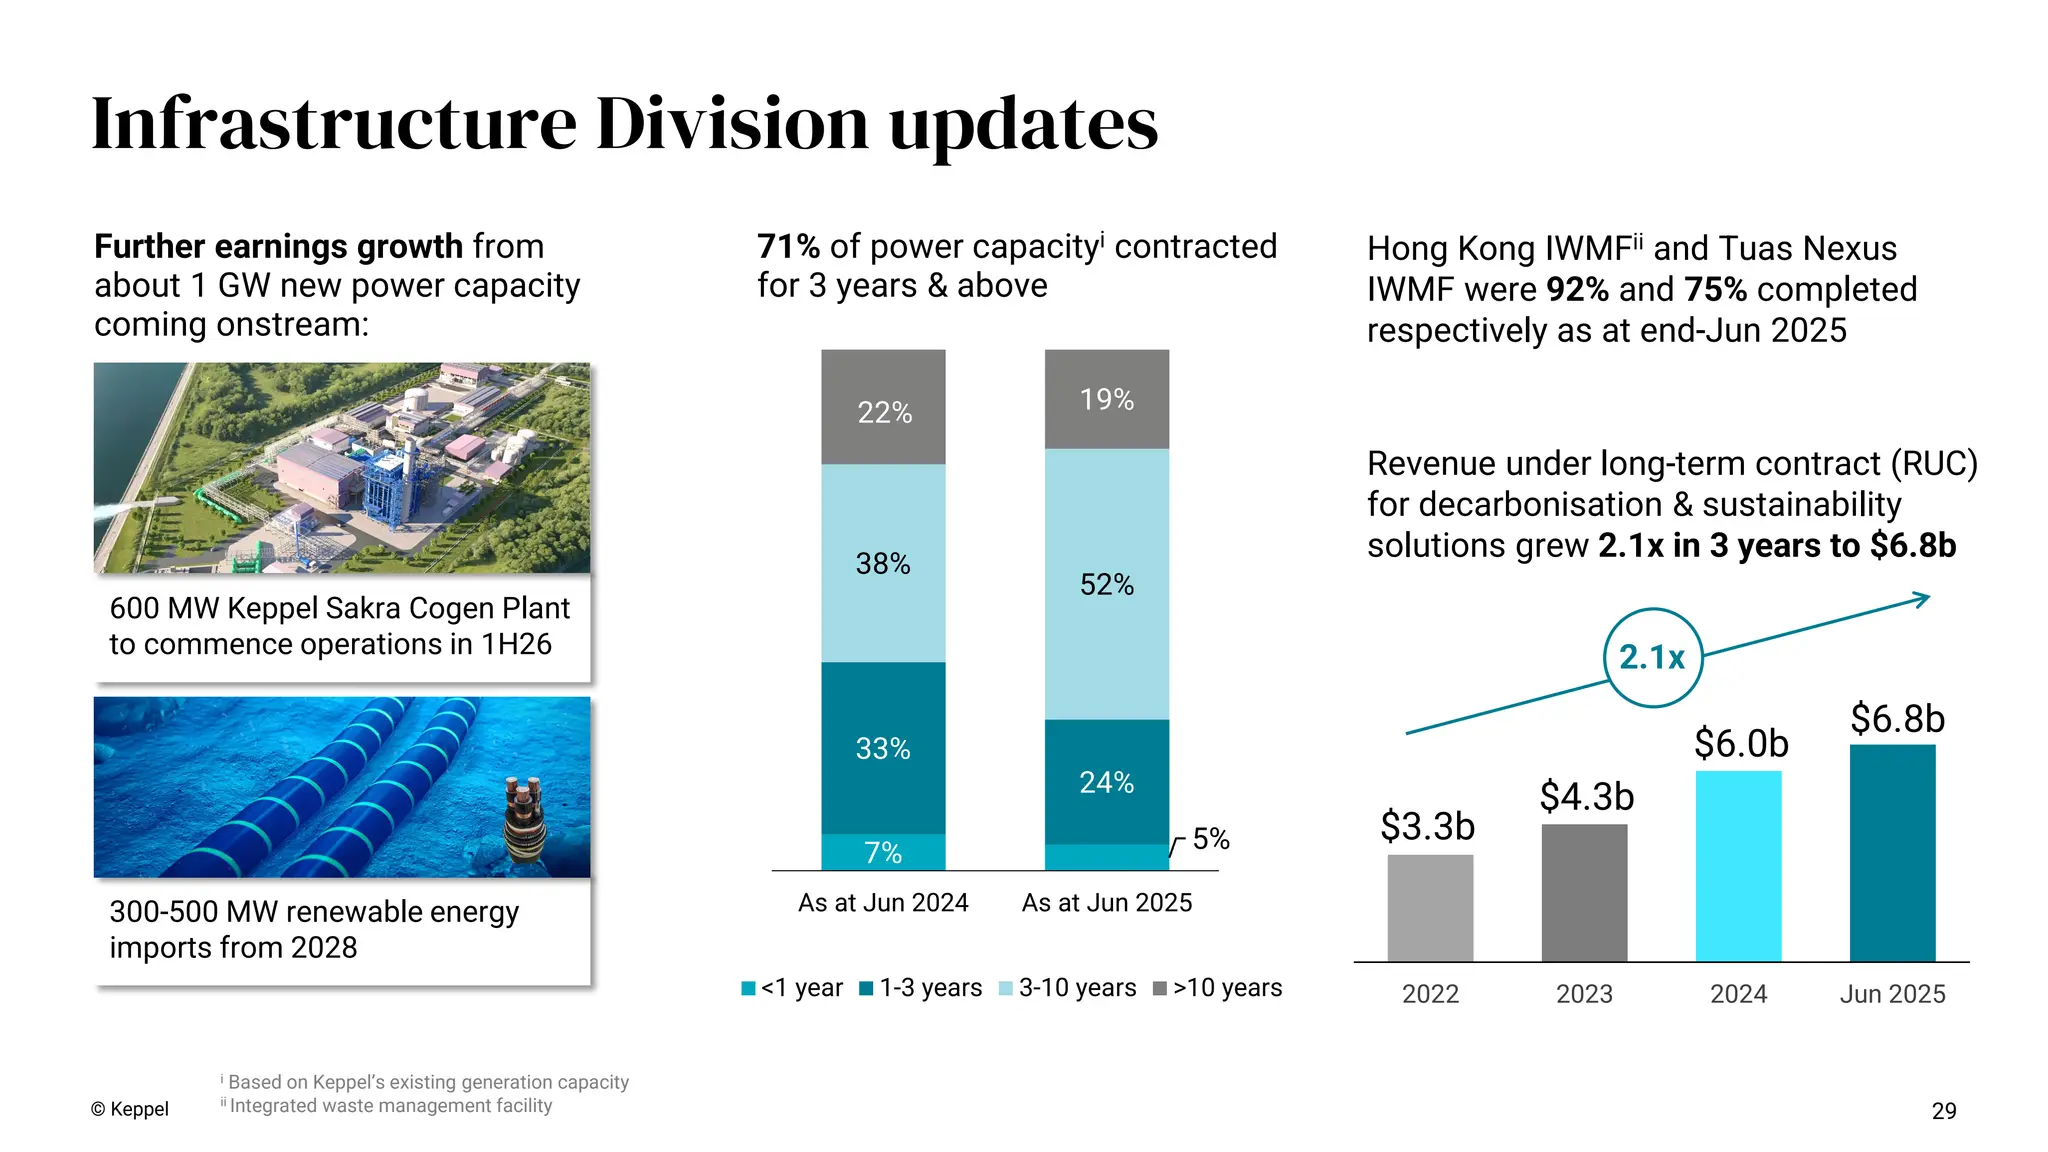
Keppel i Based on Keppel’s existing generation capacity ii Integrated waste management facility Hong Kong IWMFii and Tuas Nexus IWMF were 92% and 75% completed respectively as at end-Jun 2025 Revenue under long-term contract (RUC) for decarbonisation & sustainability solutions grew 2.1x in 3 years to $6.8b 7% 5% 33% 24% 38% 52% 22% 19% As at Jun 2024 As at Jun 2025 <1 year 1-3 years 3-10 years >10 years 71% of power capacityi contracted for 3 years & above 2022 2023 2024 Jun 2025 $6.0b $4.3b $3.3b $6.8b 2.1x Further earnings growth from about 1 GW new power capacity coming onstream: 600 MW Keppel Sakra Cogen Plant to commence operations in 1H26 300-500 MW renewable energy imports from 2028
30.
30 Real Estate Division
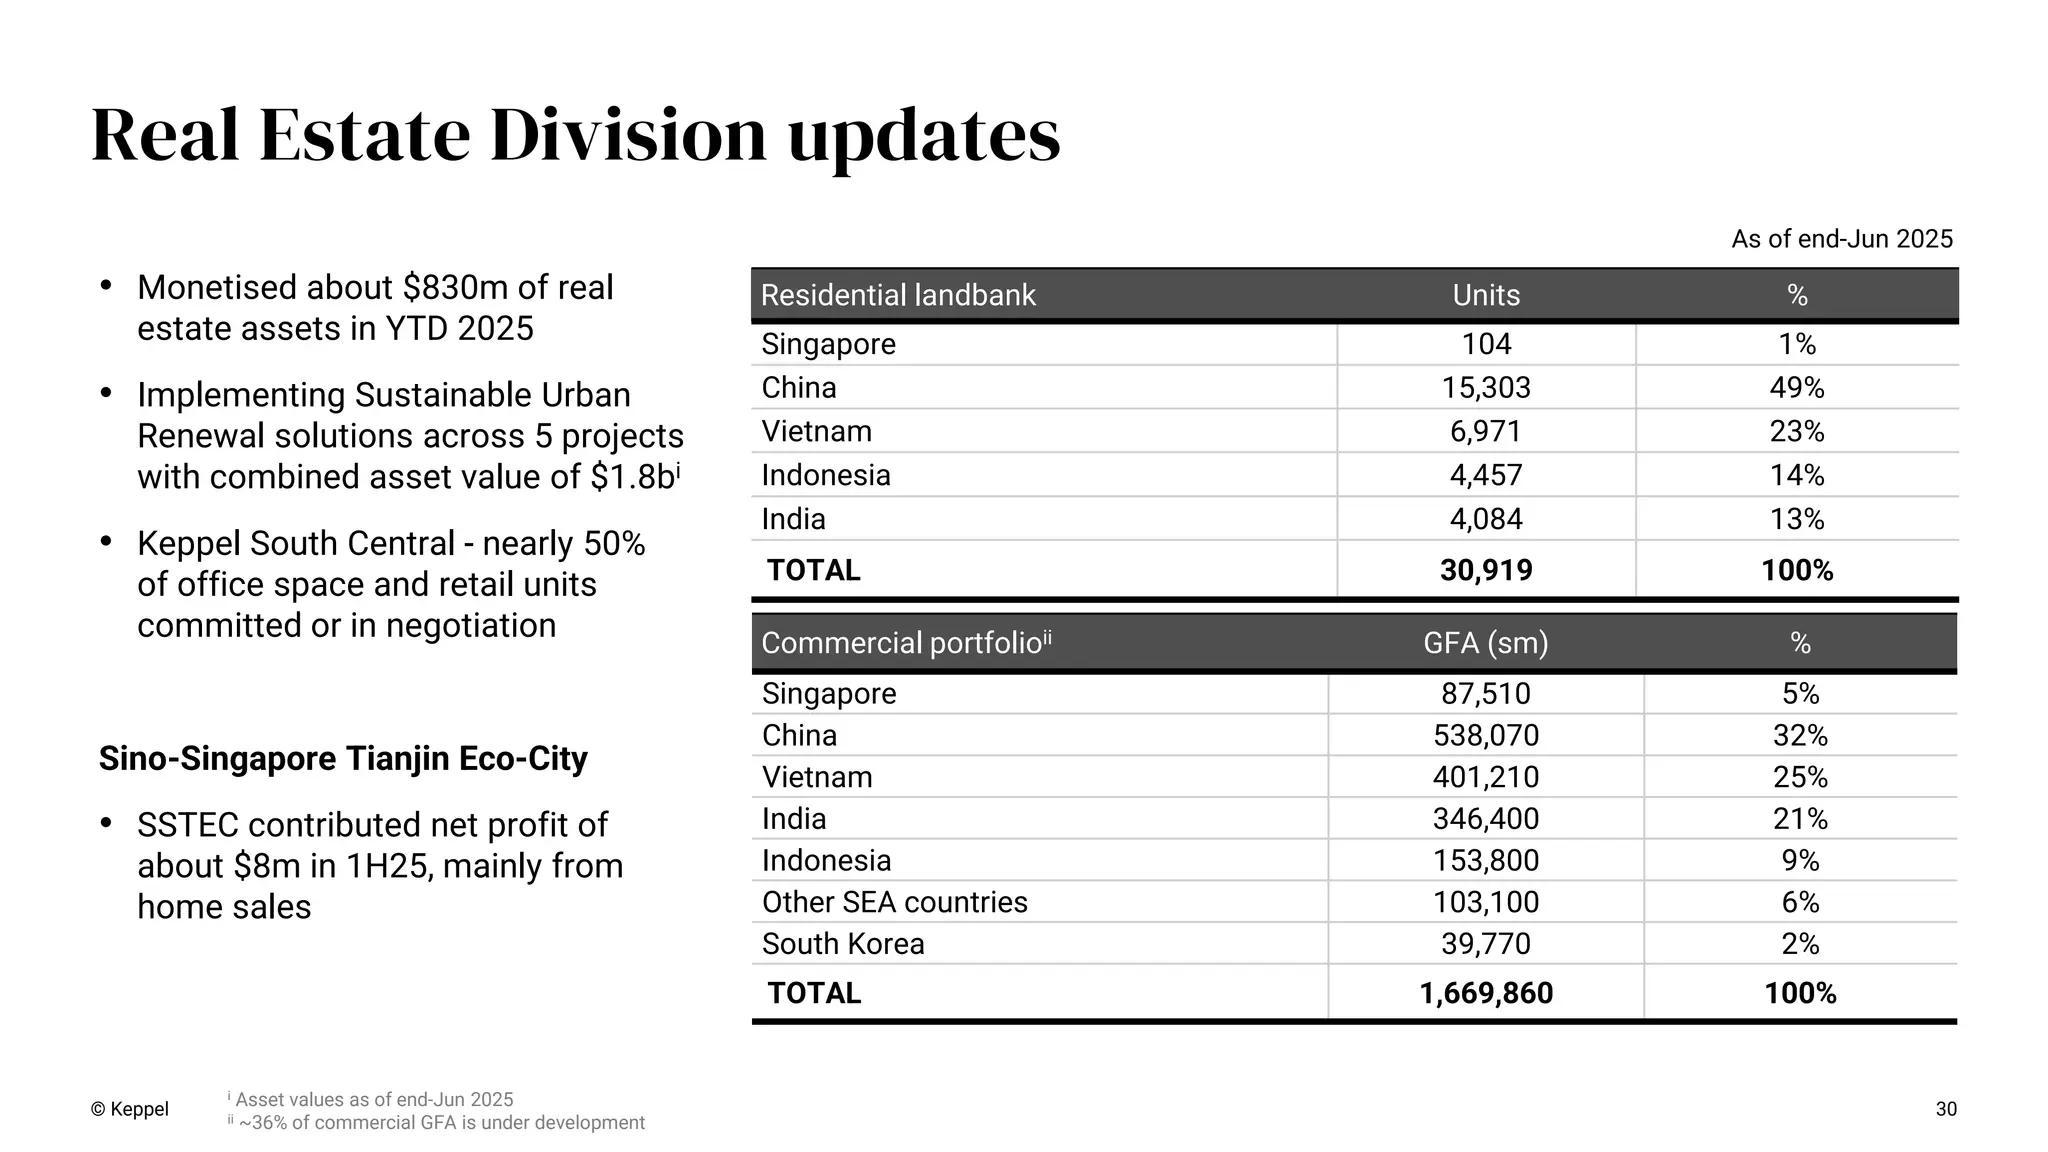
updates Residential landbank Units % Singapore 104 1% China 15,303 49% Vietnam 6,971 23% Indonesia 4,457 14% India 4,084 13% TOTAL 30,919 100% Commercial portfolioii GFA (sm) % Singapore 87,510 5% China 538,070 32% Vietnam 401,210 25% India 346,400 21% Indonesia 153,800 9% Other SEA countries 103,100 6% South Korea 39,770 2% TOTAL 1,669,860 100% © Keppel • Monetised about $830m of real estate assets in YTD 2025 • Implementing Sustainable Urban Renewal solutions across 5 projects with combined asset value of $1.8bi • Keppel South Central - nearly 50% of office space and retail units committed or in negotiation Sino-Singapore Tianjin Eco-City • SSTEC contributed net profit of about $8m in 1H25, mainly from home sales As of end-Jun 2025 i Asset values as of end-Jun 2025 ii ~36% of commercial GFA is under development
31.
Data centre portfolio
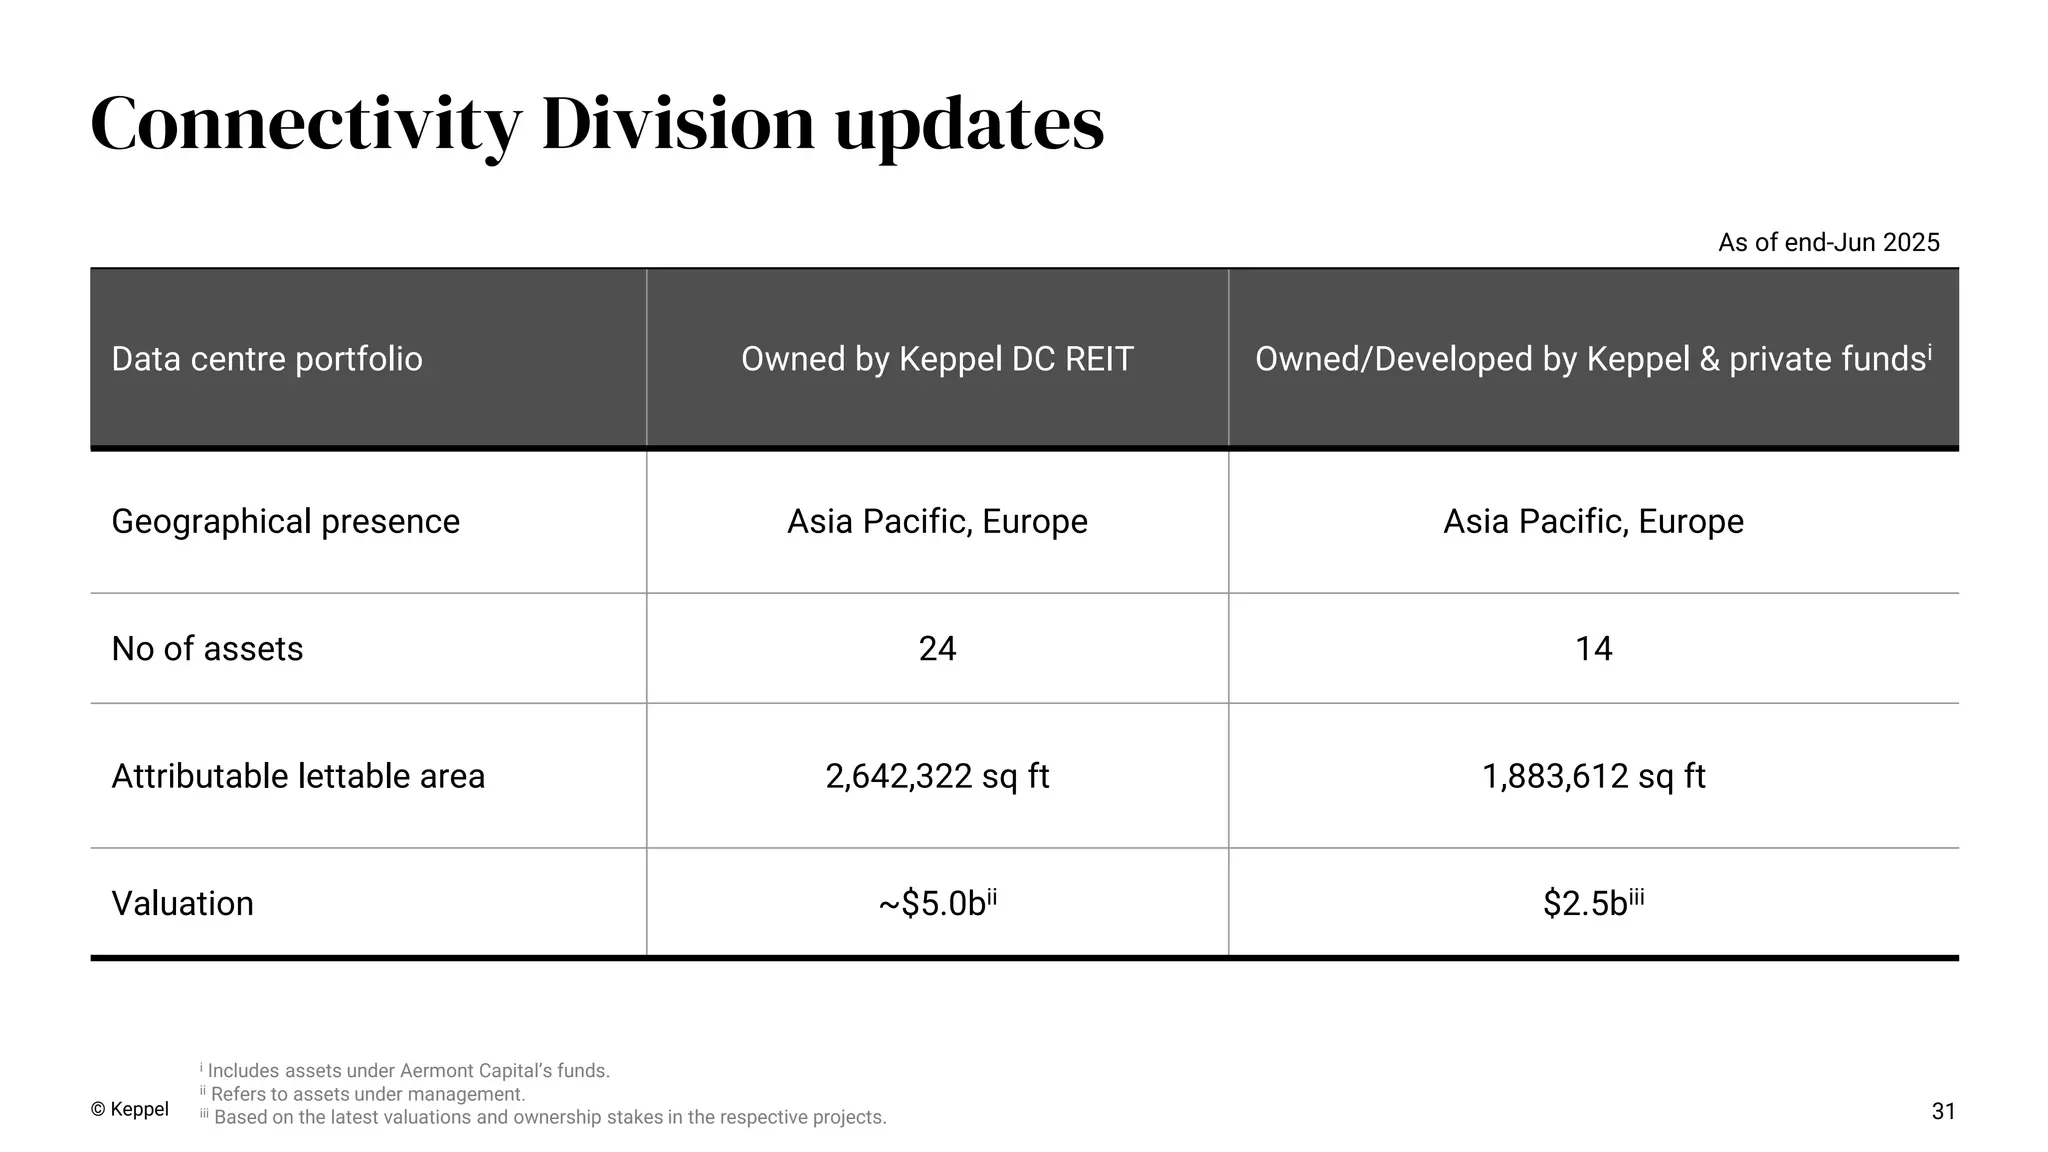
Owned by Keppel DC REIT Owned/Developed by Keppel & private fundsi Geographical presence Asia Pacific, Europe Asia Pacific, Europe No of assets 24 14 Attributable lettable area 2,642,322 sq ft 1,883,612 sq ft Valuation ~$5.0bii $2.5biii As of end-Jun 2025 i Includes assets under Aermont Capital’s funds. ii Refers to assets under management. iii Based on the latest valuations and ownership stakes in the respective projects. 31 Connectivity Division updates © Keppel
32.
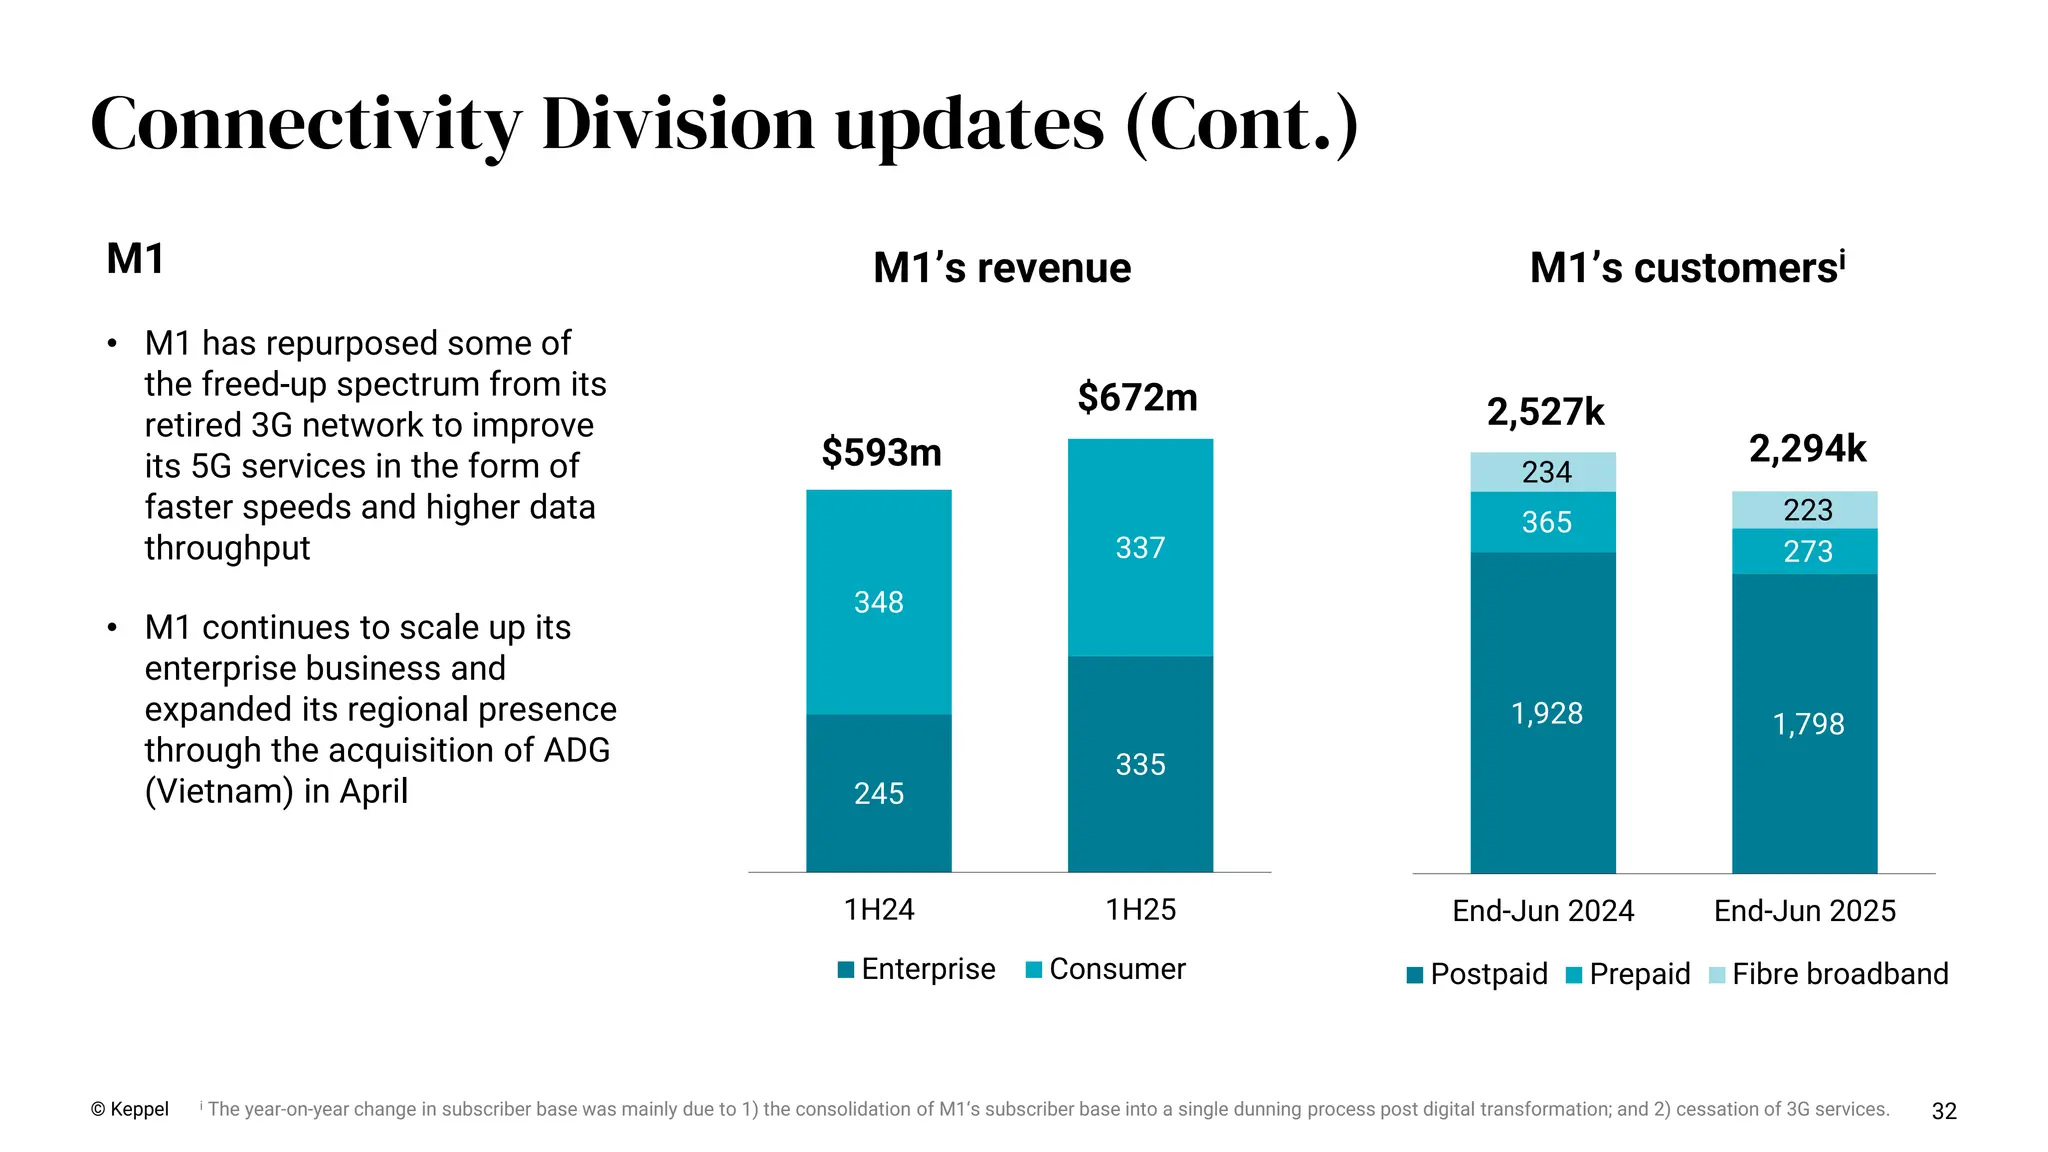
32 Connectivity Division updates
(Cont.) © Keppel 1,928 1,798 365 273 234 223 End-Jun 2024 End-Jun 2025 Postpaid Prepaid Fibre broadband 2,527k 2,294k 245 335 348 337 1H24 1H25 Enterprise Consumer $593m $672m M1’s customersi M1’s revenue M1 • M1 has repurposed some of the freed-up spectrum from its retired 3G network to improve its 5G services in the form of faster speeds and higher data throughput • M1 continues to scale up its enterprise business and expanded its regional presence through the acquisition of ADG (Vietnam) in April i The year-on-year change in subscriber base was mainly due to 1) the consolidation of M1‘s subscriber base into a single dunning process post digital transformation; and 2) cessation of 3G services.
33.
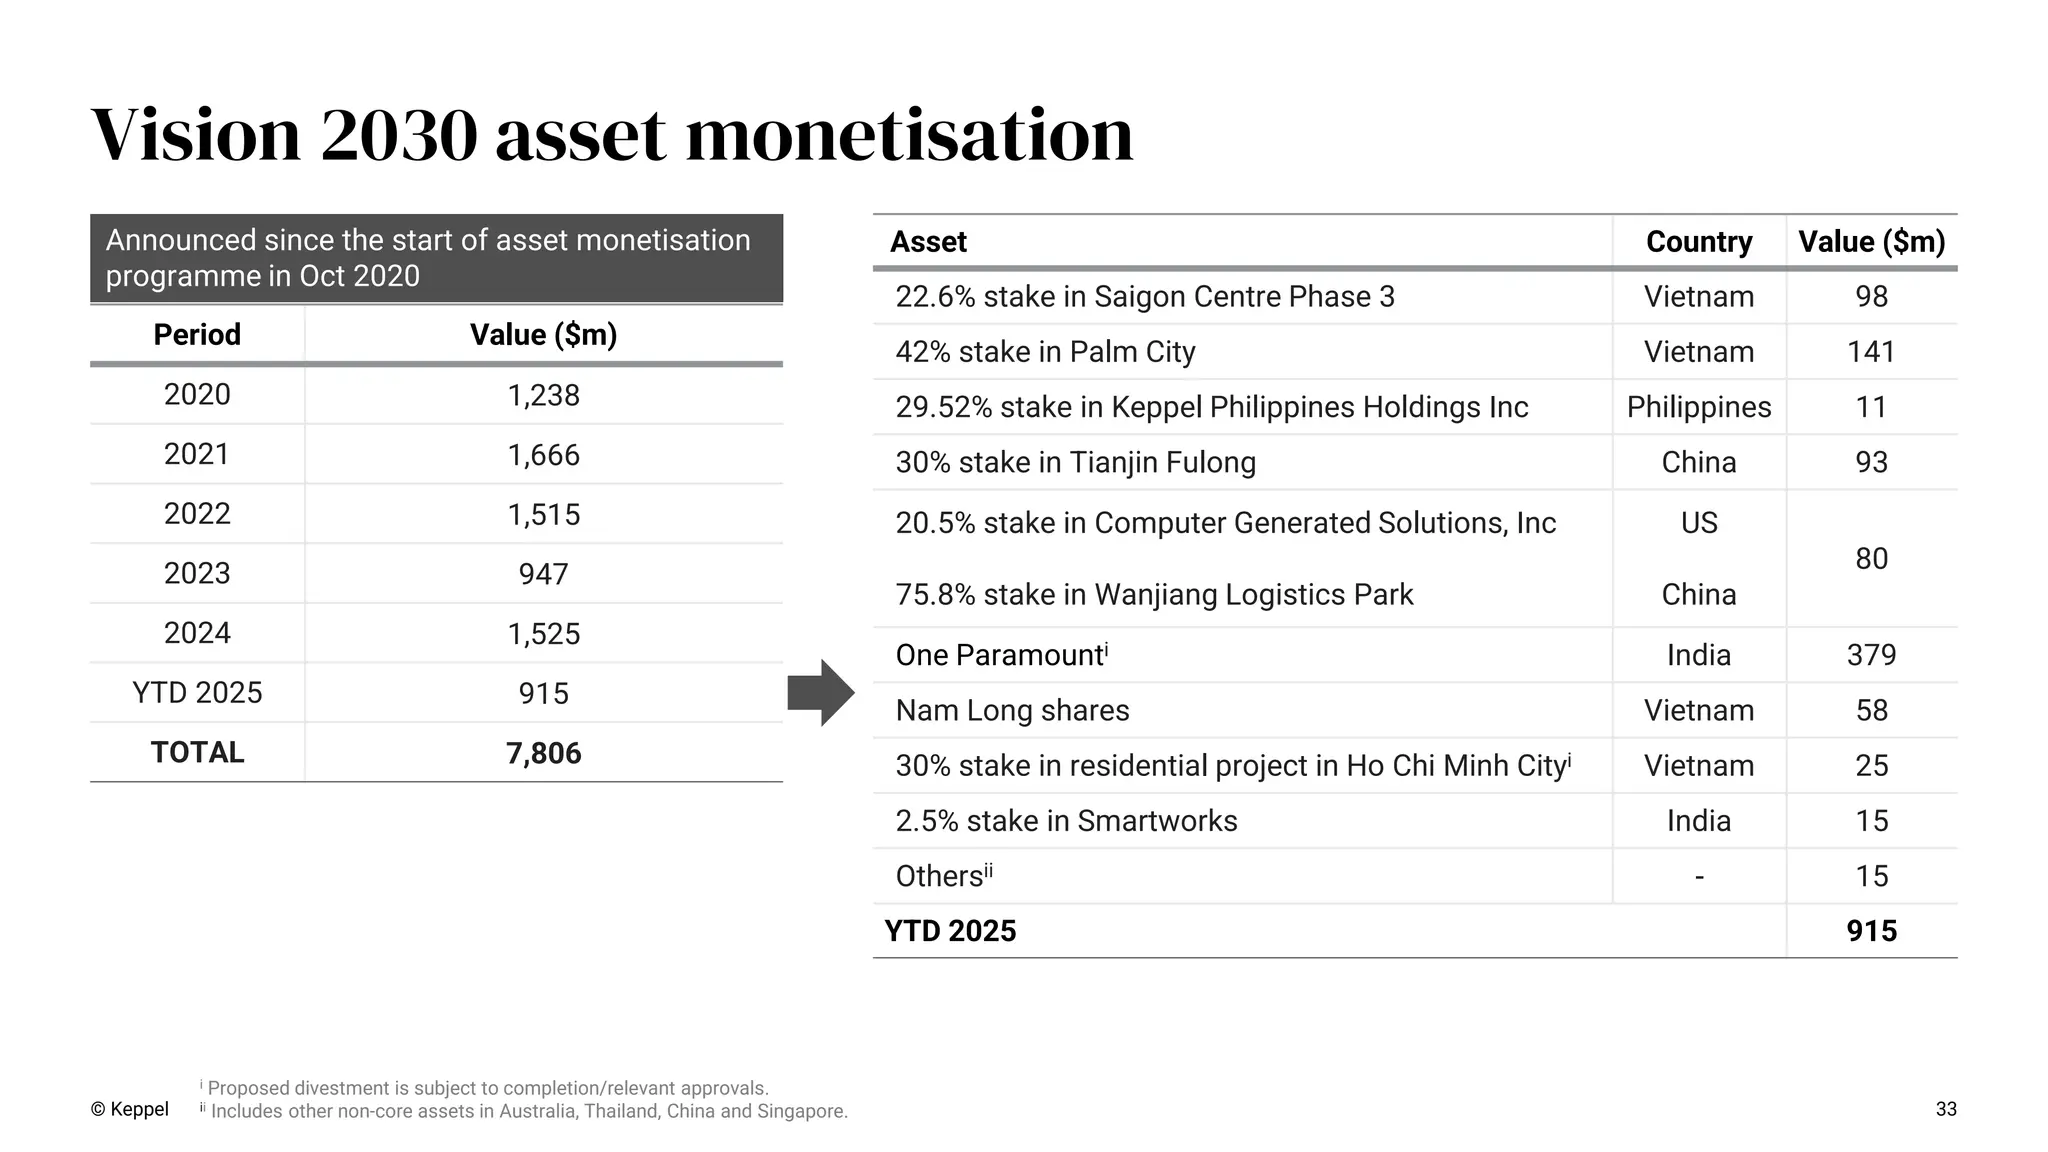
© Keppel 33 Period
Value ($m) 2020 1,238 2021 1,666 2022 1,515 2023 947 2024 1,525 YTD 2025 915 TOTAL 7,806 Asset Country Value ($m) 22.6% stake in Saigon Centre Phase 3 Vietnam 98 42% stake in Palm City Vietnam 141 29.52% stake in Keppel Philippines Holdings Inc Philippines 11 30% stake in Tianjin Fulong China 93 20.5% stake in Computer Generated Solutions, Inc 75.8% stake in Wanjiang Logistics Park US China 80 One Paramounti India 379 Nam Long shares Vietnam 58 30% stake in residential project in Ho Chi Minh Cityi Vietnam 25 2.5% stake in Smartworks India 15 Othersii - 15 YTD 2025 915 Announced since the start of asset monetisation programme in Oct 2020 Vision 2030 asset monetisation i Proposed divestment is subject to completion/relevant approvals. ii Includes other non-core assets in Australia, Thailand, China and Singapore.
34.
Appendices -Additional financial information 03 34
35.
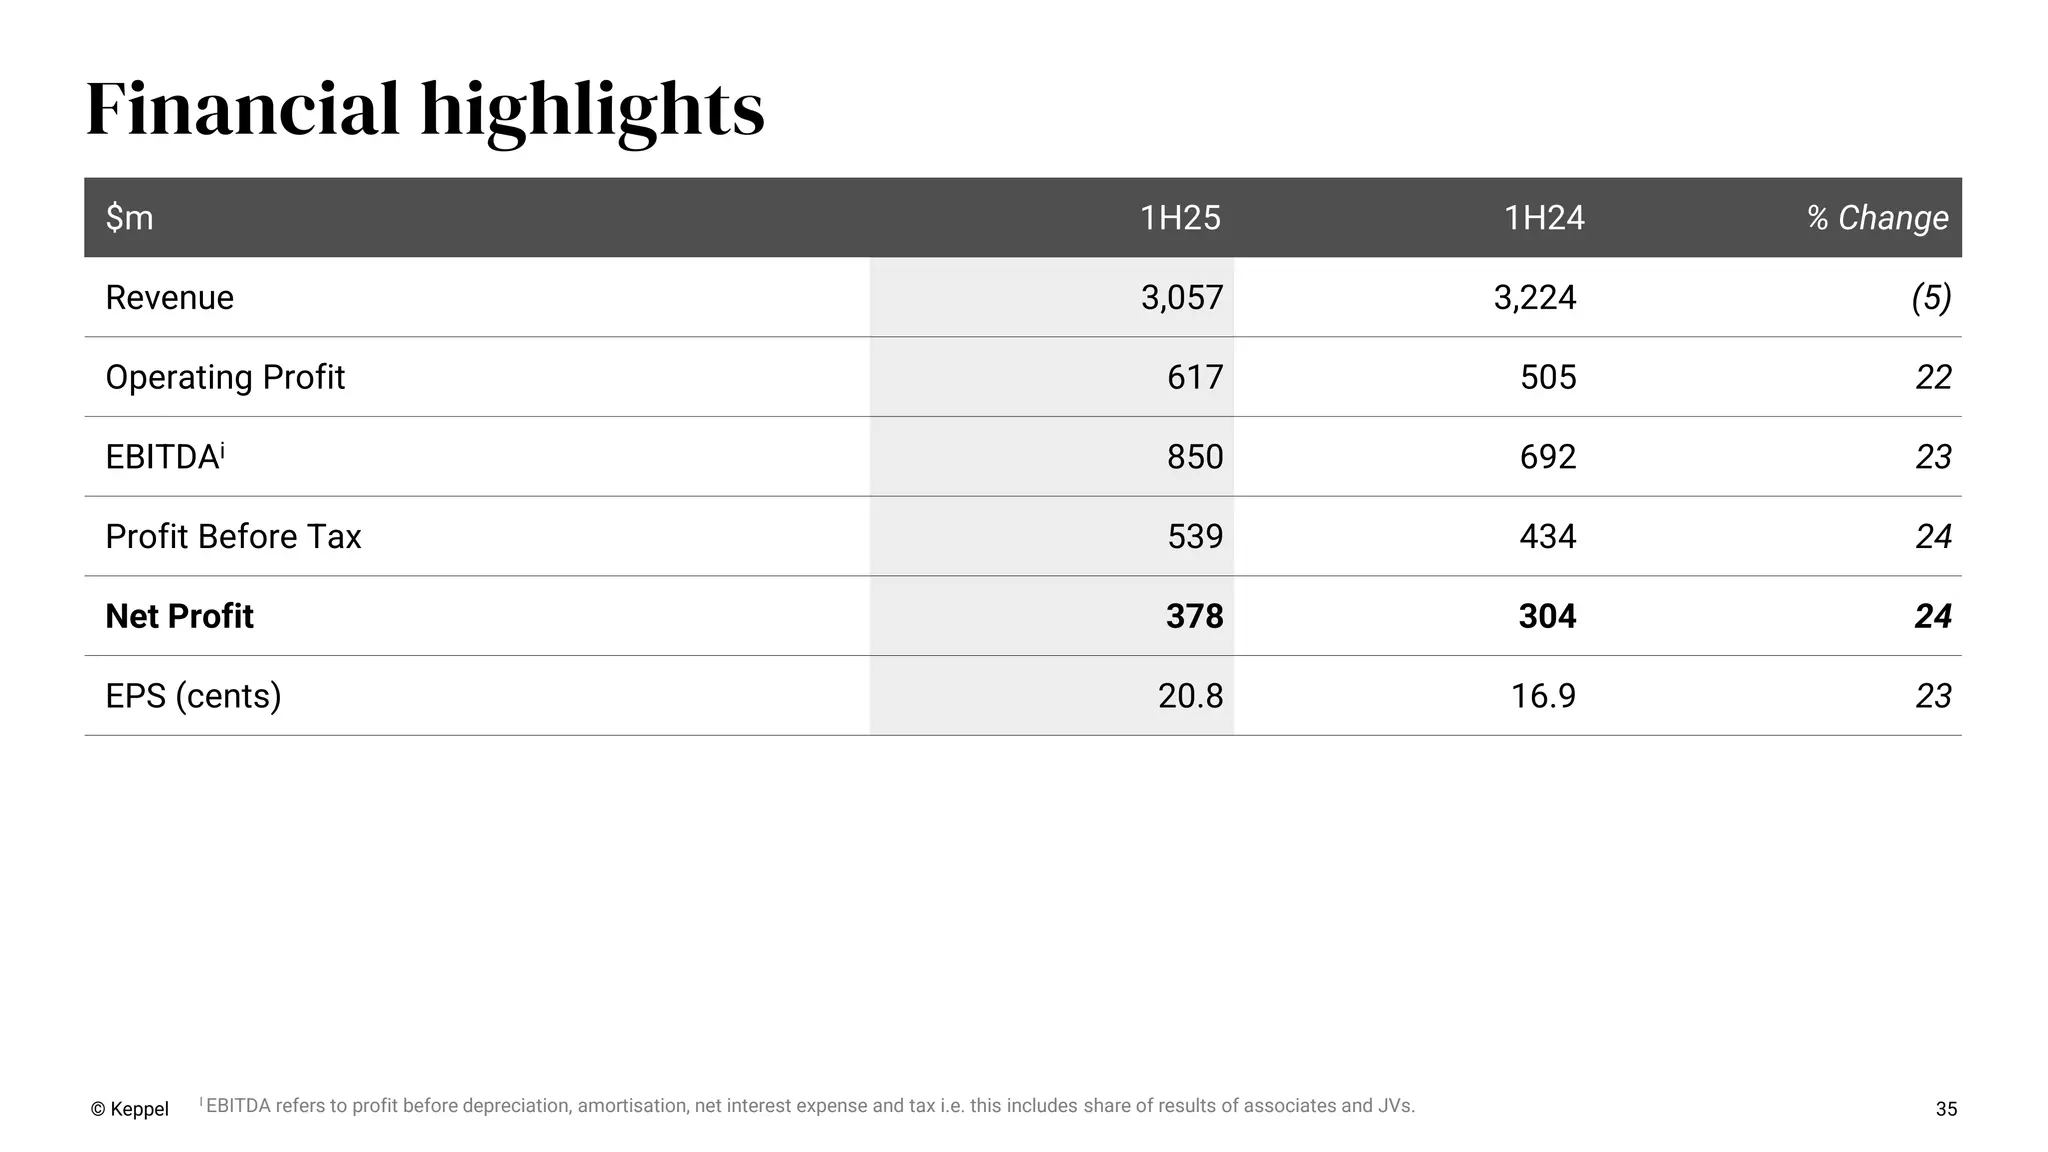
$m 1H25 1H24
% Change Revenue 3,057 3,224 (5) Operating Profit 617 505 22 EBITDAi 850 692 23 Profit Before Tax 539 434 24 Net Profit 378 304 24 EPS (cents) 20.8 16.9 23 Financial highlights © Keppel 35 I EBITDA refers to profit before depreciation, amortisation, net interest expense and tax i.e. this includes share of results of associates and JVs.
36.
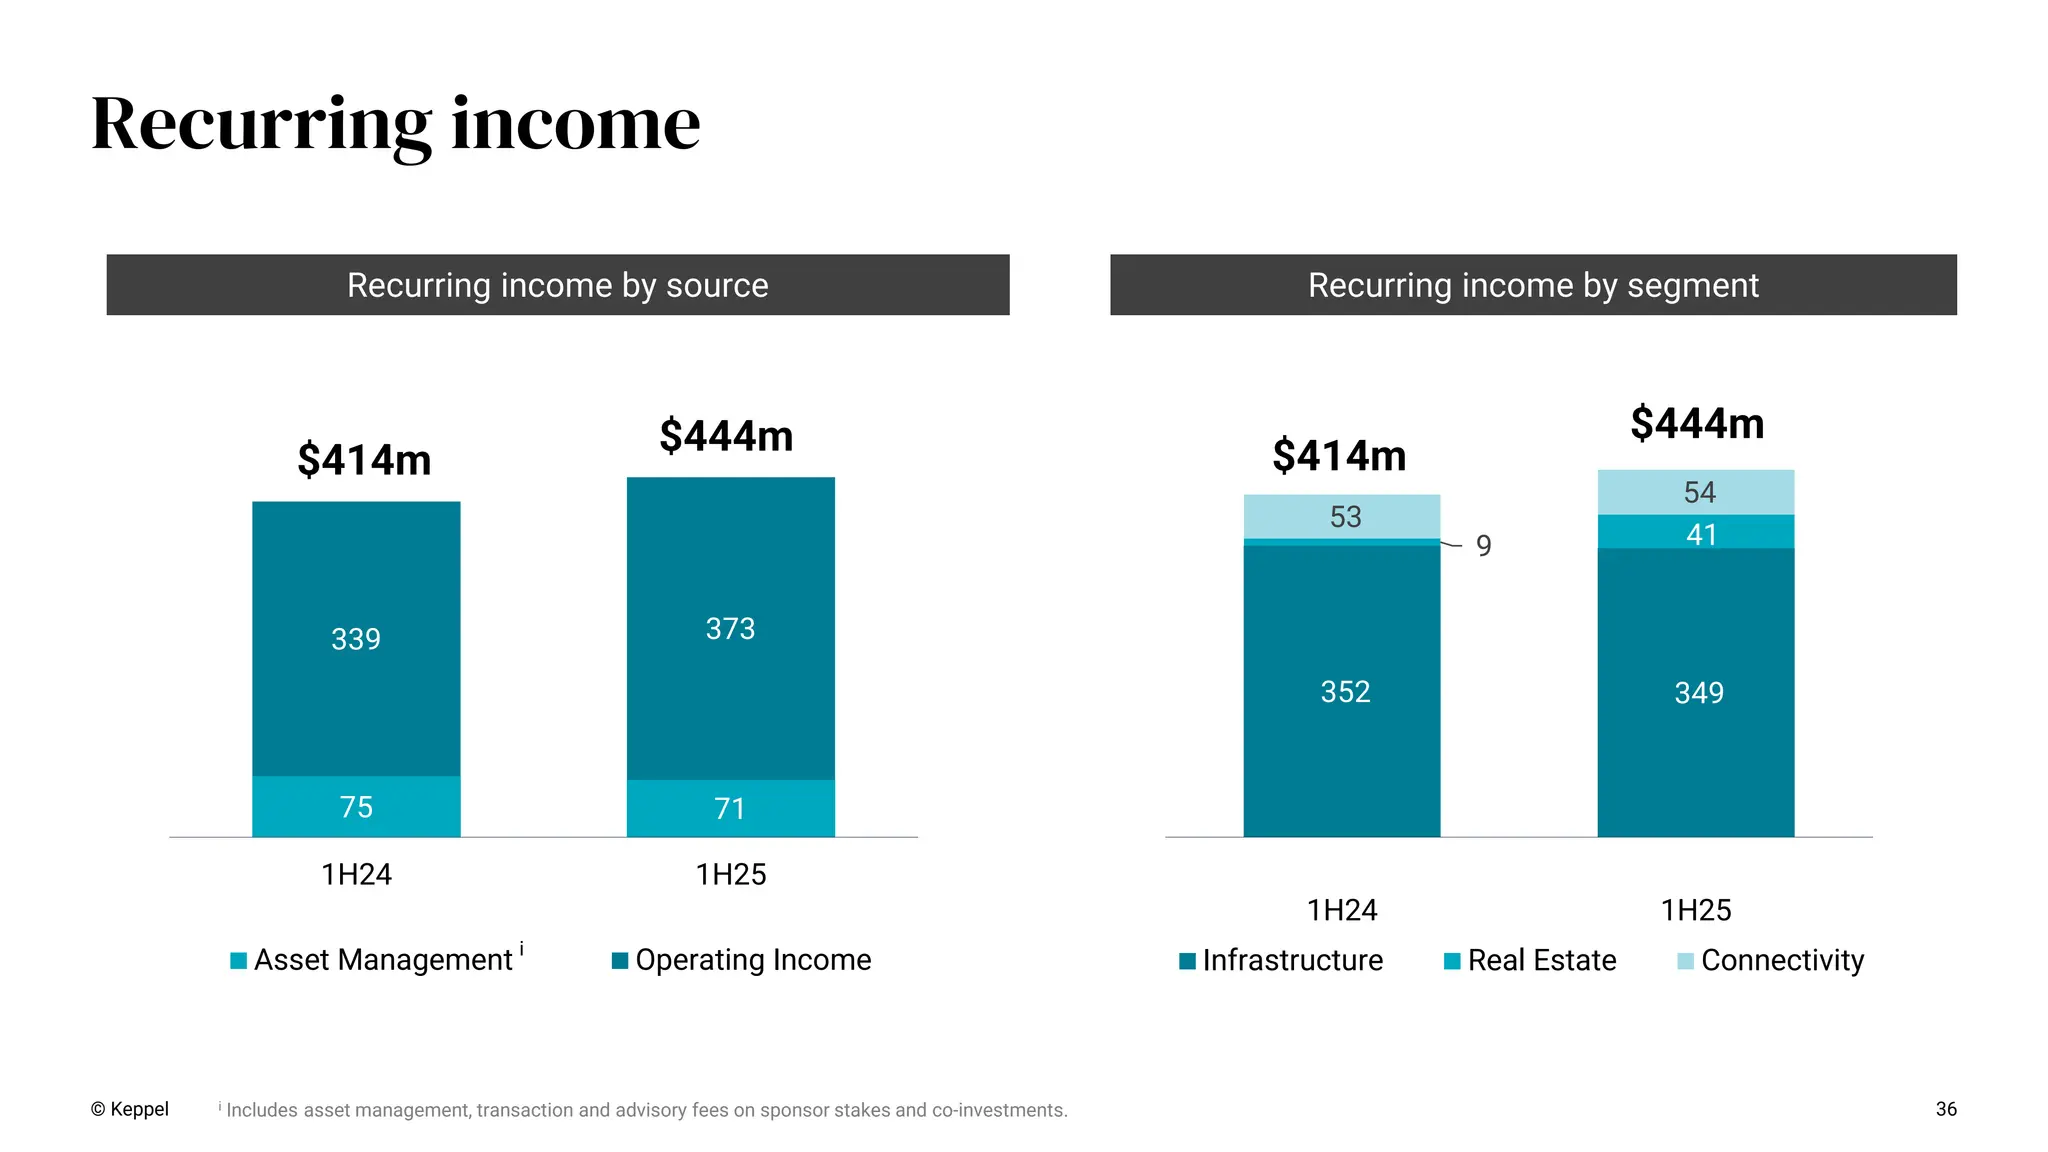
75 71 339 373 1H24
1H25 Asset Management Operating Income $414m $444m 352 349 9 41 53 54 1H24 1H25 Infrastructure Real Estate Connectivity $444m $414m Recurring income by segment Recurring income by source 36 © Keppel Recurring income i Includes asset management, transaction and advisory fees on sponsor stakes and co-investments. i
37.
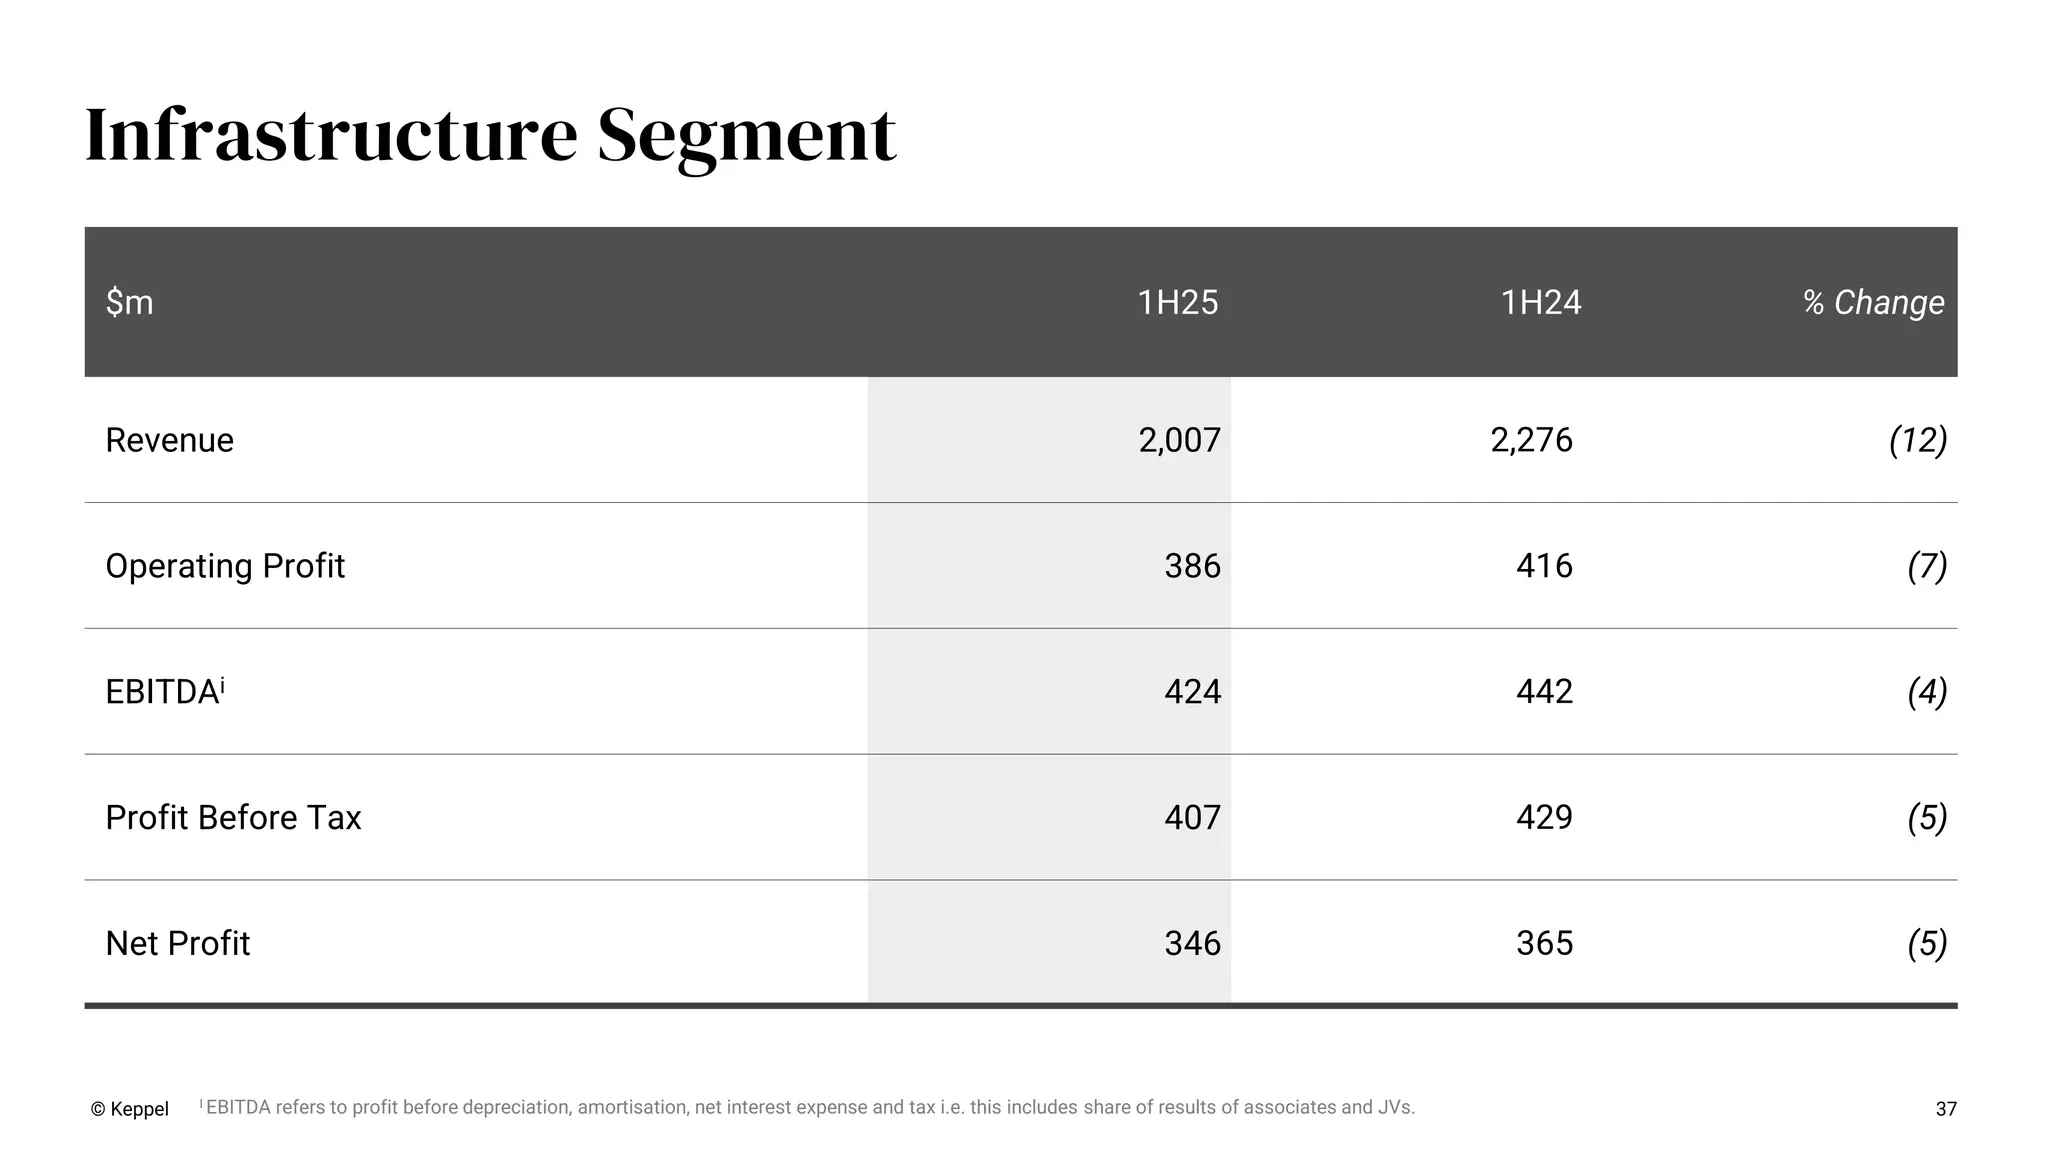
Infrastructure Segment 37 $m 1H25
1H24 % Change Revenue 2,007 2,276 (12) Operating Profit 386 416 (7) EBITDAi 424 442 (4) Profit Before Tax 407 429 (5) Net Profit 346 365 (5) © Keppel I EBITDA refers to profit before depreciation, amortisation, net interest expense and tax i.e. this includes share of results of associates and JVs.
38.
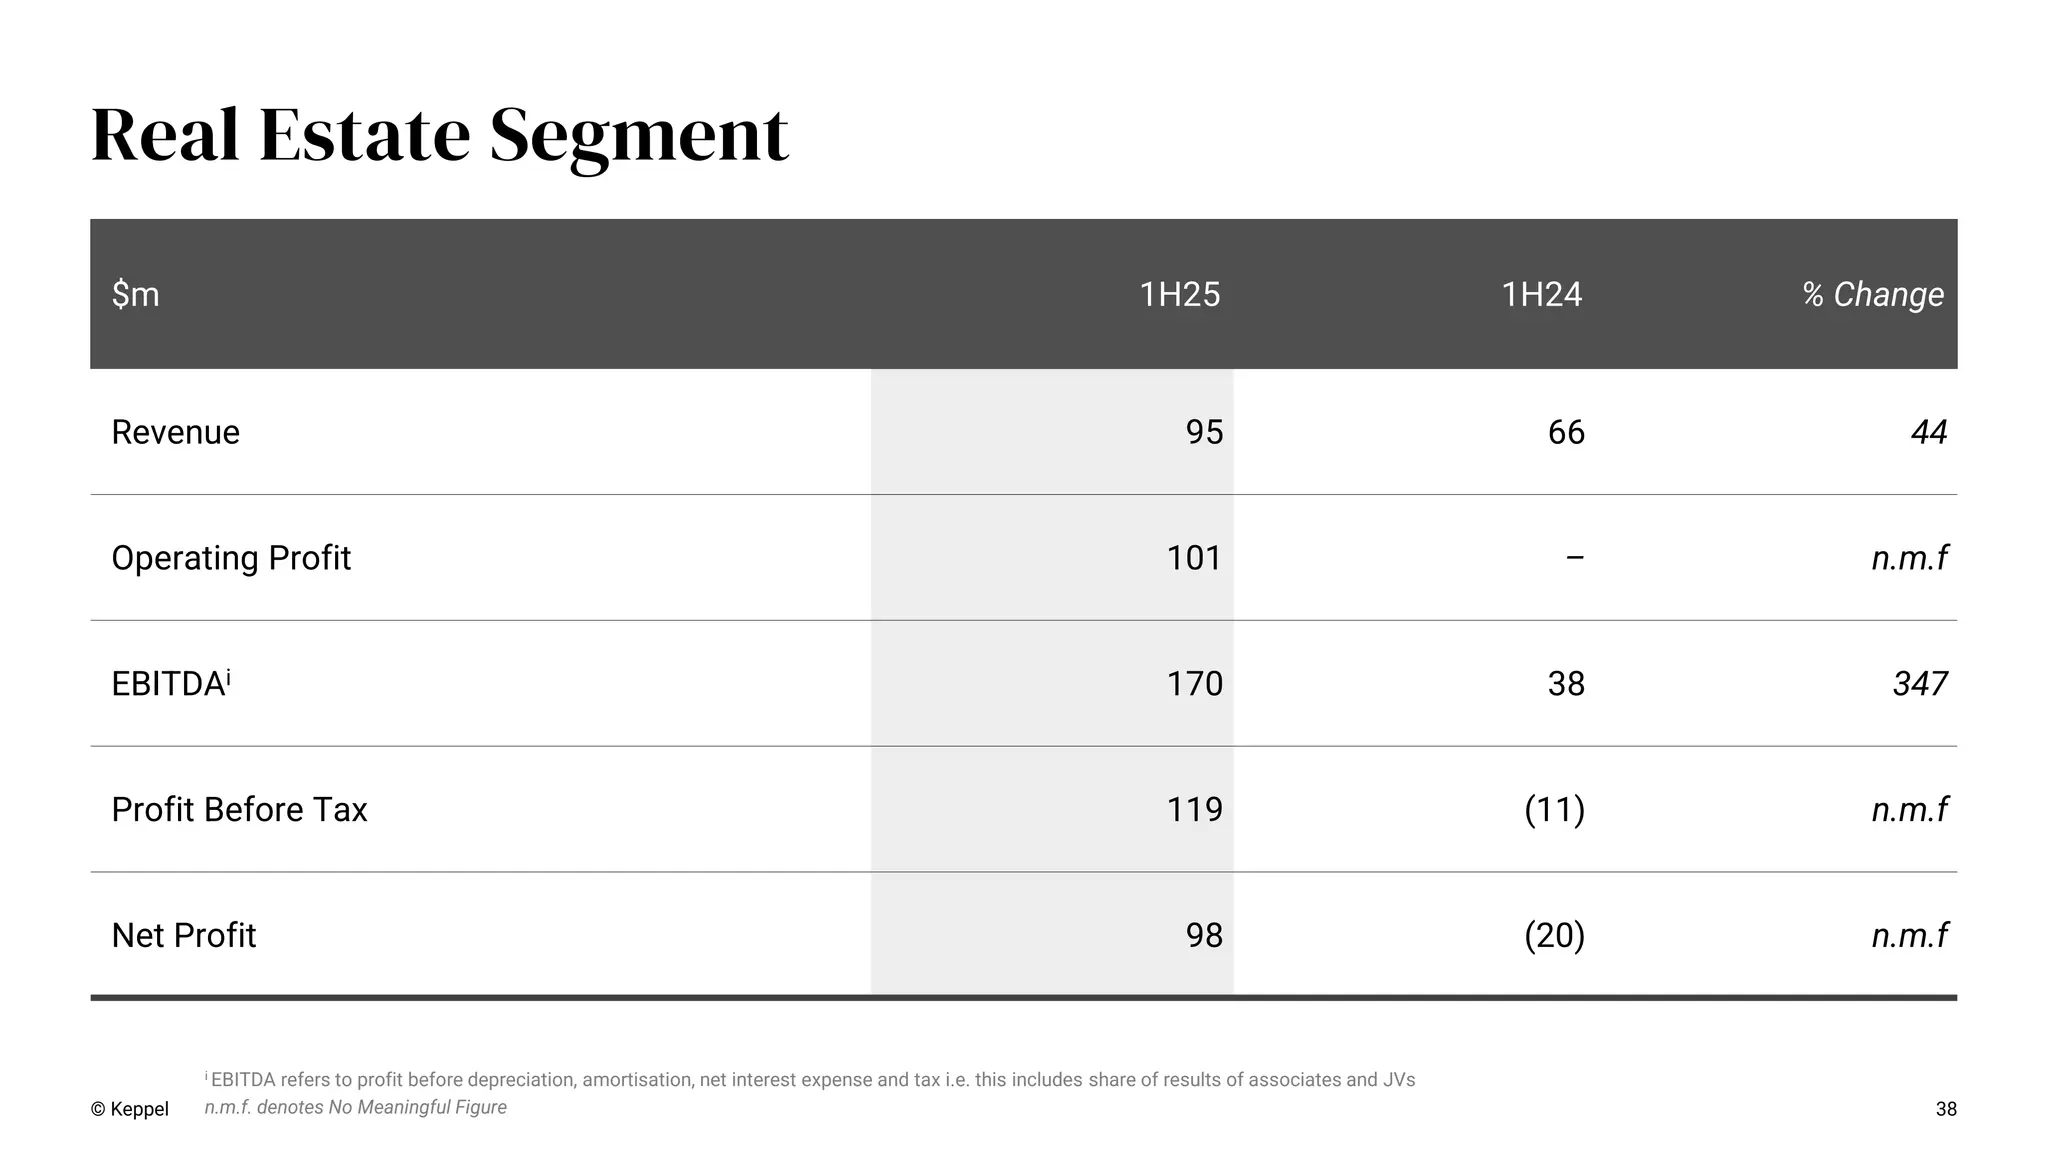
38 Real Estate Segment $m
1H25 1H24 % Change Revenue 95 66 44 Operating Profit 101 – n.m.f EBITDAi 170 38 347 Profit Before Tax 119 (11) n.m.f Net Profit 98 (20) n.m.f © Keppel n.m.f. denotes No Meaningful Figure i EBITDA refers to profit before depreciation, amortisation, net interest expense and tax i.e. this includes share of results of associates and JVs
39.
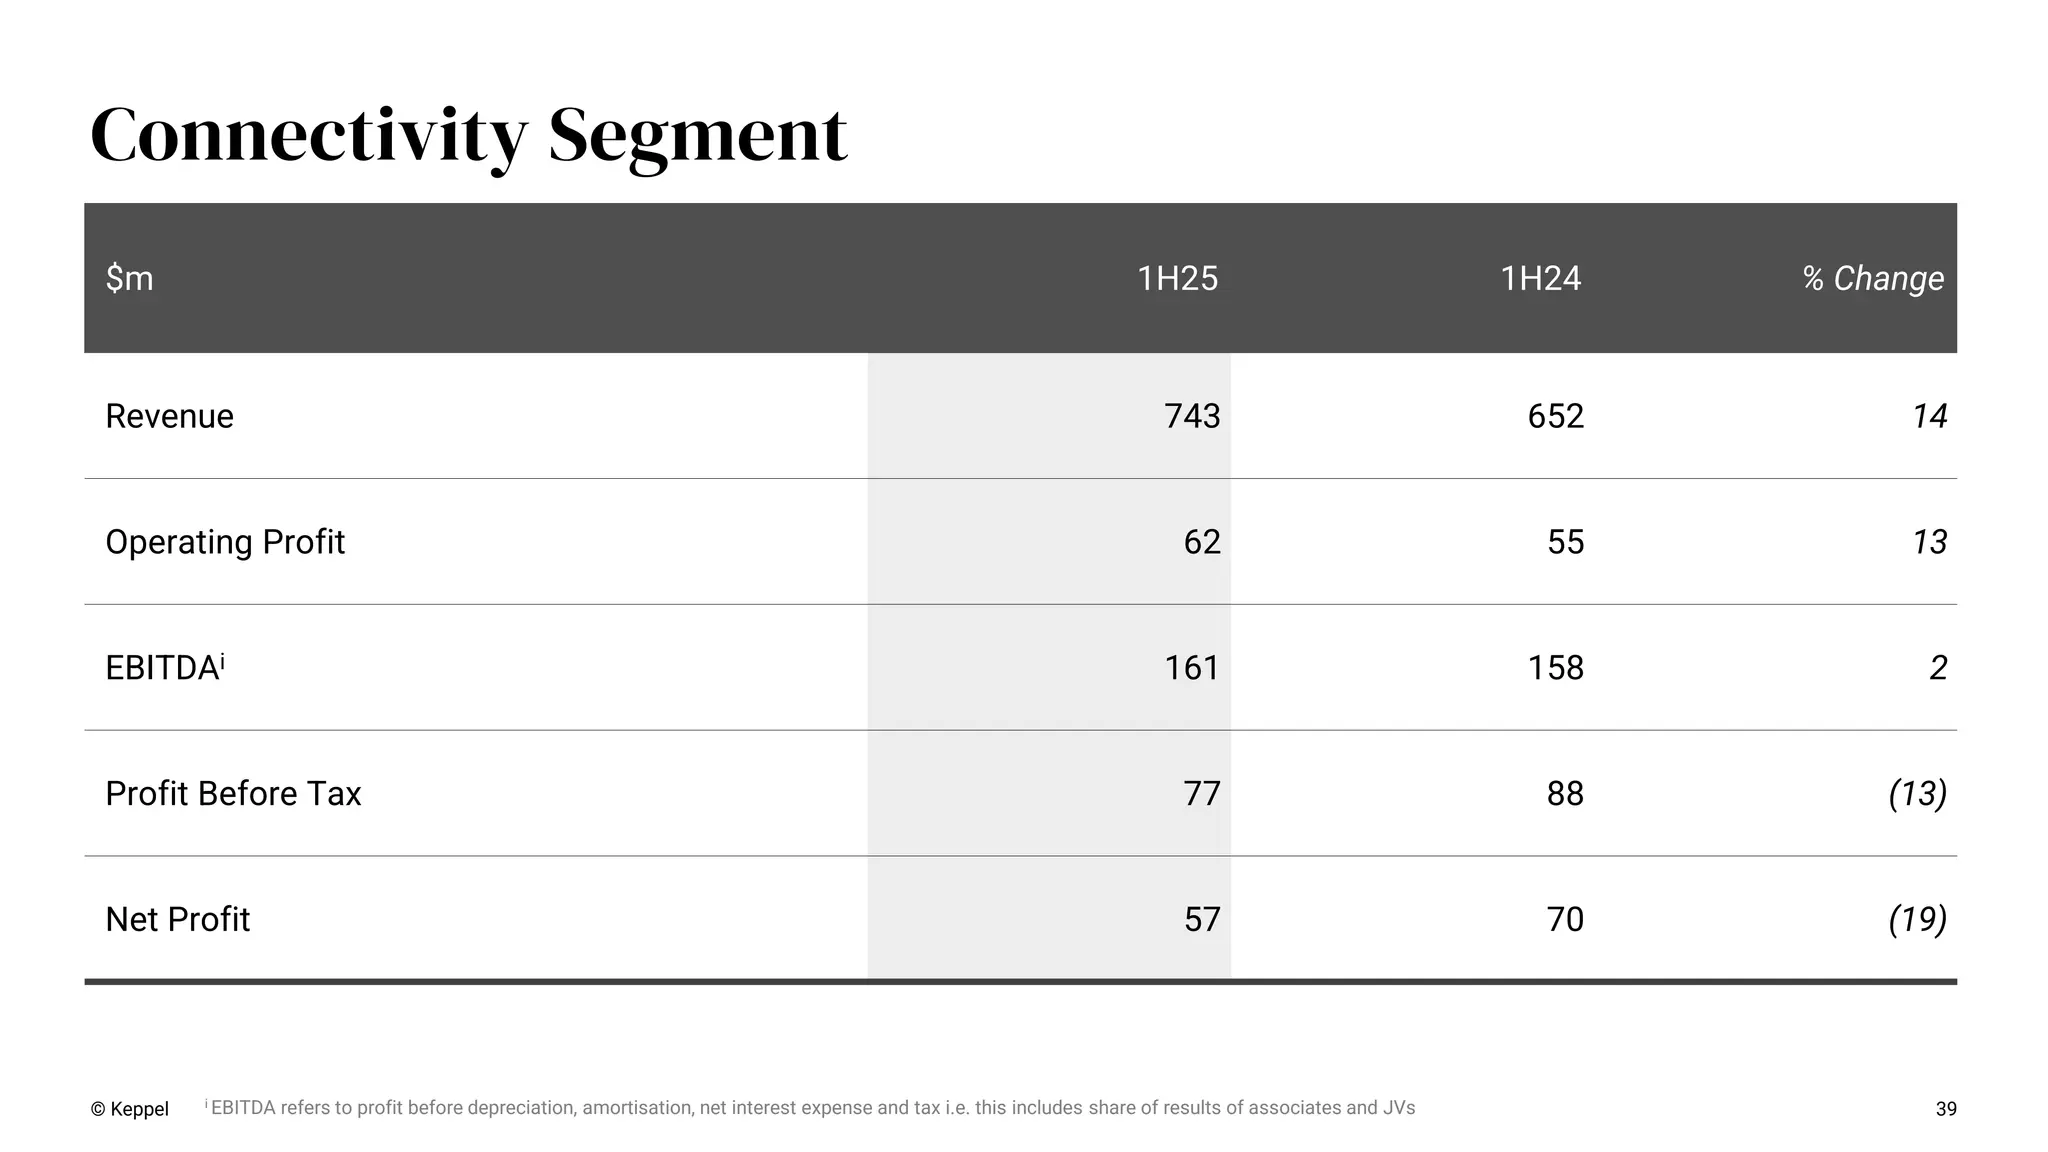
39 Connectivity Segment $m 1H25
1H24 % Change Revenue 743 652 14 Operating Profit 62 55 13 EBITDAi 161 158 2 Profit Before Tax 77 88 (13) Net Profit 57 70 (19) © Keppel i EBITDA refers to profit before depreciation, amortisation, net interest expense and tax i.e. this includes share of results of associates and JVs
40.
40 Non-Core Portfolio for
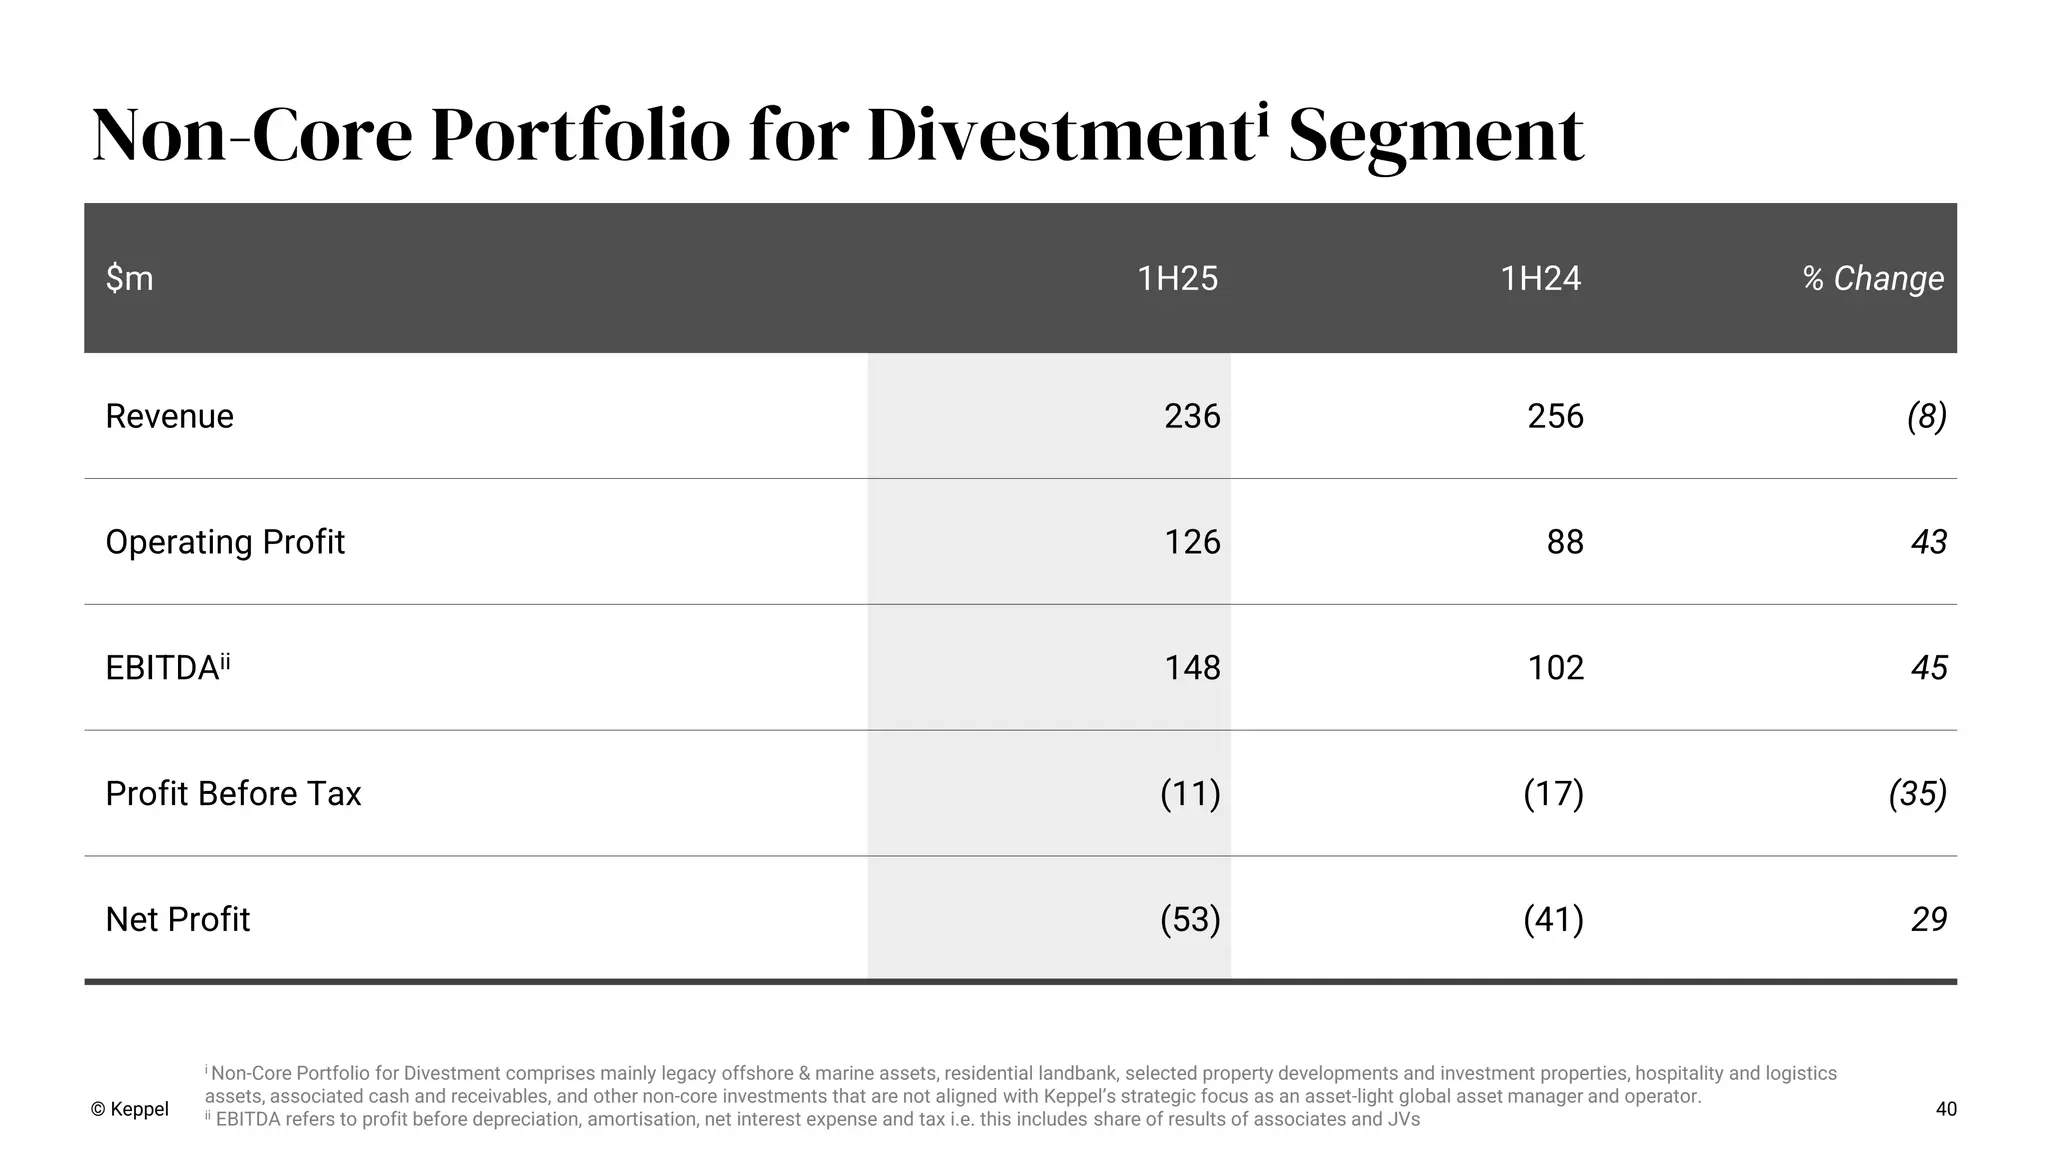
Divestmenti Segment $m 1H25 1H24 % Change Revenue 236 256 (8) Operating Profit 126 88 43 EBITDAii 148 102 45 Profit Before Tax (11) (17) (35) Net Profit (53) (41) 29 © Keppel i Non-Core Portfolio for Divestment comprises mainly legacy offshore & marine assets, residential landbank, selected property developments and investment properties, hospitality and logistics assets, associated cash and receivables, and other non-core investments that are not aligned with Keppel’s strategic focus as an asset-light global asset manager and operator. ii EBITDA refers to profit before depreciation, amortisation, net interest expense and tax i.e. this includes share of results of associates and JVs
41.
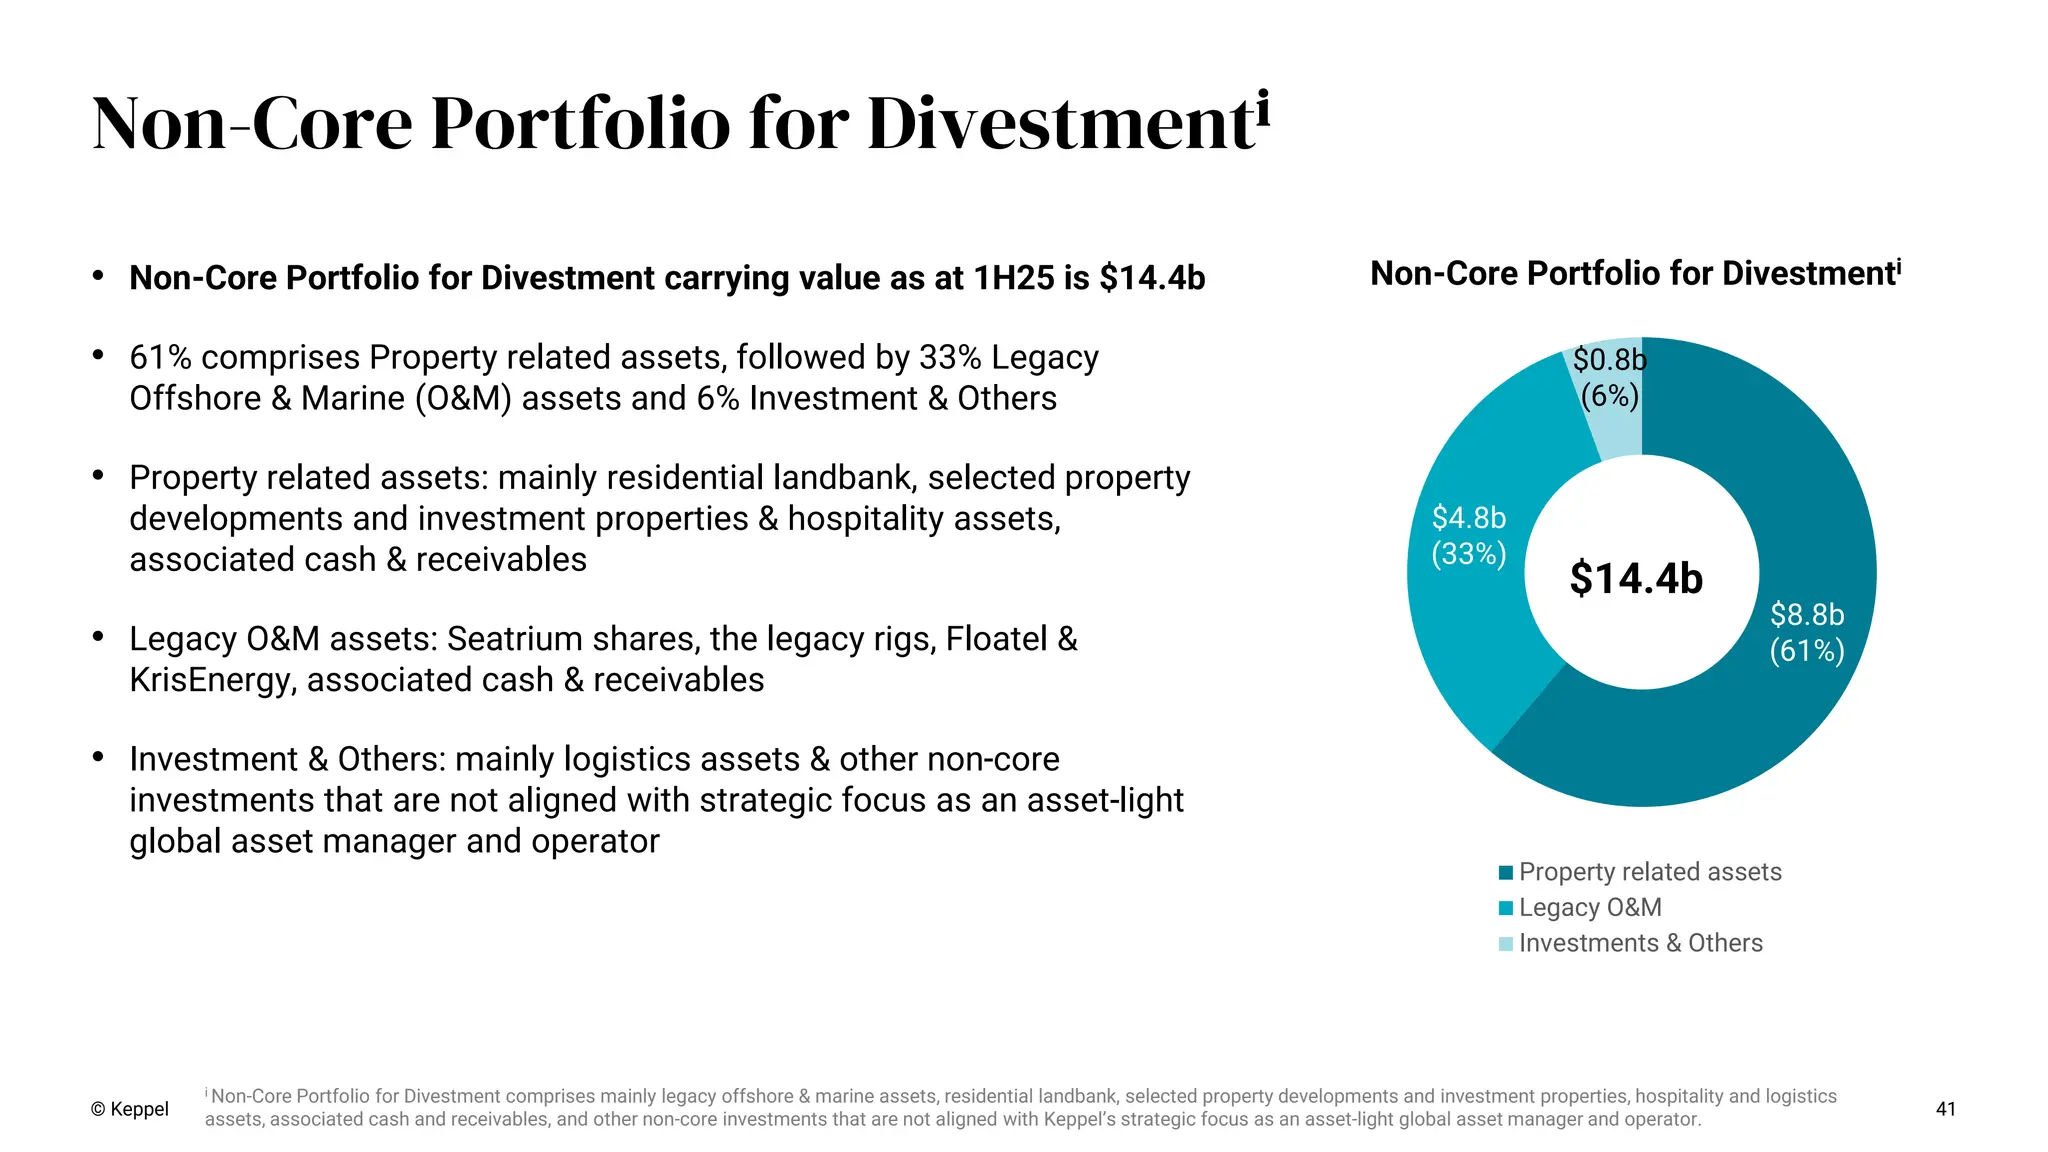
• Non-Core Portfolio
for Divestment carrying value as at 1H25 is $14.4b • 61% comprises Property related assets, followed by 33% Legacy Offshore & Marine (O&M) assets and 6% Investment & Others • Property related assets: mainly residential landbank, selected property developments and investment properties & hospitality assets, associated cash & receivables • Legacy O&M assets: Seatrium shares, the legacy rigs, Floatel & KrisEnergy, associated cash & receivables • Investment & Others: mainly logistics assets & other non-core investments that are not aligned with strategic focus as an asset-light global asset manager and operator © Keppel 41 Non-Core Portfolio for Divestmenti $8.8b (61%) $4.8b (33%) $0.8b (6%) Property related assets Legacy O&M Investments & Others $14.4b i Non-Core Portfolio for Divestment comprises mainly legacy offshore & marine assets, residential landbank, selected property developments and investment properties, hospitality and logistics assets, associated cash and receivables, and other non-core investments that are not aligned with Keppel’s strategic focus as an asset-light global asset manager and operator. Non-Core Portfolio for Divestmenti
42.
42 Net profit by
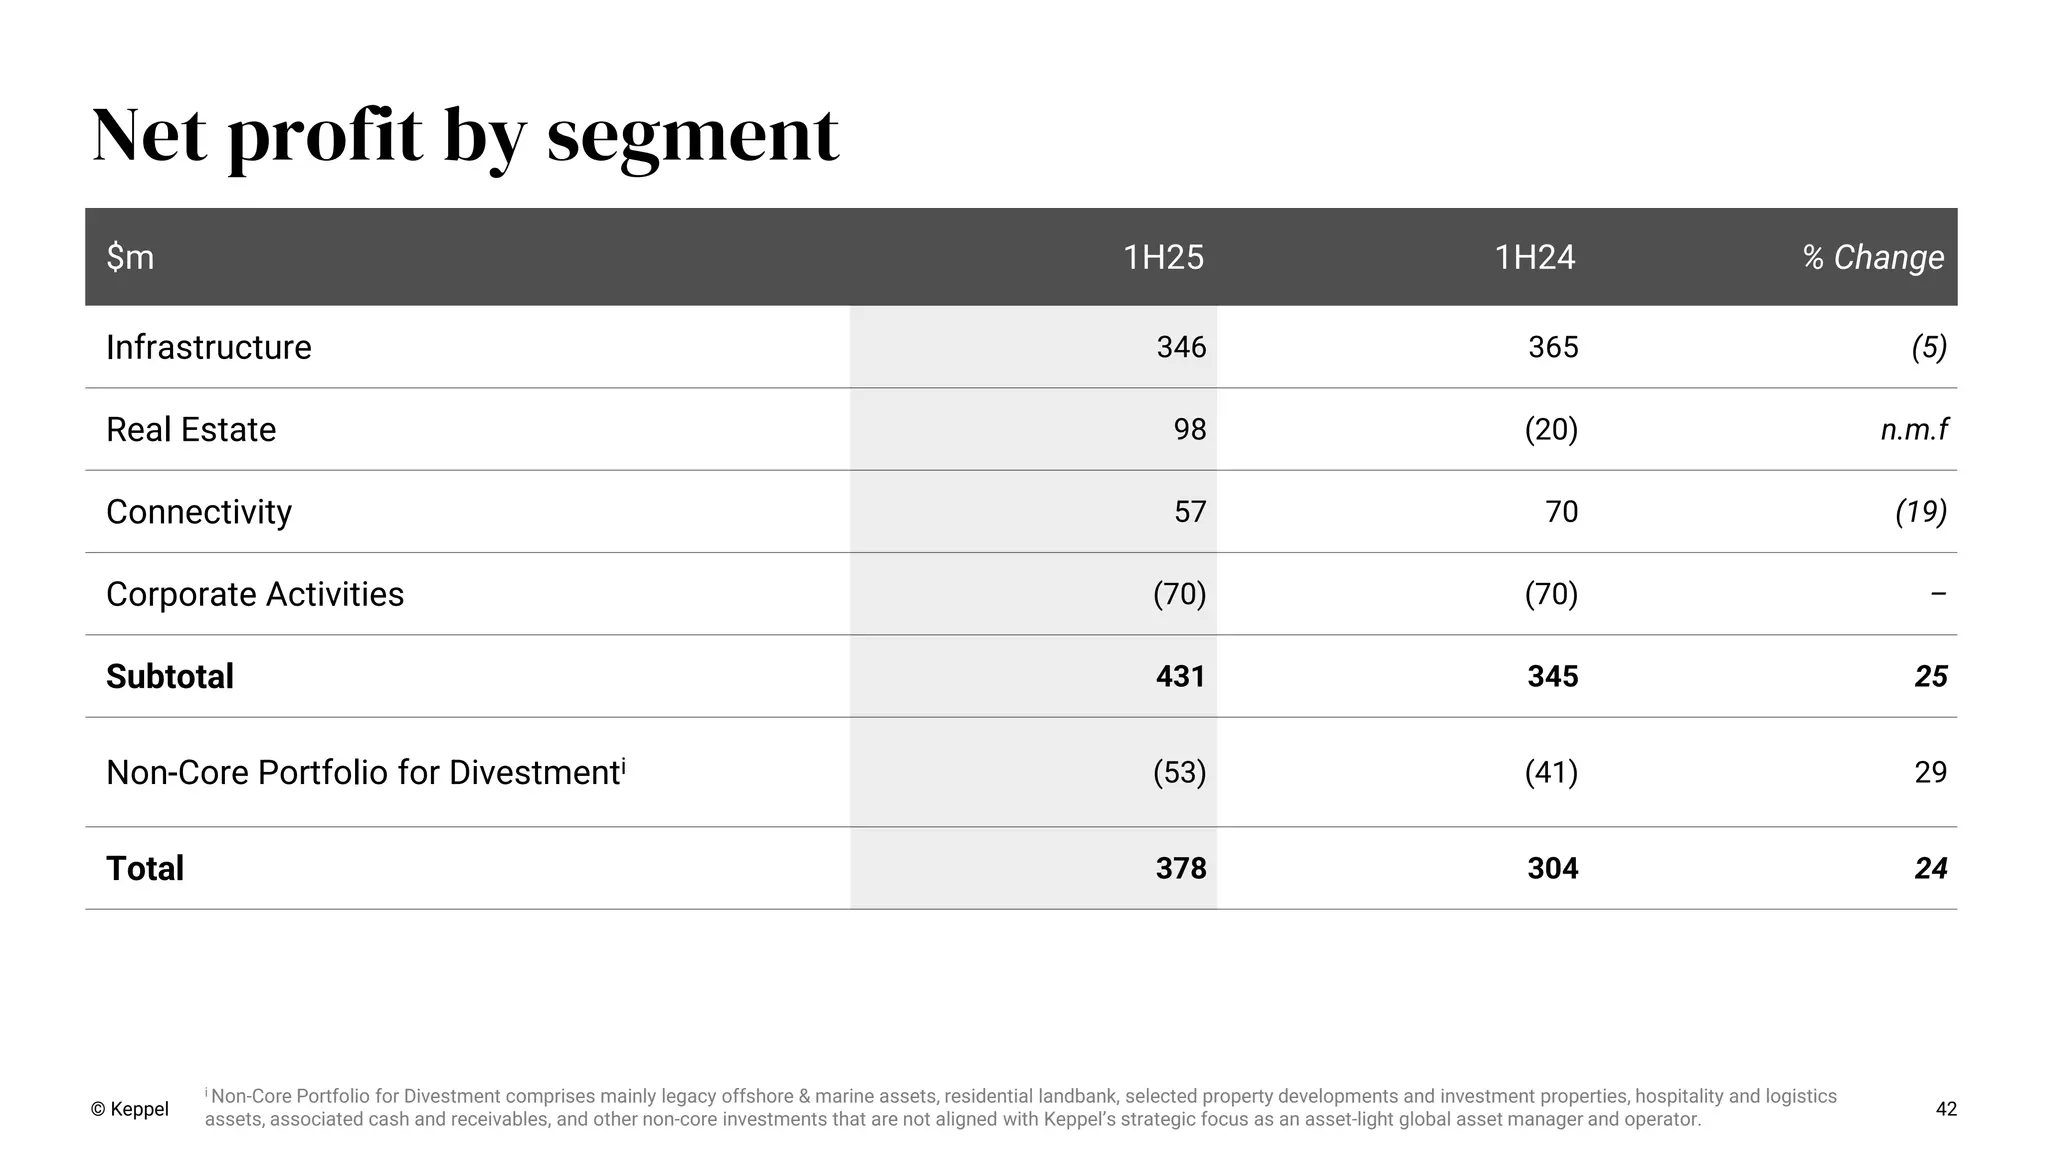
segment $m 1H25 1H24 % Change Infrastructure 346 365 (5) Real Estate 98 (20) n.m.f Connectivity 57 70 (19) Corporate Activities (70) (70) – Subtotal 431 345 25 Non-Core Portfolio for Divestmenti (53) (41) 29 Total 378 304 24 © Keppel i Non-Core Portfolio for Divestment comprises mainly legacy offshore & marine assets, residential landbank, selected property developments and investment properties, hospitality and logistics assets, associated cash and receivables, and other non-core investments that are not aligned with Keppel’s strategic focus as an asset-light global asset manager and operator.
43.
© Keppel 43 1H
2024 net profit (horizontal reporting) i Includes asset management, transaction and advisory fees on sponsor stakes and co-investments. ii Includes returns (net of financing costs attributable to such stakes) from equity accounted stakes in listed and private funds – Infrastructure [$8m from listed funds and -$4m from private funds]; Real Estate [$4m from listed funds and -$3m from private funds], and Connectivity [$11m from listed funds and -$3m from private funds]. iii Includes overheads and financing costs which have not been attributed to segments. iv Non-Core Portfolio for Divestment comprises mainly legacy offshore & marine assets, residential landbank, selected property developments and investment properties, hospitality and logistics assets, associated cash and receivables, and other non-core investments that are not aligned with Keppel’s strategic focus as an asset-light global asset manager and operator. ($’m) Asset Managementi Operatingii Valuation Capital recycling Net profit Infrastructure 44 308 12 1 365 106% Real Estate 19 (10) (29) – (20) (6%) Connectivity 12 41 12 5 70 20% Corporate activitiesiii (70) (20%) New Keppel 75 339 (5) 6 345 100% Non-Core Portfolio for Divestmentiv (41) Net profit 75 339 (5) 6 304
44.
© Keppel 44 Free
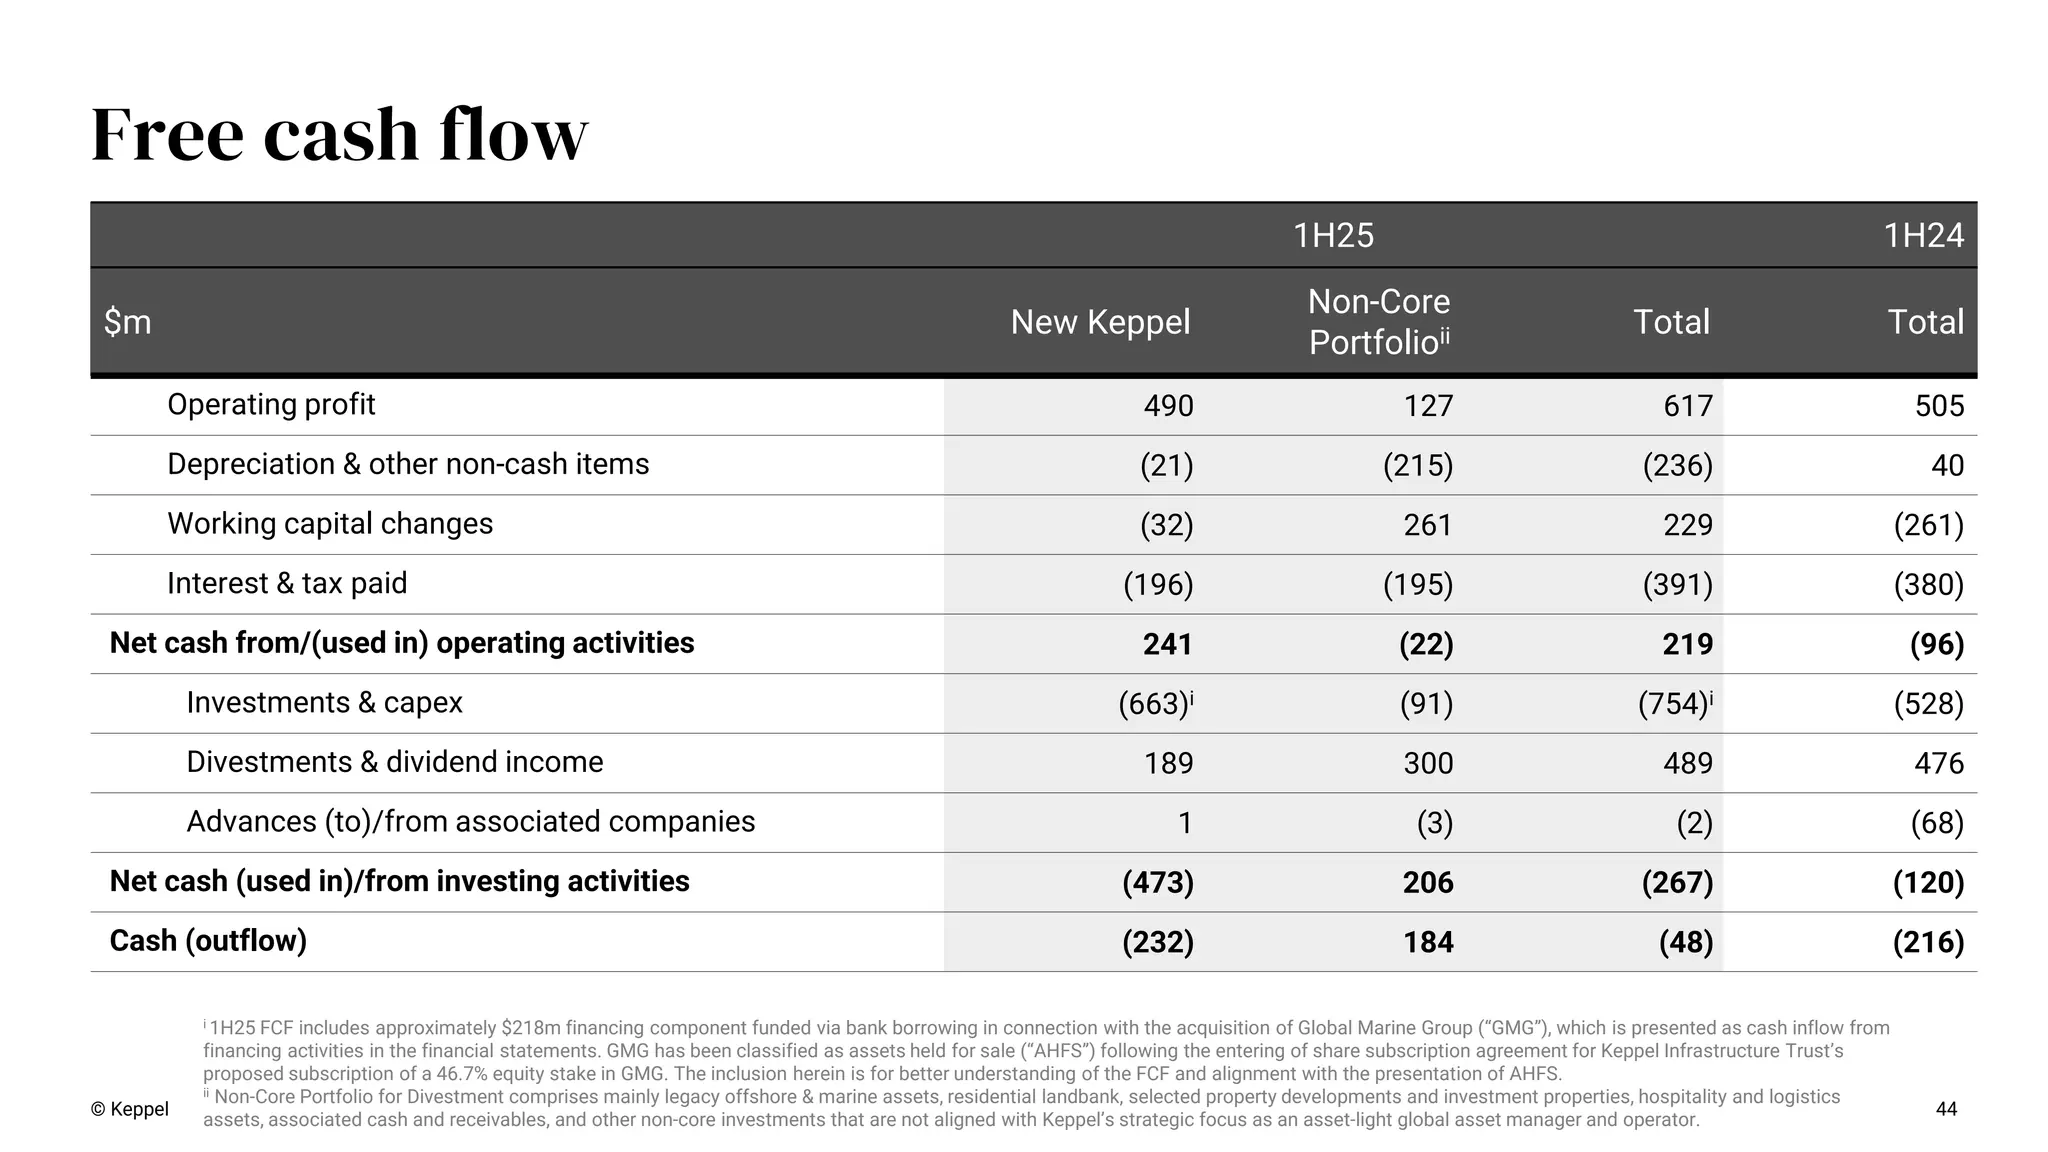
cash flow 1H25 1H24 $m New Keppel Non-Core Portfolioii Total Total Operating profit 490 127 617 505 Depreciation & other non-cash items (21) (215) (236) 40 Working capital changes (32) 261 229 (261) Interest & tax paid (196) (195) (391) (380) Net cash from/(used in) operating activities 241 (22) 219 (96) Investments & capex (663)i (91) (754)i (528) Divestments & dividend income 189 300 489 476 Advances (to)/from associated companies 1 (3) (2) (68) Net cash (used in)/from investing activities (473) 206 (267) (120) Cash (outflow) (232) 184 (48) (216) i 1H25 FCF includes approximately $218m financing component funded via bank borrowing in connection with the acquisition of Global Marine Group (“GMG”), which is presented as cash inflow from financing activities in the financial statements. GMG has been classified as assets held for sale (“AHFS”) following the entering of share subscription agreement for Keppel Infrastructure Trust’s proposed subscription of a 46.7% equity stake in GMG. The inclusion herein is for better understanding of the FCF and alignment with the presentation of AHFS. ii Non-Core Portfolio for Divestment comprises mainly legacy offshore & marine assets, residential landbank, selected property developments and investment properties, hospitality and logistics assets, associated cash and receivables, and other non-core investments that are not aligned with Keppel’s strategic focus as an asset-light global asset manager and operator.
45.
Appendices -Additional Real Estate information 03 45
46.
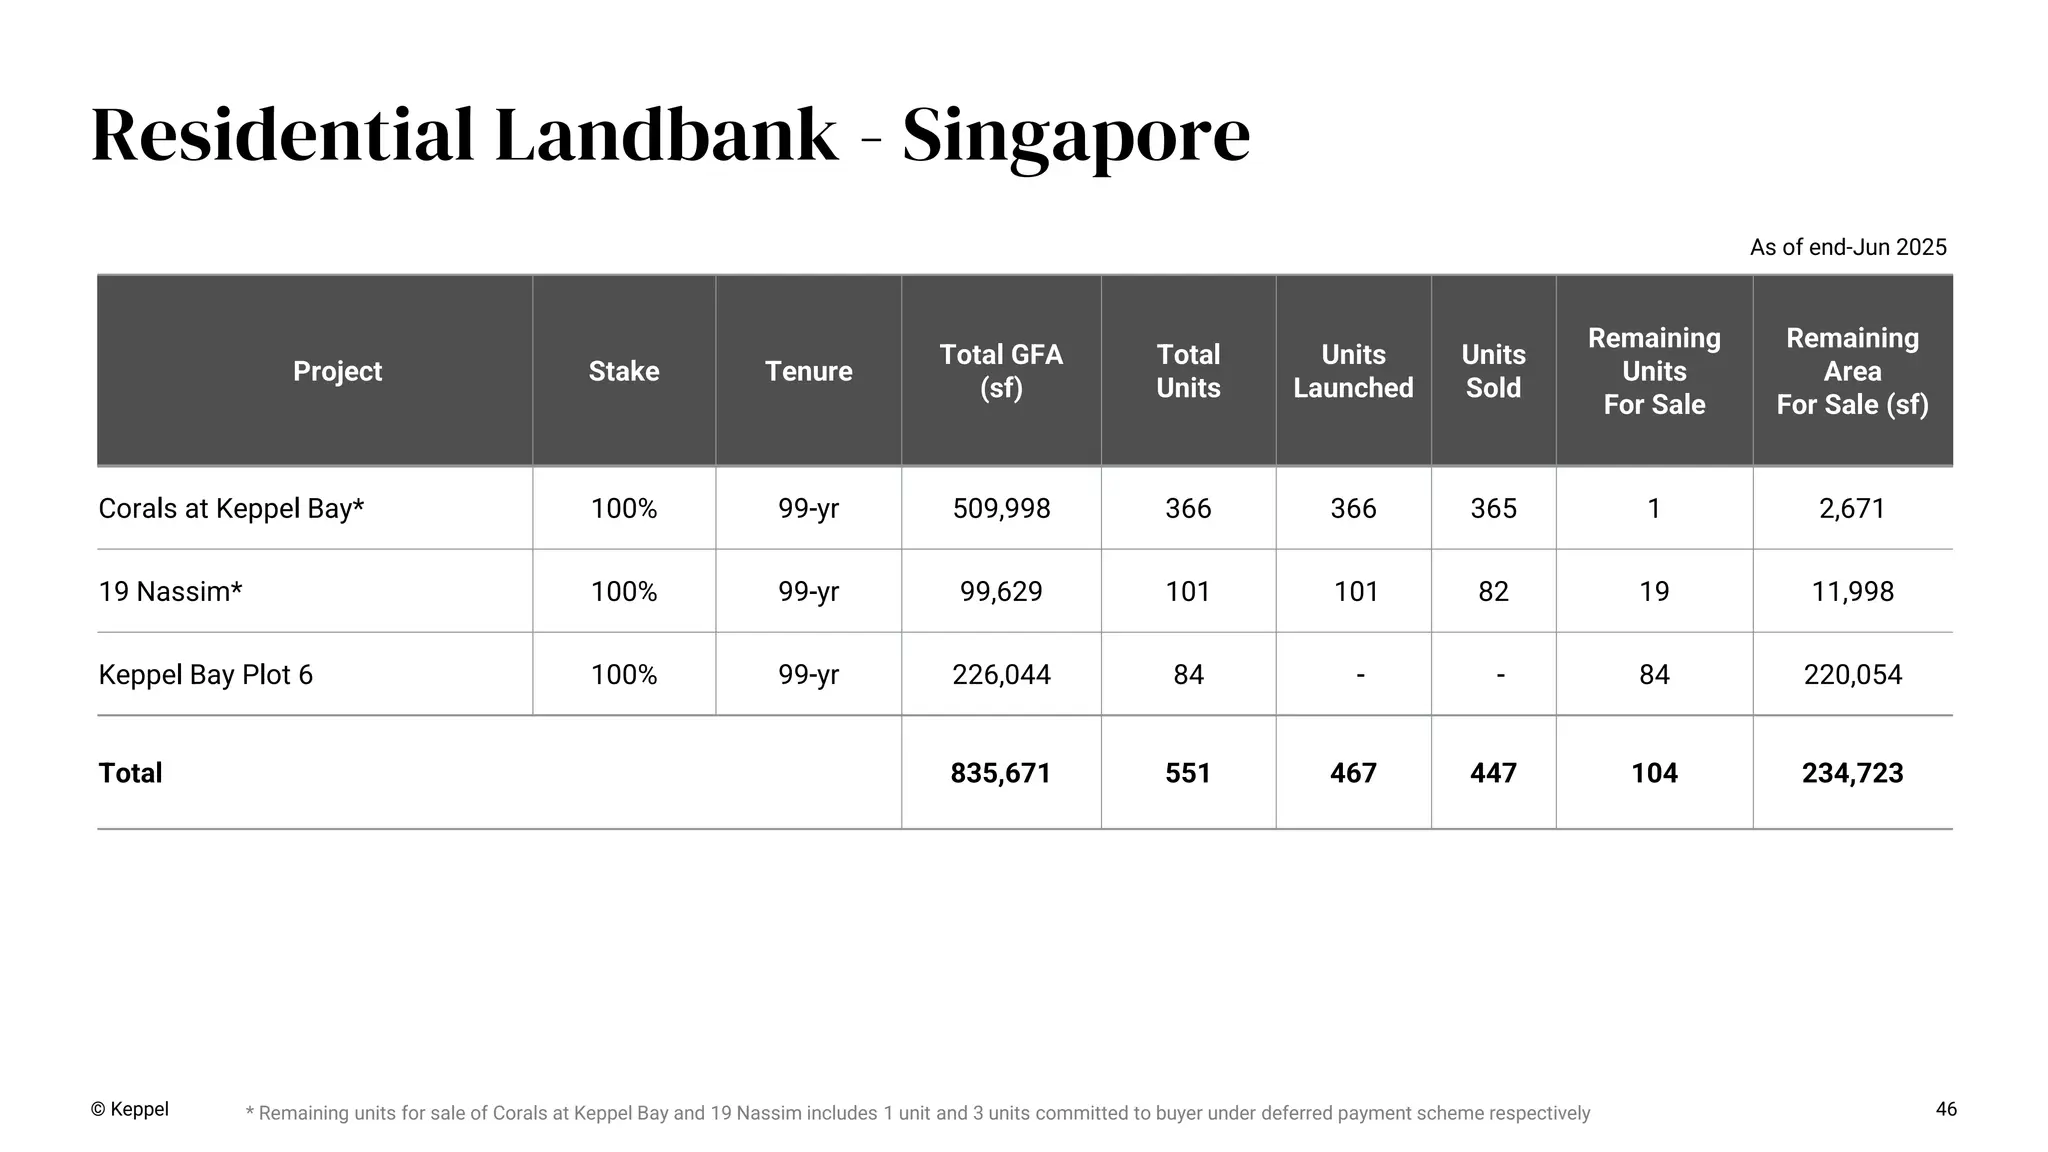
46 Residential Landbank -
Singapore Project Stake Tenure Total GFA (sf) Total Units Units Launched Units Sold Remaining Units For Sale Remaining Area For Sale (sf) Corals at Keppel Bay* 100% 99-yr 509,998 366 366 365 1 2,671 19 Nassim* 100% 99-yr 99,629 101 101 82 19 11,998 Keppel Bay Plot 6 100% 99-yr 226,044 84 - - 84 220,054 Total 835,671 551 467 447 104 234,723 * Remaining units for sale of Corals at Keppel Bay and 19 Nassim includes 1 unit and 3 units committed to buyer under deferred payment scheme respectively As of end-Jun 2025 © Keppel
47.
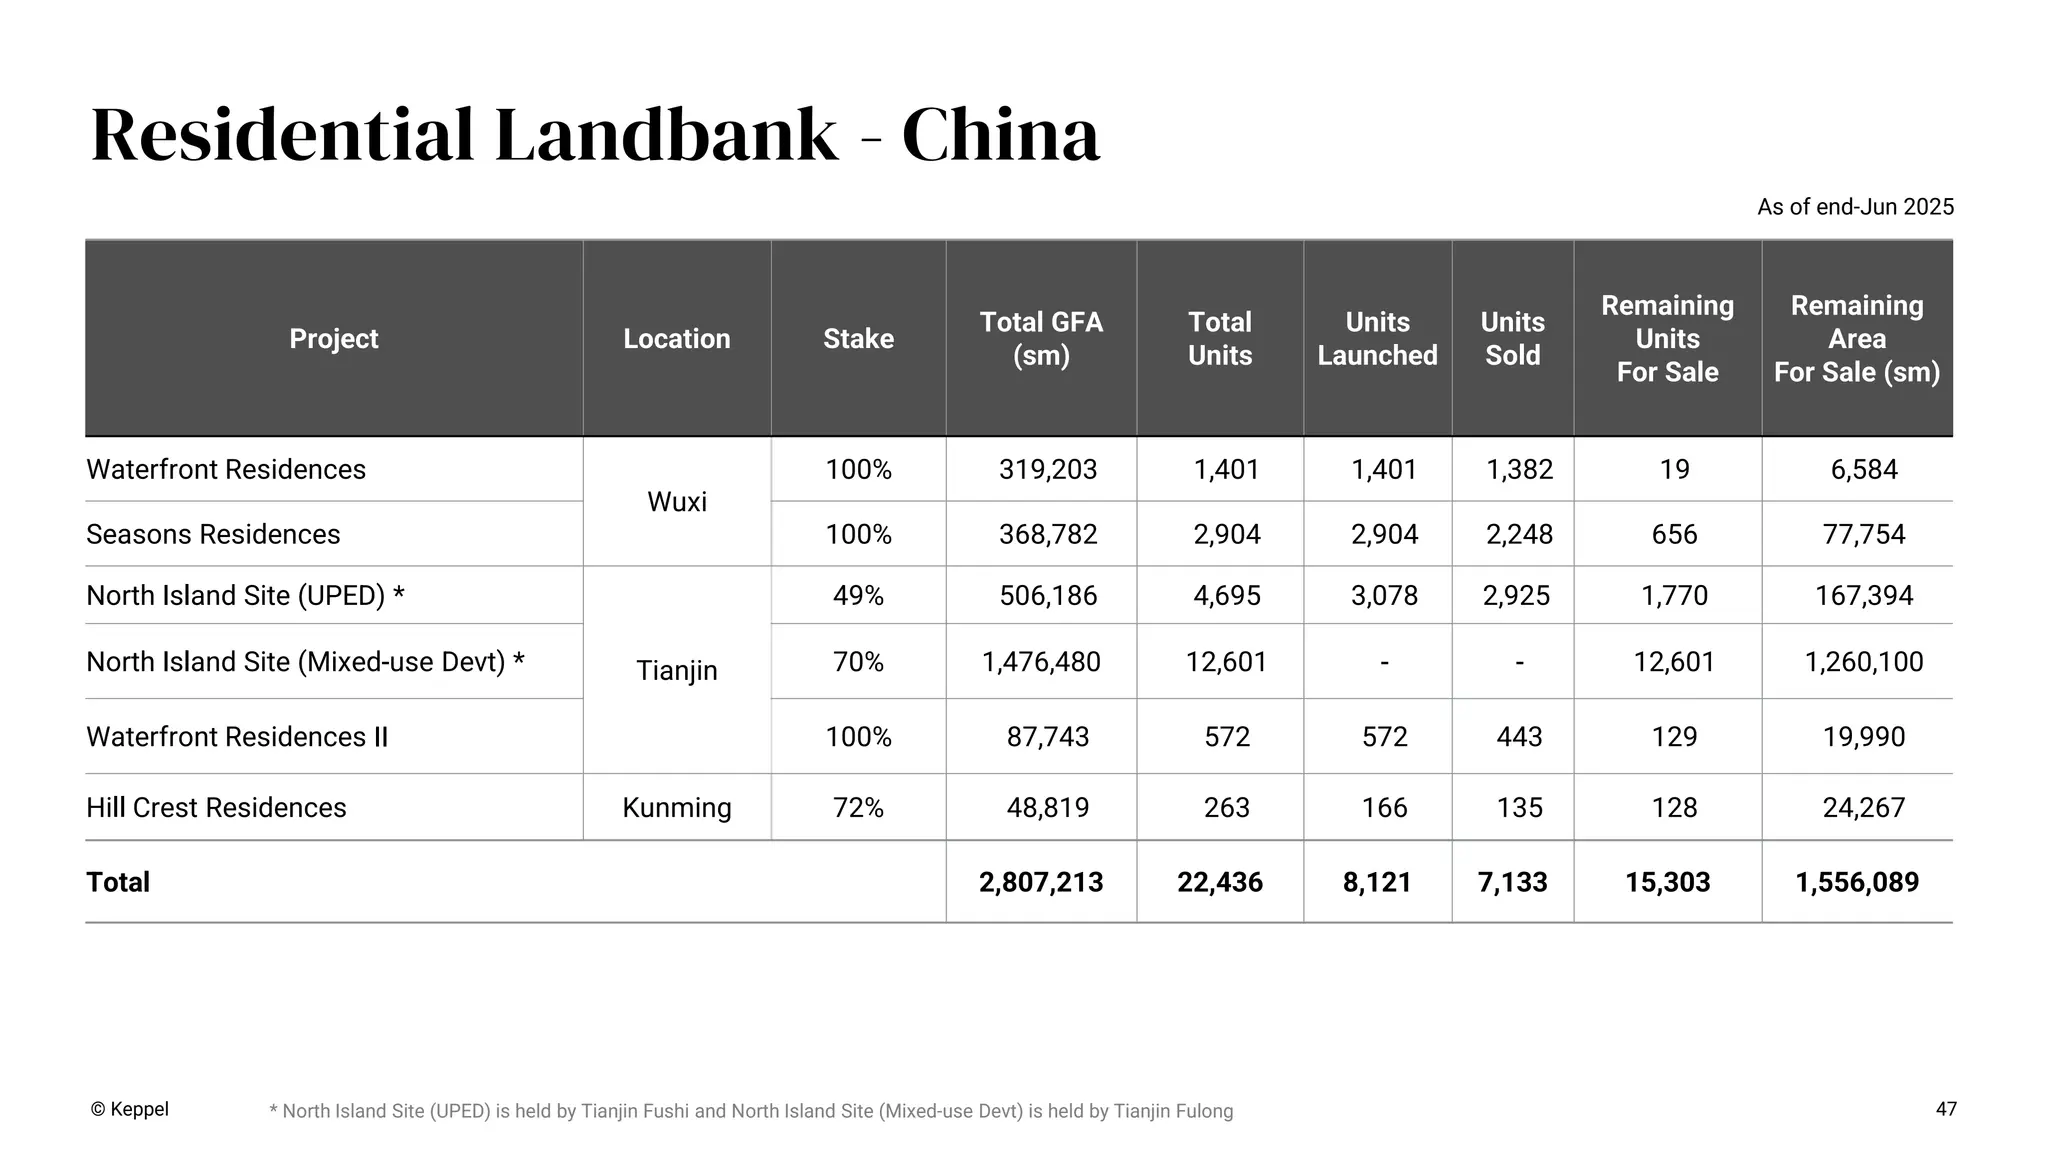
47 Residential Landbank -
China Project Location Stake Total GFA (sm) Total Units Units Launched Units Sold Remaining Units For Sale Remaining Area For Sale (sm) Waterfront Residences Wuxi 100% 319,203 1,401 1,401 1,382 19 6,584 Seasons Residences 100% 368,782 2,904 2,904 2,248 656 77,754 North Island Site (UPED) * Tianjin 49% 506,186 4,695 3,078 2,925 1,770 167,394 North Island Site (Mixed-use Devt) * 70% 1,476,480 12,601 - - 12,601 1,260,100 Waterfront Residences II 100% 87,743 572 572 443 129 19,990 Hill Crest Residences Kunming 72% 48,819 263 166 135 128 24,267 Total 2,807,213 22,436 8,121 7,133 15,303 1,556,089 As of end-Jun 2025 © Keppel * North Island Site (UPED) is held by Tianjin Fushi and North Island Site (Mixed-use Devt) is held by Tianjin Fulong
48.
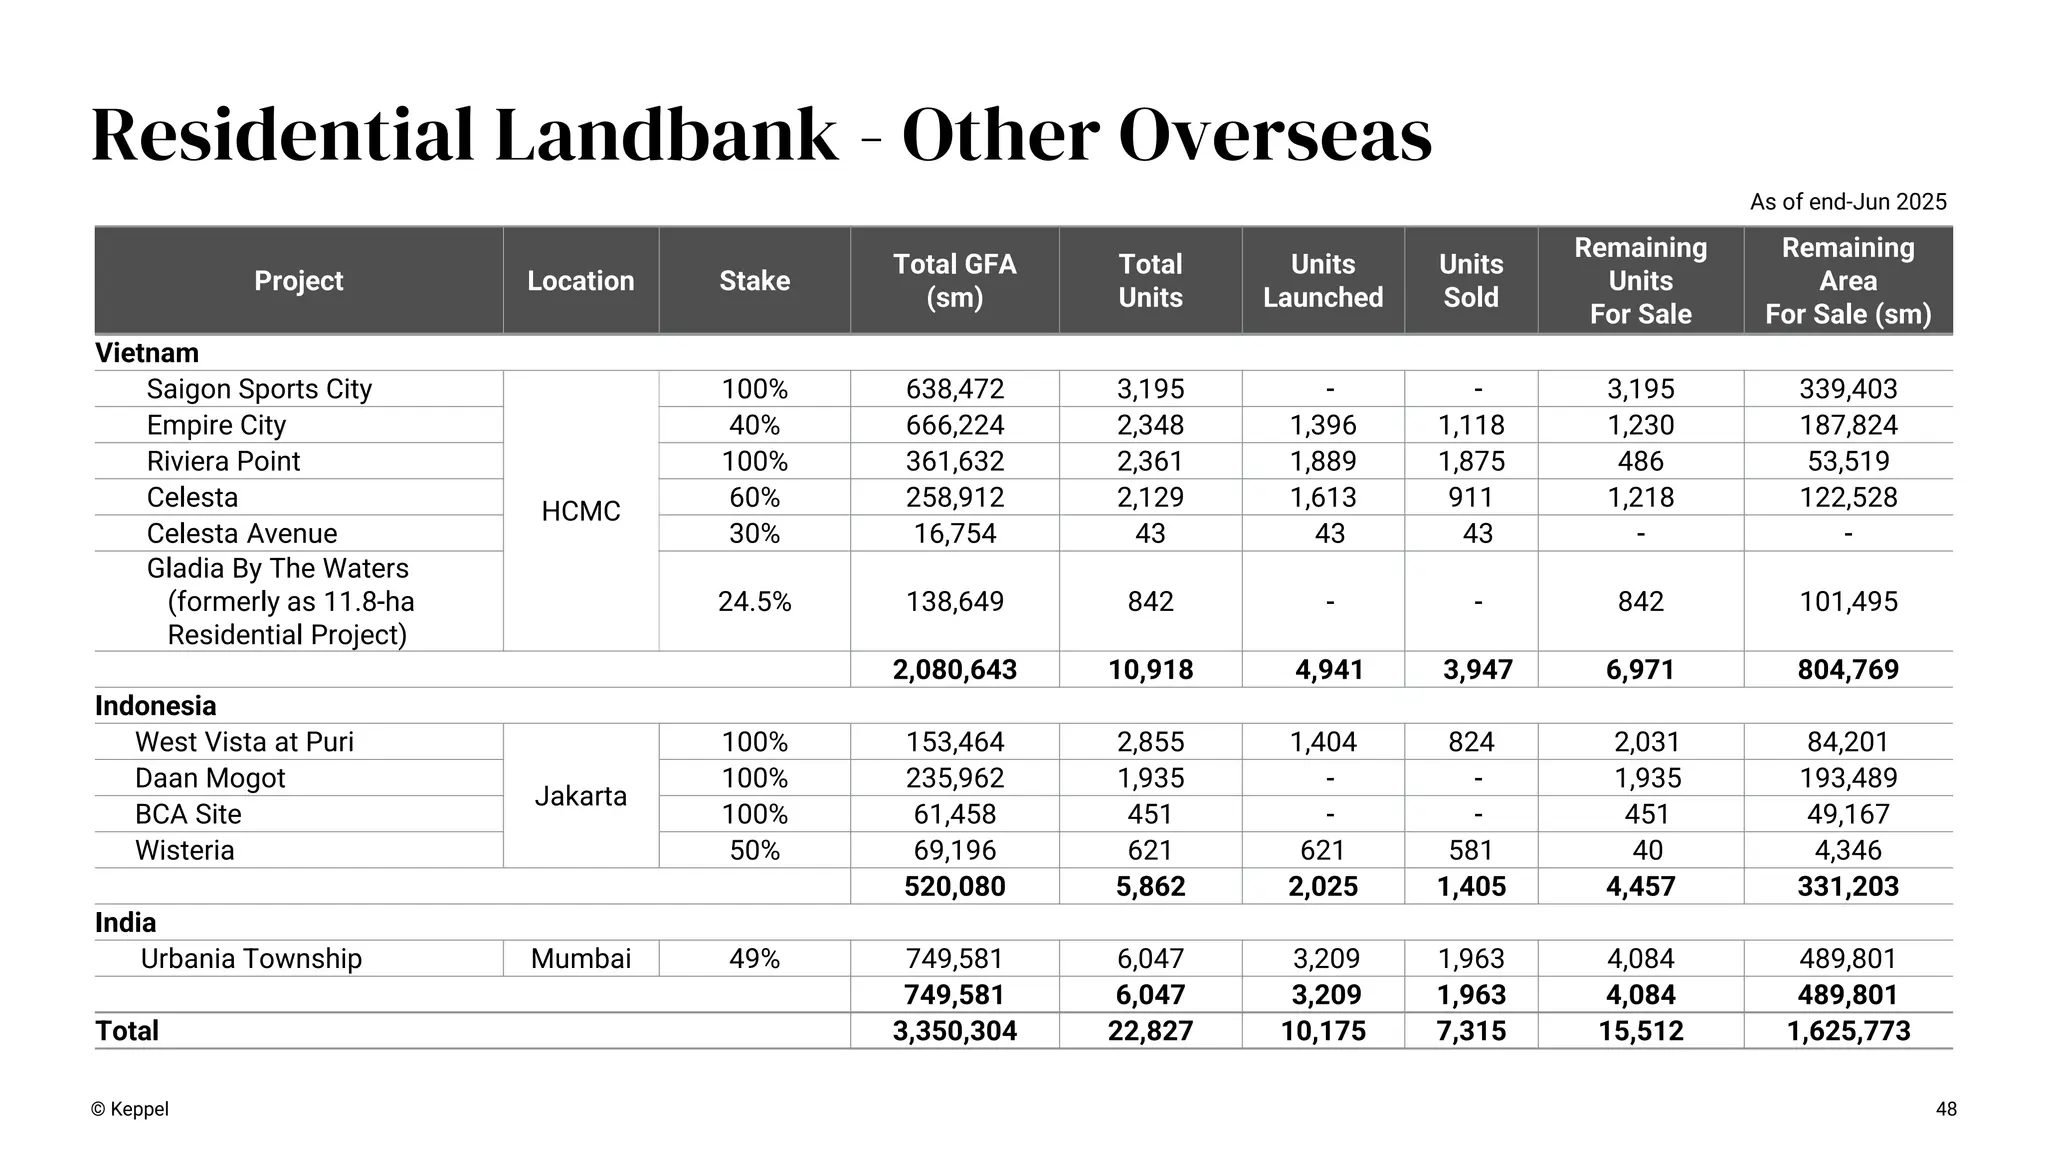
48 Residential Landbank -
Other Overseas Project Location Stake Total GFA (sm) Total Units Units Launched Units Sold Remaining Units For Sale Remaining Area For Sale (sm) Vietnam Saigon Sports City HCMC 100% 638,472 3,195 - - 3,195 339,403 Empire City 40% 666,224 2,348 1,396 1,118 1,230 187,824 Riviera Point 100% 361,632 2,361 1,889 1,875 486 53,519 Celesta 60% 258,912 2,129 1,613 911 1,218 122,528 Celesta Avenue 30% 16,754 43 43 43 - - Gladia By The Waters (formerly as 11.8-ha Residential Project) 24.5% 138,649 842 - - 842 101,495 2,080,643 10,918 4,941 3,947 6,971 804,769 Indonesia West Vista at Puri Jakarta 100% 153,464 2,855 1,404 824 2,031 84,201 Daan Mogot 100% 235,962 1,935 - - 1,935 193,489 BCA Site 100% 61,458 451 - - 451 49,167 Wisteria 50% 69,196 621 621 581 40 4,346 520,080 5,862 2,025 1,405 4,457 331,203 India Urbania Township Mumbai 49% 749,581 6,047 3,209 1,963 4,084 489,801 749,581 6,047 3,209 1,963 4,084 489,801 Total 3,350,304 22,827 10,175 7,315 15,512 1,625,773 As of end-Jun 2025 © Keppel
49.
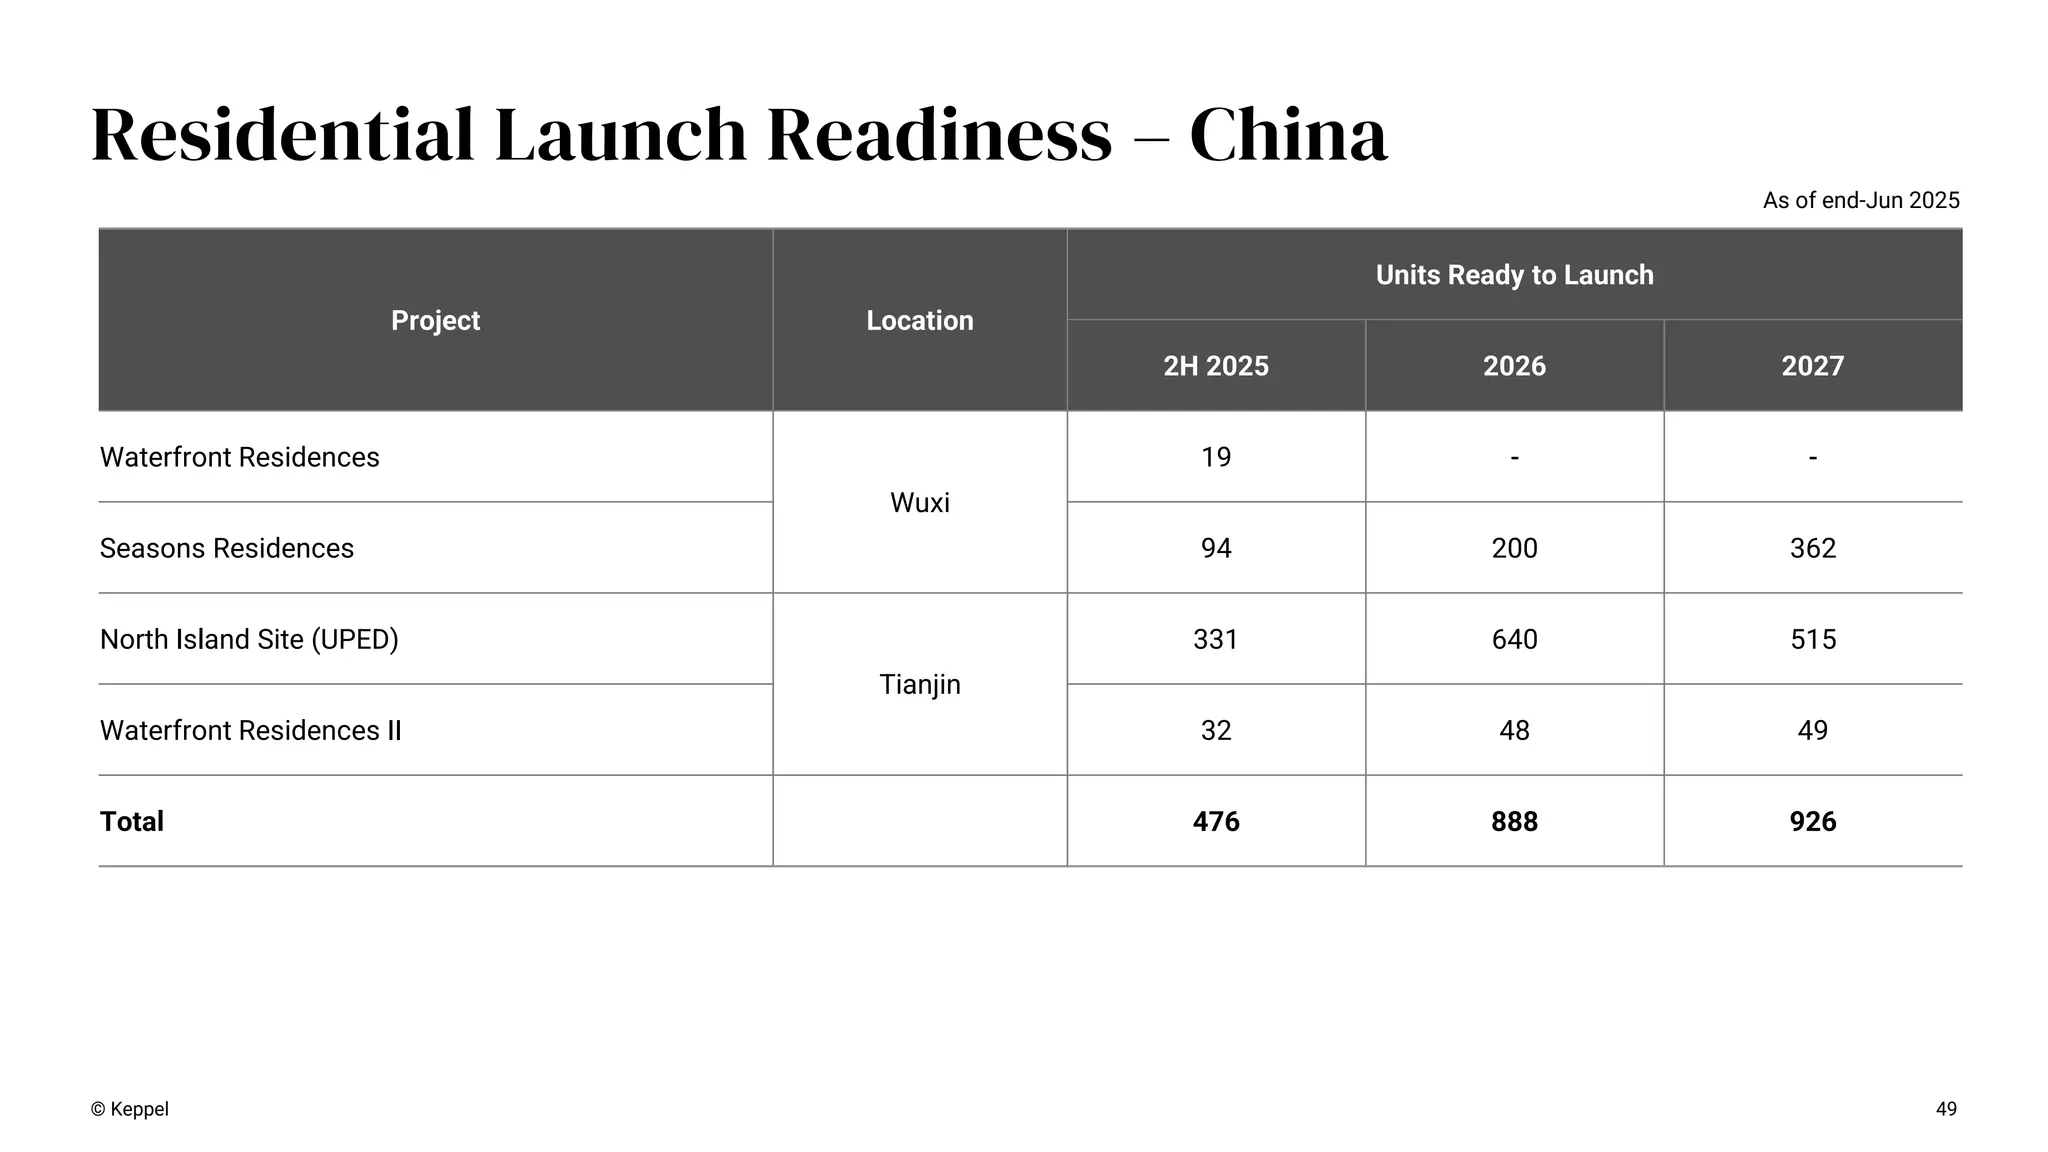
49 Residential Launch Readiness
– China As of end-Jun 2025 Project Location Units Ready to Launch 2H 2025 2026 2027 Waterfront Residences Wuxi 19 - - Seasons Residences 94 200 362 North Island Site (UPED) Tianjin 331 640 515 Waterfront Residences II 32 48 49 Total 476 888 926 © Keppel
50.
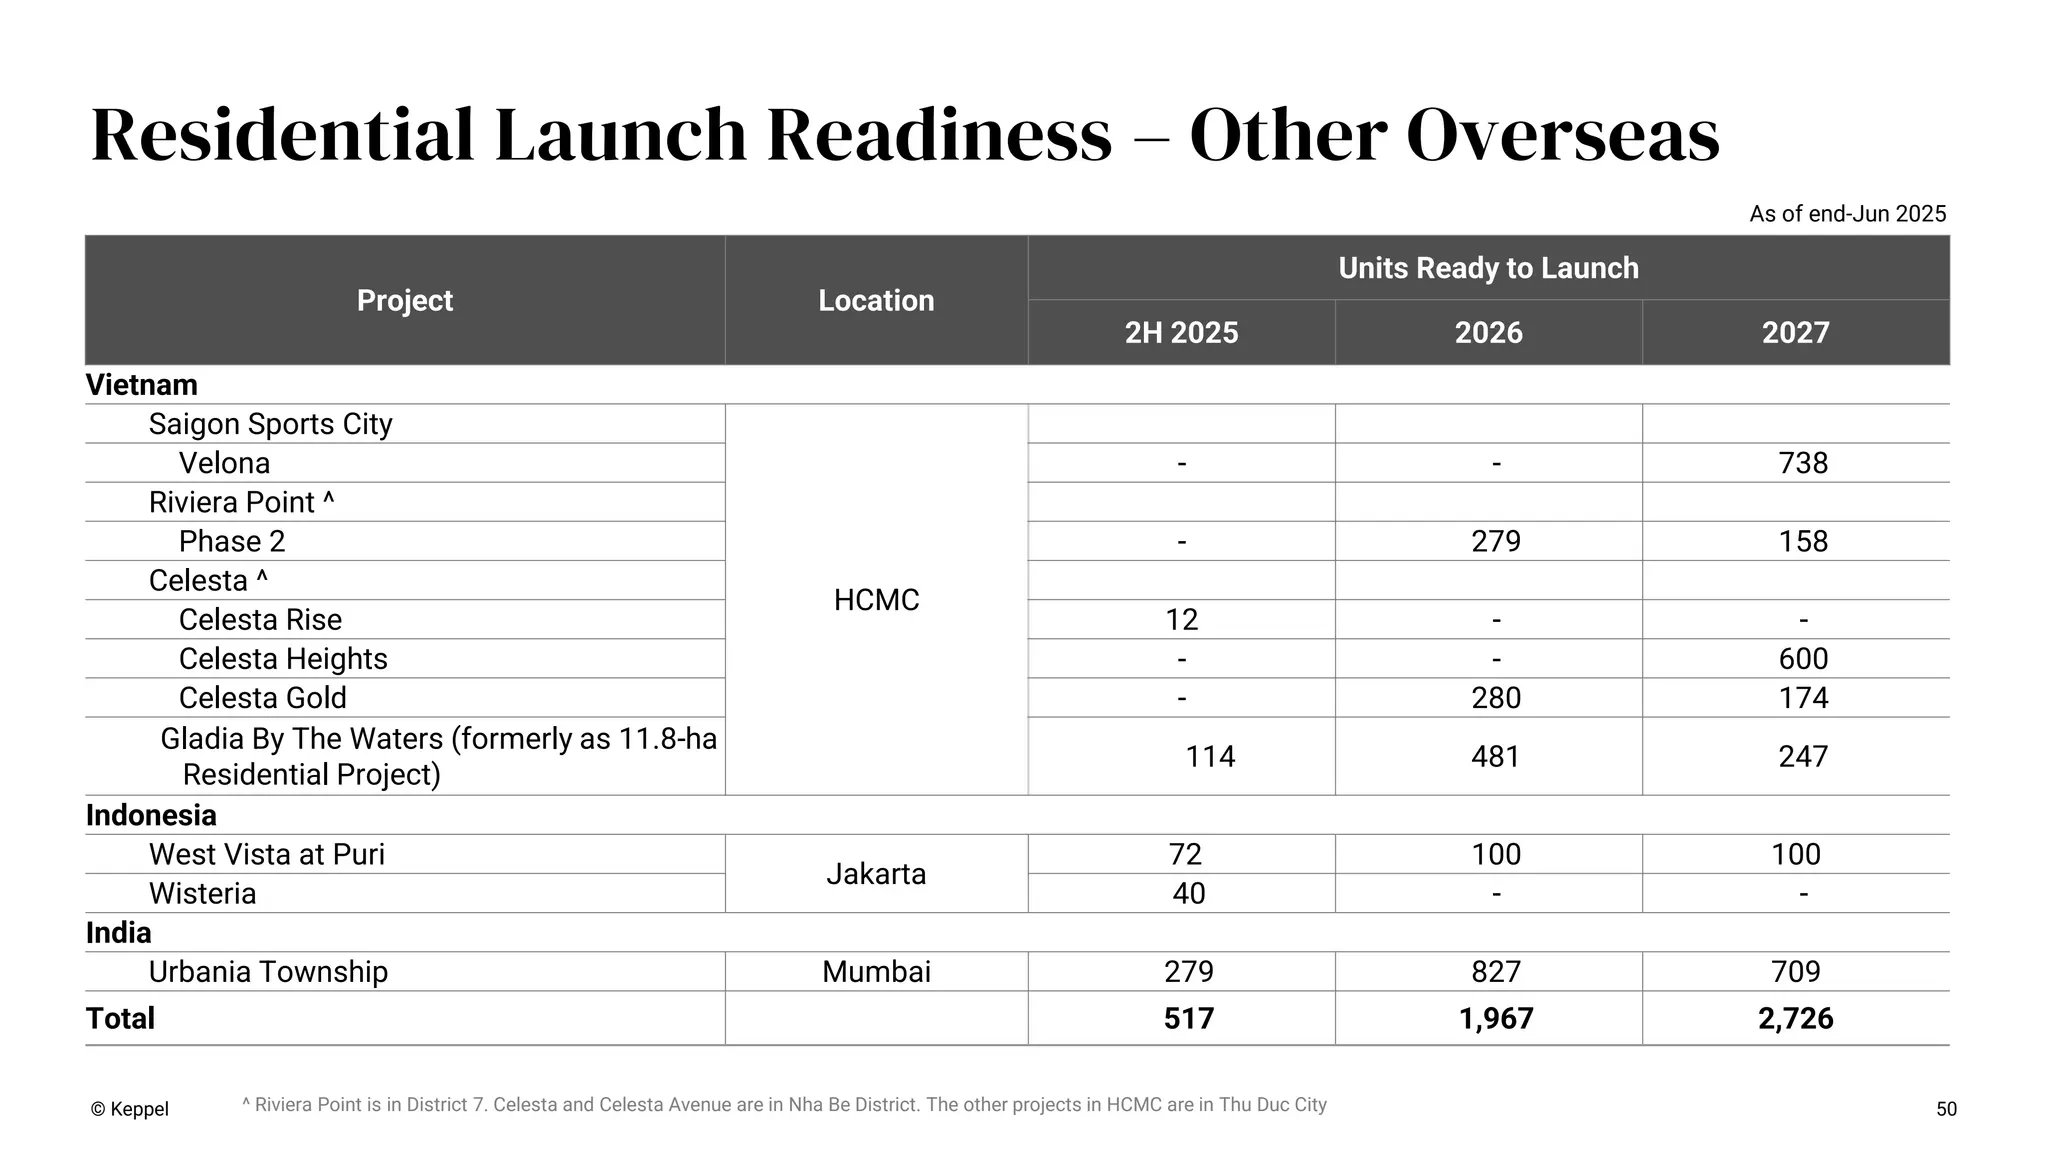
50 Residential Launch Readiness
– Other Overseas Project Location Units Ready to Launch 2H 2025 2026 2027 Vietnam Saigon Sports City HCMC Velona - - 738 Riviera Point ^ Phase 2 - 279 158 Celesta ^ Celesta Rise 12 - - Celesta Heights - - 600 Celesta Gold - 280 174 Gladia By The Waters (formerly as 11.8-ha Residential Project) 114 481 247 Indonesia West Vista at Puri Jakarta 72 100 100 Wisteria 40 - - India Urbania Township Mumbai 279 827 709 Total 517 1,967 2,726 As of end-Jun 2025 ^ Riviera Point is in District 7. Celesta and Celesta Avenue are in Nha Be District. The other projects in HCMC are in Thu Duc City © Keppel
51.
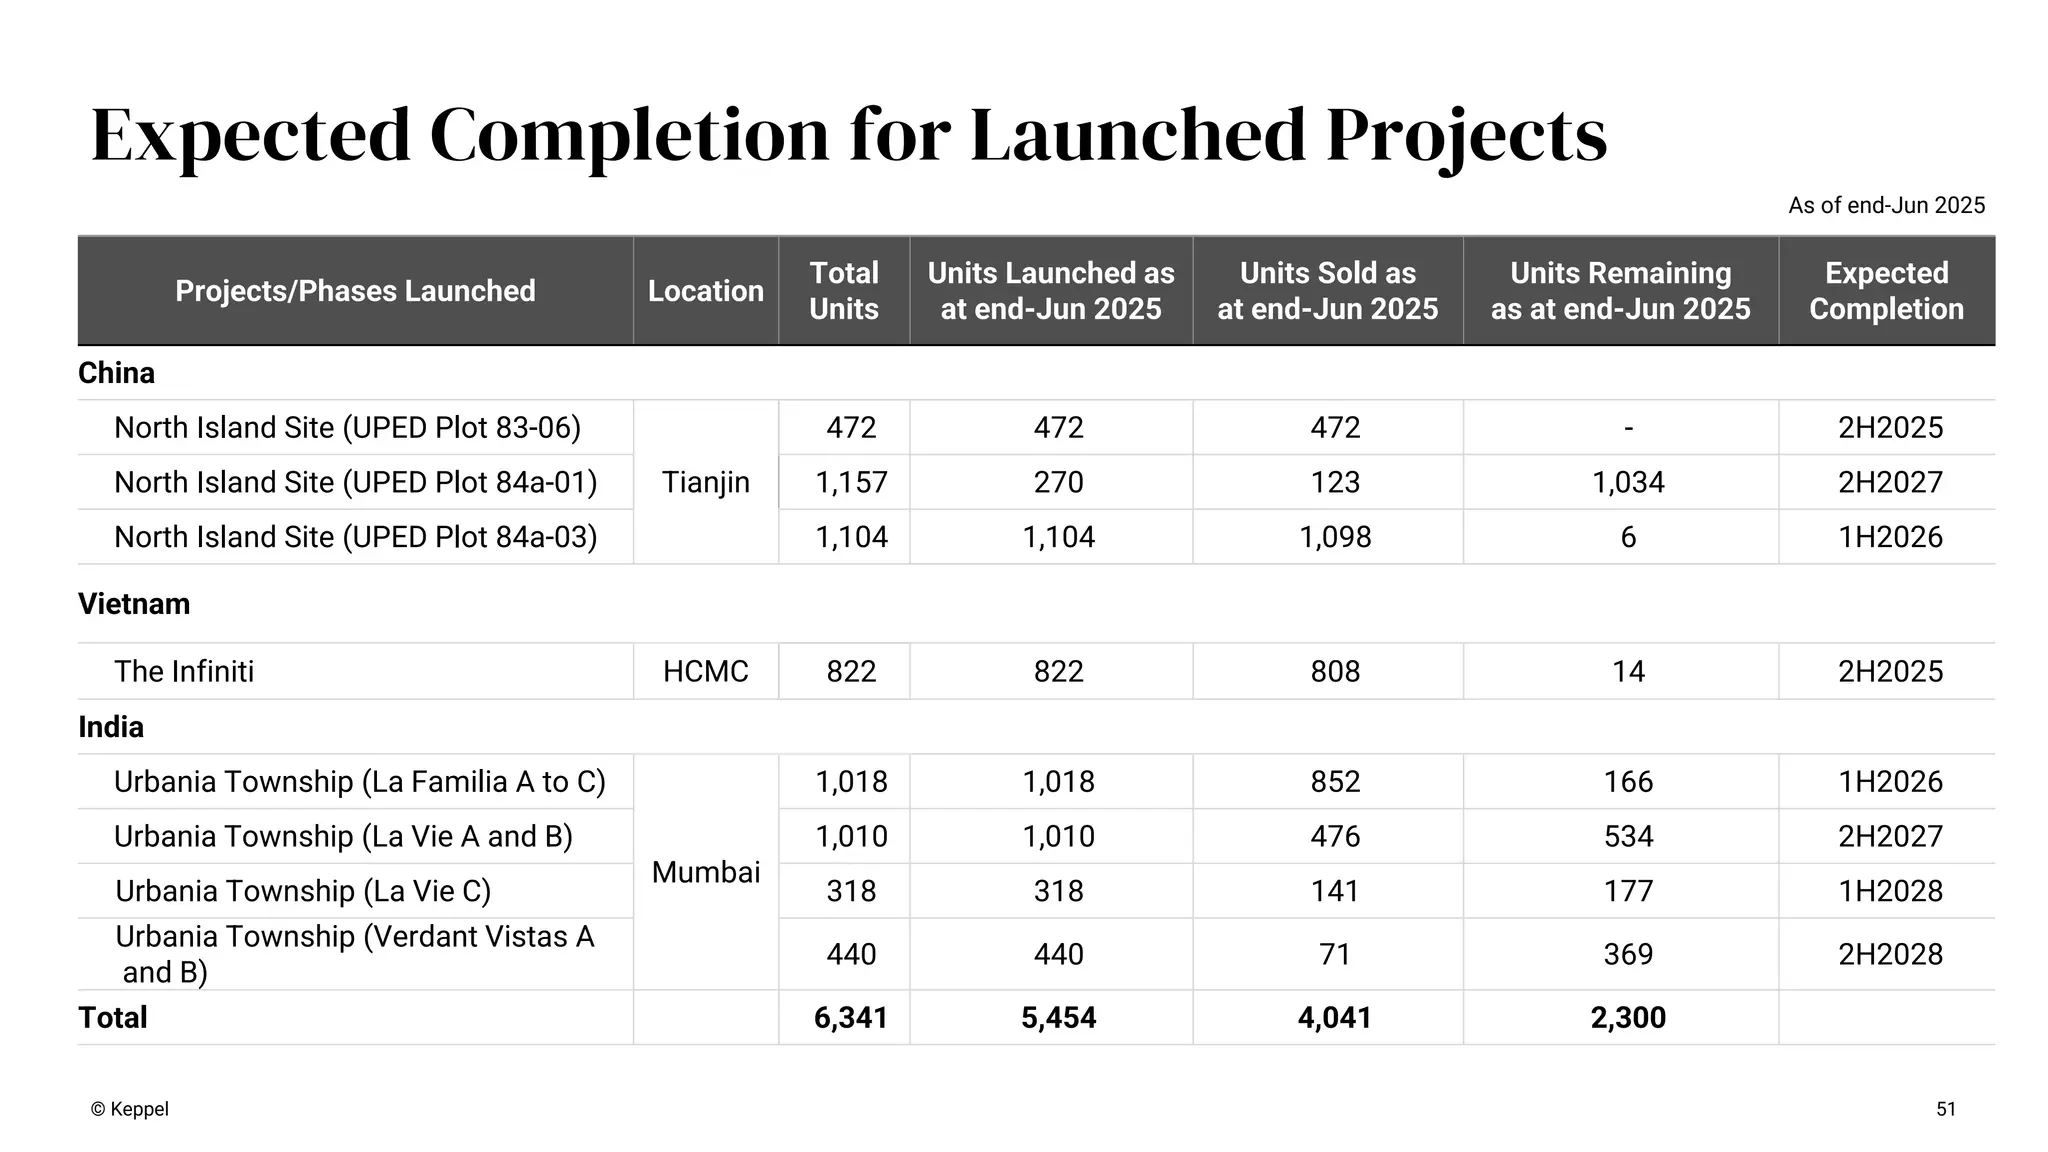
51 Expected Completion for
Launched Projects Projects/Phases Launched Location Total Units Units Launched as at end-Jun 2025 Units Sold as at end-Jun 2025 Units Remaining as at end-Jun 2025 Expected Completion China North Island Site (UPED Plot 83-06) Tianjin 472 472 472 - 2H2025 North Island Site (UPED Plot 84a-01) 1,157 270 123 1,034 2H2027 North Island Site (UPED Plot 84a-03) 1,104 1,104 1,098 6 1H2026 Vietnam The Infiniti HCMC 822 822 808 14 2H2025 India Urbania Township (La Familia A to C) Mumbai 1,018 1,018 852 166 1H2026 Urbania Township (La Vie A and B) 1,010 1,010 476 534 2H2027 Urbania Township (La Vie C) 318 318 141 177 1H2028 Urbania Township (Verdant Vistas A and B) 440 440 71 369 2H2028 Total 6,341 5,454 4,041 2,300 © Keppel As of end-Jun 2025
52.
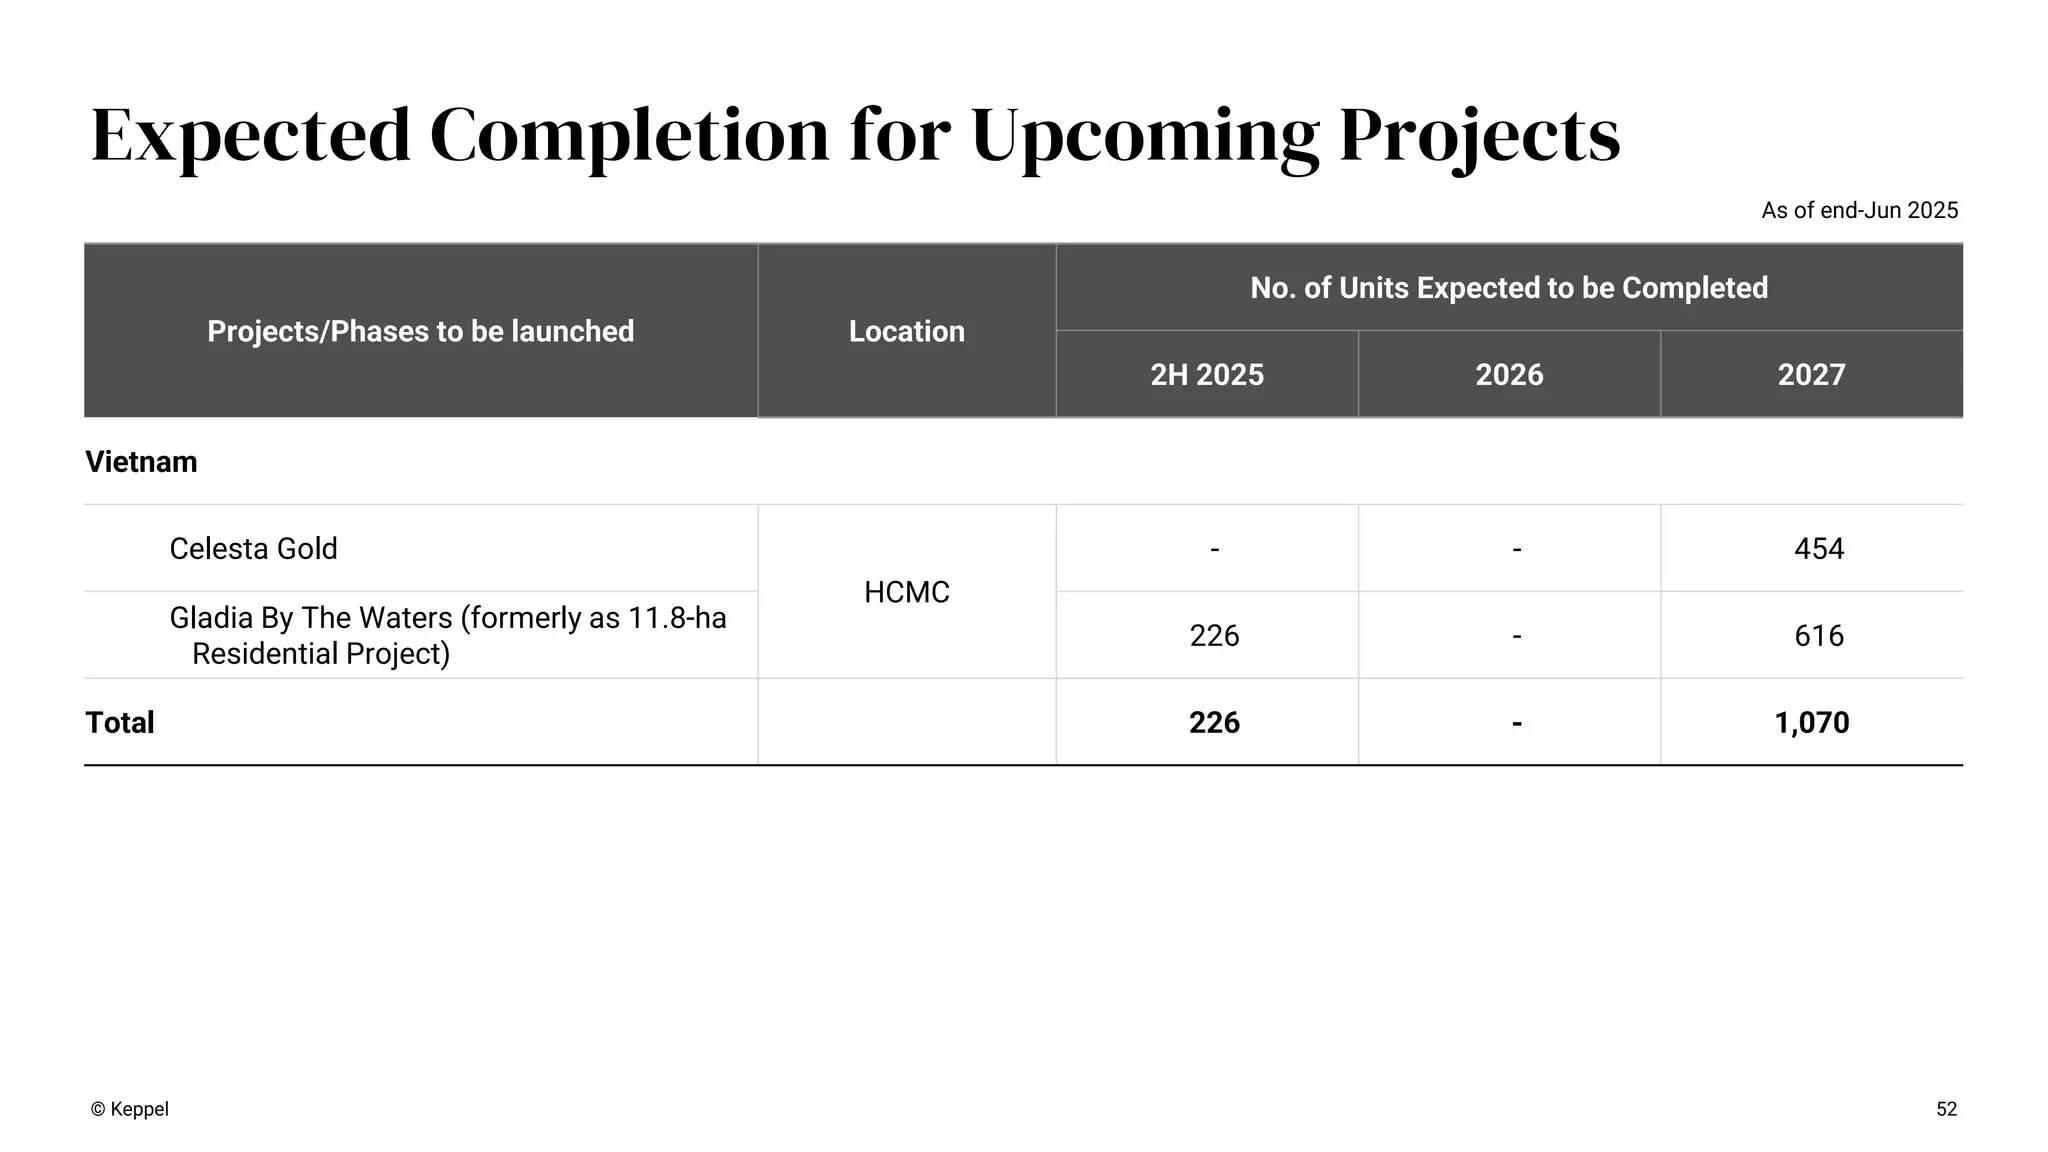
52 Expected Completion for
Upcoming Projects Projects/Phases to be launched Location No. of Units Expected to be Completed 2H 2025 2026 2027 Vietnam Celesta Gold HCMC - - 454 Gladia By The Waters (formerly as 11.8-ha Residential Project) 226 - 616 Total 226 - 1,070 © Keppel As of end-Jun 2025
53.
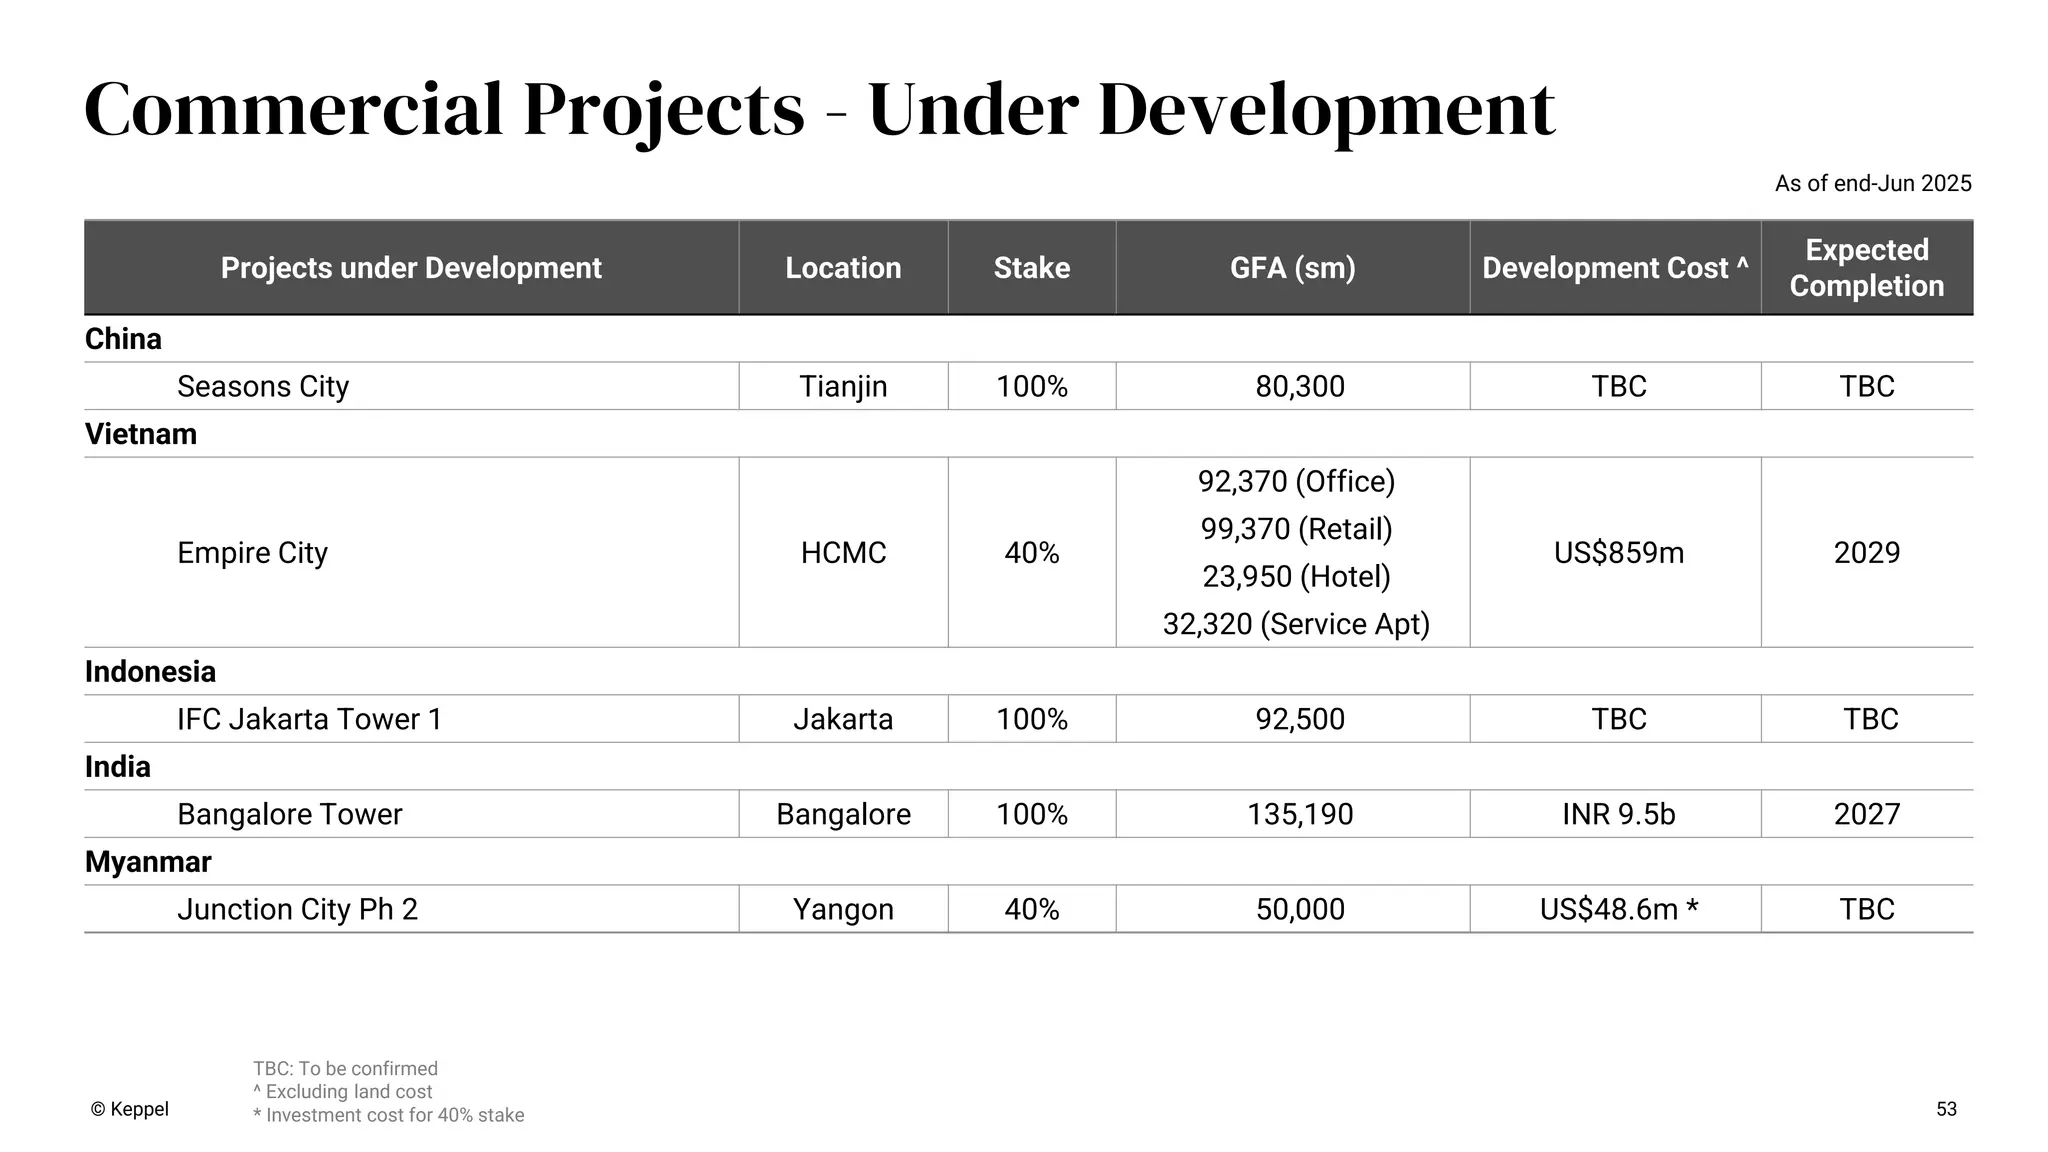
TBC: To be
confirmed ^ Excluding land cost * Investment cost for 40% stake Commercial Projects - Under Development Projects under Development Location Stake GFA (sm) Development Cost ^ Expected Completion China Seasons City Tianjin 100% 80,300 TBC TBC Vietnam Empire City HCMC 40% 92,370 (Office) US$859m 2029 99,370 (Retail) 23,950 (Hotel) 32,320 (Service Apt) Indonesia IFC Jakarta Tower 1 Jakarta 100% 92,500 TBC TBC India Bangalore Tower Bangalore 100% 135,190 INR 9.5b 2027 Myanmar Junction City Ph 2 Yangon 40% 50,000 US$48.6m * TBC 53 © Keppel As of end-Jun 2025
54.
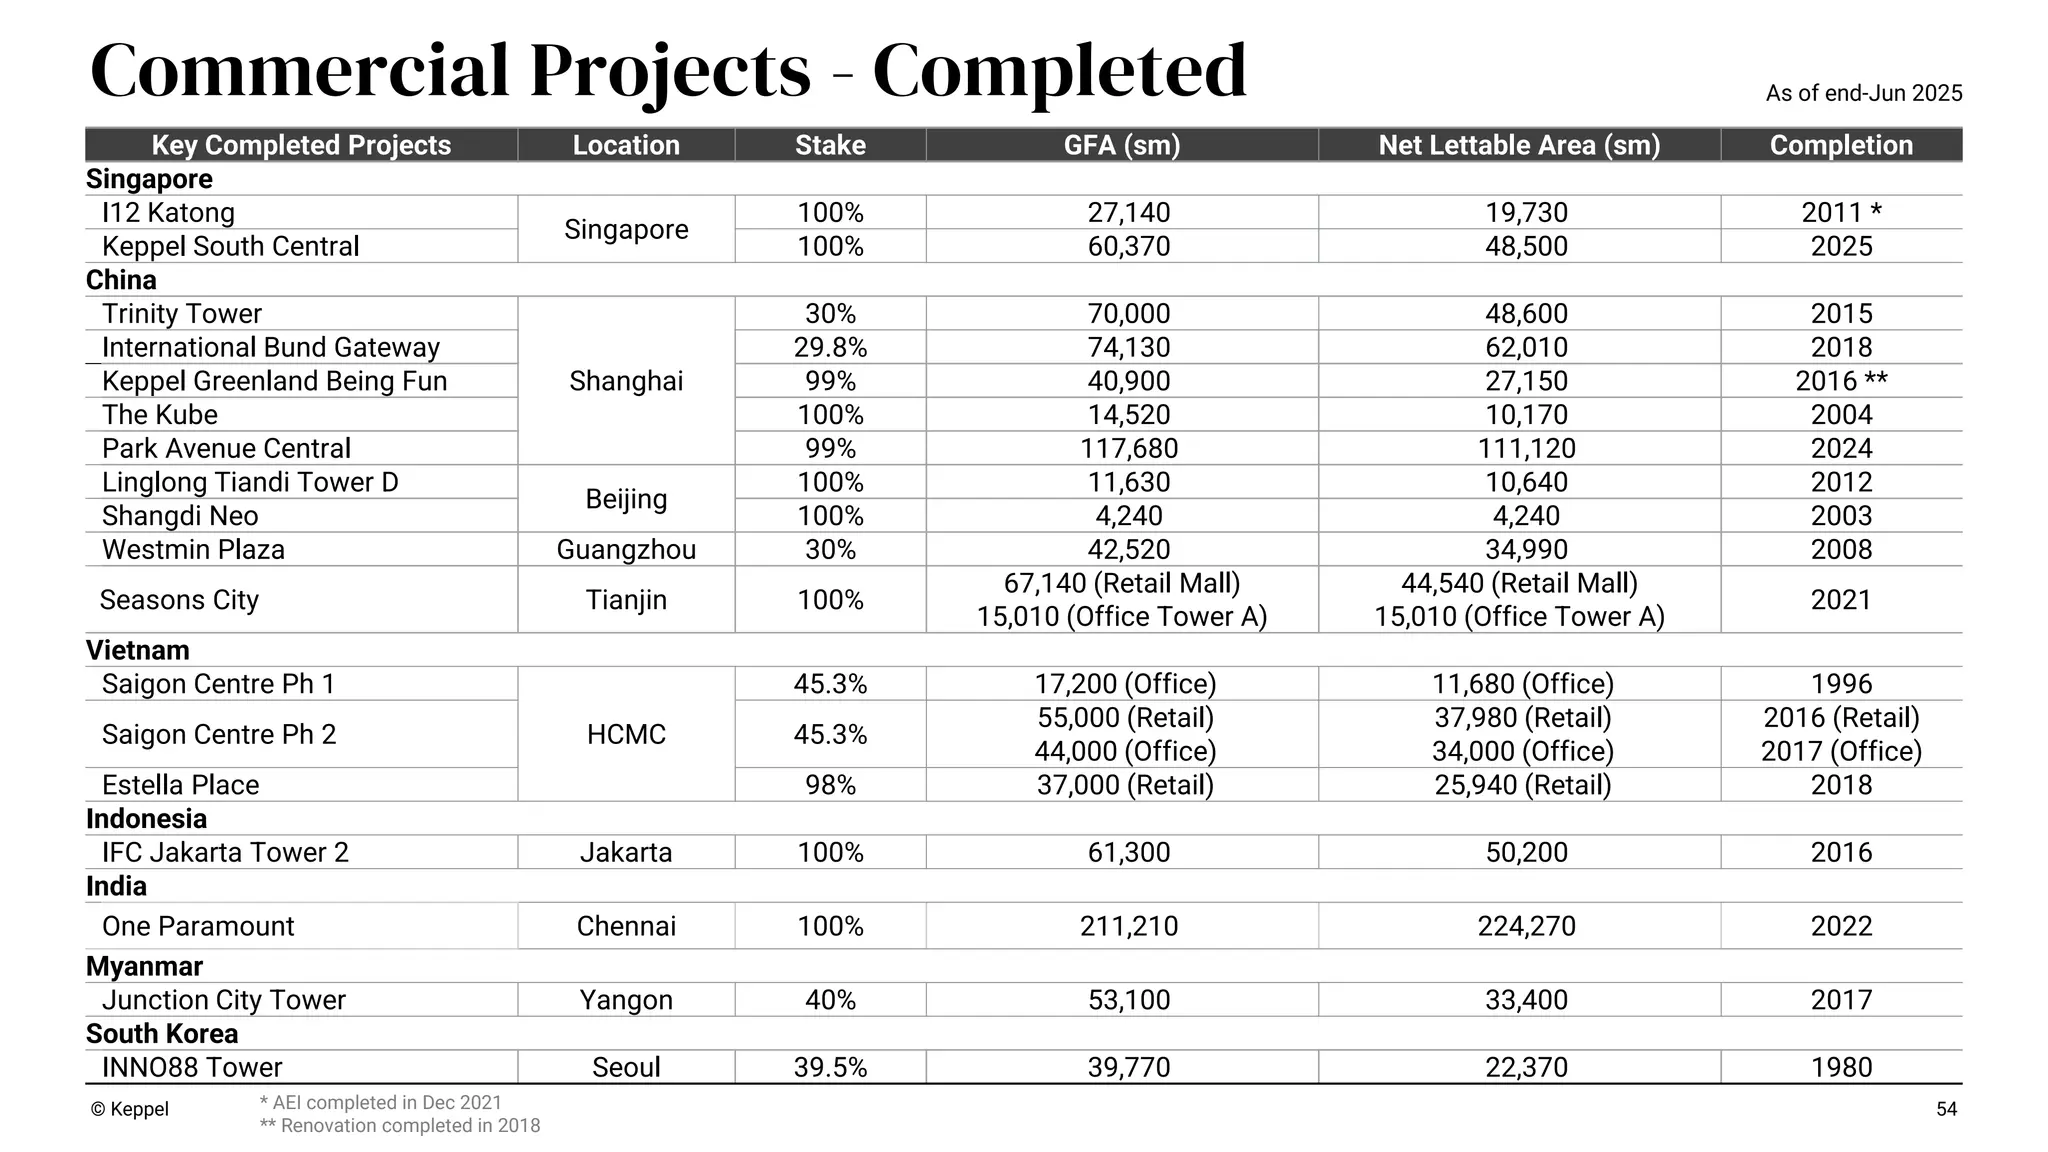
* AEI completed
in Dec 2021 ** Renovation completed in 2018 54 Commercial Projects - Completed Key Completed Projects Location Stake GFA (sm) Net Lettable Area (sm) Completion Singapore I12 Katong Singapore 100% 27,140 19,730 2011 * Keppel South Central 100% 60,370 48,500 2025 China Trinity Tower Shanghai 30% 70,000 48,600 2015 International Bund Gateway 29.8% 74,130 62,010 2018 Keppel Greenland Being Fun 99% 40,900 27,150 2016 ** The Kube 100% 14,520 10,170 2004 Park Avenue Central 99% 117,680 111,120 2024 Linglong Tiandi Tower D Beijing 100% 11,630 10,640 2012 Shangdi Neo 100% 4,240 4,240 2003 Westmin Plaza Guangzhou 30% 42,520 34,990 2008 Seasons City Tianjin 100% 67,140 (Retail Mall) 15,010 (Office Tower A) 44,540 (Retail Mall) 15,010 (Office Tower A) 2021 Vietnam Saigon Centre Ph 1 HCMC 45.3% 17,200 (Office) 11,680 (Office) 1996 Saigon Centre Ph 2 45.3% 55,000 (Retail) 37,980 (Retail) 2016 (Retail) 44,000 (Office) 34,000 (Office) 2017 (Office) Estella Place 98% 37,000 (Retail) 25,940 (Retail) 2018 Indonesia IFC Jakarta Tower 2 Jakarta 100% 61,300 50,200 2016 India One Paramount Chennai 100% 211,210 224,270 2022 Myanmar Junction City Tower Yangon 40% 53,100 33,400 2017 South Korea INNO88 Tower Seoul 39.5% 39,770 22,370 1980 © Keppel As of end-Jun 2025
55.
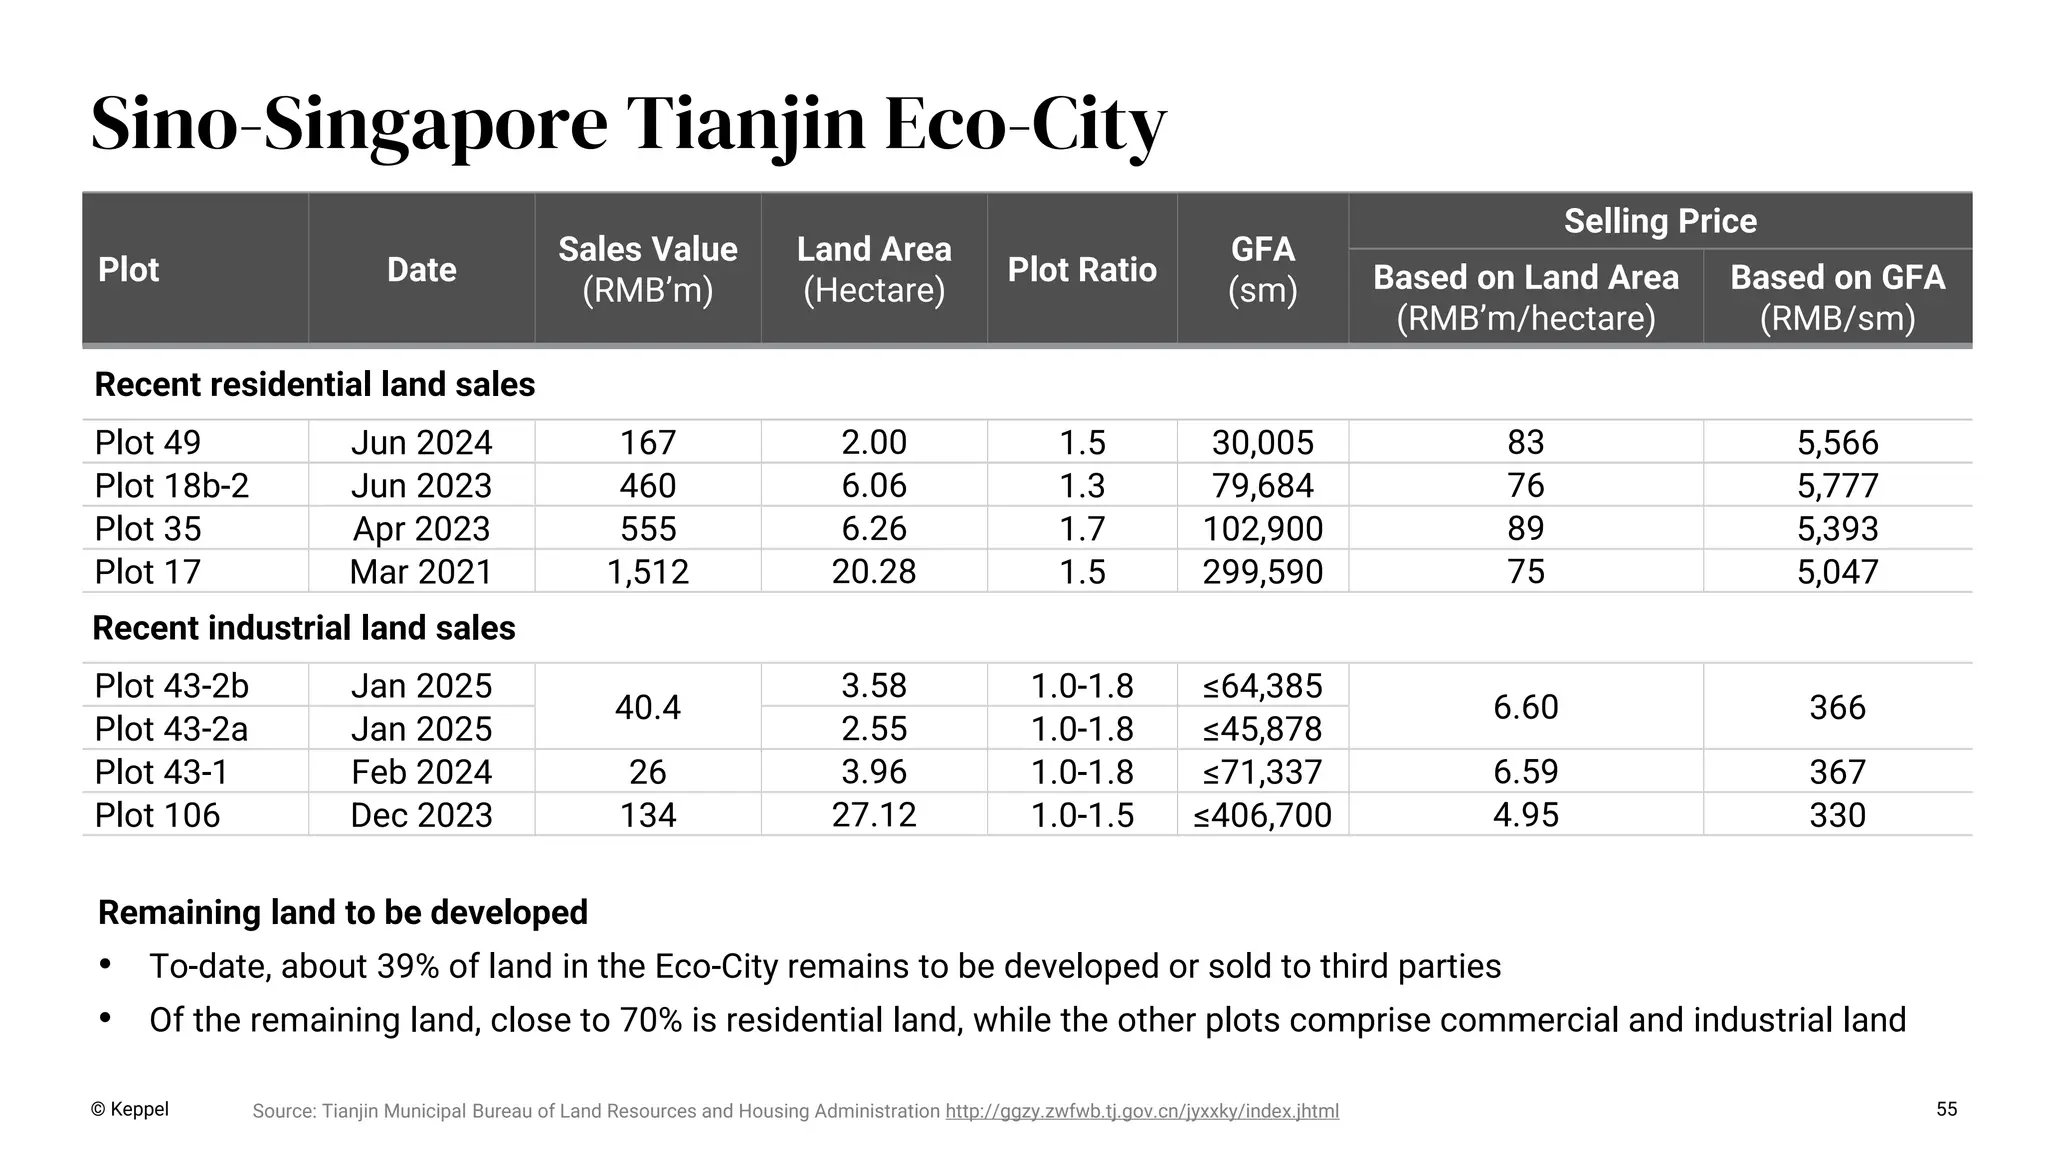
Plot Date Sales Value (RMB’m) Land
Area (Hectare) Plot Ratio GFA (sm) Selling Price Based on Land Area (RMB’m/hectare) Based on GFA (RMB/sm) Recent residential land sales Plot 49 Jun 2024 167 2.00 1.5 30,005 83 5,566 Plot 18b-2 Jun 2023 460 6.06 1.3 79,684 76 5,777 Plot 35 Apr 2023 555 6.26 1.7 102,900 89 5,393 Plot 17 Mar 2021 1,512 20.28 1.5 299,590 75 5,047 Recent industrial land sales Plot 43-2b Jan 2025 40.4 3.58 1.0-1.8 ≤64,385 6.60 366 Plot 43-2a Jan 2025 2.55 1.0-1.8 ≤45,878 Plot 43-1 Feb 2024 26 3.96 1.0-1.8 ≤71,337 6.59 367 Plot 106 Dec 2023 134 27.12 1.0-1.5 ≤406,700 4.95 330 Source: Tianjin Municipal Bureau of Land Resources and Housing Administration http://ggzy.zwfwb.tj.gov.cn/jyxxky/index.jhtml Remaining land to be developed • To-date, about 39% of land in the Eco-City remains to be developed or sold to third parties • Of the remaining land, close to 70% is residential land, while the other plots comprise commercial and industrial land © Keppel 55 Sino-Singapore Tianjin Eco-City
56.
© Keppel 56 Disclaimer NOT
FOR RELEASE, PUBLICATION OR DISTRIBUTION, IN WHOLE OR IN PART, IN, INTO OR FROM ANY JURISDICTION WHERE TO DO SO WOULD CONSTITUTE A VIOLATION OF THE RELEVANT LAWS OF THAT JURISDICTION. THIS PRESENTATION SHALL NOT CONSTITUTE AN OFFER TO SELL OR A SOLICITATION OF AN OFFER TO SELL, SUBSCRIBE FOR OR BUY SECURITIES IN ANY JURISDICTION, INCLUDING IN THE UNITED STATES. This presentation is for information purposes only and does not have regard to your specific investment objectives, financial situation or your particular needs. Any information in this presentation is not to be construed as investment or financial advice and does not constitute an invitation, offer or solicitation of any offer to acquire, purchase or subscribe for securities or other financial instruments in Keppel Ltd. (“Keppel”). The past performance of Keppel is not indicative of the future performance of Keppel. You should exercise judgment in your own financial decisions. If in doubt, please consult with your professional advisers. Unless explicitly indicated otherwise, all monetary values denoted as ‘$’ within this presentation are to be interpreted as referring to Singapore dollars.
Download


![© Keppel 19
1H 2025 net profit (horizontal reporting)
i Includes asset management, transaction and advisory fees on sponsor stakes and co-investments.
ii Includes returns (net of financing costs attributable to such stakes) from equity accounted stakes in listed and private funds – Infrastructure [$6m from listed funds]; Real Estate [$15m from listed
funds], and Connectivity [$16m from listed funds].
iii Includes overheads and financing costs which have not been attributed to segments.
iv Non-Core Portfolio for Divestment comprises mainly legacy offshore & marine assets, residential landbank, selected property developments and investment properties, hospitality and logistics
assets, associated cash and receivables, and other non-core investments that are not aligned with Keppel’s strategic focus as an asset-light global asset manager and operator.
($’m) Asset
Managementi Operatingii Valuation
Capital
recycling Net profit
Infrastructure 16 333 (3) – 346 80%
Real Estate 41 - 27 30 98 23%
Connectivity 14 40 1 2 57 13%
Corporate activitiesiii (70) (16%)
New Keppel 71 373 25 32 431 100%
Non-Core Portfolio for
Divestmentiv (53)
Net profit 71 373 25 32 378](https://image.slidesharecdn.com/keppelltd-250731003357-cabdb749/75/Keppel-Ltd-1H-2025-Results-Presentation-Slides-19-2048.jpg)
![© Keppel 43
1H 2024 net profit (horizontal reporting)
i Includes asset management, transaction and advisory fees on sponsor stakes and co-investments.
ii Includes returns (net of financing costs attributable to such stakes) from equity accounted stakes in listed and private funds – Infrastructure [$8m from listed funds and -$4m from private funds];
Real Estate [$4m from listed funds and -$3m from private funds], and Connectivity [$11m from listed funds and -$3m from private funds].
iii Includes overheads and financing costs which have not been attributed to segments.
iv Non-Core Portfolio for Divestment comprises mainly legacy offshore & marine assets, residential landbank, selected property developments and investment properties, hospitality and logistics
assets, associated cash and receivables, and other non-core investments that are not aligned with Keppel’s strategic focus as an asset-light global asset manager and operator.
($’m) Asset
Managementi Operatingii Valuation
Capital
recycling Net profit
Infrastructure 44 308 12 1 365 106%
Real Estate 19 (10) (29) – (20) (6%)
Connectivity 12 41 12 5 70 20%
Corporate activitiesiii (70) (20%)
New Keppel 75 339 (5) 6 345 100%
Non-Core Portfolio for
Divestmentiv (41)
Net profit 75 339 (5) 6 304](https://image.slidesharecdn.com/keppelltd-250731003357-cabdb749/75/Keppel-Ltd-1H-2025-Results-Presentation-Slides-43-2048.jpg)


![Where to Buy LinkedIn Accounts_ [12 Best Sites] (3).pdf](https://cdn.slidesharecdn.com/ss_thumbnails/wheretobuylinkedinaccounts12bestsites3-251124162550-95b6ddfa-thumbnail.jpg?width=640&height=640&fit=bounds)


![Where to Buy LinkedIn Accounts_ [12 Best Sites] (2).pdf](https://cdn.slidesharecdn.com/ss_thumbnails/wheretobuylinkedinaccounts12bestsites2-251124191348-c246988b-thumbnail.jpg?width=640&height=640&fit=bounds)


