This presentation containsforward-looking statements. These statements may relate to, but are not limited to, plans for growth, technological capabilities and new features and products and the long-term financial
targets of Dropbox, Inc. ("Dropbox," "we," "us," or similar terms), as well as assumptions relating to the foregoing. Forward-looking statements are inherently subject to risks and uncertainties, some of which cannot be
predicted or quantified. In some cases, you can identify forward-looking statements by terminology such as "may," "will," "should," "could," "expect," "plan," "anticipate," "believe," "estimate," "predict," "intend," "potential,"
"would," "continue," “ongoing” or the negative of these terms or other comparable terminology. You should not put undue reliance on any forward-looking statements. Forward-looking statements should not be read as
a guarantee of future performance or results, and will not necessarily be accurate indications of the times at, or by, which such performance or results will be achieved, if at all.
Forward-looking statements are based on information available at the time those statements are made or management’s good-faith beliefs and assumptions as of that time with respect to future events, and are subject
to risks and uncertainties that could cause actual performance or results to differ materially from those expressed in, or suggested by, the forward-looking statements. In light of these risks and uncertainties, the events
and circumstances contemplated by the forward-looking statements made in this presentation may not occur and actual results could differ materially from those anticipated or implied in the forward-looking
statements. These risks and uncertainties are described in greater detail under the heading “Risk Factors” in our quarterly report on Form 10-Q for the fiscal quarter ended June 30, 2024 that we filed with the
Securities and Exchange Commission (the “SEC”) on August 9, 2024, and include, but are not limited to, the impact to our financial results, business operations, the business of our customers, suppliers, partners and
the economy as a result of general macro economic, political and market uncertainty, as well as the potential for a more permanent global shift to remote work; our ability to retain and upgrade paying users, and
increase our recurring revenue; our ability to attract new users or convert registered users to paying users; our future financial performance, including trends in revenue, costs of revenue, gross profit or gross margin,
operating expenses, paying users, and free cash flow, including, in all respects, with respect to any future targets described herein; our ability to maintain profitability; our liability for any unauthorized access to our
data or our users’ content, including through privacy and data security breaches, significant disruption of service on our platform or loss of content, particularly from any potential disruptions in the supply chain for
hardware necessary to offer our services; any decline in demand for our platform or for content collaboration solutions in general; changes in the interoperability of our platform across devices, operating systems, and
third-party applications that we do not control; competition in our markets; our ability to respond to rapid technological changes, extend our platform, develop new features or products, or gain market acceptance for
such new features or products, our ability to manage our growth or plan for future growth; our acquisition of other businesses and the potential of such acquisitions to require significant management attention, disrupt
our business, or dilute stockholder value; our ability to attract and retain key personnel and highly qualified personnel; our capital allocation plans with respect to our stock repurchase program and otherinvestments;
and the dual class structure of our common stock and its effect of concentrating voting control with certain stockholders who held our capital stock prior to the completion of our initial public offering. These factors
could cause actual results, performance or achievement to differ materially and adversely from those anticipated or implied in the forward-looking statements. Additional information will be available in other future
reports that we may file with the SEC from time-to-time, which could cause actual results to vary from expectations. Except as required by law, Dropbox does not undertake any obligation to publicly update or revise
any forward-looking statement, whether as a result of new information, future developments or otherwise.
In addition to financial information presented in accordance with U.S. generally accepted accounting principles (“GAAP”), this presentation includes certain non-GAAP financial measures, including non-GAAP gross
margin, non-GAAP operating income, non-GAAP operating expenses (including research and development, sales and marketing and general and administrative), non-GAAP operating margin and free cash flow. These
non-GAAP measures are presented for supplemental informational purposes only and should not be considered a substitute for financial information presented in accordance with GAAP. These non-GAAP measures
have limitations as analytical tools, and they should not be considered in isolation or as a substitute for analysis of other GAAP financial measures. The non-GAAP measures Dropbox uses may differ from the non-
GAAP measures used by other companies.
This presentation also contains statistical data, estimates and forecasts that are based on independent industry publications or other publicly available information, as well as other information based on our internal
sources. This information may be based on many assumptions and limitations, and you are cautioned not to give undue weight to such information. We have not independently verified the accuracy or completeness of
the data contained in the industry publications and other publicly available information. Dropbox does not undertake to update such data after the date of this presentation.
All third-party logos appearing in this presentation are trademarks or registered trademarks of their respective holders. Any such appearance does not necessarily imply any affiliation with or endorsement of Dropbox.
Safe Harbor Statement
2
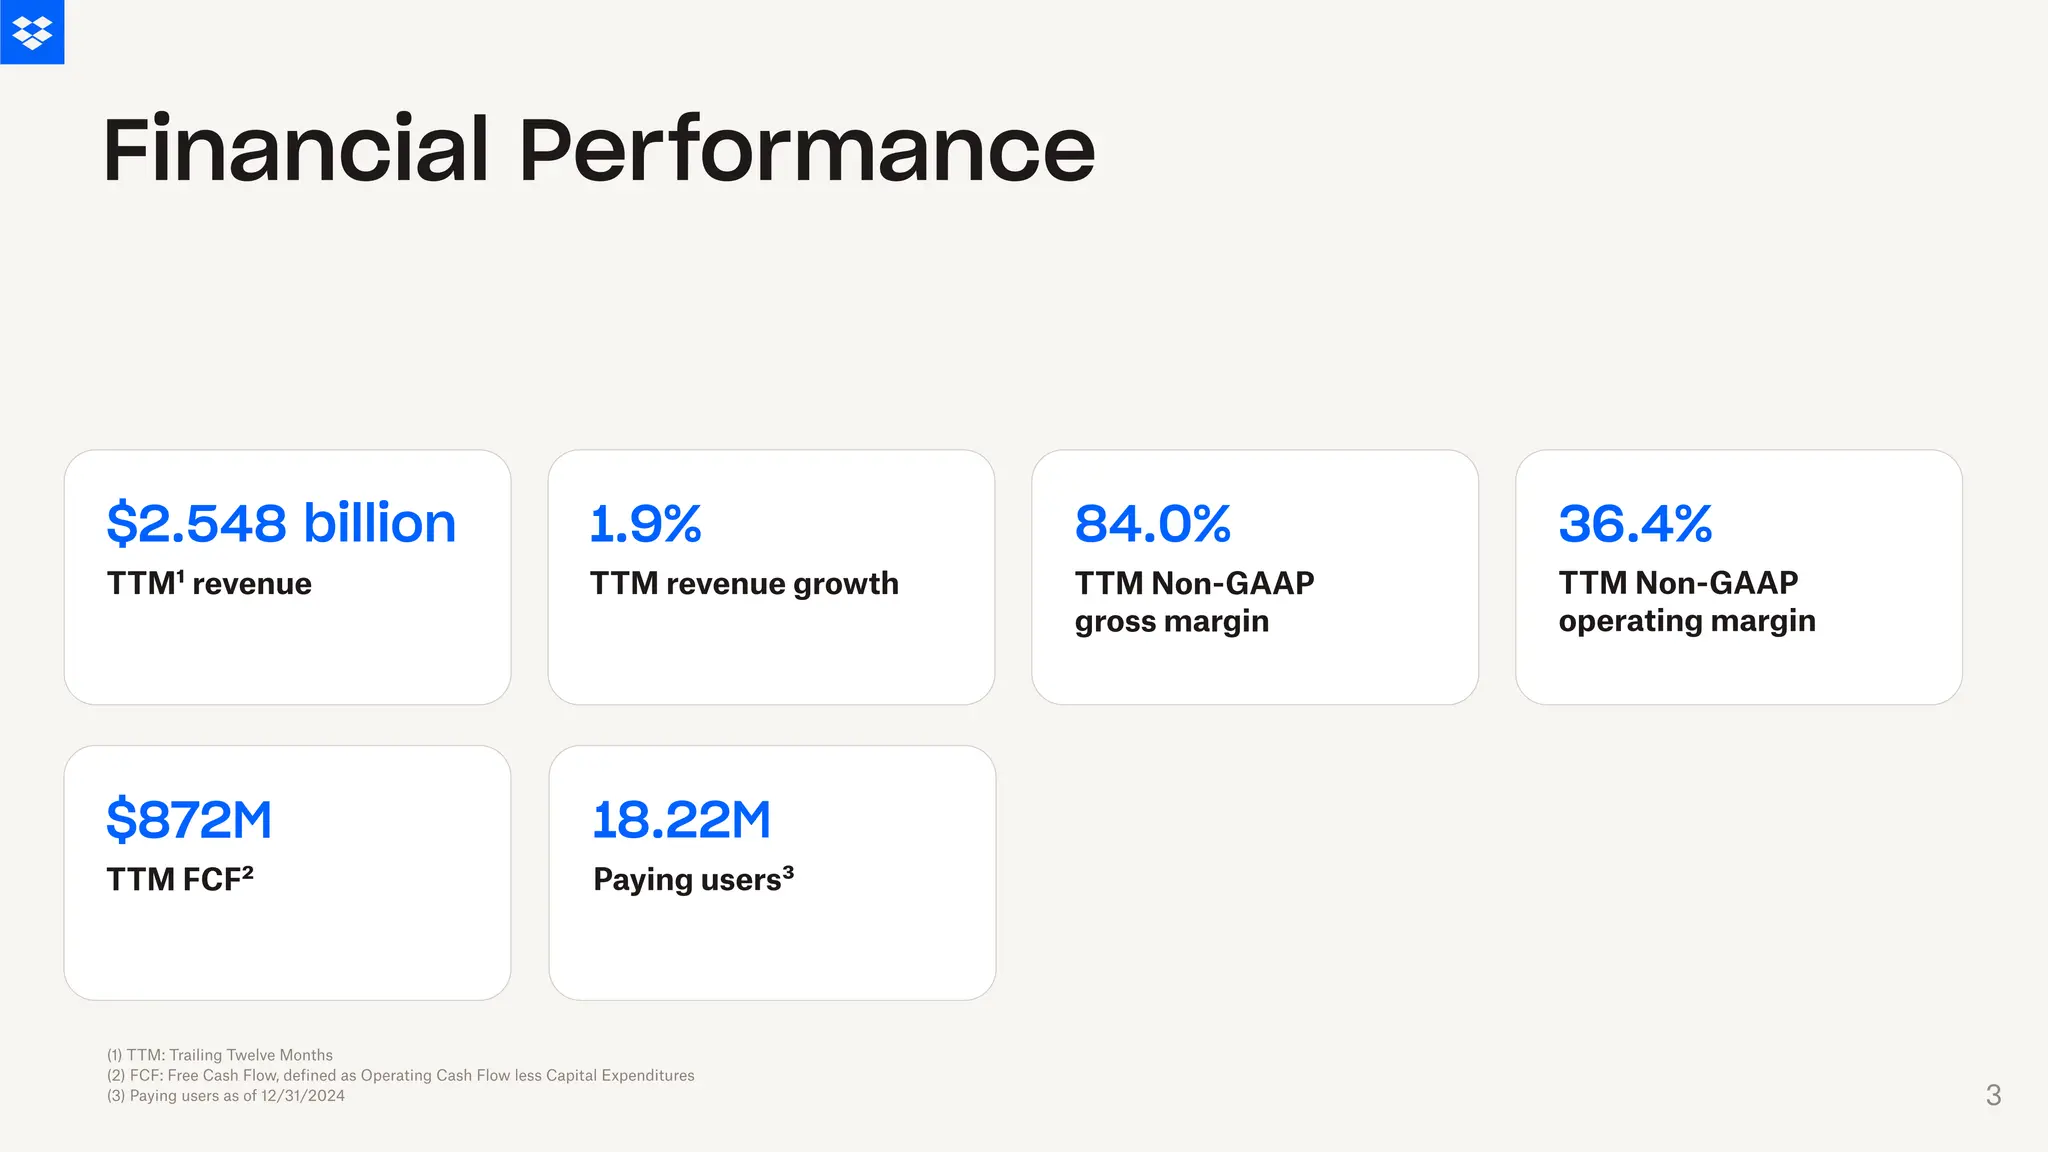
3.
$2.548 billion 1.9%84.0% 36.4%
18.22M
$872M
Financial Performance
TTM¹ revenue TTM revenue growth TTM Non-GAAP
gross margin
TTM Non-GAAP
operating margin
TTM FCF² Paying users³
(1) TTM: Trailing Twelve Months
(2) FCF: Free Cash Flow, defined as Operating Cash Flow less Capital Expenditures
(3) Paying users as of 12/31/2024 3
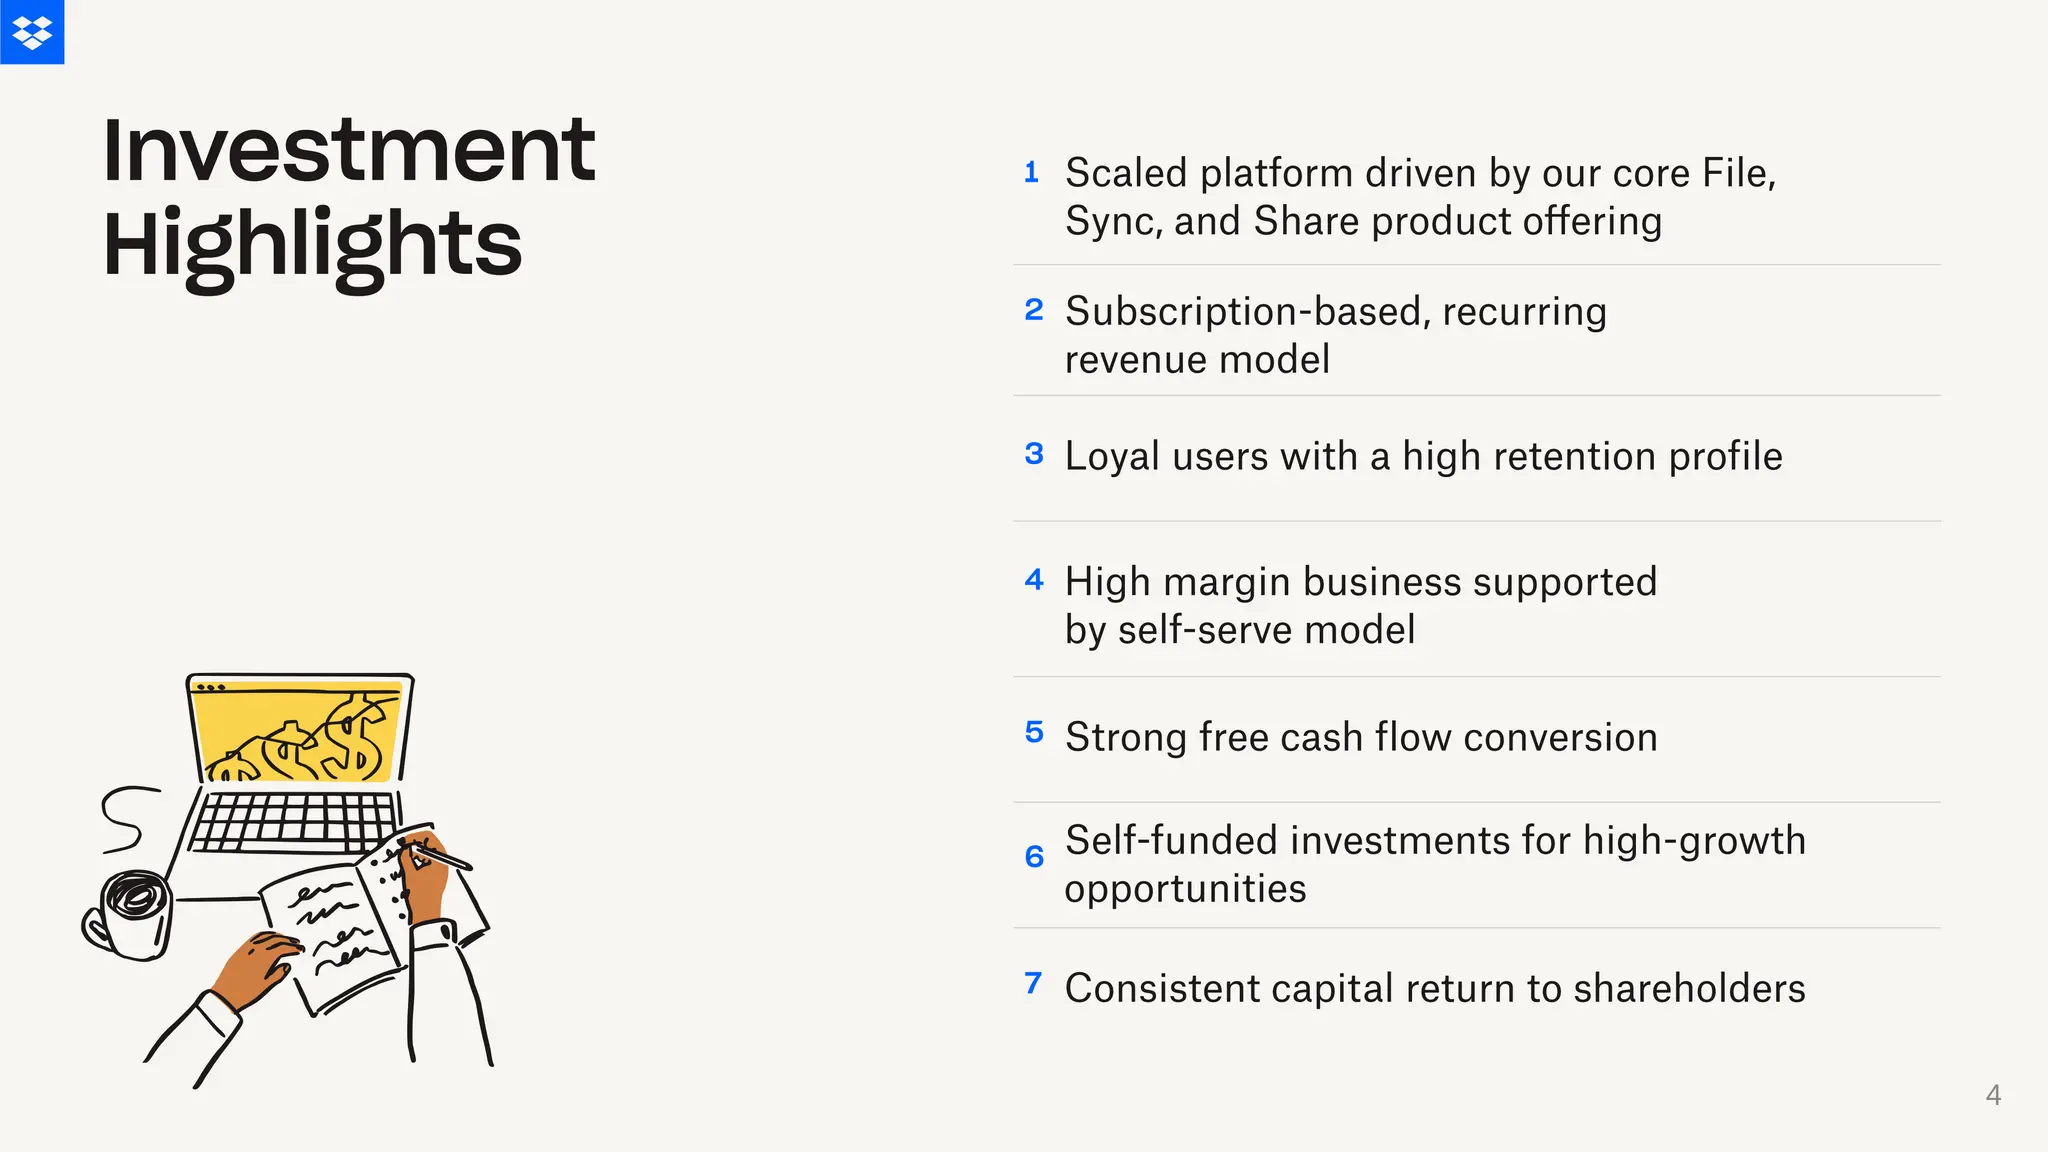
4.
1 Scaled platformdriven by our core File,
Sync, and Share product offering
2 Subscription-based, recurring
revenue model
3 Loyal users with a high retention profile
4 High margin business supported
by self-serve model
5 Strong free cash flow conversion
6
Self-funded investments for high-growth
opportunities
7 Consistent capital return to shareholders
Investment
Highlights
4
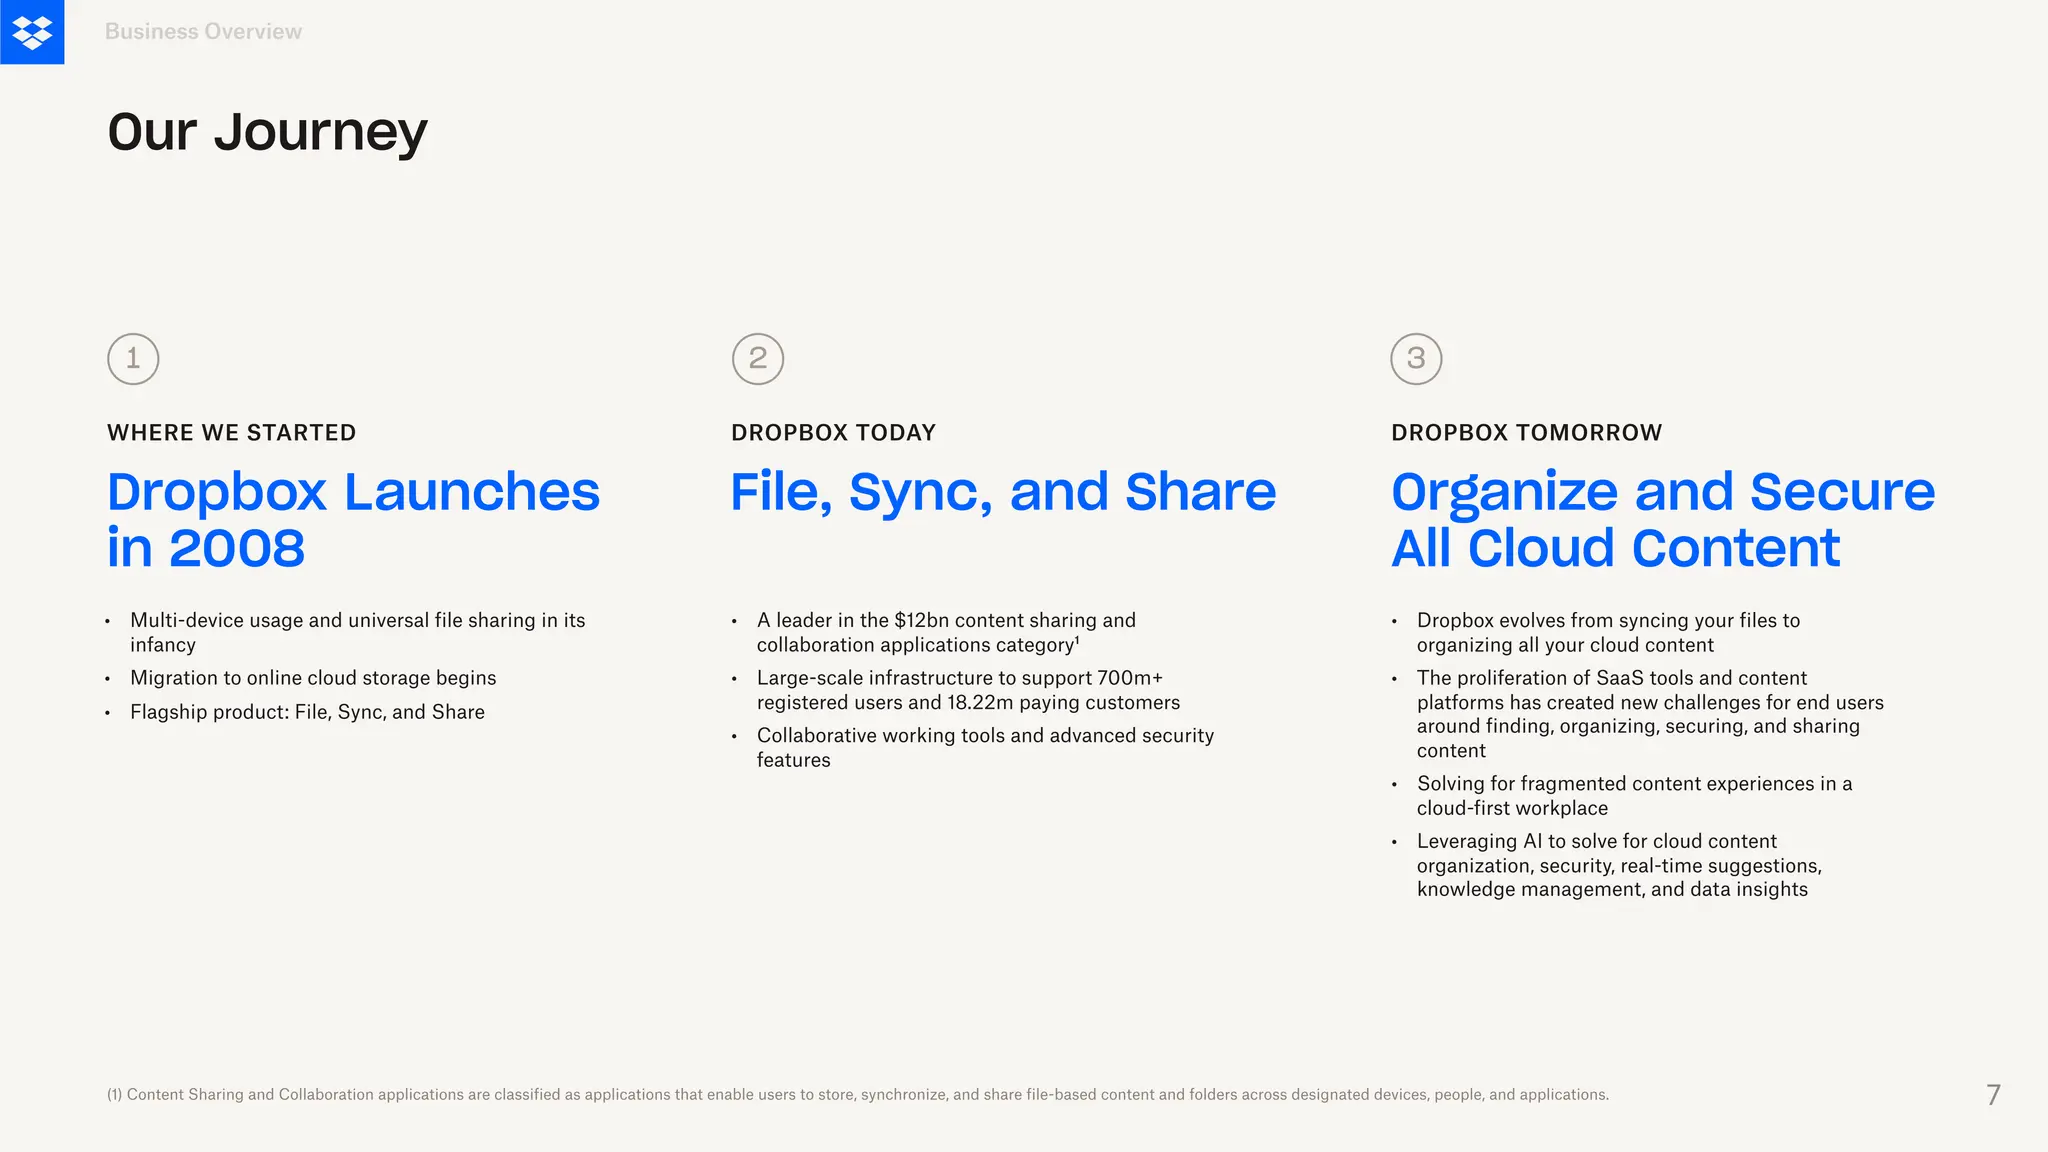
Our Journey
Dropbox Launches
in2008
File, Sync, and Share
WHERE WE STARTED DROPBOX TODAY
Organize and Secure
All Cloud Content
DROPBOX TOMORROW
Business Overview
(1) Content Sharing and Collaboration applications are classified as applications that enable users to store, synchronize, and share file-based content and folders across designated devices, people, and applications.
1 2 3
•
•
•
Multi-device usage and universal file sharing in its
infancy
Migration to online cloud storage begins
Flagship product: File, Sync, and Share
•
•
•
A leader in the $12bn content sharing and
collaboration applications category¹
Large-scale infrastructure to support 700m+
registered users and 18.22m paying customers
Collaborative working tools and advanced security
features
•
•
•
•
Dropbox evolves from syncing your files to
organizing all your cloud content
The proliferation of SaaS tools and content
platforms has created new challenges for end users
around finding, organizing, securing, and sharing
content
Solving for fragmented content experiences in a
cloud-first workplace
Leveraging AI to solve for cloud content
organization, security, real-time suggestions,
knowledge management, and data insights
7
8.
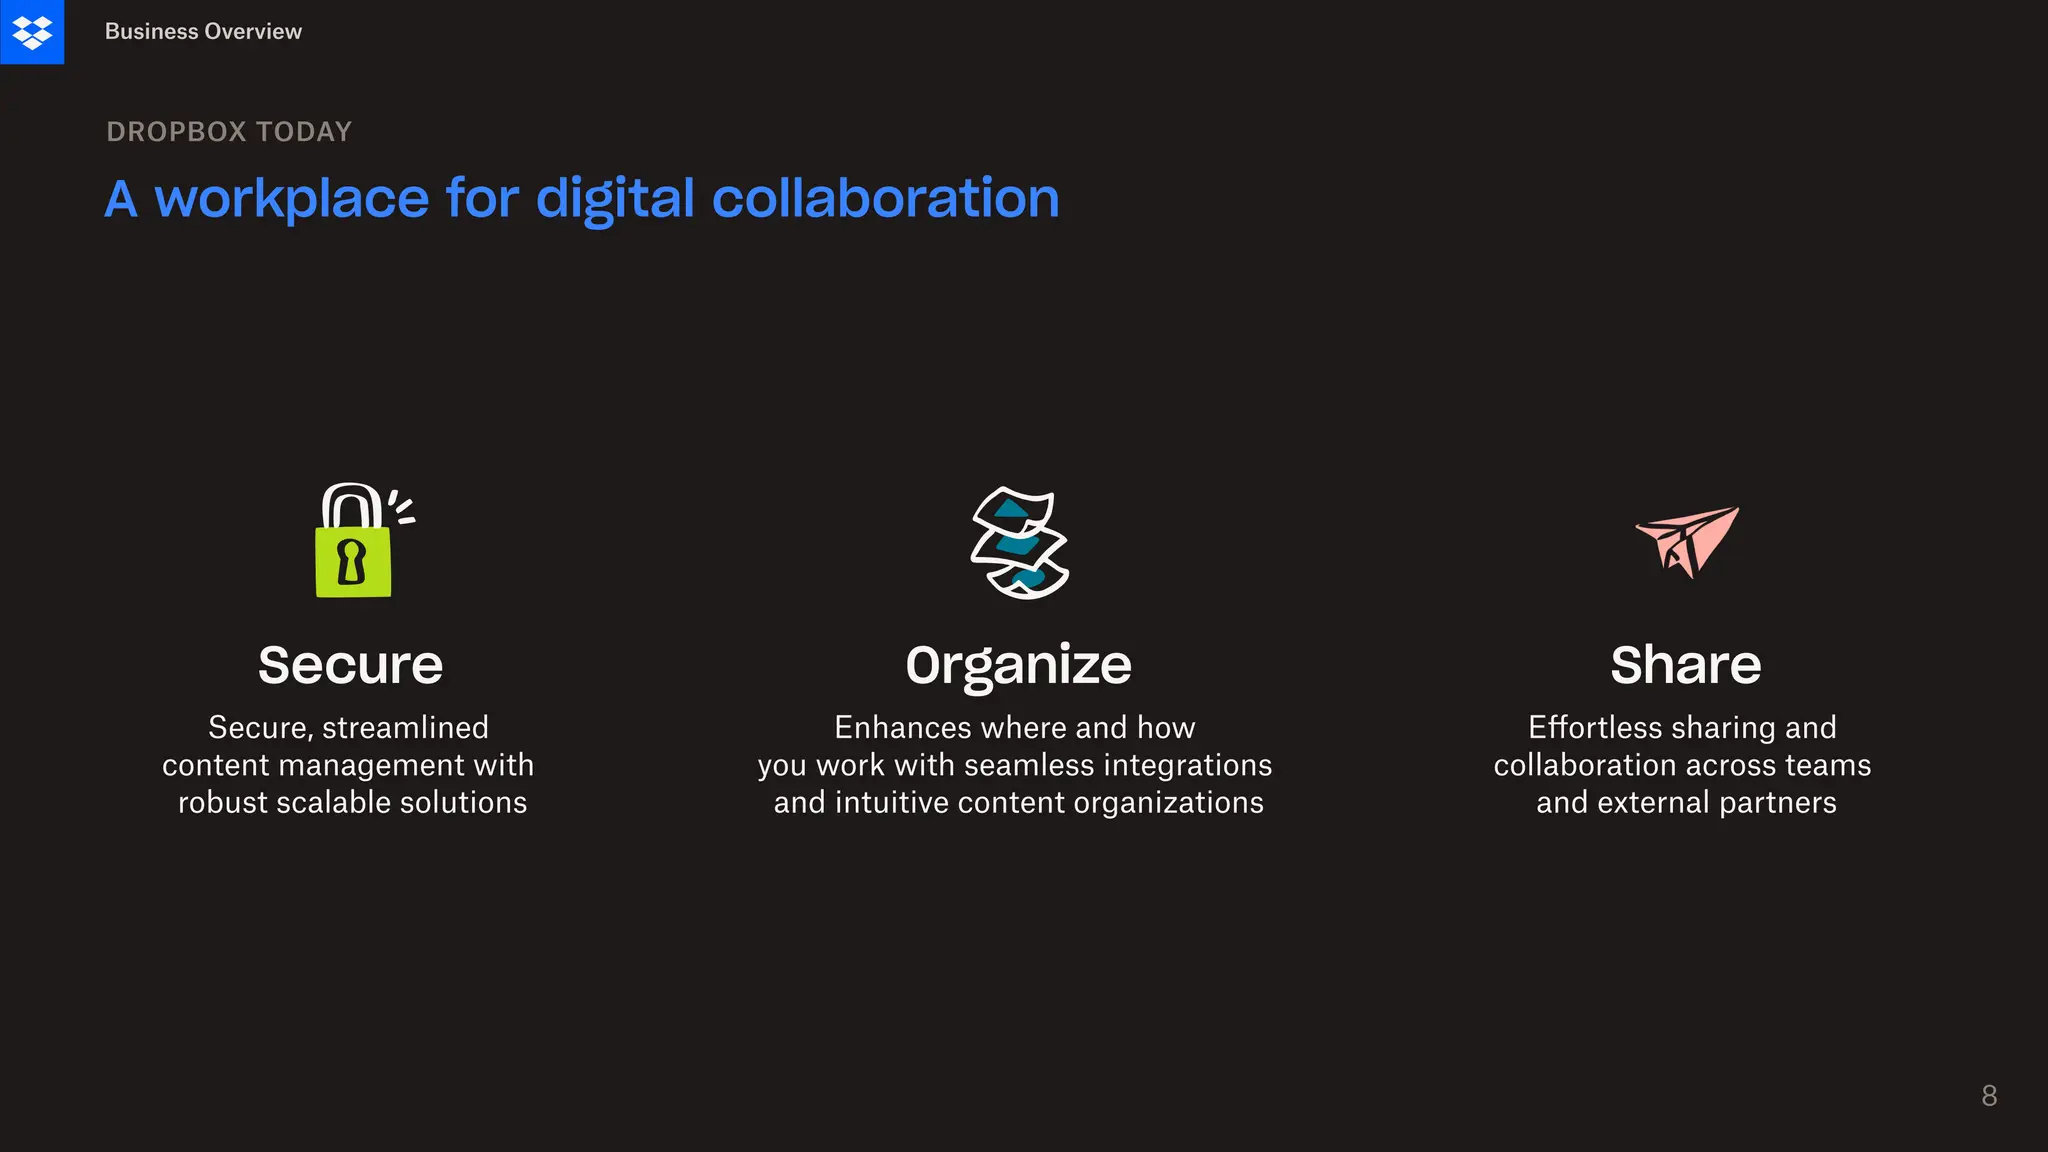
Secure Organize Share
Secure,streamlined
content management with
robust scalable solutions
Enhances where and how
you work with seamless integrations
and intuitive content organizations
Effortless sharing and
collaboration across teams
and external partners
A workplace for digital collaboration
DROPBOX TODAY
Business Overview
8
9.
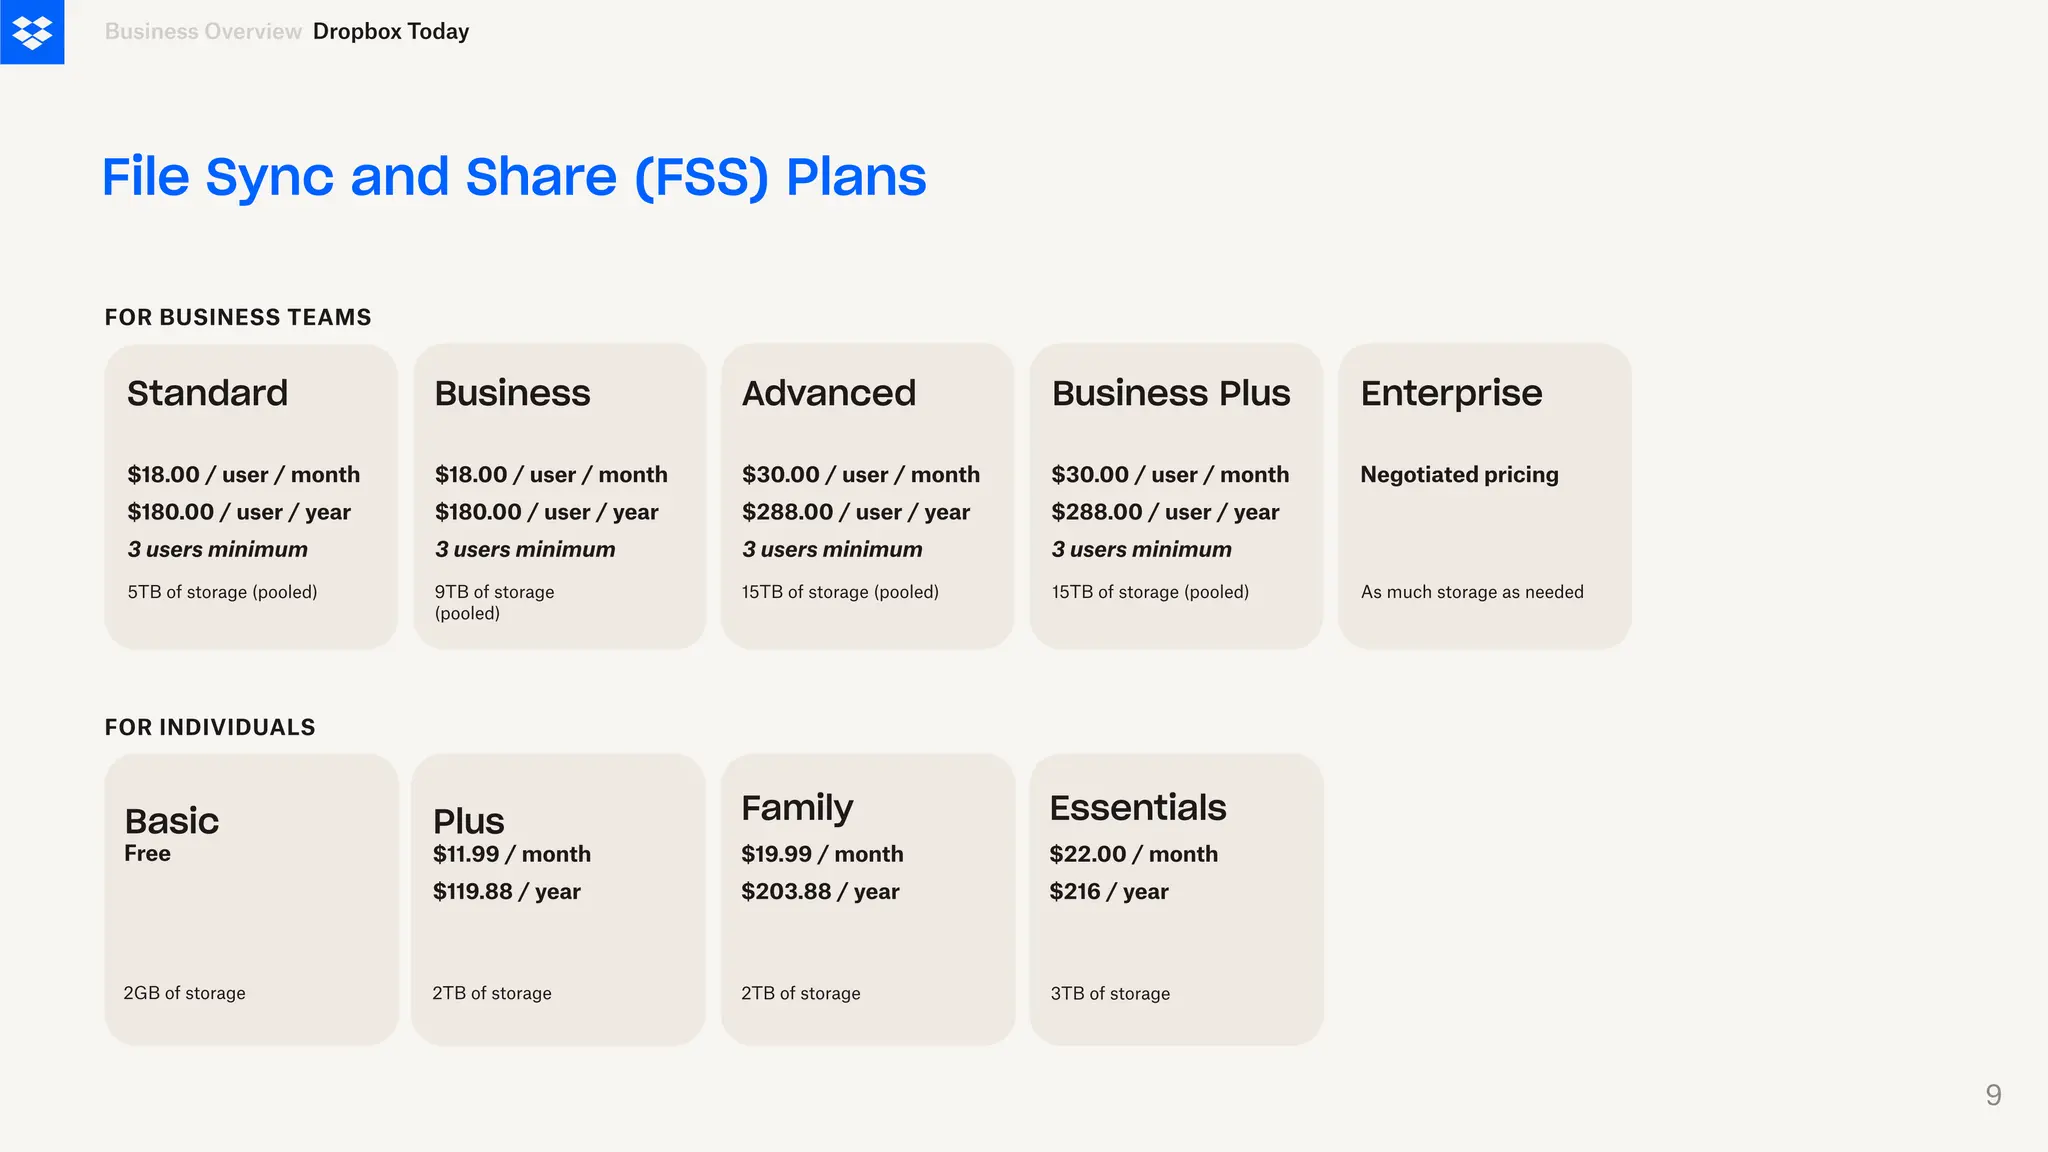
File Sync andShare (FSS) Plans
FOR BUSINESS TEAMS
Business Overview
Standard
$18.00 / user / month
$180.00 / user / year
3 users minimum
Business Advanced Business Plus
5TB of storage (pooled) 9TB of storage
(pooled)
15TB of storage (pooled) 15TB of storage (pooled)
$18.00 / user / month
$180.00 / user / year
3 users minimum
$30.00 / user / month
$288.00 / user / year
3 users minimum
$30.00 / user / month
$288.00 / user / year
3 users minimum
Enterprise
As much storage as needed
Negotiated pricing
Dropbox Today
FOR INDIVIDUALS
Basic Plus
$11.99 / month
$119.88 / year
Family
$19.99 / month
$203.88 / year
Essentials
$22.00 / month
$216 / year
Free
2GB of storage 2TB of storage 2TB of storage 3TB of storage
9
10.
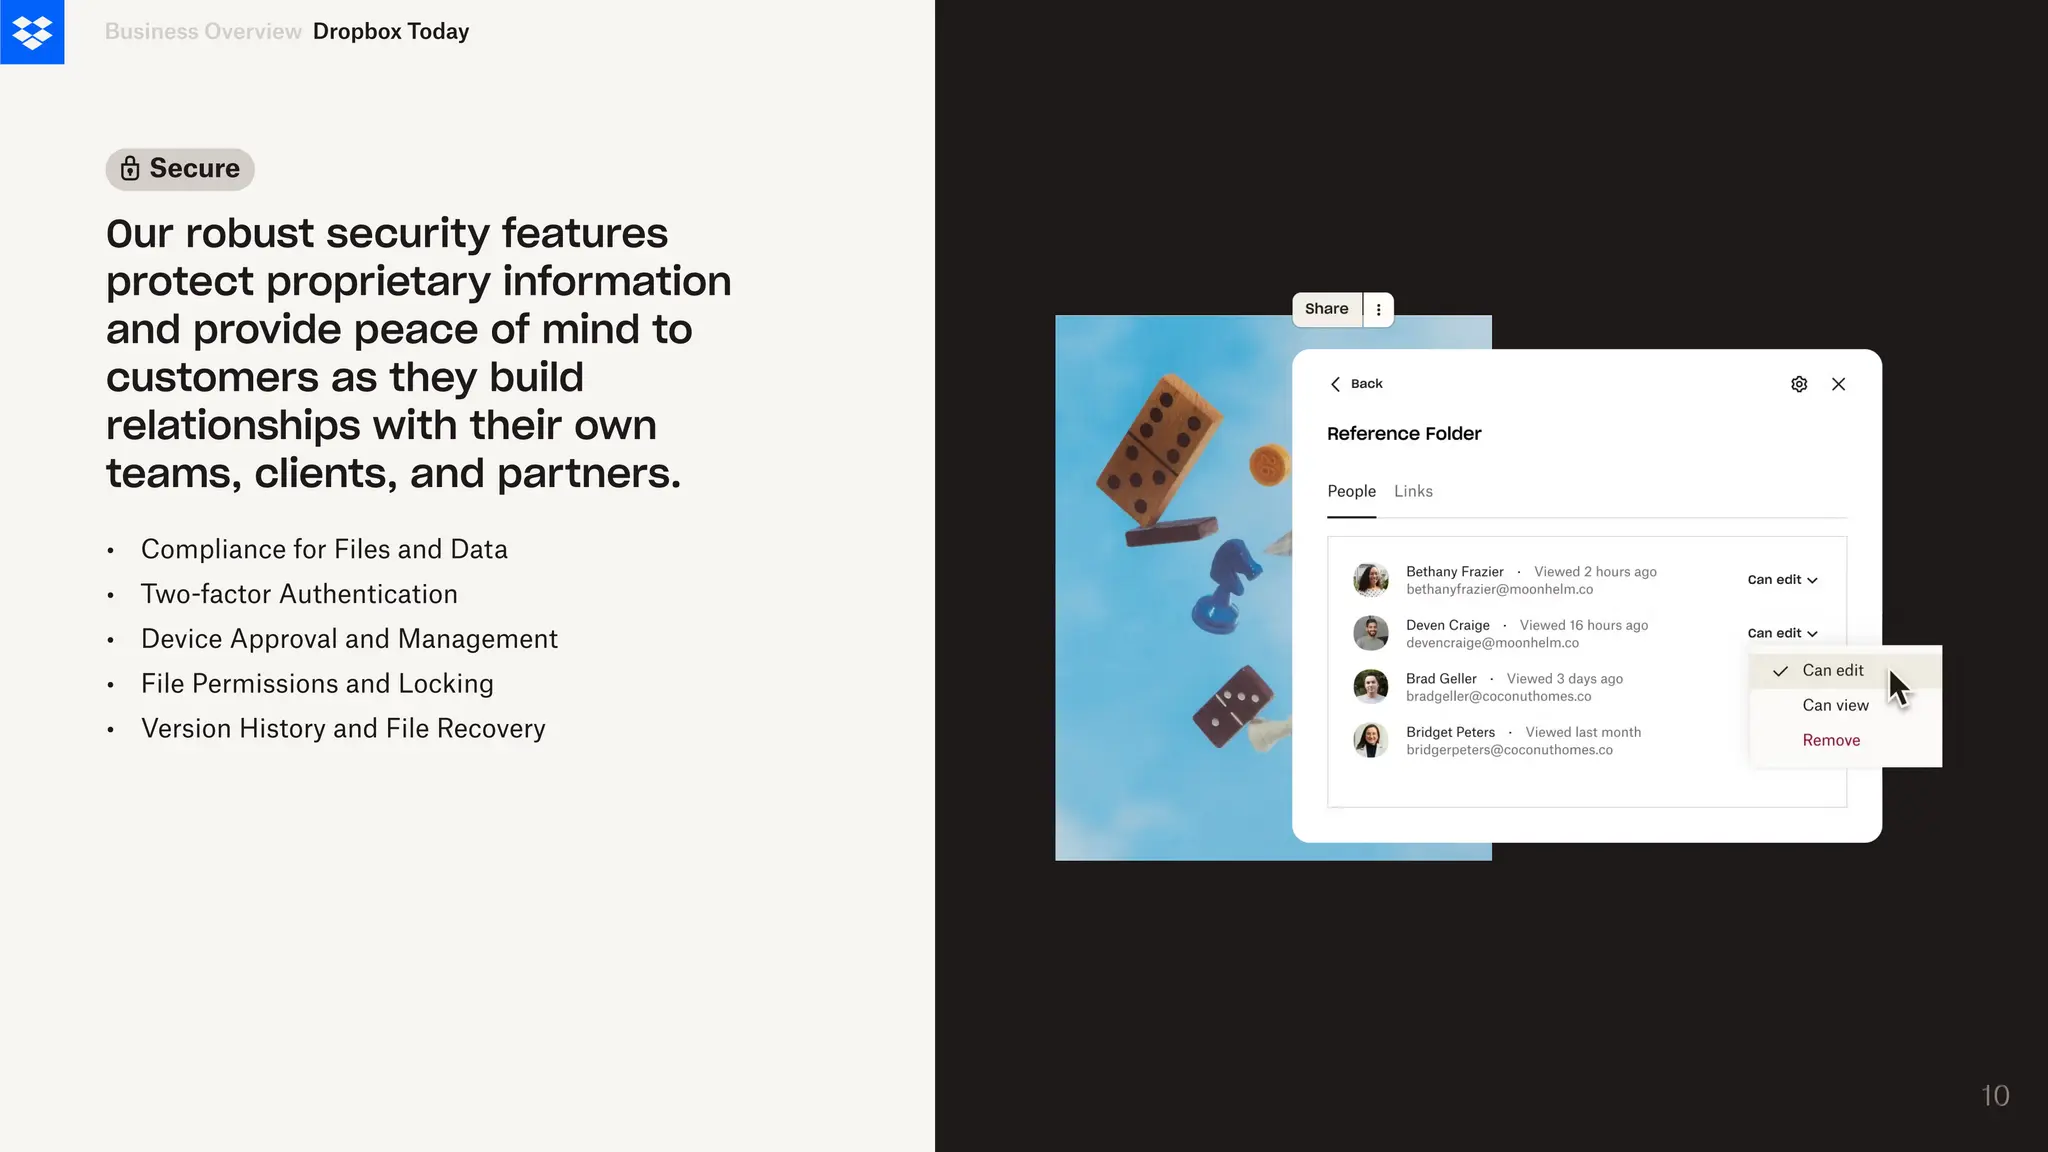
•
•
•
•
•
Compliance for Filesand Data
Two-factor Authentication
Device Approval and Management
File Permissions and Locking
Version History and File Recovery
Business Overview
Our robust security features
protect proprietary information
and provide peace of mind to
customers as they build
relationships with their own
teams, clients, and partners.
Secure
Dropbox Today
10
10
11.
Organize
•
•
•
•
•
File naming, sorting,tagging,
and starring
Smart-search
Automatic file backup and sync
Microsoft co-authoring
PDF annotation
Business Overview
We make file organization effortless
and intuitive with easy-to-use
folder structures and seamless
integrations, allowing customers to
quickly find what they need so they
can get more time to focus more
on high-value work.
Dropbox Today
11
11
12.
•
•
•
•
•
•
Advanced sharing controls
Assignto-dos
Large file sharing and file
transfer
Digital watermarking
Password protection
Folder permission
management
Business Overview
Sharing is key to growth, so we've
focused on creating a simple and
efficient experience for sending
large files, managing access,
tracking document activity, and
syncing edits in real-time, helping
teams work together more
effectively.
Share
Dropbox Today
12
12
13.
•
•
•
•
Secure sharing
Document analytics
Videoanalytics
Dynamic watermarking
Business Overview
DocSend gives teams a single, scalable deal
platform that maximizes file sharing security
and minimizes file viewing friction all while
delivering instant alerts that track engagement
with documents. We remain focused on
making execution faster, data-driven, and
more secure.
Sign makes agreements easy with simple and
secure eSignatures. With Sign, anyone can
set up a document for signature, eSign, and
track the agreement process for their most
important documents
•
•
•
•
Advanced data rooms
Secure client portals
eSignature
One-click NDA
•
•
•
Standalone or integrated into
Dropbox FSS
Unlimited signatures
Tamper-proof documents
•
•
•
•
•
AES 256-bit encryption
Signer fields with data validation
Template links
Audit trail
22 languages 13
Dropbox Today
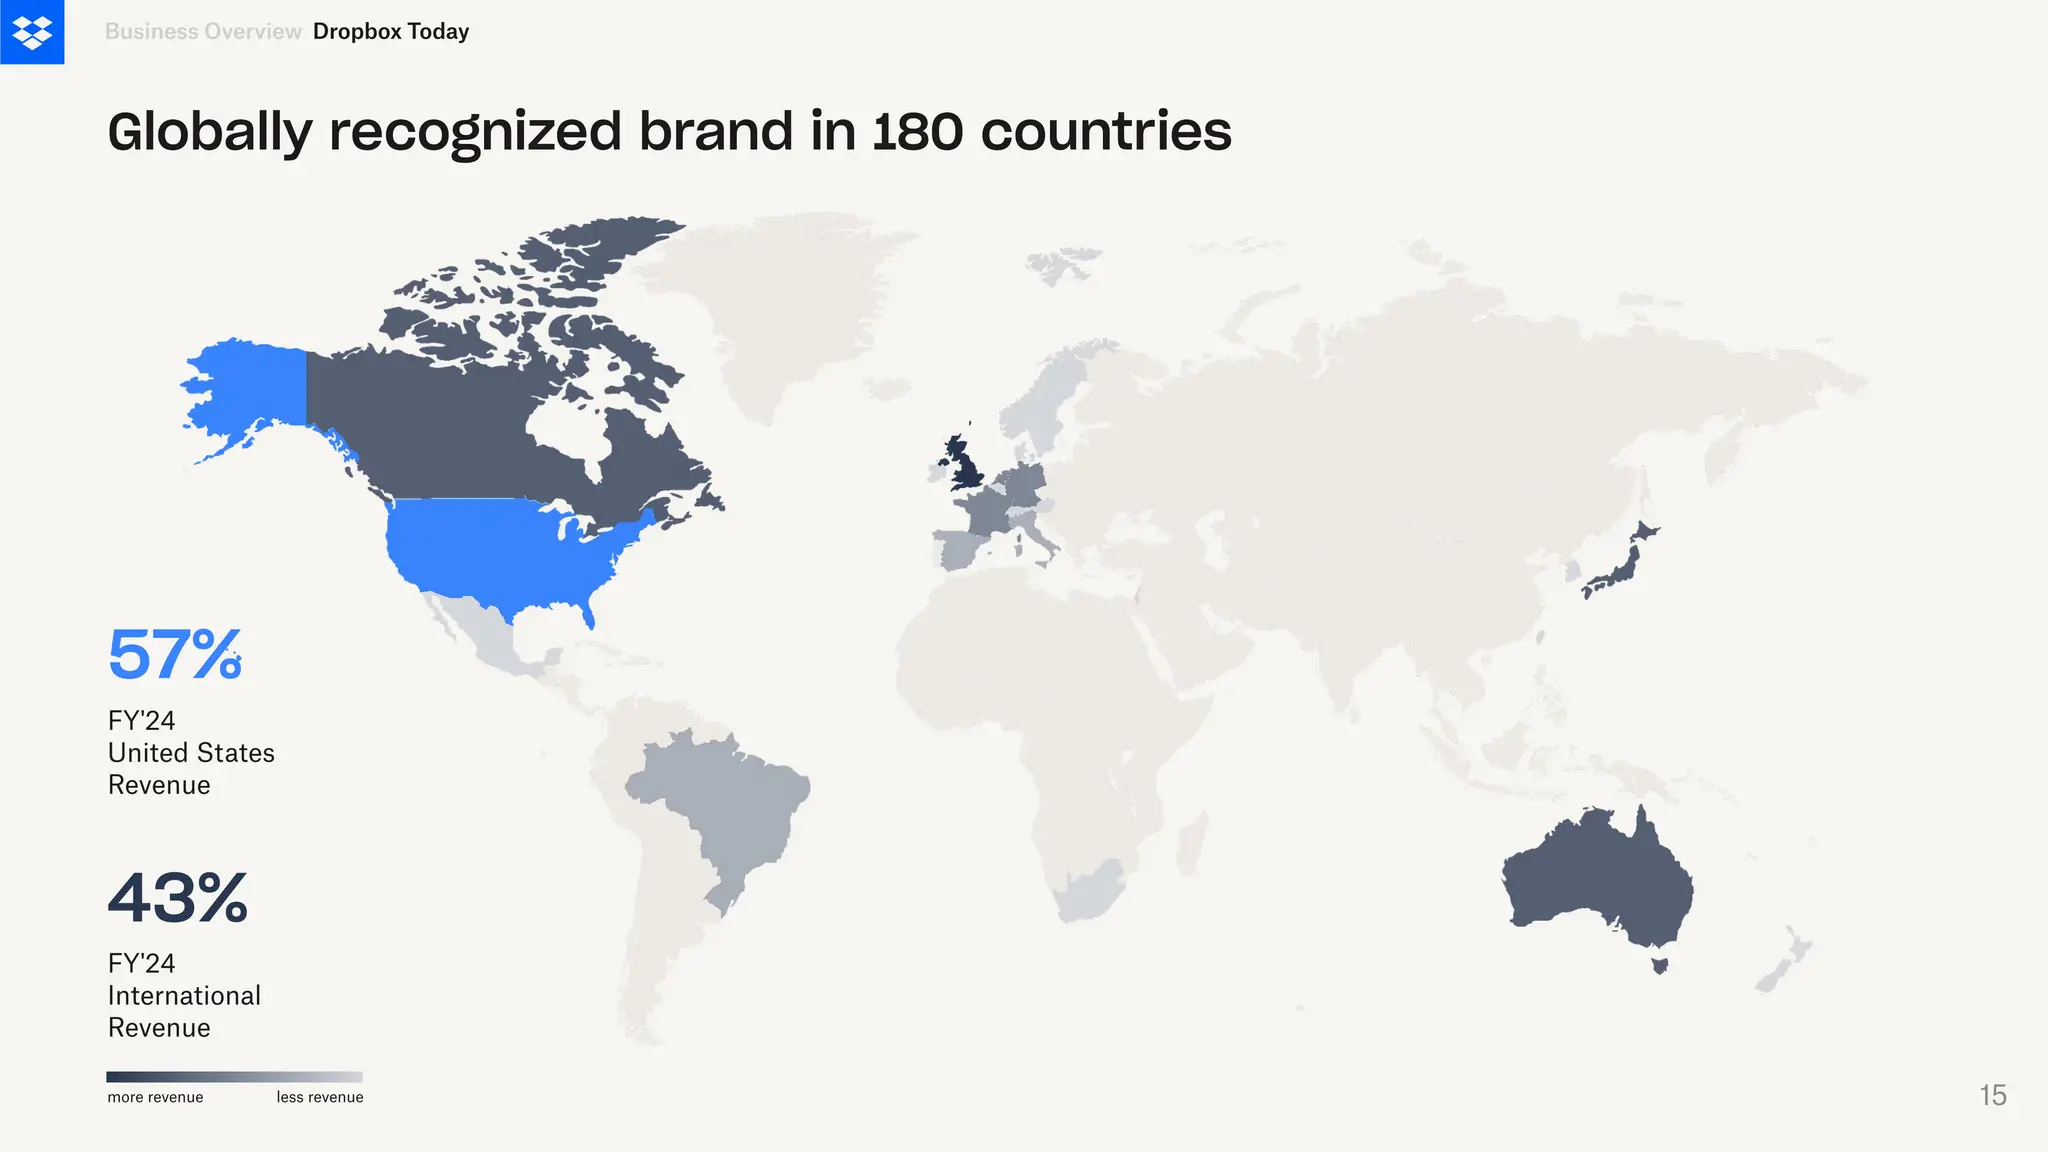
Globally recognized brandin 180 countries
57%
FY'24
United States
Revenue
43%
FY'24
International
Revenue
Business Overview
more revenue less revenue
Dropbox Today
15
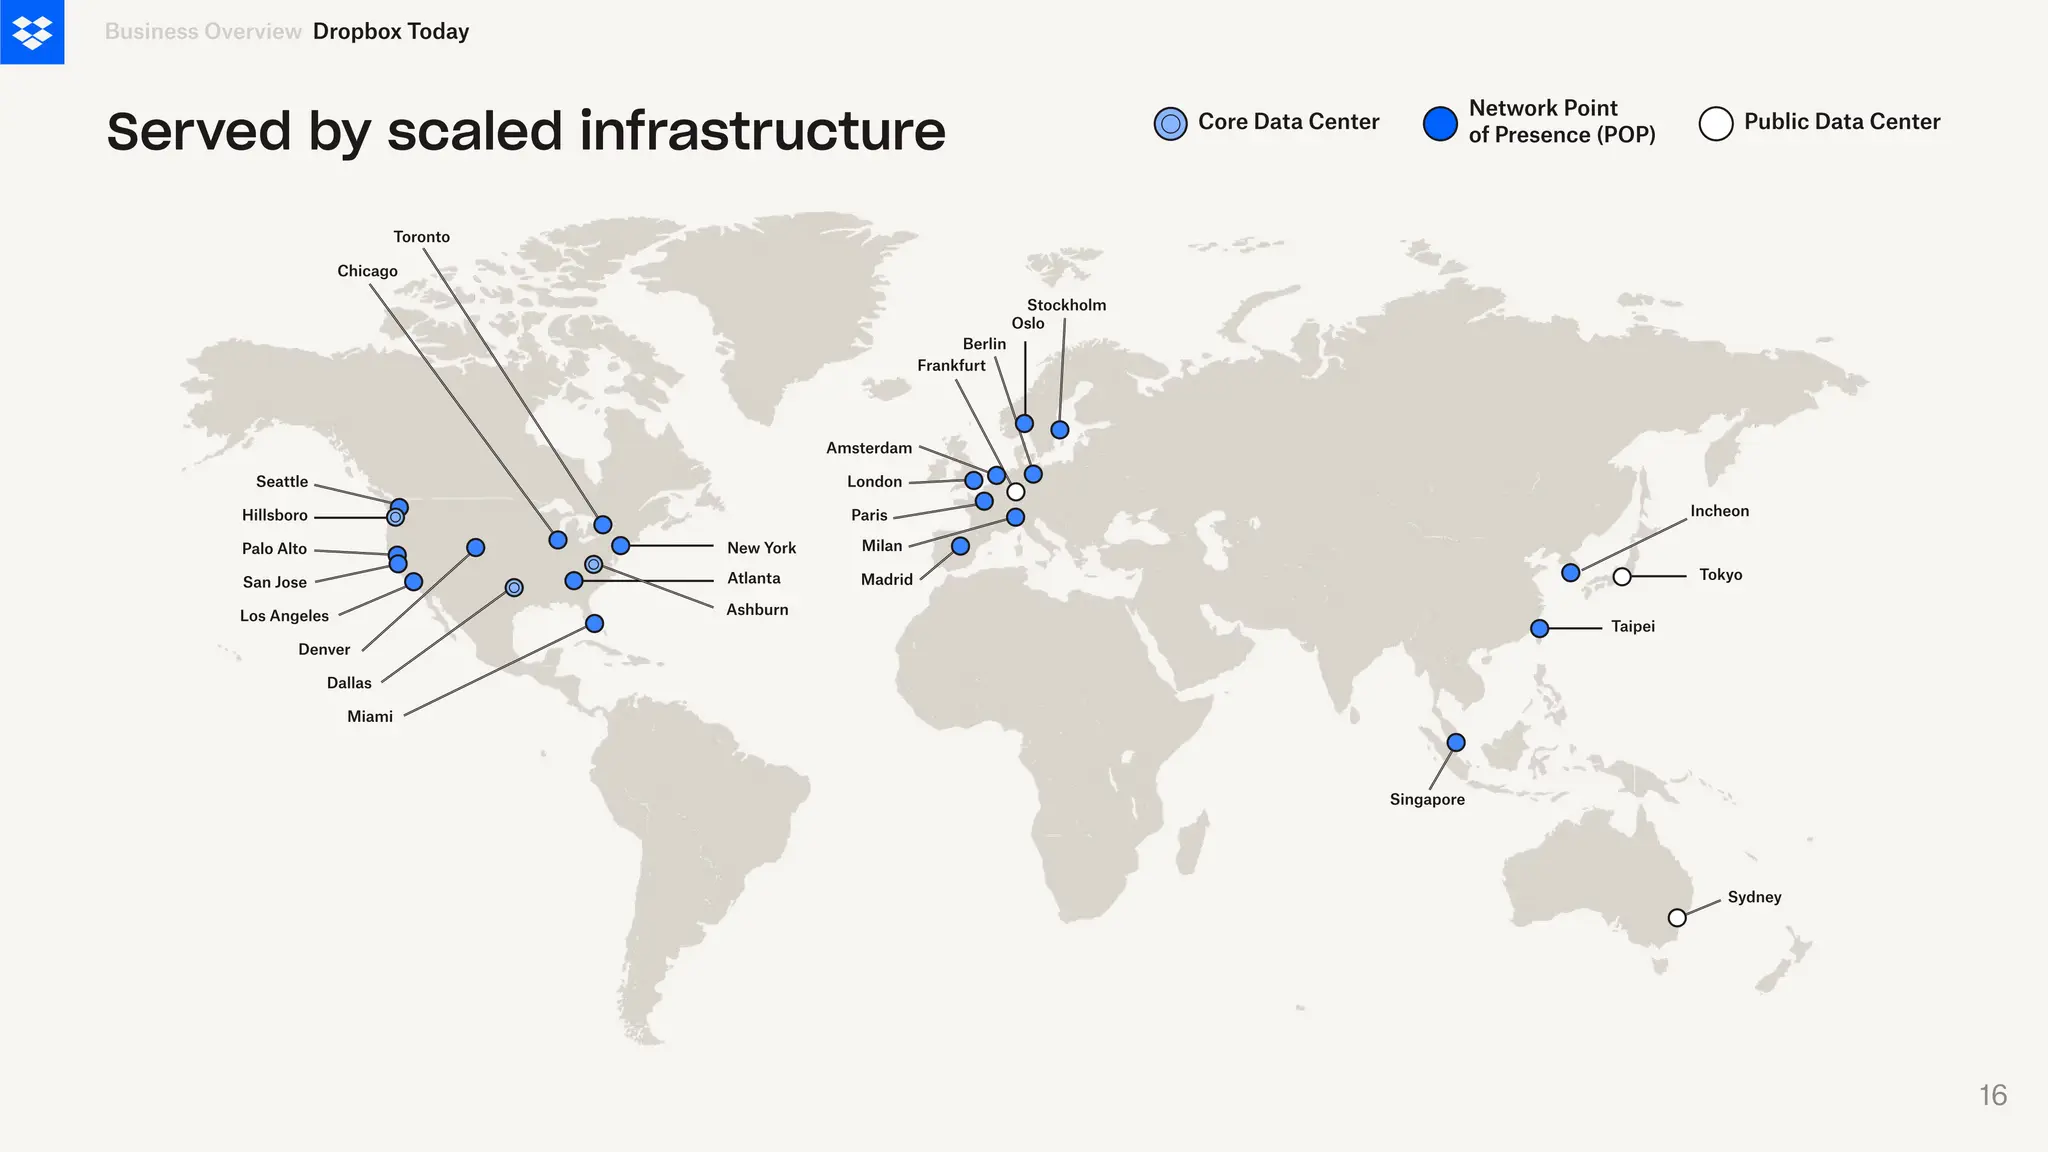
16.
Business Overview DropboxToday
Sydney
Tokyo
Singapore
Taipei
Stockholm
Oslo
Berlin
Frankfurt
Amsterdam
London
Milan
Paris
Madrid
Atlanta
Ashburn
New York
Chicago
Toronto
Dallas
Miami
Seattle
Hillsboro
Palo Alto
San Jose
Los Angeles
Denver
Served by scaled infrastructure
Network Point
of Presence (POP)
Public Data Center
Core Data Center
Incheon
16
17.
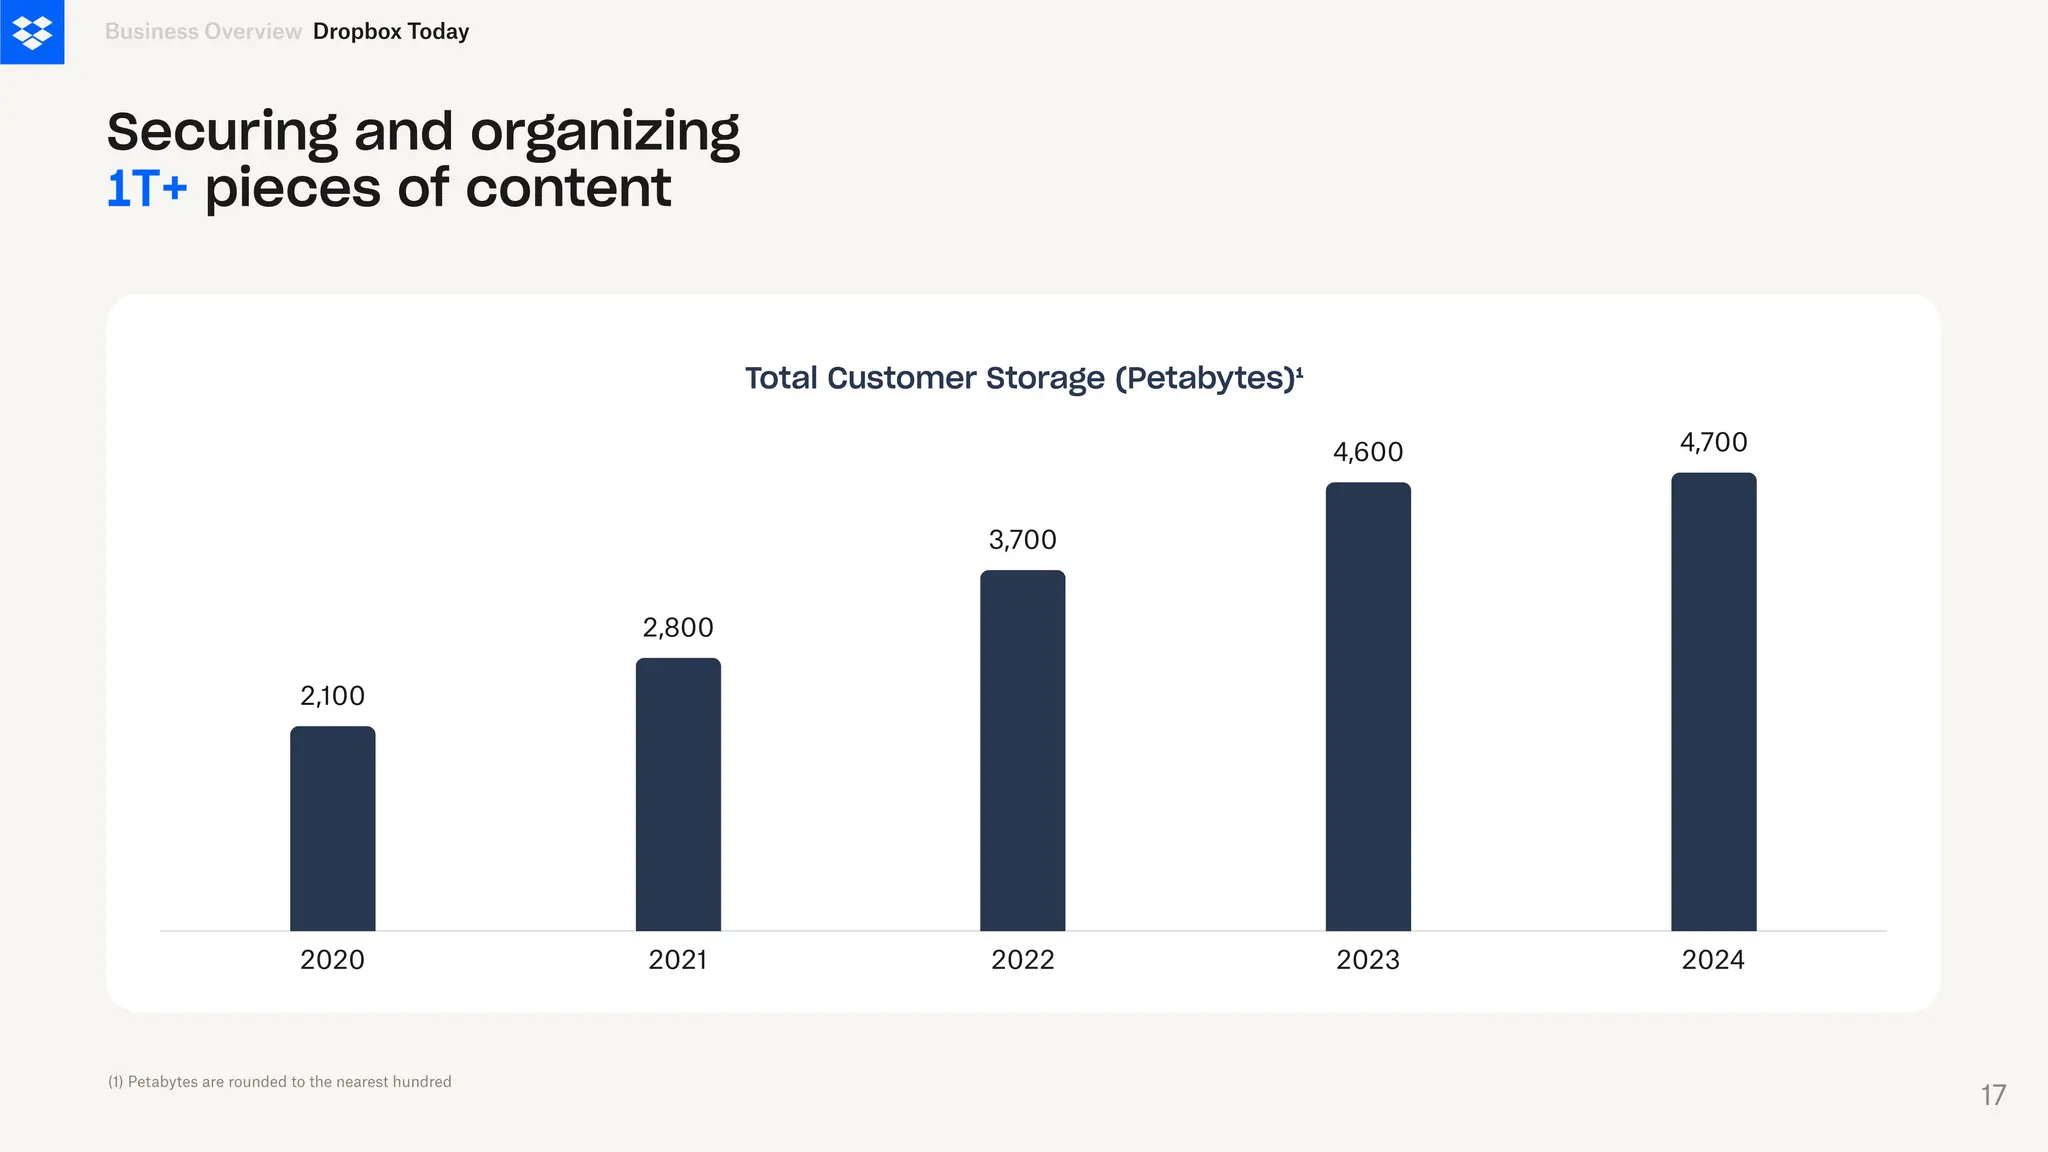
2020 2021 20222023 2024
2,100
2,800
3,700
4,600 4,700
Total Customer Storage (Petabytes)¹
Securing and organizing
1T+ pieces of content
Business Overview
(1) Petabytes are rounded to the nearest hundred
Dropbox Today
17
18.
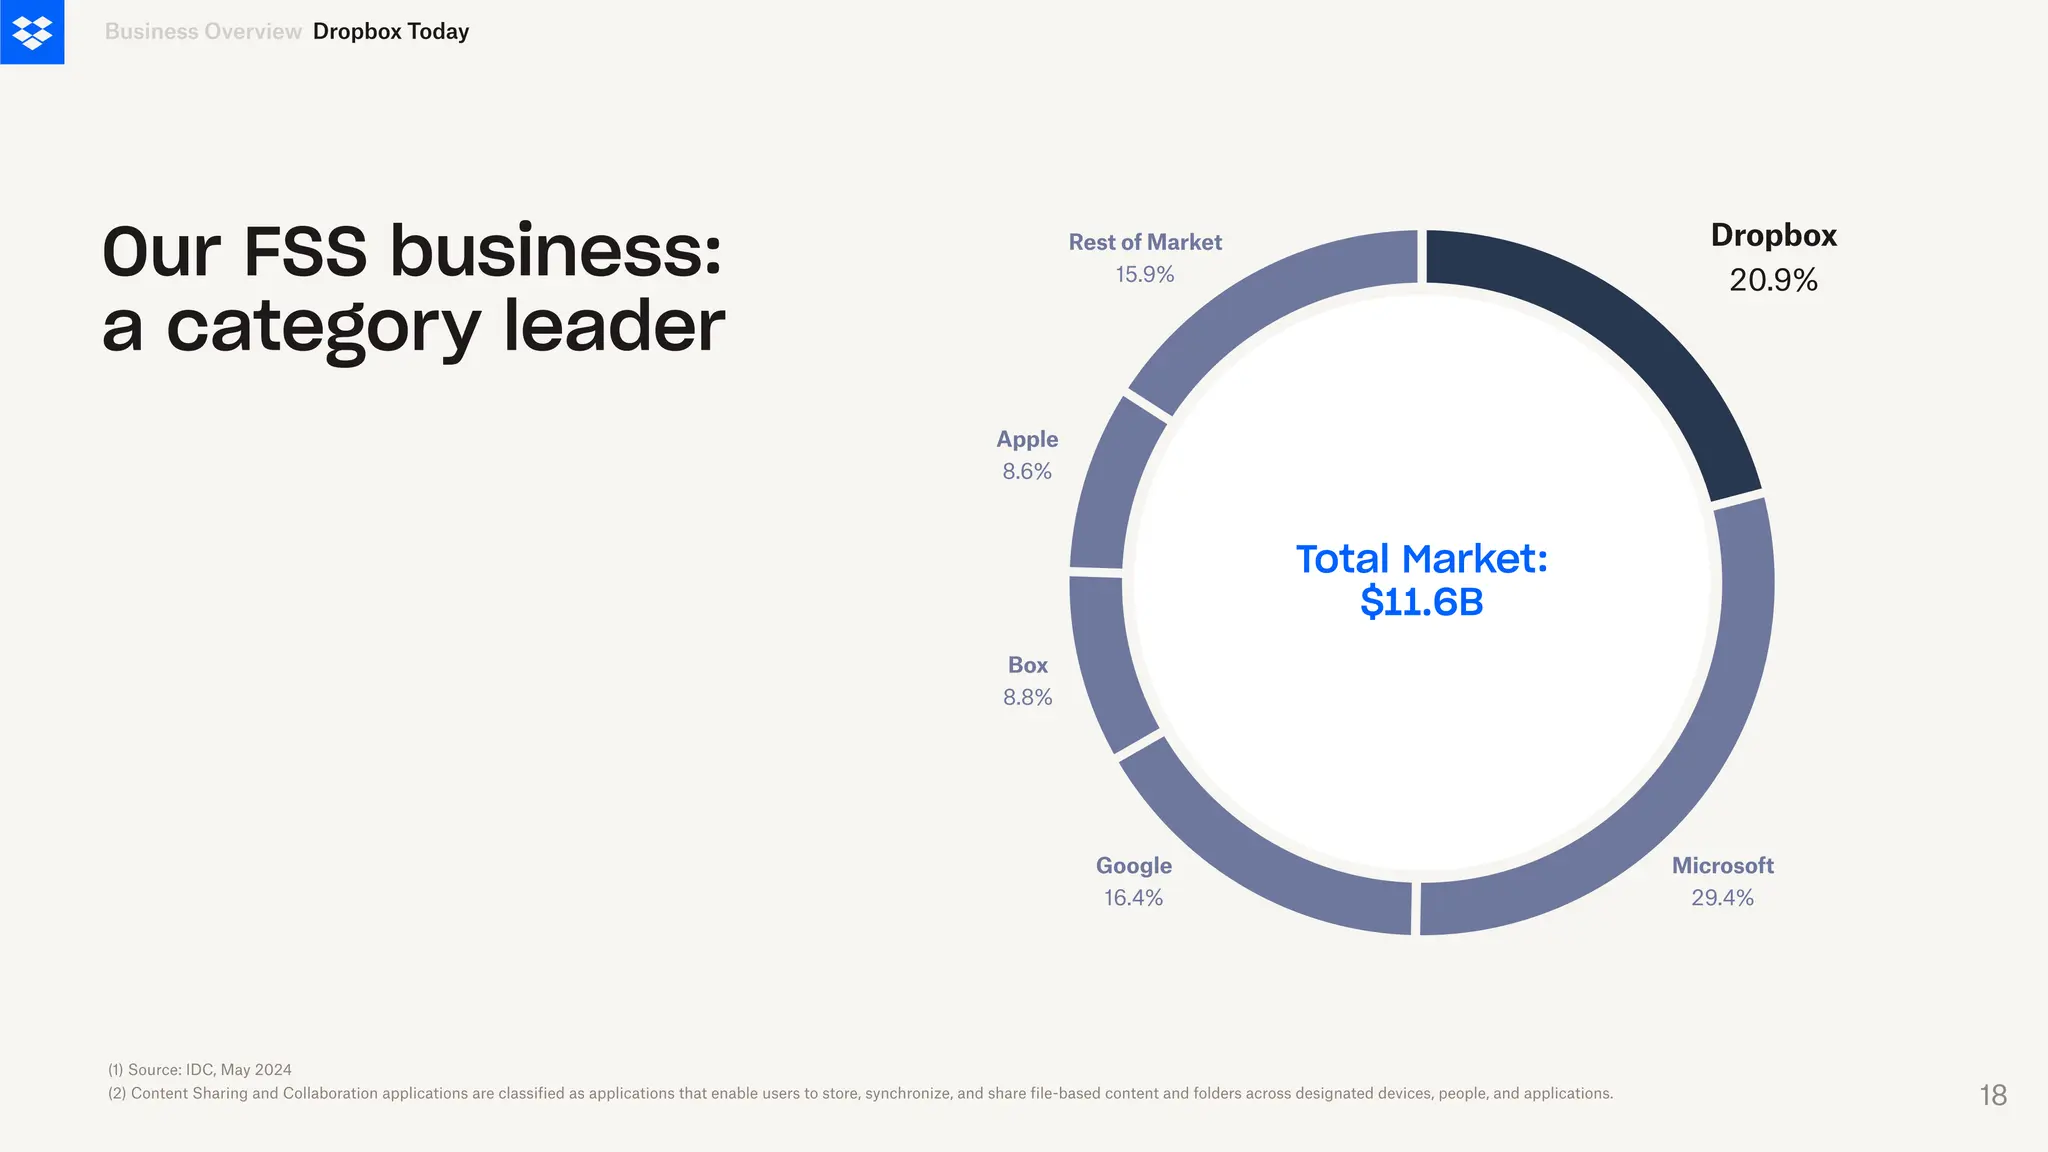
Our FSS business:
acategory leader
Business Overview
Total Market:
$11.6B
(1) Source: IDC, May 2024
(2) Content Sharing and Collaboration applications are classified as applications that enable users to store, synchronize, and share file-based content and folders across designated devices, people, and applications.
Dropbox Today
Rest of Market
15.9%
Apple
8.6%
Box
8.8%
Google
16.4%
Microsoft
29.4%
Dropbox
20.9%
18
19.
Ranked by G2as a leader in customer satisfaction and market presence
Cloud Content Collaboration Software: All
Business Overview
G2 scores products and sellers based on reviews gathered from our user community, as well as data aggregated from online sources and social networks.
Dropbox Today
19
20.
Business Overview
Growth Drivers
Convert
Driveregistered users to become paying users
of Individual and Team plans
Activate
Drive top-of-funnel engagement through increased
sharing and signup activity
Upsell
Prompt existing users to upgrade to premium plans,
additional licenses and add-ons, and new product
experiences such as Dash
Retain
Enhance the core sync experience with a focus on
performance and reliability
File, Sync, and Share
Dropbox Today
20
21.
Why customers
choose Dropbox
Wecan’t imagine doing any of this without Dropbox…
We just wouldn’t be able to stay organized the way we do
now—it’s completely integrated into our workflow."
"
Ausolan's added value comes from the professionalism of our staff
and the differentiation of our services. Dropbox plays a key role in
the technological infrastructure we need to meet that goal, helping
us to work faster and better, in both our internal and external
processes. We know how important it is to complete our work on
time and to the highest quality for our clients. And during the
pandemic, that would not have been possible without Dropbox.”
"
– Ausolan
– DeMuro Das
Ease of use
Security
Seamless Collaboration
Speed & Reliability
Neutral platform
Storage Capacity
21
21
22.
Forces Impacting theLandscape
Cloud Content Collaboration
•
•
•
Rise of comprehensive platform ecosystems
Teams seek multi-cloud networking solutions and ways to search
and organize their cloud content
Content modernization and a shift to public cloud solutions will be
a sustaining growth factor with the share of public cloud solutions
growing from 77.9% in 2023 to 87.3% in 2028¹
Software Proliferation
•
•
•
Knowledge workers seek efficiency and organization as they continue to
adopt additional software tools
As of May, 2023, The average number of applications a knowledge worker
used was 11, compared to six applications in 2019²
More than two-thirds of workers say they waste up to 60 minutes at work
navigating between apps, and 68 percent of workers toggle between apps
up to 10 times an hour³
Security & Compliance
•
•
•
Material driver of user adoption and customer purchase decisions
Growing significance as teams adopt new tools
and look to AI-enabled solutions.
72% of security executives have increased their risk management
investment in AI governance and 67% say GenAI increases their
cyber attack vector⁴
Artificial Intelligence
•
•
•
•
OpenAI’s ChatGPT release triggered industry-wide development of LLMs
Platforms integrate AI and ML for enhanced content management, search,
and collaboration
Early stages of long-term implementation
More Than 80% of Enterprises Will Have Used Generative AI APIs or
Deployed Generative AI-Enabled Applications by 2026⁵
Business Overview
(1) Source: IDC, Worldwide Content Services Applications Forecast, 2024–2028, May 2024
(2) Source: Gartner, Digital Workers Struggle to Find the Information Needed to Effectively Perform Their Jobs
(3) Source: RingCentral, From Workplace Chaos to Zen
(4) Source: PWC, 2025 Global Digital Trust Insights
(5) Source: Gartner, 2023 Gartner Hype Cycle for Generative AI
Dropbox Today
22
23.
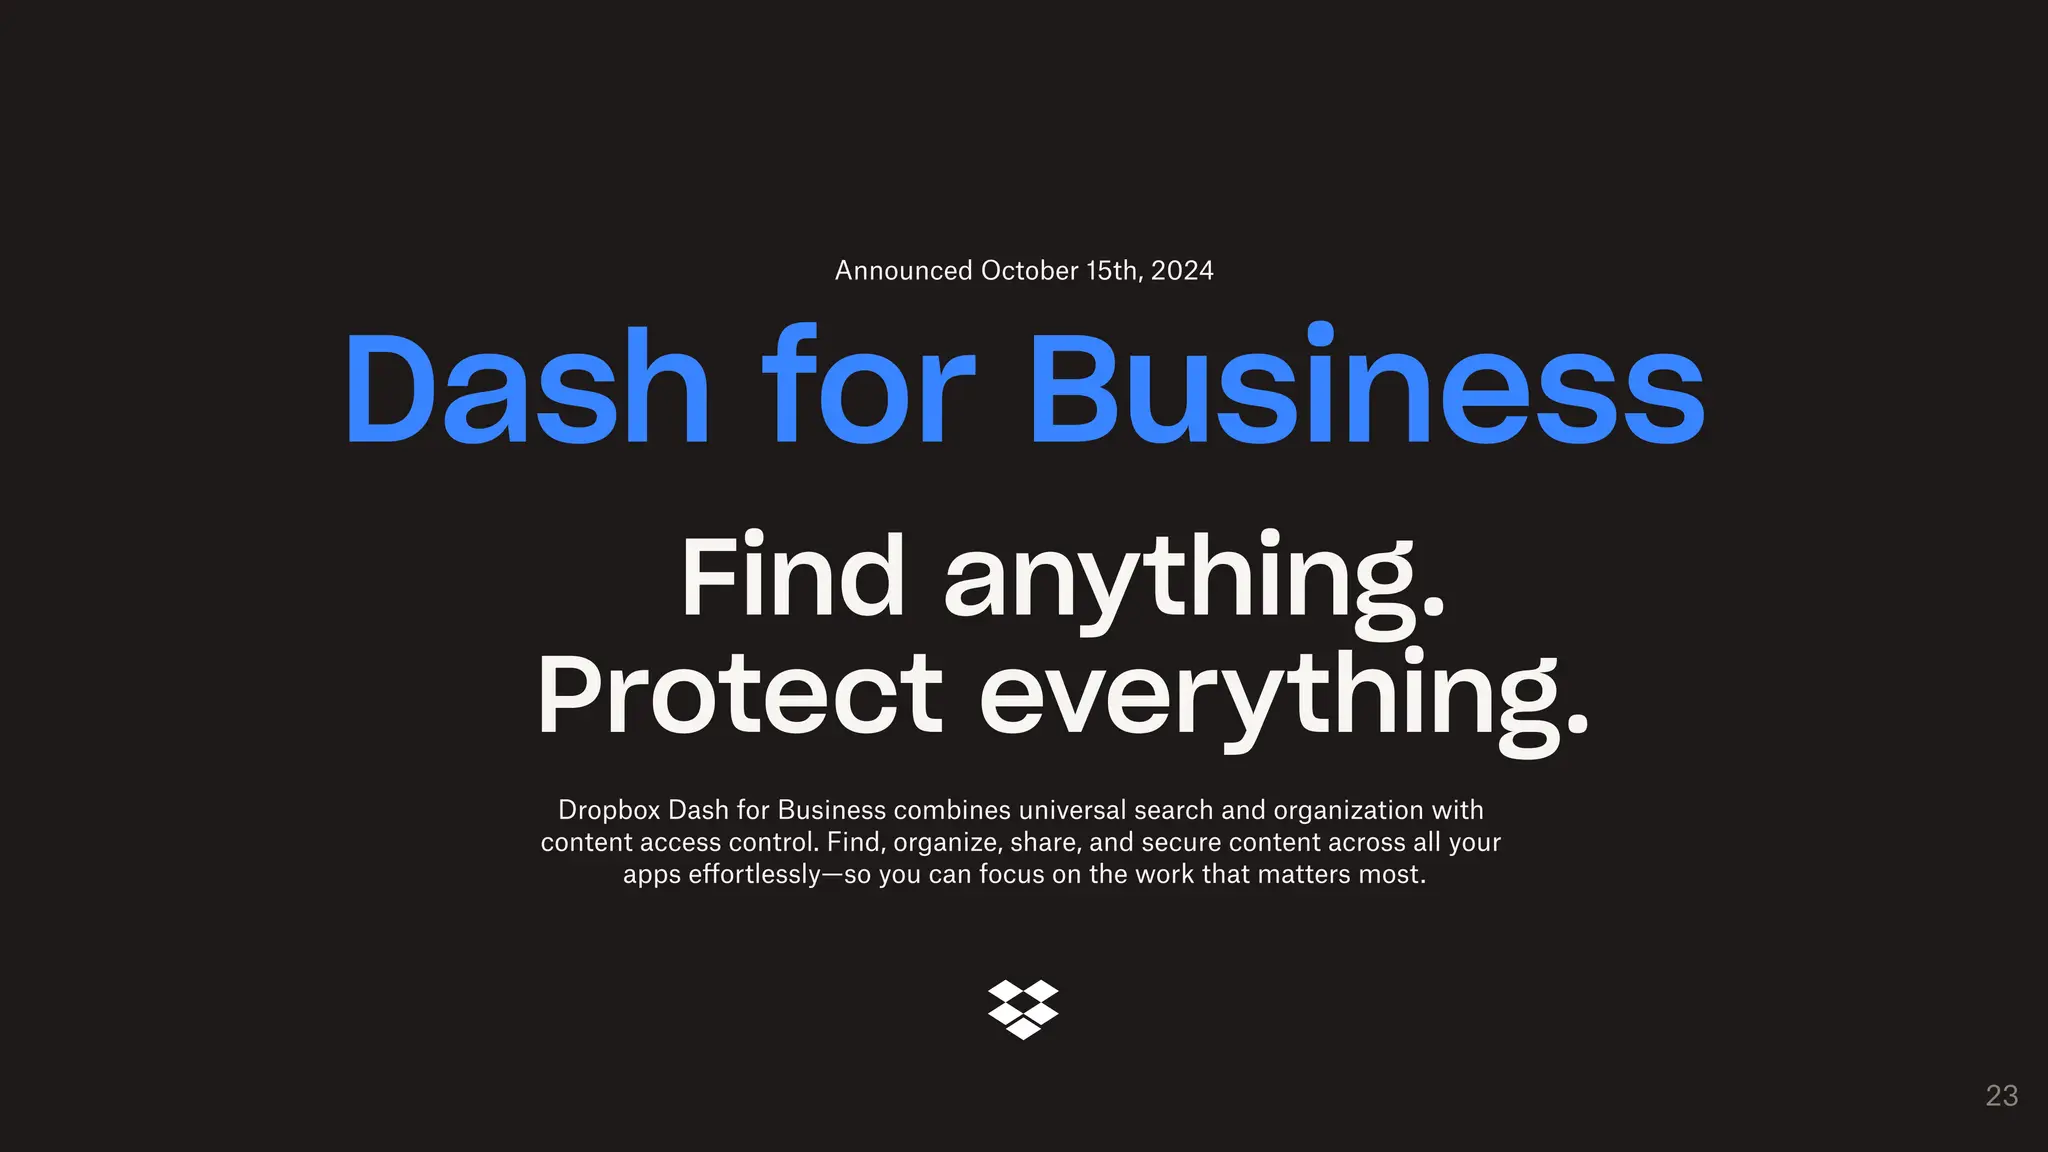
23
Find anything.
Protect everything.
DropboxDash for Business combines universal search and organization with
content access control. Find, organize, share, and secure content across all your
apps effortlessly—so you can focus on the work that matters most.
Dash for Business
Announced October 15th, 2024
24.
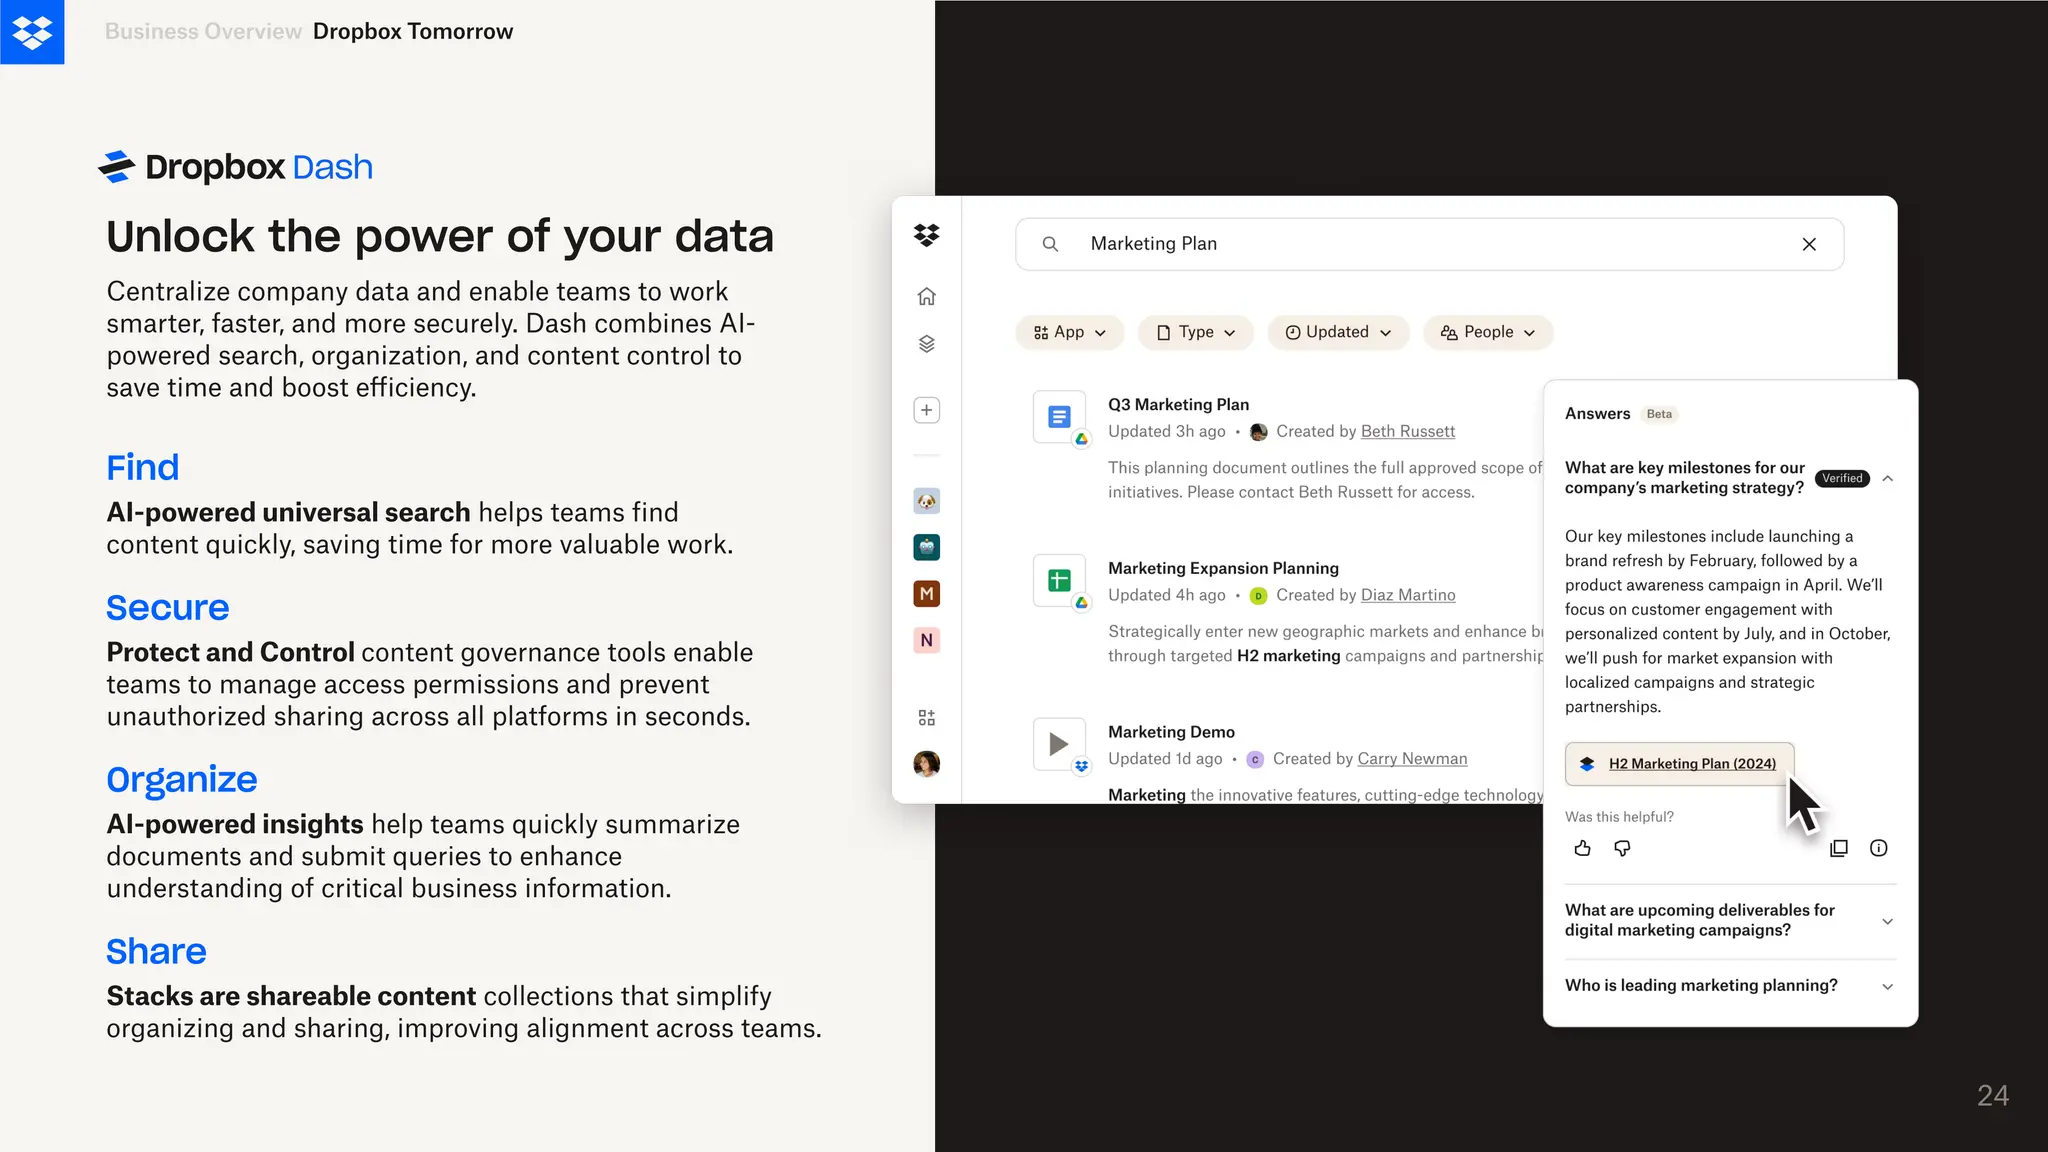
Centralize company dataand enable teams to work
smarter, faster, and more securely. Dash combines AI-
powered search, organization, and content control to
save time and boost efficiency.
Business Overview
24
Unlock the power of your data
Dropbox Tomorrow
Find
AI-powered universal search helps teams find
content quickly, saving time for more valuable work.
Share
Stacks are shareable content collections that simplify
organizing and sharing, improving alignment across teams.
Secure
Protect and Control content governance tools enable
teams to manage access permissions and prevent
unauthorized sharing across all platforms in seconds.
Organize
AI-powered insights help teams quickly summarize
documents and submit queries to enhance
understanding of critical business information.
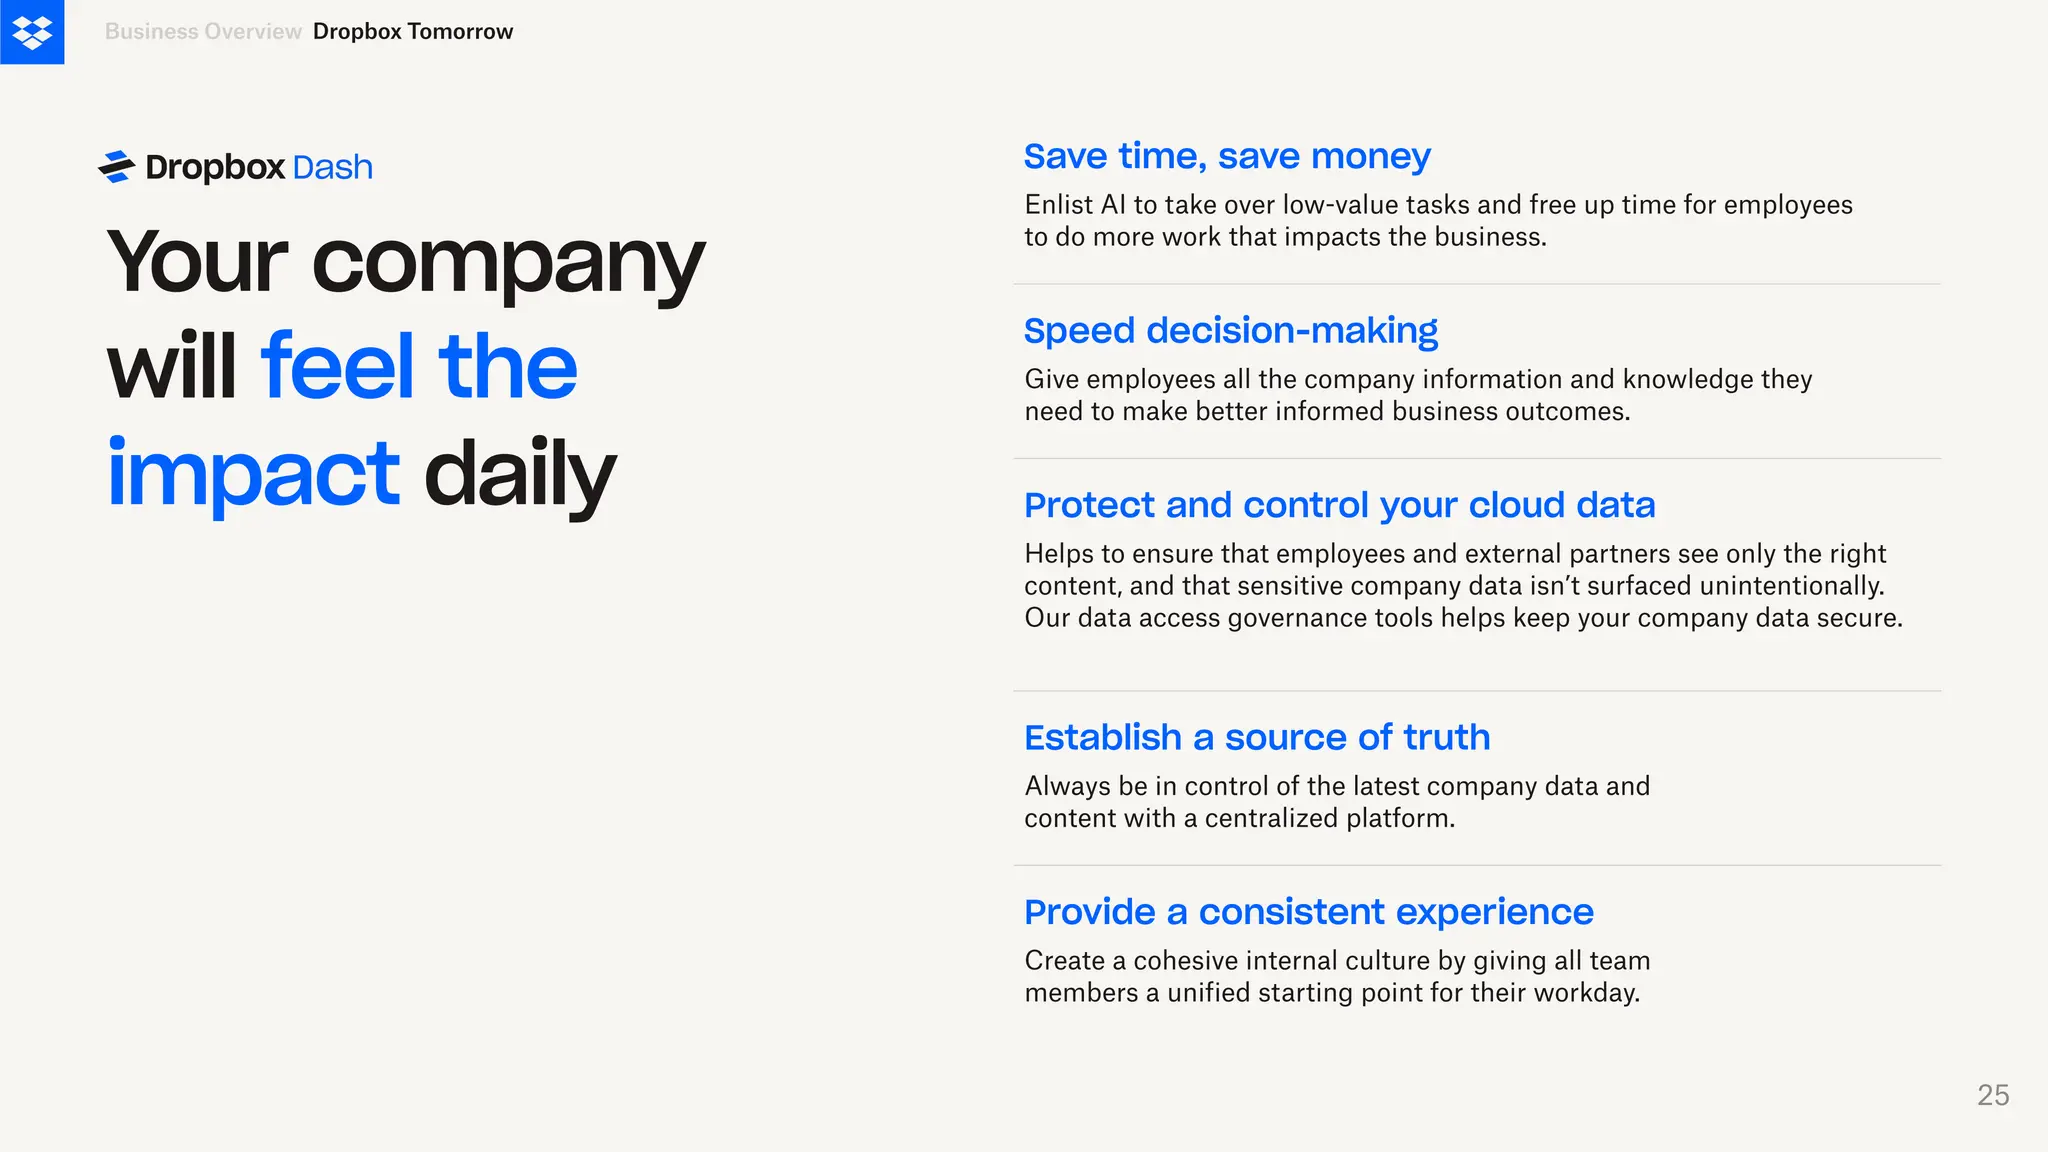
25.
Save time, savemoney
Enlist AI to take over low-value tasks and free up time for employees
to do more work that impacts the business.
Speed decision-making
Give employees all the company information and knowledge they
need to make better informed business outcomes.
Provide a consistent experience
Create a cohesive internal culture by giving all team
members a unified starting point for their workday.
Y
our company
will feel the
impact daily
Establish a source of truth
Always be in control of the latest company data and
content with a centralized platform.
Protect and control your cloud data
Helps to ensure that employees and external partners see only the right
content, and that sensitive company data isn’t surfaced unintentionally.
Our data access governance tools helps keep your company data secure.
Dropbox Tomorrow
Business Overview
25
26.
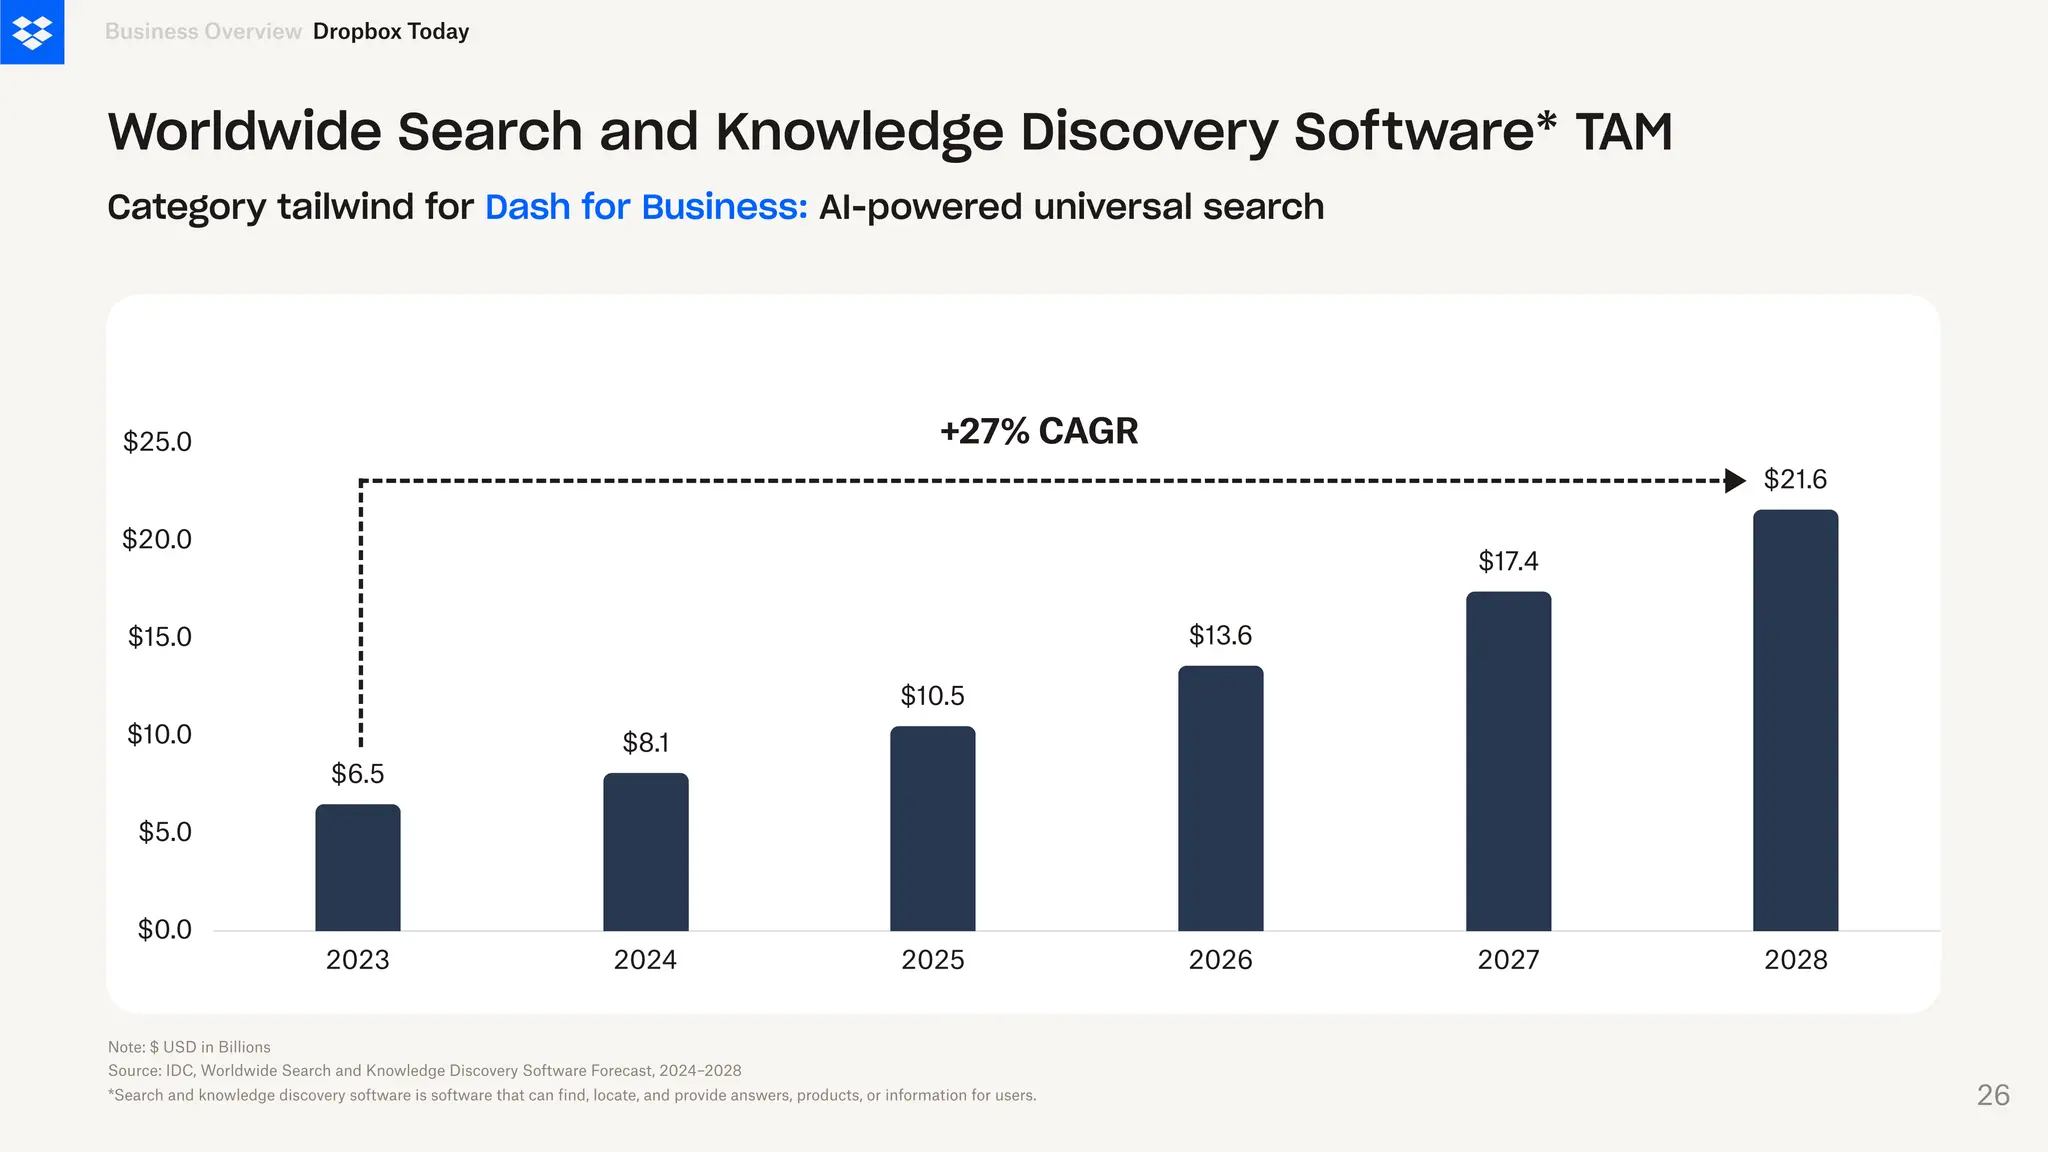
$0.0
$5.0
$10.0
$15.0
$20.0
$25.0
2023 2024 20252026 2027 2028
$6.5
$8.1
$10.5
$13.6
$17.4
$21.6
Business Overview Dropbox Today
Worldwide Search and Knowledge Discovery Software* TAM
Category tailwind for Dash for Business: AI-powered universal search
+27% CAGR
Note: $ USD in Billions
Source: IDC, Worldwide Search and Knowledge Discovery Software Forecast, 2024–2028
*Search and knowledge discovery software is software that can find, locate, and provide answers, products, or information for users. 26
27.
Media
Manufacturing
Professional
ser vices
T
echnology
AE
C
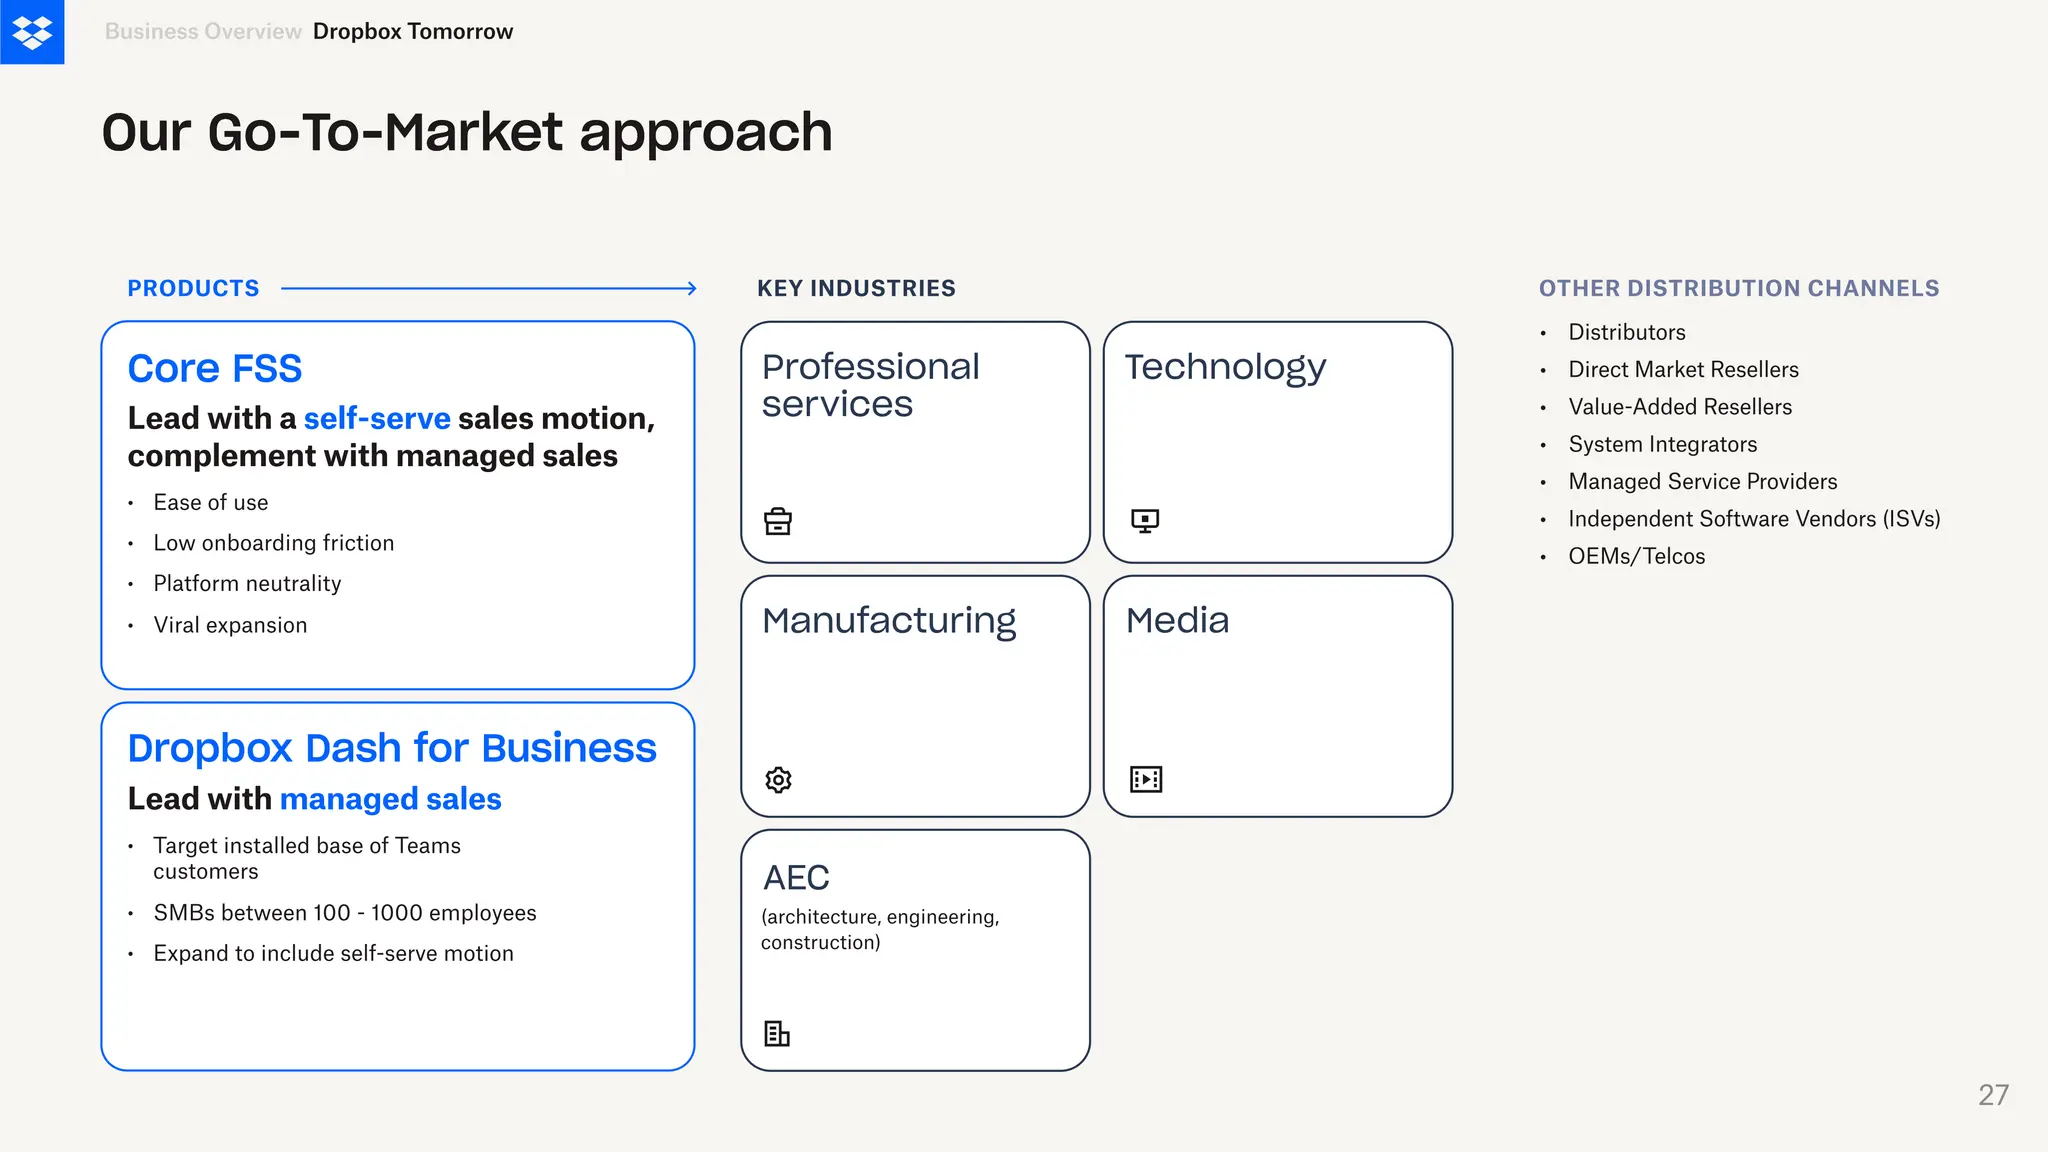
Our Go-To-Marketapproach
Our Go-To-Market approach
Core FSS
•
•
•
•
Lead with a self-serve sales motion,
complement with managed sales
Ease of use
Low onboarding friction
Platform neutrality
Viral expansion
Dropbox Dash for Business
•
•
•
Lead with managed sales
Target installed base of Teams
customers
SMBs between 100 - 1000 employees
Expand to include self-serve motion
PRODUCTS OTHER DISTRIBUTION CHANNELS
KEY INDUSTRIES
•
•
•
•
•
•
•
Distributors
Direct Market Resellers
Value-Added Resellers
System Integrators
Managed
Service Providers
Independent
Software Vendors (ISVs)
OEMs/Telcos
(architecture, engineering,
construction)
Dropbox Tomorrow
Business Overview
27
28.
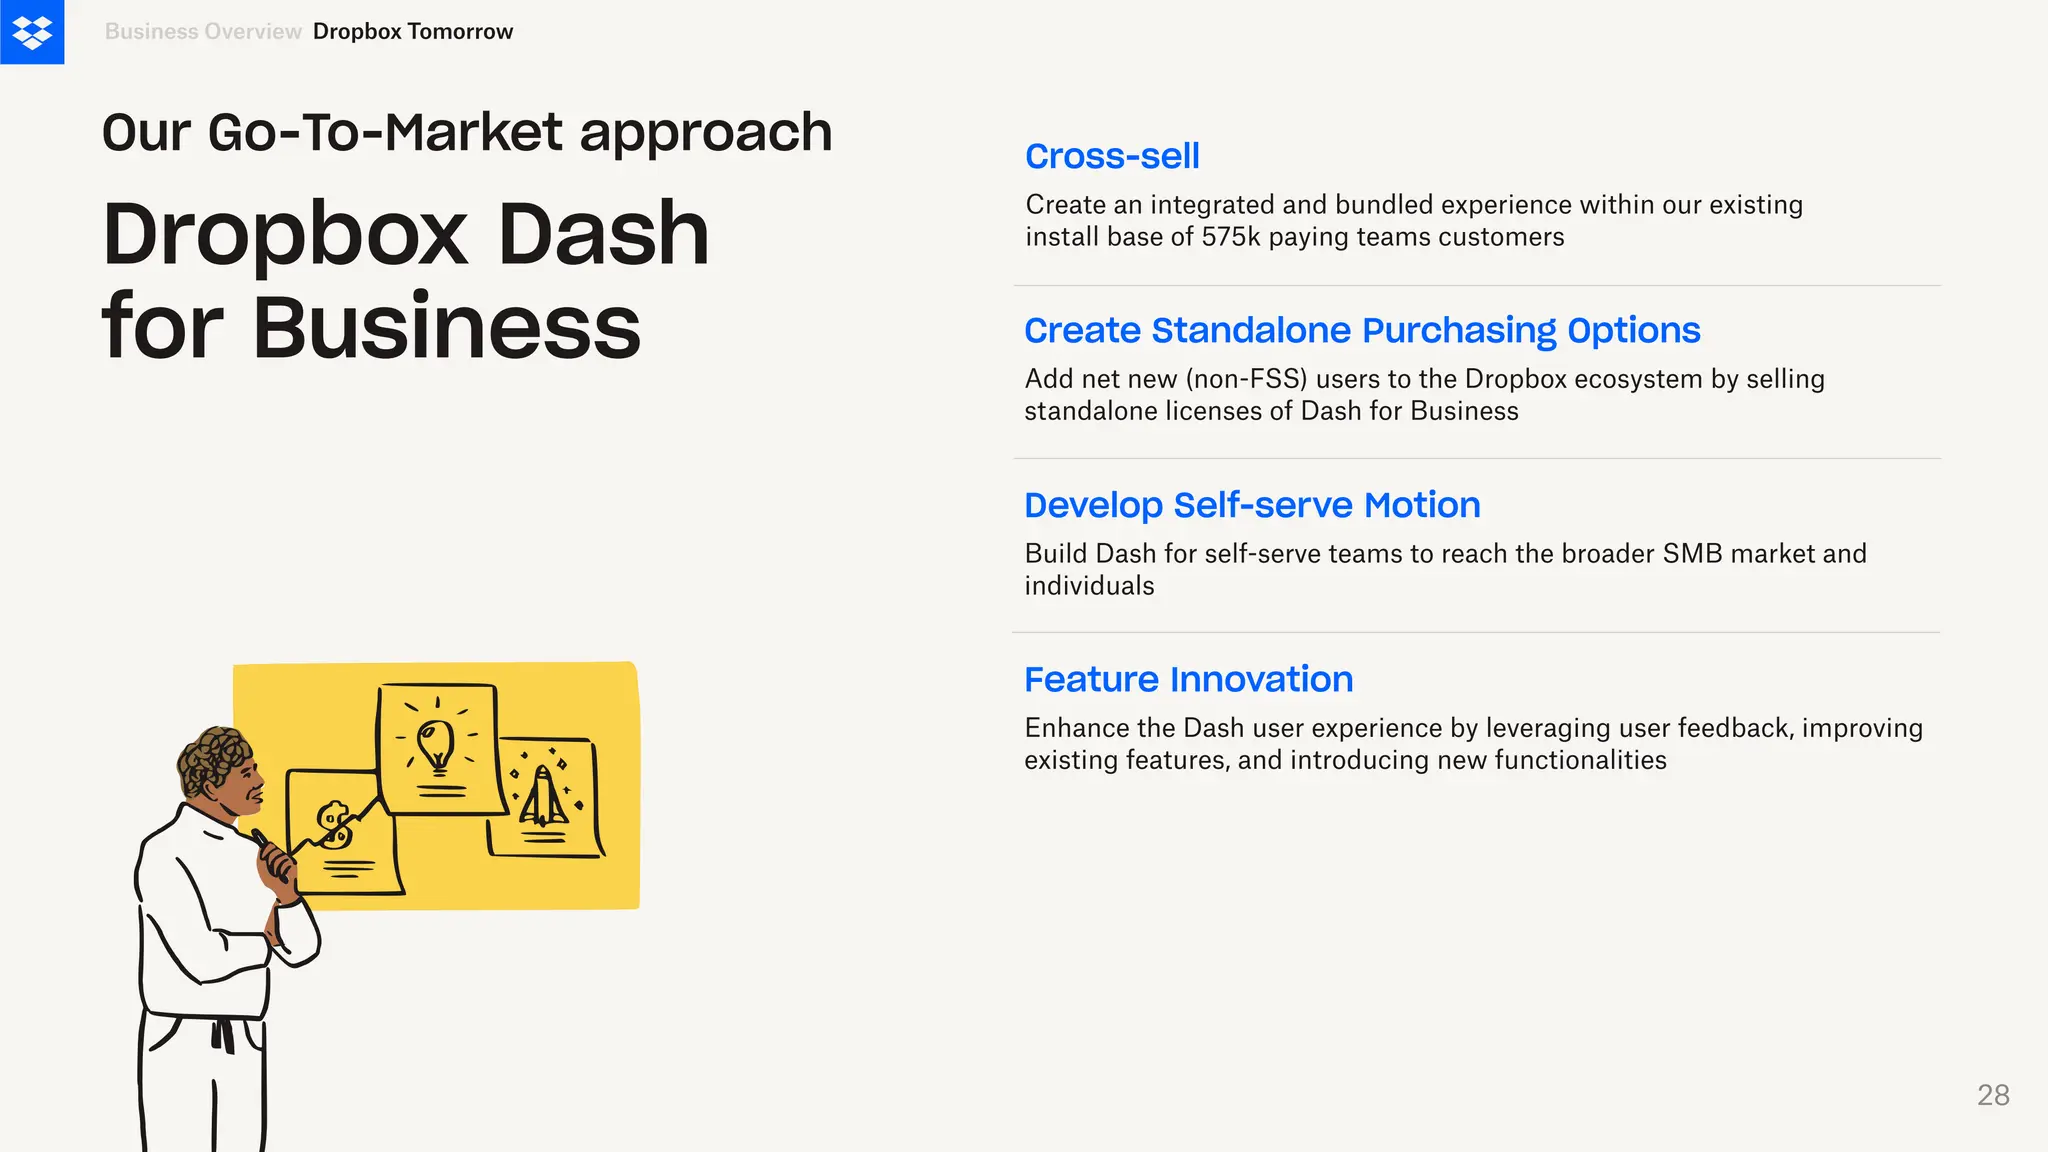
Dropbox Dash
for Business
Cross-sell
Createan integrated and bundled experience within our existing
install base of 575k paying teams customers
Develop Self-serve Motion
Build Dash for self-serve teams to reach the broader SMB market and
individuals
Create Standalone Purchasing Options
Add net new (non-FSS) users to the Dropbox ecosystem by selling
standalone licenses of Dash for Business
Feature Innovation
Enhance the Dash user experience by leveraging user feedback, improving
existing features, and introducing new functionalities
Dropbox Tomorrow
Business Overview
Our Go-To-Market approach
28
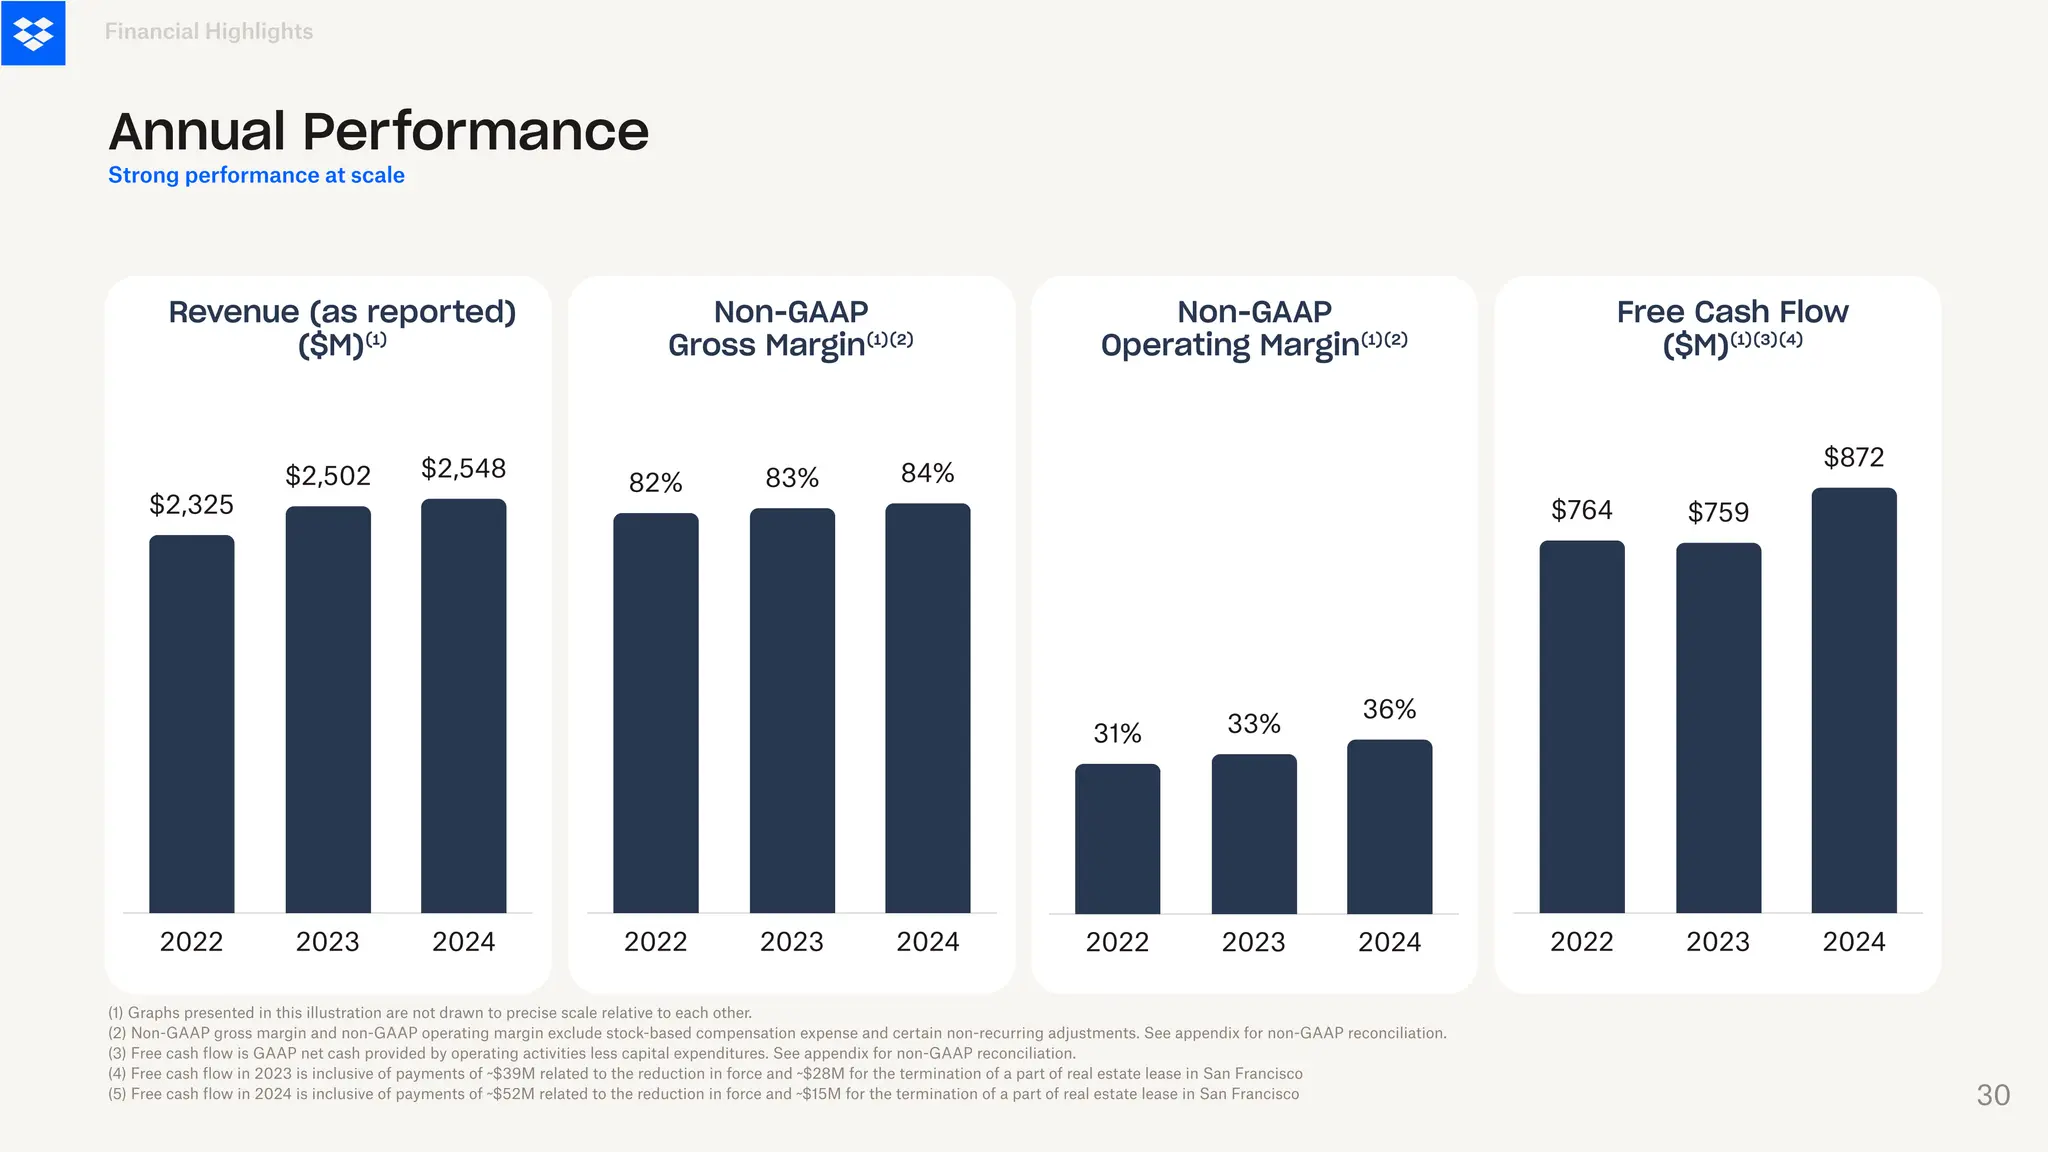
2022 2023 2024
$2,325
$2,502$2,548
Revenue (as reported)
($M)⁽¹⁾
2022 2023 2024
82% 83% 84%
Non-GAAP
Gross Margin⁽¹⁾⁽²⁾
2022 2023 2024
31% 33%
36%
Non-GAAP
Operating Margin⁽¹⁾⁽²⁾
2022 2023 2024
$764 $759
$872
Free Cash Flow
($M)⁽¹⁾⁽³⁾⁽⁴⁾
(1) Graphs presented in this illustration are not drawn to precise scale relative to each other.
(2) Non-GAAP gross margin and non-GAAP operating margin exclude stock-based compensation expense and certain non-recurring adjustments. See appendix for non-GAAP reconciliation.
(3) Free cash flow is GAAP net cash provided by operating activities less capital expenditures. See appendix for non-GAAP reconciliation.
(4) Free cash flow in 2023 is inclusive of payments of ~$39M related to the reduction in force and ~$28M for the termination of a part of real estate lease in San Francisco
(5) Free cash flow in 2024 is inclusive of payments of ~$52M related to the reduction in force and ~$15M for the termination of a part of real estate lease in San Francisco
Financial Highlights
Annual Performance
Strong performance at scale
30
31.
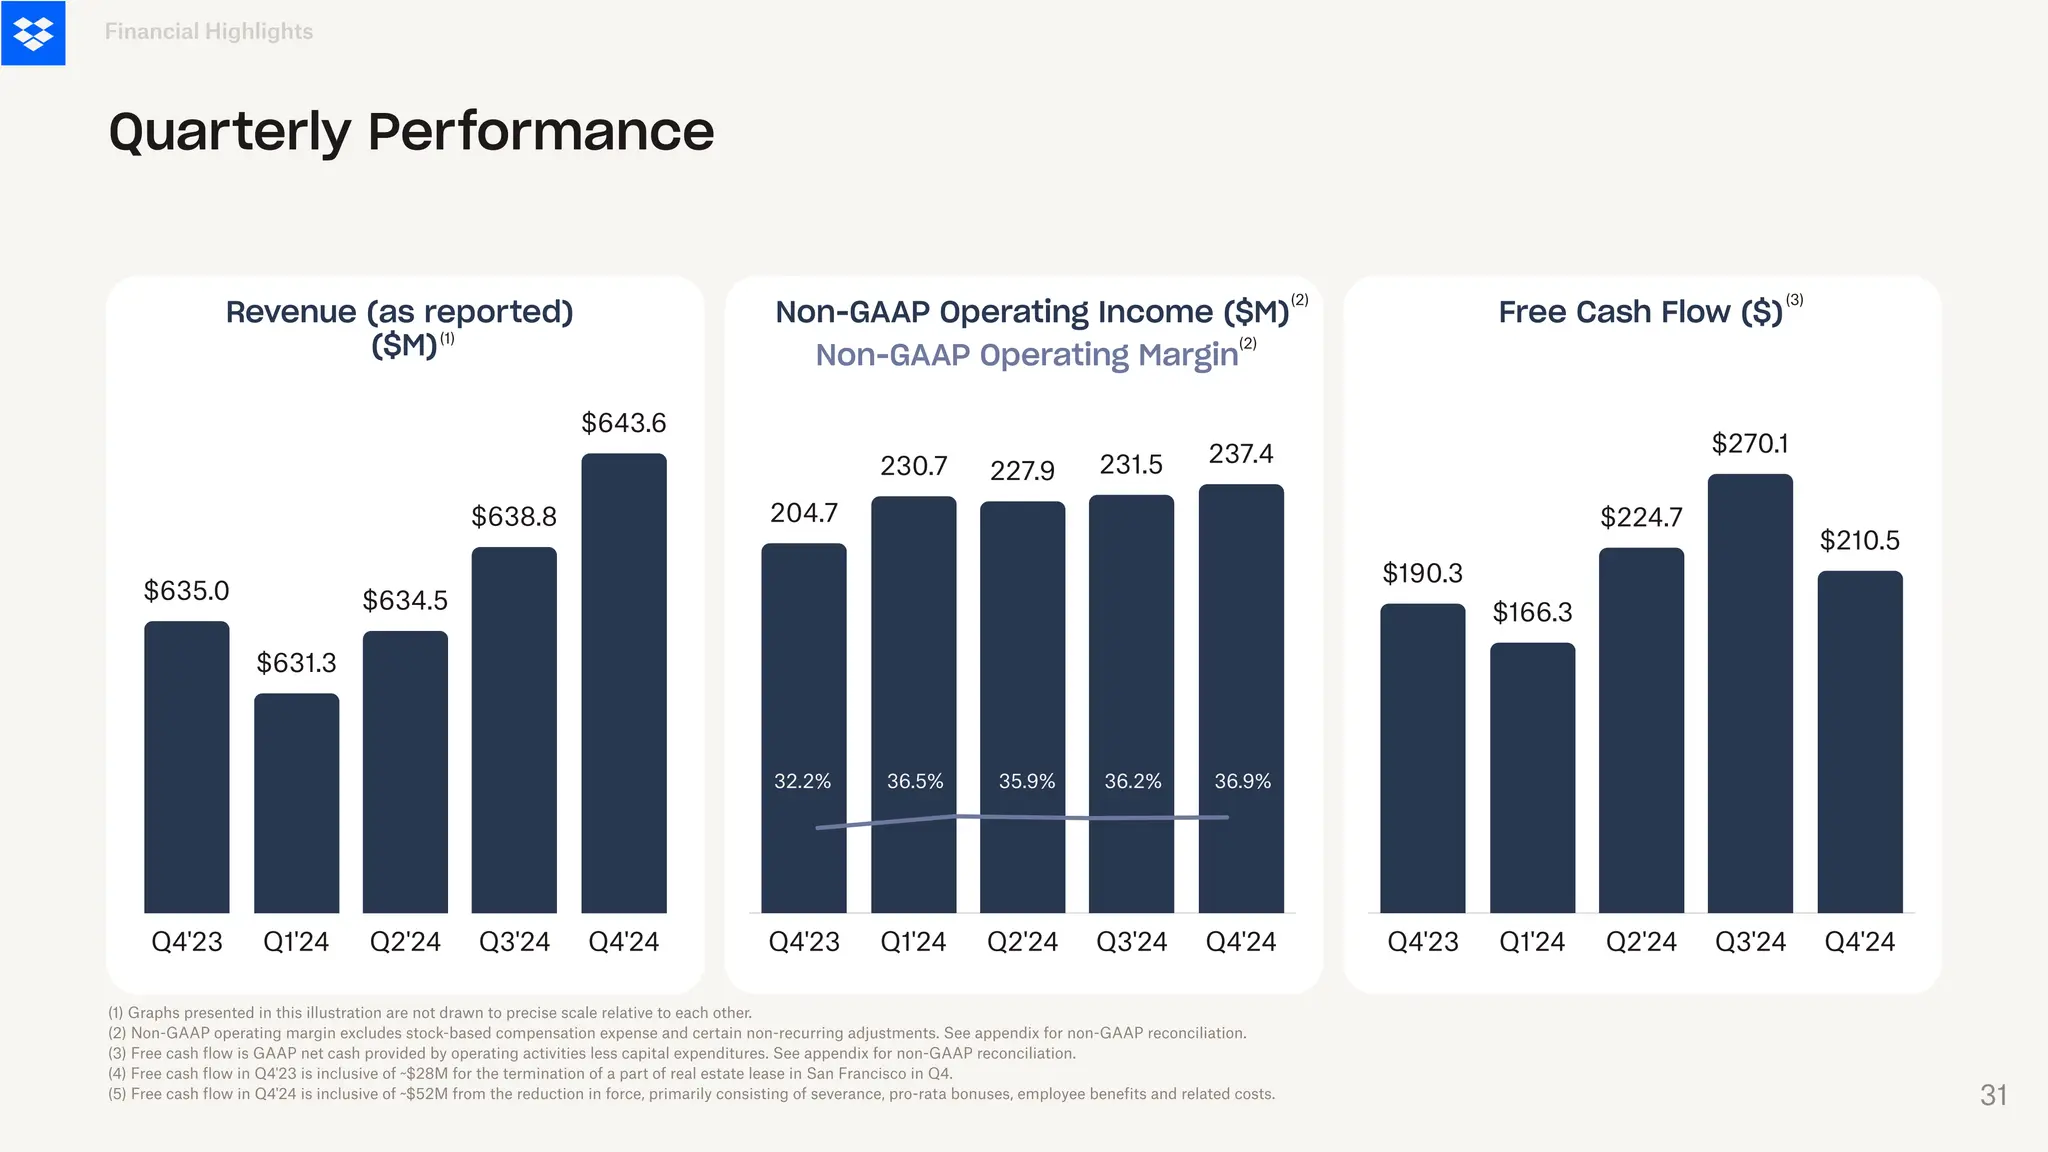
Q4'23 Q1'24 Q2'24Q3'24 Q4'24
$190.3
$166.3
$224.7
$270.1
$210.5
Free Cash Flow ($)
Q4'23 Q1'24 Q2'24 Q3'24 Q4'24
$635.0
$631.3
$634.5
$638.8
$643.6
Revenue (as reported)
($M)
Non-GAAP Operating Income ($M)
Financial Highlights
Quarterly Performance
Non-GAAP Operating Margin
Q4'23 Q1'24 Q2'24 Q3'24 Q4'24
204.7
230.7 227.9 231.5 237.4
(1) Graphs presented in this illustration are not drawn to precise scale relative to each other.
(2) Non-GAAP operating margin excludes stock-based compensation expense and certain non-recurring adjustments. See appendix for non-GAAP reconciliation.
(3) Free cash flow is GAAP net cash provided by operating activities less capital expenditures. See appendix for non-GAAP reconciliation.
(4) Free cash flow in Q4'23 is inclusive of ~$28M for the termination of a part of real estate lease in San Francisco in Q4.
(5) Free cash flow in Q4'24 is inclusive of ~$52M from the reduction in force, primarily consisting of severance, pro-rata bonuses, employee benefits and related costs.
32.2% 36.9%
36.5% 35.9% 36.2%
(2)
(2)
(3)
(1)
31
32.
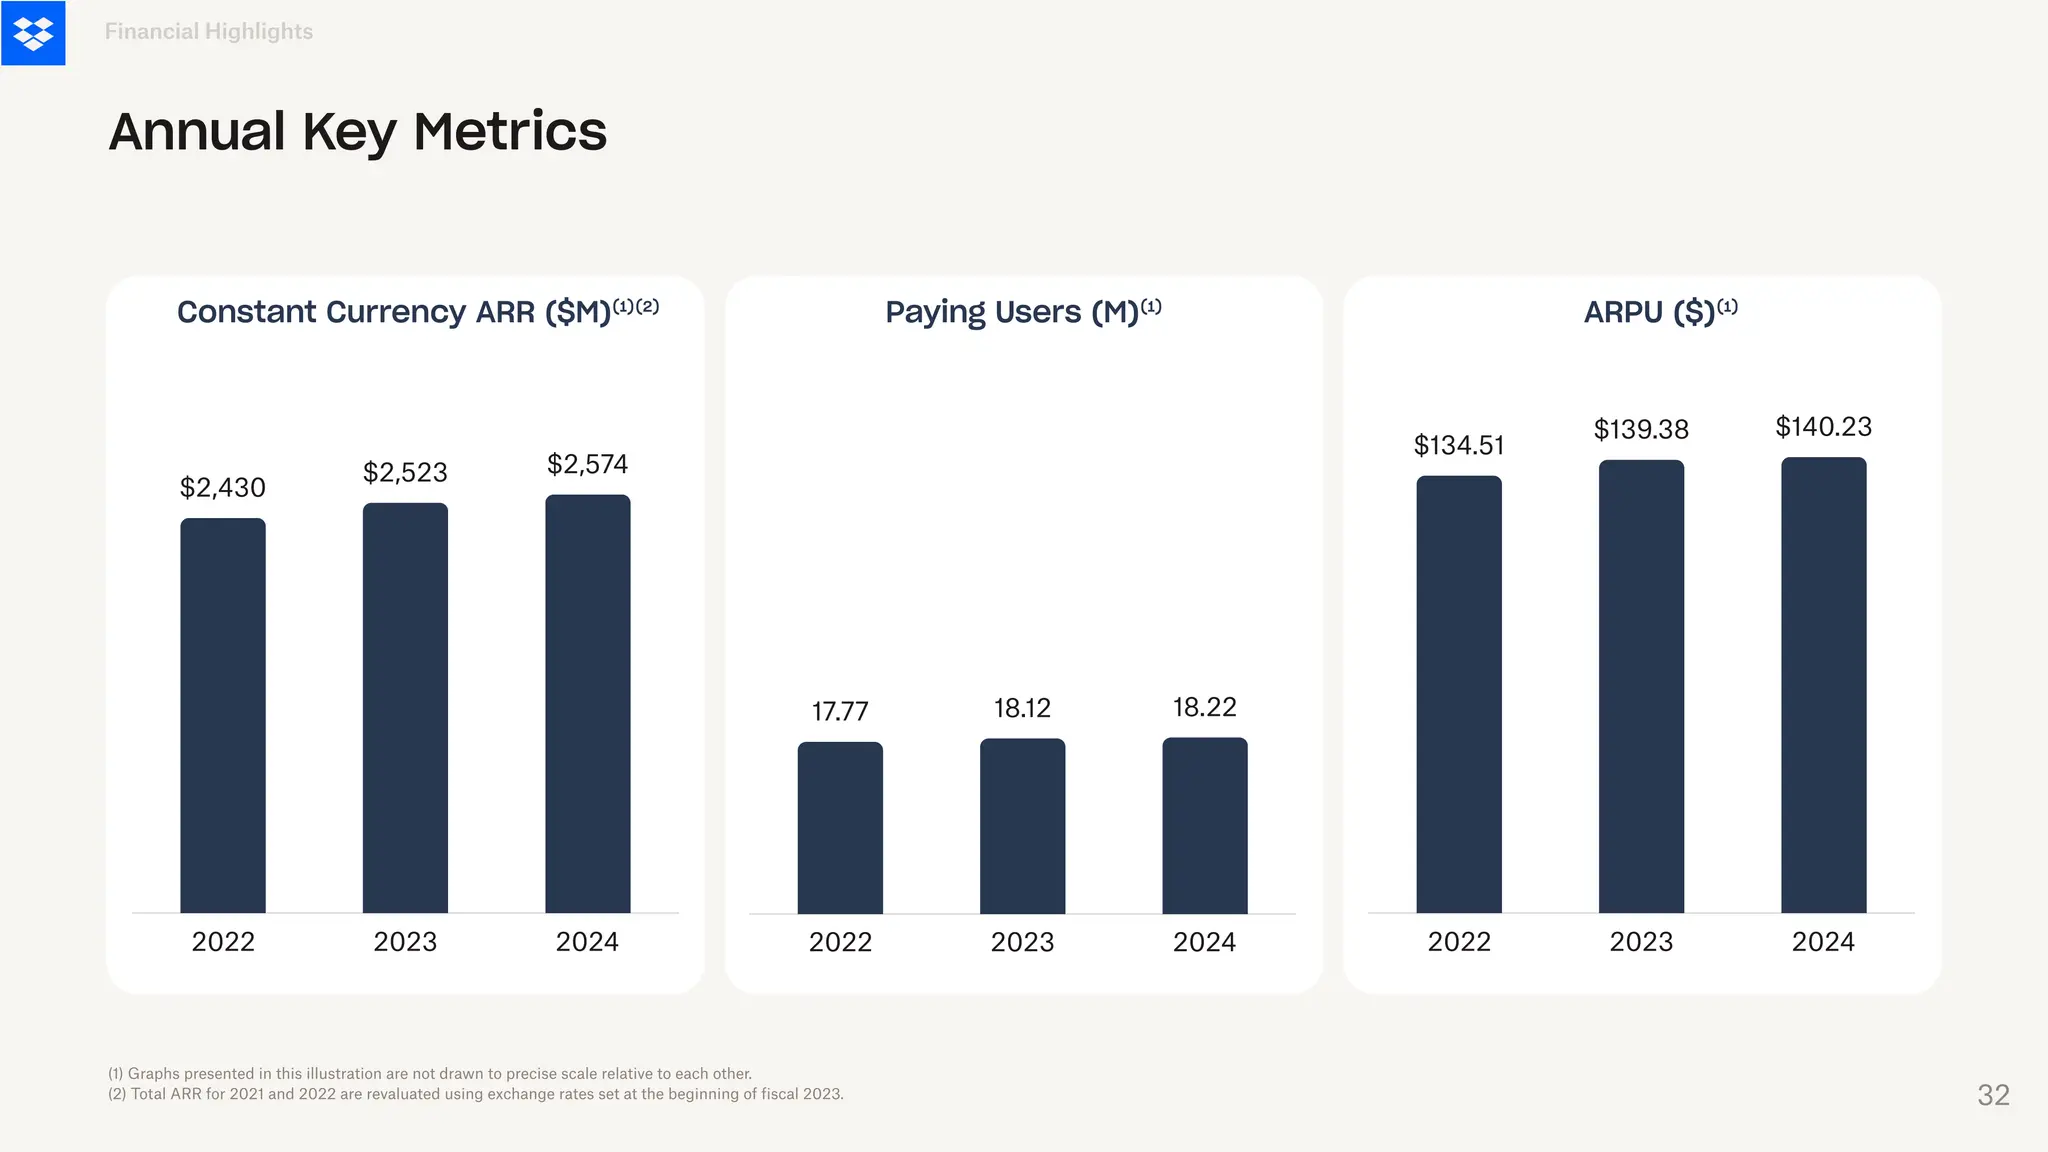
(1) Graphs presentedin this illustration are not drawn to precise scale relative to each other.
(2) Total ARR for 2021 and 2022 are revaluated using exchange rates set at the beginning of fiscal 2023.
2022 2023 2024
$134.51
$139.38 $140.23
ARPU ($)⁽¹⁾
2022 2023 2024
$2,430
$2,523 $2,574
Constant Currency ARR ($M)⁽¹⁾⁽²⁾
2022 2023 2024
17.77 18.12 18.22
Paying Users (M)⁽¹⁾
Financial Highlights
Annual Key Metrics
32
33.
Q4'23 Q1'24 Q2'24Q3'24 Q4'24
$138.83
$139.59
$139.93
$139.05
$140.06
Q4'23 Q1'24 Q2'24 Q3'24 Q4'24
$2,540
$2,556
$2,573
$2,579 $2,574
Financial Highlights
Quarterly Key Metrics
Q4'23 Q1'24 Q2'24 Q3'24 Q4'24
18.12
18.16
18.22 18.24 18.22
ARPU ($)⁽¹⁾
Constant Currency ARR ($M)⁽¹⁾⁽²⁾ Paying Users (M)⁽¹⁾
(1) Graphs presented in this illustration are not drawn to precise scale relative to each other.
(2) Total ARR for 2023 are revaluated using exchange rates set at the beginning of fiscal 2024. 33
34.
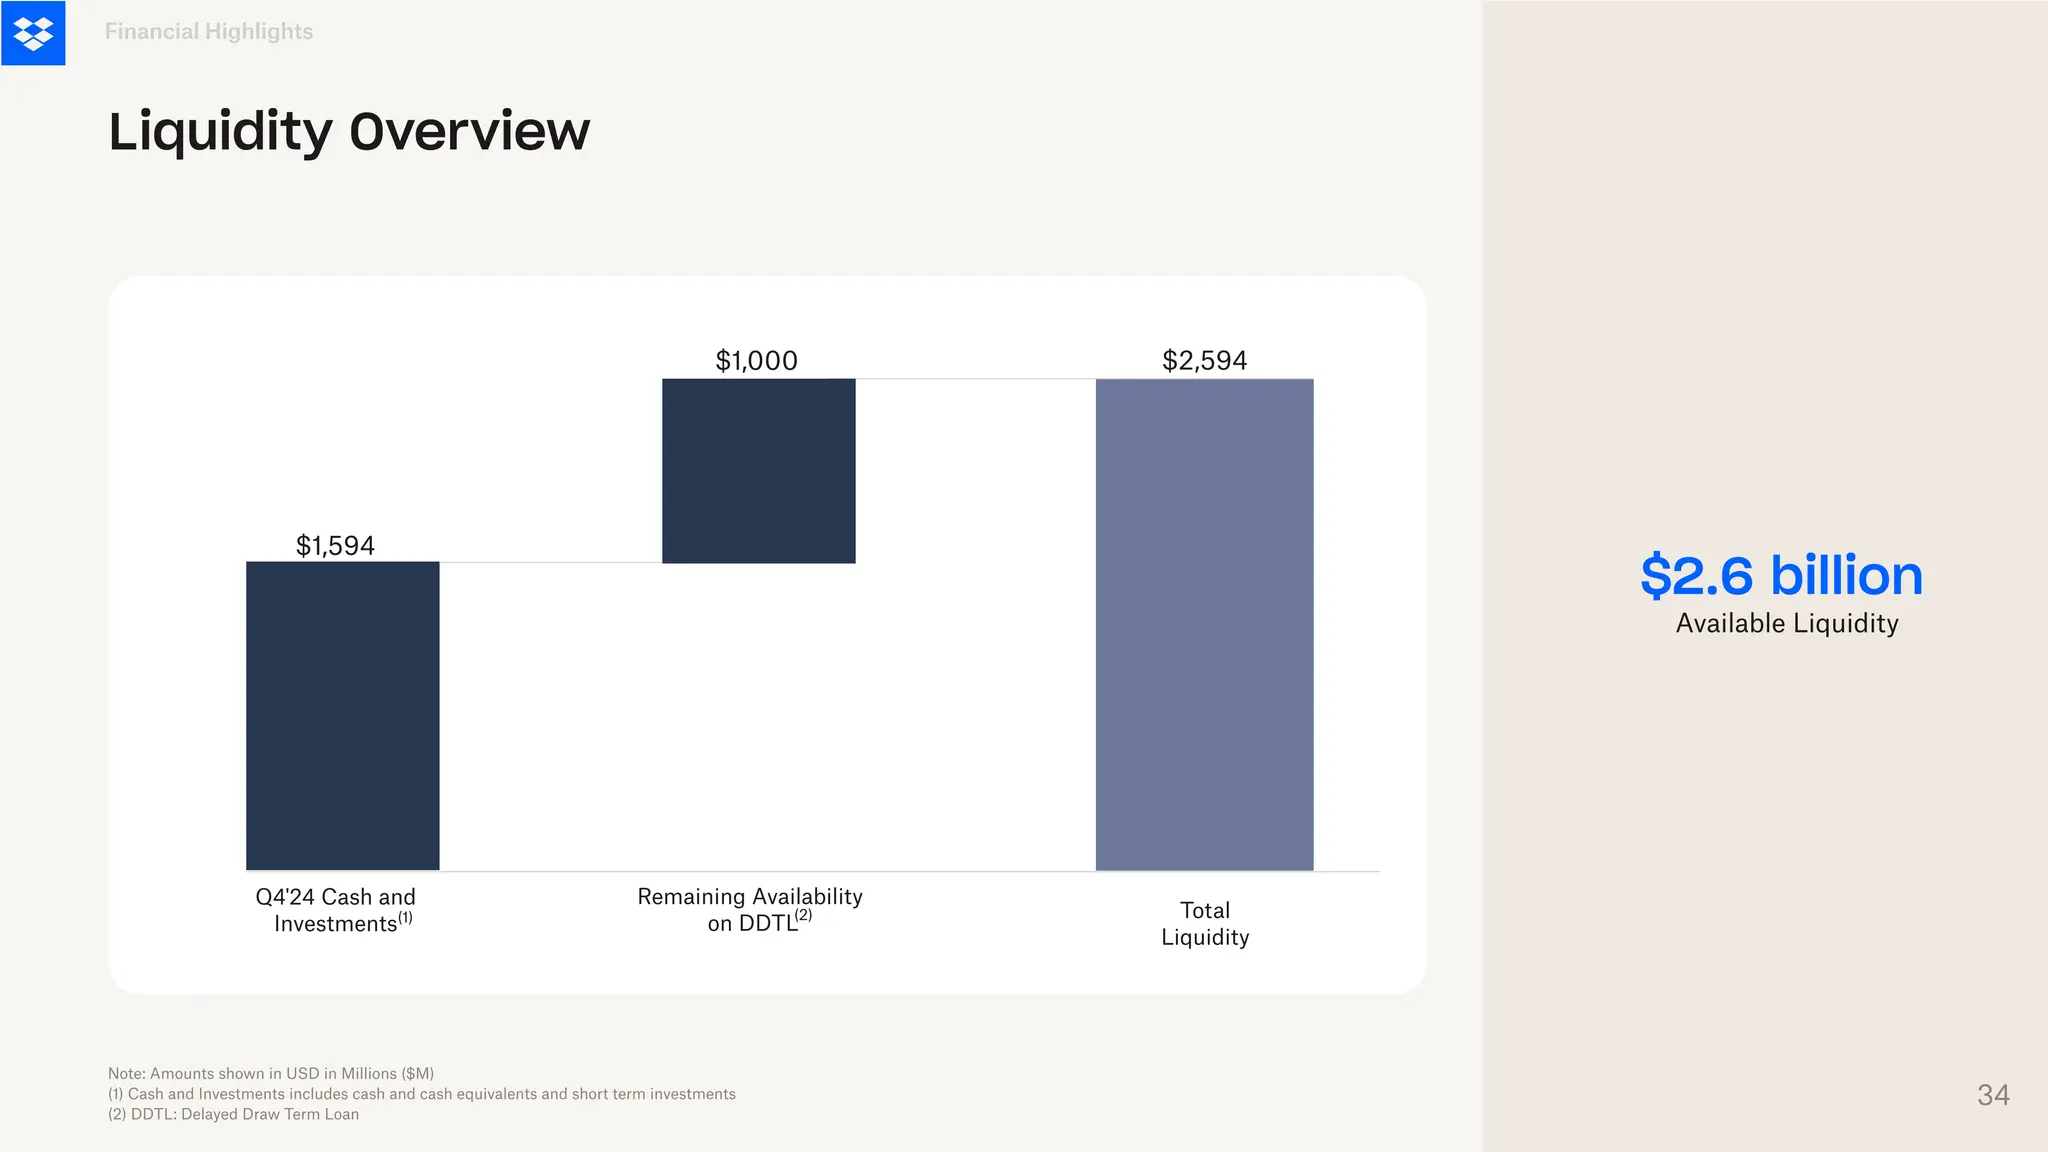
Financial Highlights
Liquidity Overview
Note:Amounts shown in USD in Millions ($M)
(1) Cash and Investments includes cash and cash equivalents and short term investments
(2) DDTL: Delayed Draw Term Loan
Q4'24 Cash and
Investments
Total
Liquidity
$1,594
$2,594
(1)
$1,000
Remaining Availability
on DDTL
$2.6 billion
Available Liquidity
(2)
34
35.
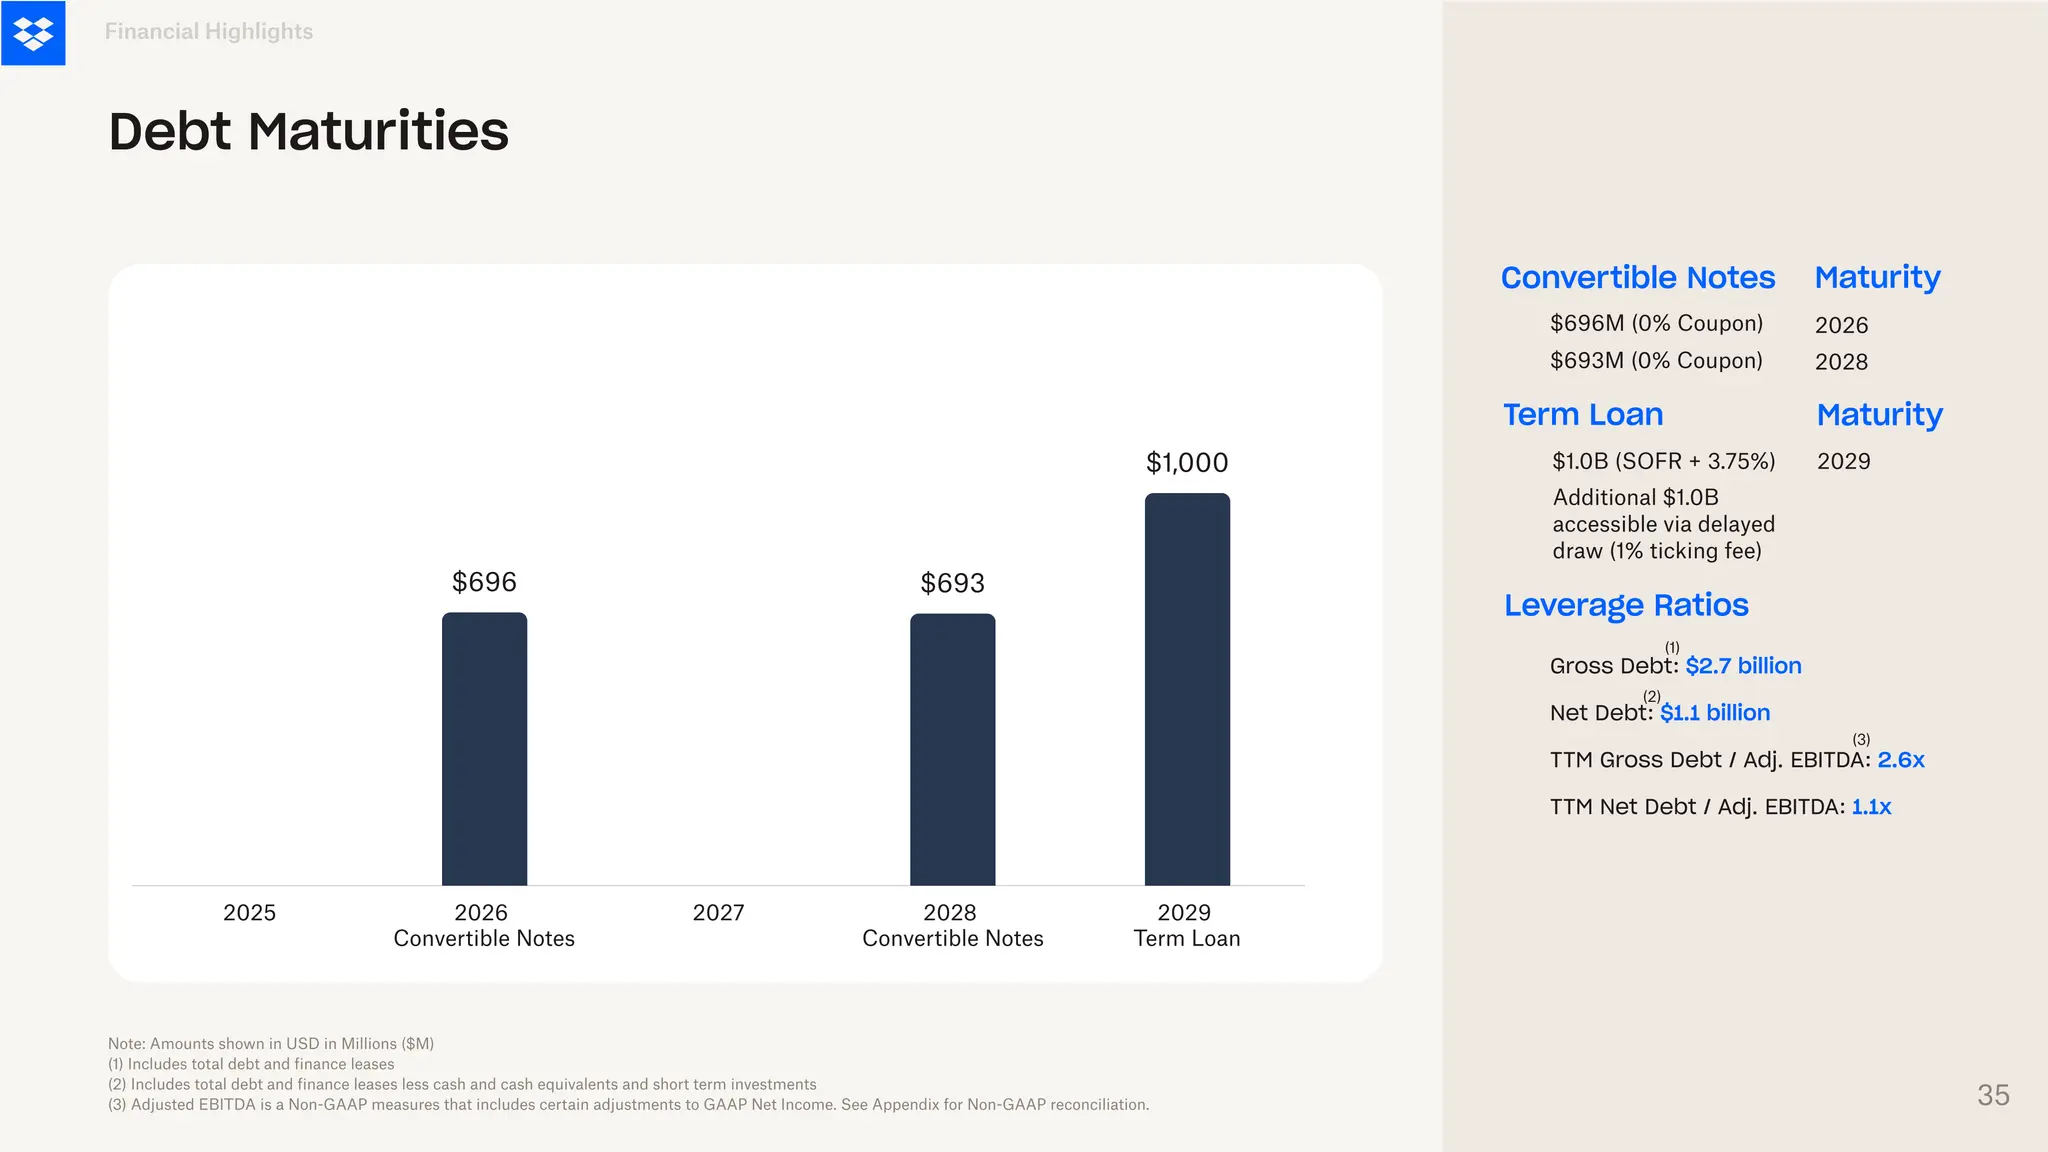
Gross Debt :$2.7 billion
Net Debt : $1.1 billion
T TM Gross Debt / Adj. EBITD
A : 2.6x
T TM Net Debt / Adj. EBITD
A : 1.1x
Term Loan
Financial Highlights
Debt Maturities
$1.0B (SOFR + 3.75%)
$696M (0% Coupon)
$693M (0% Coupon)
2025 2026
Convertible Notes
2027 2028
Convertible Notes
2029
Term Loan
$696 $693
$1,000
Note: Amounts shown in USD in Millions ($M)
(1) Includes total debt and finance leases
(2) Includes total debt and finance leases less cash and cash equivalents and short term investments
(3) Adjusted EBITDA is a Non-GAAP measures that includes certain adjustments to GAAP Net Income. See Appendix for Non-GAAP reconciliation.
Maturity
2029
Additional $1.0B
accessible via delayed
draw (1% ticking fee)
Convertible Notes Maturity
2026
2028
(1)
(2)
Leverage Ratios
(3)
35
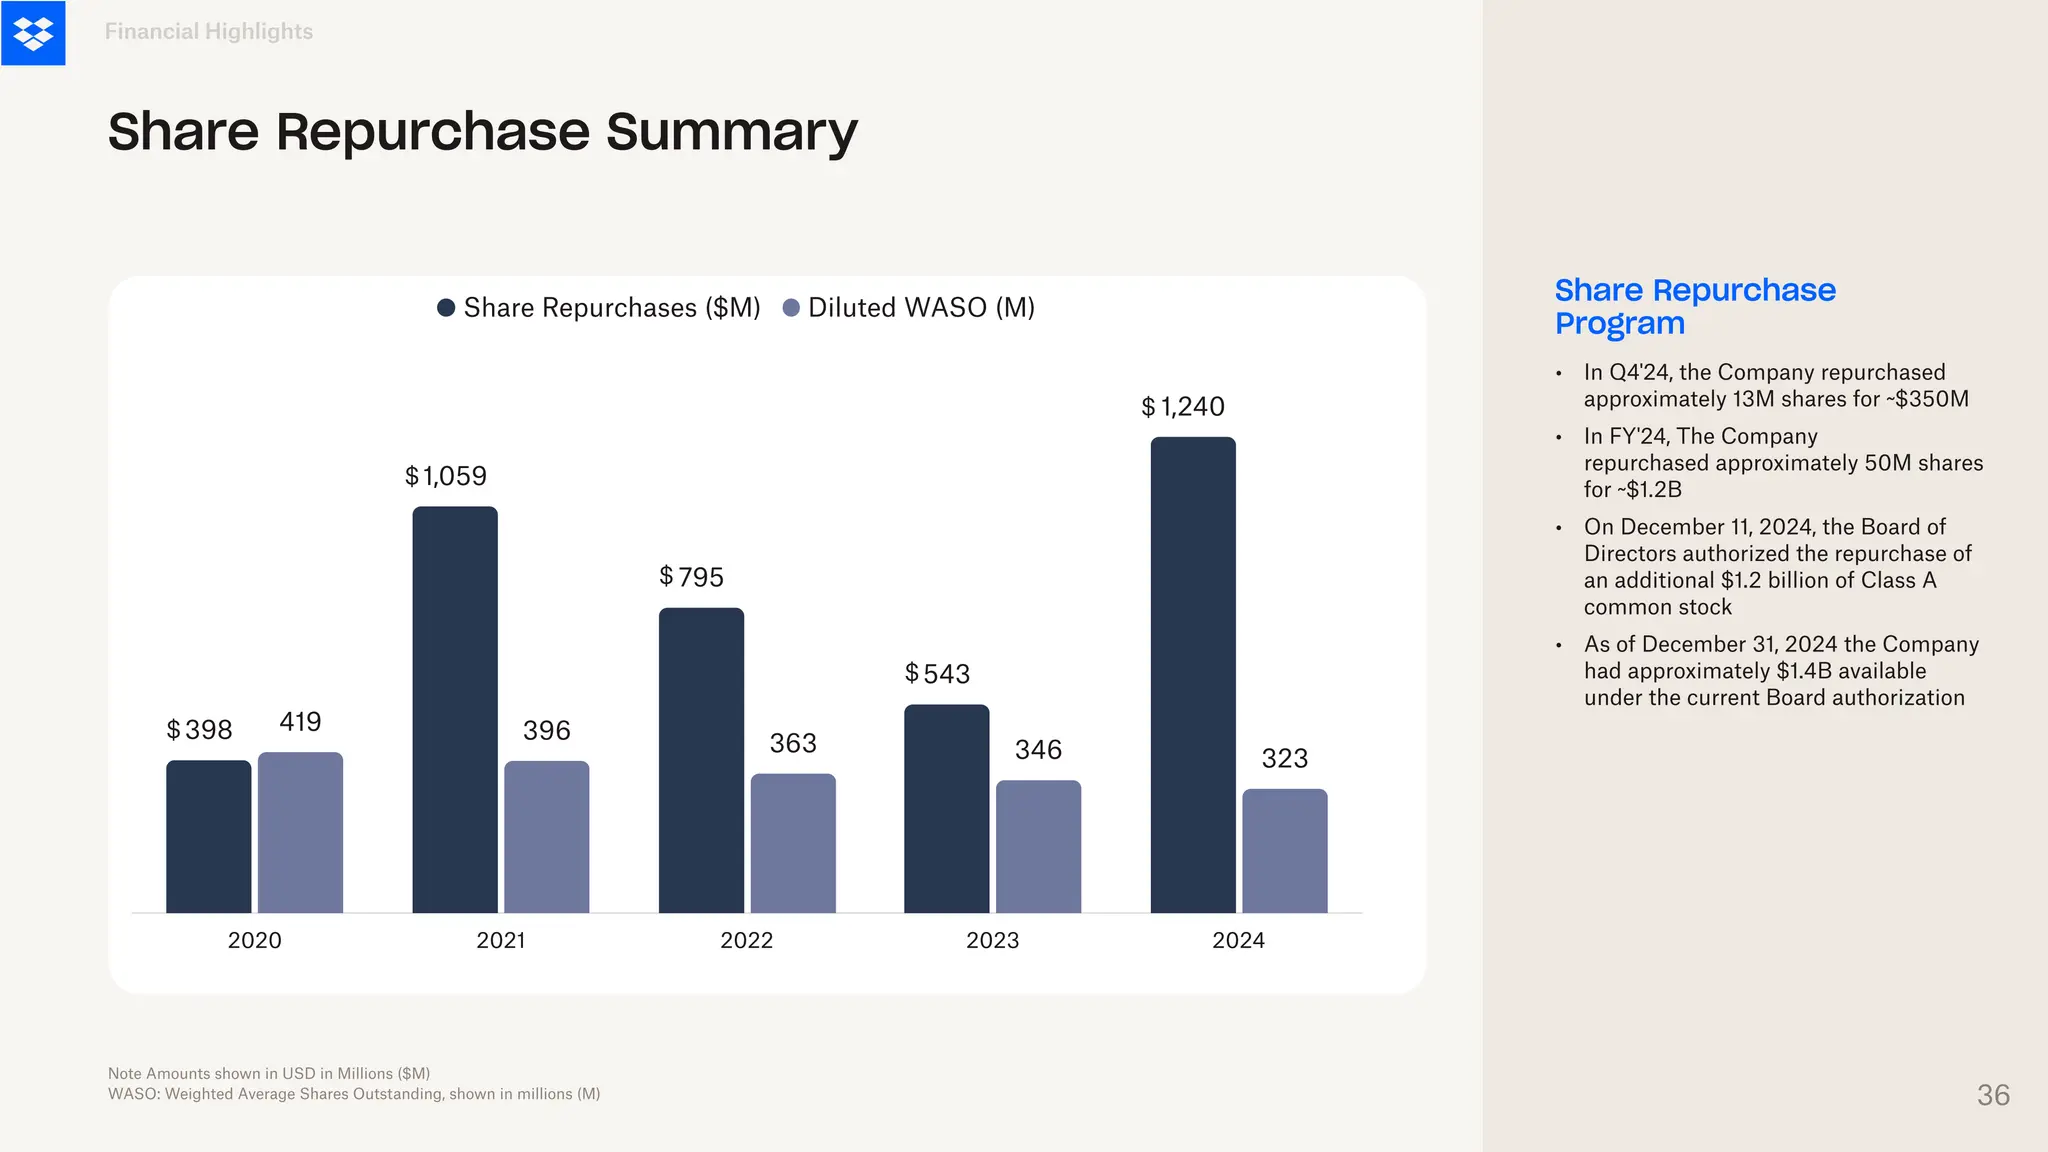
36.
Share Repurchase
Program
Financial Highlights
ShareRepurchase Summary
2020 2021 2022 2023 2024
398
1,059
795
543
1,240
419 396 363 346 323
Share Repurchases ($M) Diluted WASO (M)
•
•
•
•
In Q4'24, the Company repurchased
approximately 13M shares for ~$350M
In FY'24, The Company
repurchased approximately 50M shares
for ~$1.2B
On December 11, 2024, the Board of
Directors authorized the repurchase of
an additional $1.2 billion of Class A
common stock
As of December 31, 2024 the Company
had approximately $1.4B available
under the current Board authorization
Note Amounts shown in USD in Millions ($M)
WASO: Weighted Average Shares Outstanding, shown in millions (M)
$
$
$
$
$
36
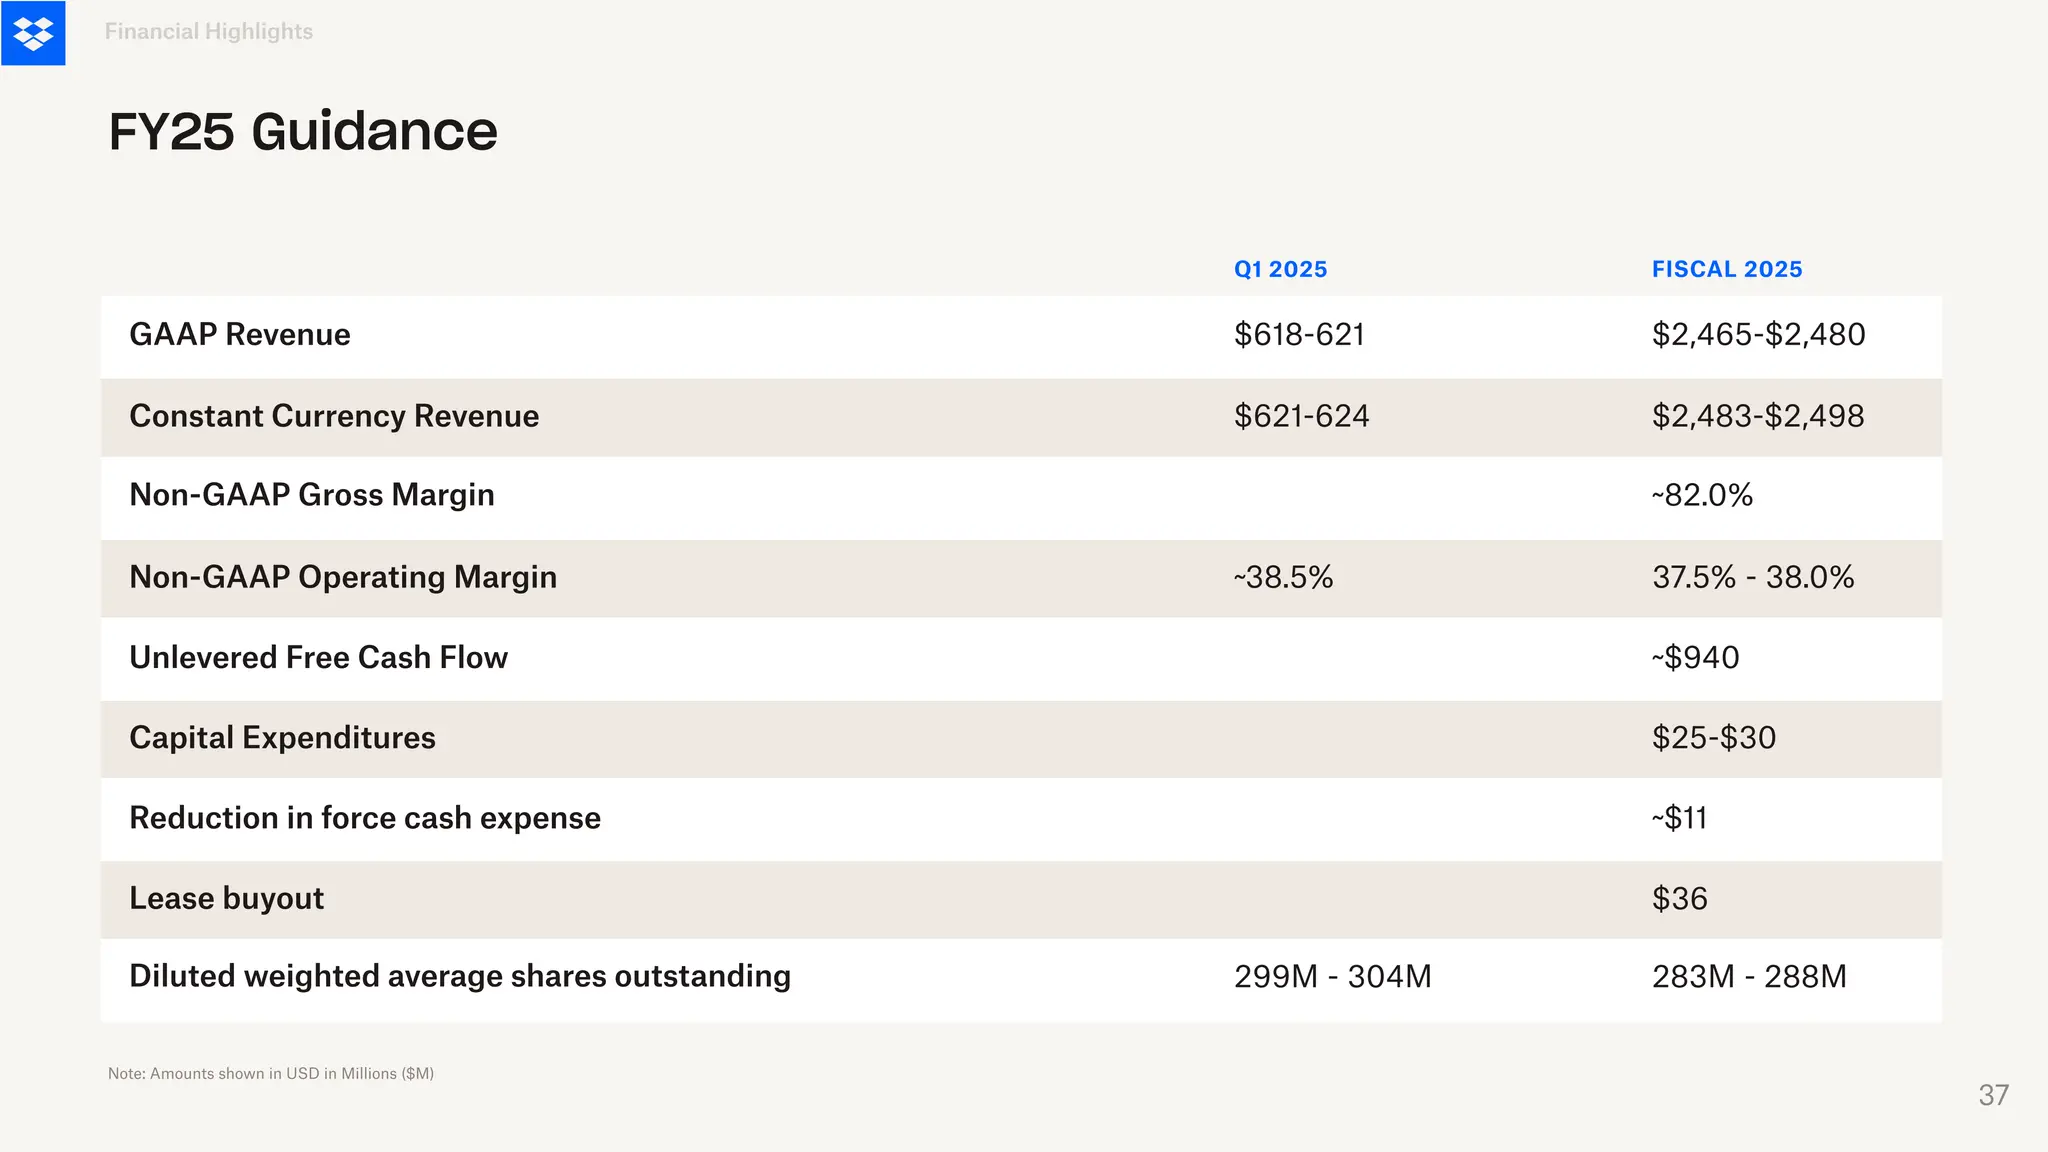
37.
GAAP Revenue
Constant CurrencyRevenue
Non-GAAP Gross Margin
Non-GAAP Operating Margin
Unlevered Free Cash Flow
Capital Expenditures
Reduction in force cash expense
Lease buyout
Diluted weighted average shares outstanding
$618-621
$621-624
~38.5%
299M - 304M
$2,465-$2,480
$2,483-$2,498
37.5% - 38.0%
283M - 288M
$36
~$11
$25-$30
~$940
~82.0%
Q1 2025 FISCAL 2025
Financial Highlights
FY25 Guidance
Note: Amounts shown in USD in Millions ($M)
37
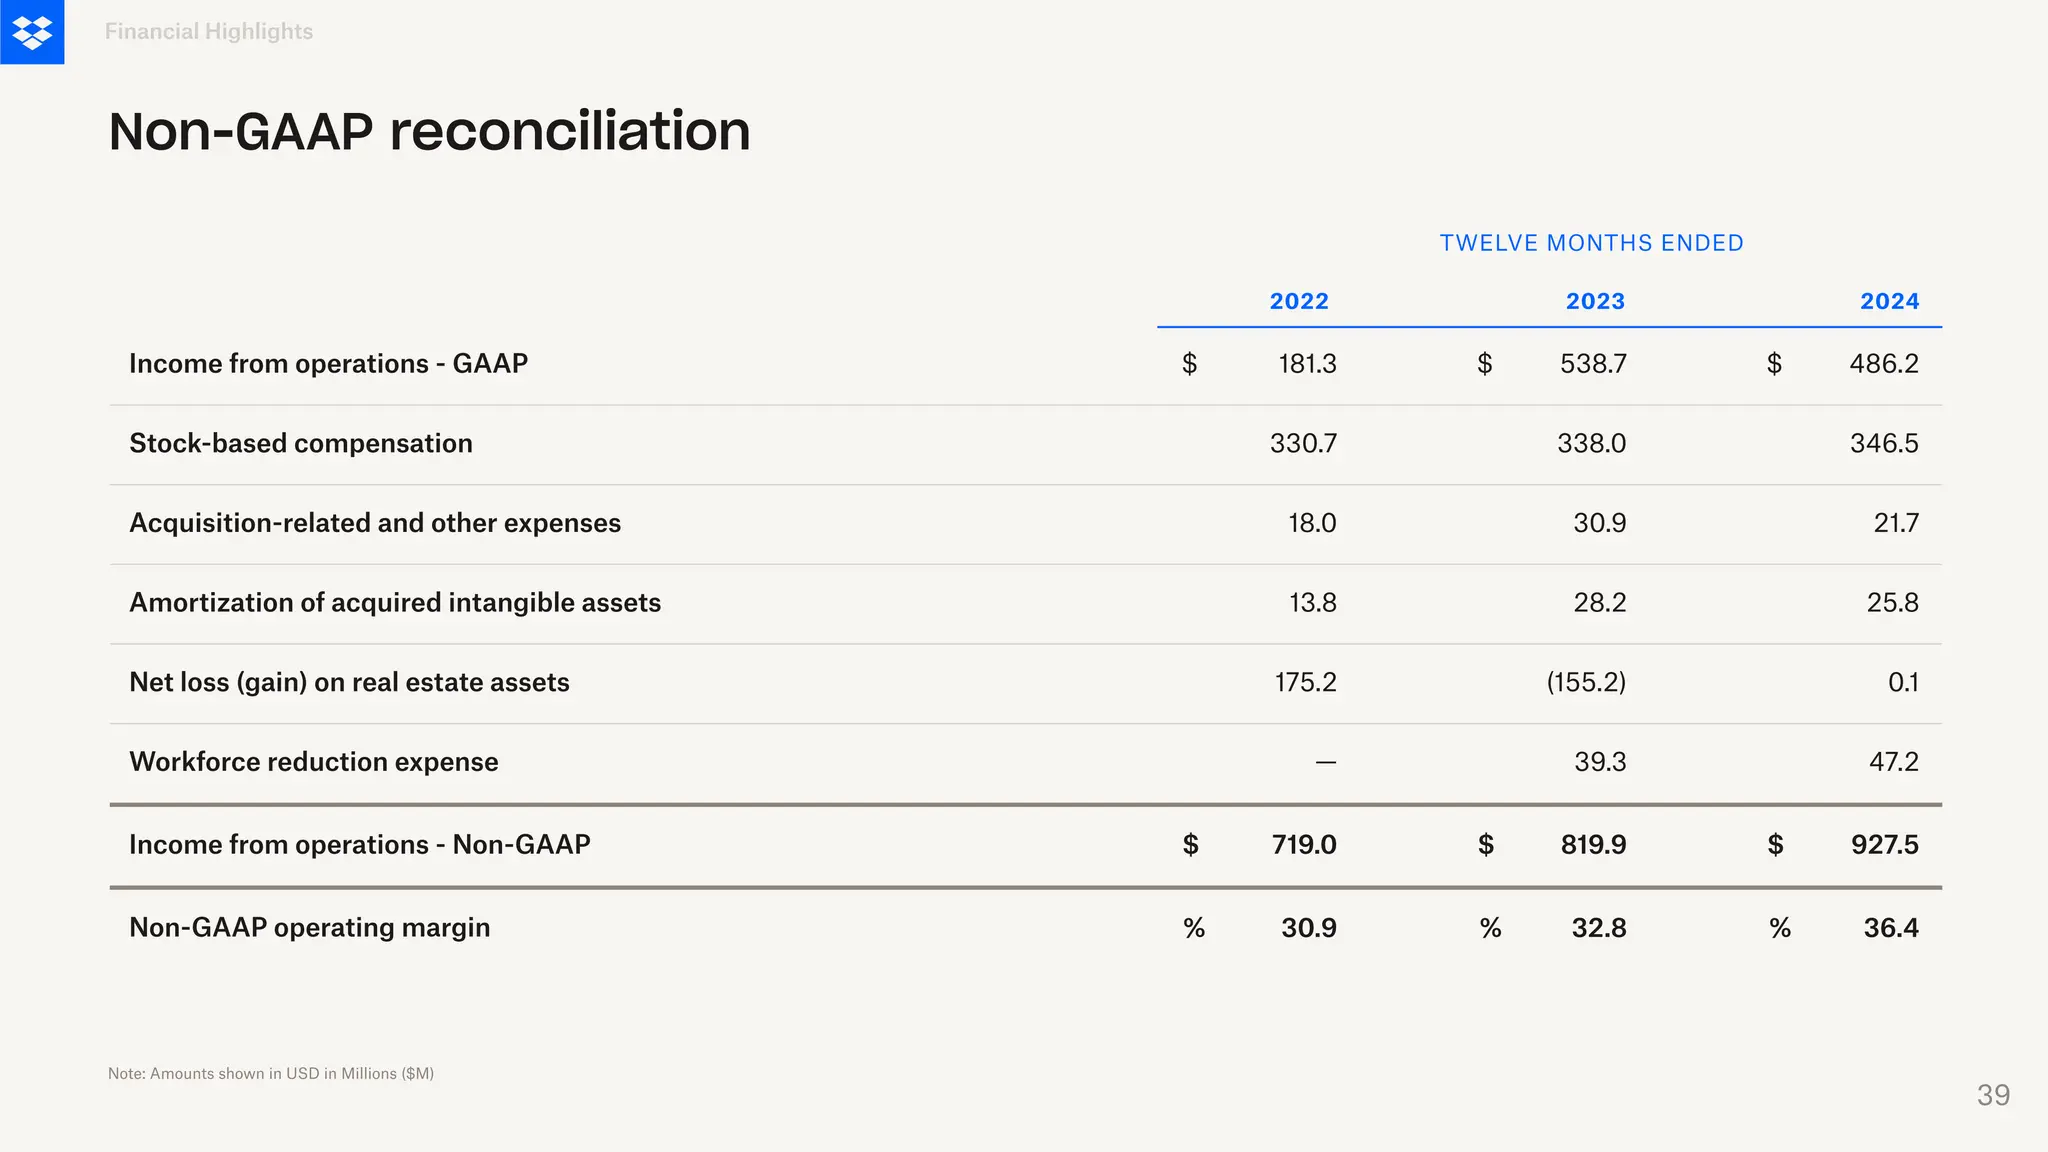
Income from operations- GAAP
Stock-based compensation
Acquisition-related and other expenses
Amortization of acquired intangible assets
Net loss (gain) on real estate assets
Workforce reduction expense
Income from operations - Non-GAAP
Non-GAAP operating margin
181.3
330.7
13.8
2022
Financial Highlights
Non-GAAP reconciliation
TWELVE MONTHS ENDED
$
18.0
30.9
719.0
—
175.2
$
%
538.7
338.0
28.2
2023
$
30.9
32.8
819.9
39.3
(155.2)
$
%
486.2
346.5
25.8
2024
$
21.7
36.4
927.5
47.2
0.1
$
%
Note: Amounts shown in USD in Millions ($M)
39
40.
127.8
92.3
7.0
SEPTEMBER 30, 2024
$
4.4
36.2
231.5
—
$
%
Incomefrom operations - GAAP
Stock-based compensation
Acquisition-related and other expenses
Amortization of acquired intangible assets
Workforce reduction expense
Income from operations - Non-GAAP
Non-GAAP operating margin
Financial Highlights
Non-GAAP reconciliation
THREE MONTHS ENDED
Note: Amounts shown in USD in Millions ($M)
Net loss (gain) on real estate assets —
267.4
82.9
7.1
DECEMBER 31, 2023
$
4.3
32.2
204.7
0.4
$
%
143.5
78.0
6.2
MARCH 31, 2024
$
3.0
36.5
230.7
$
%
—
127.0
90.5
5.8
JUNE 30, 2024
$
4.6
35.9
227.9
$
%
—
(157.4)
—
—
DECEMBER 31, 2024
87.9
85.7
6.8
$
9.7
36.9
237.4
47.2
$
%
0.1
40
41.
$ 759.4
$ 871.6
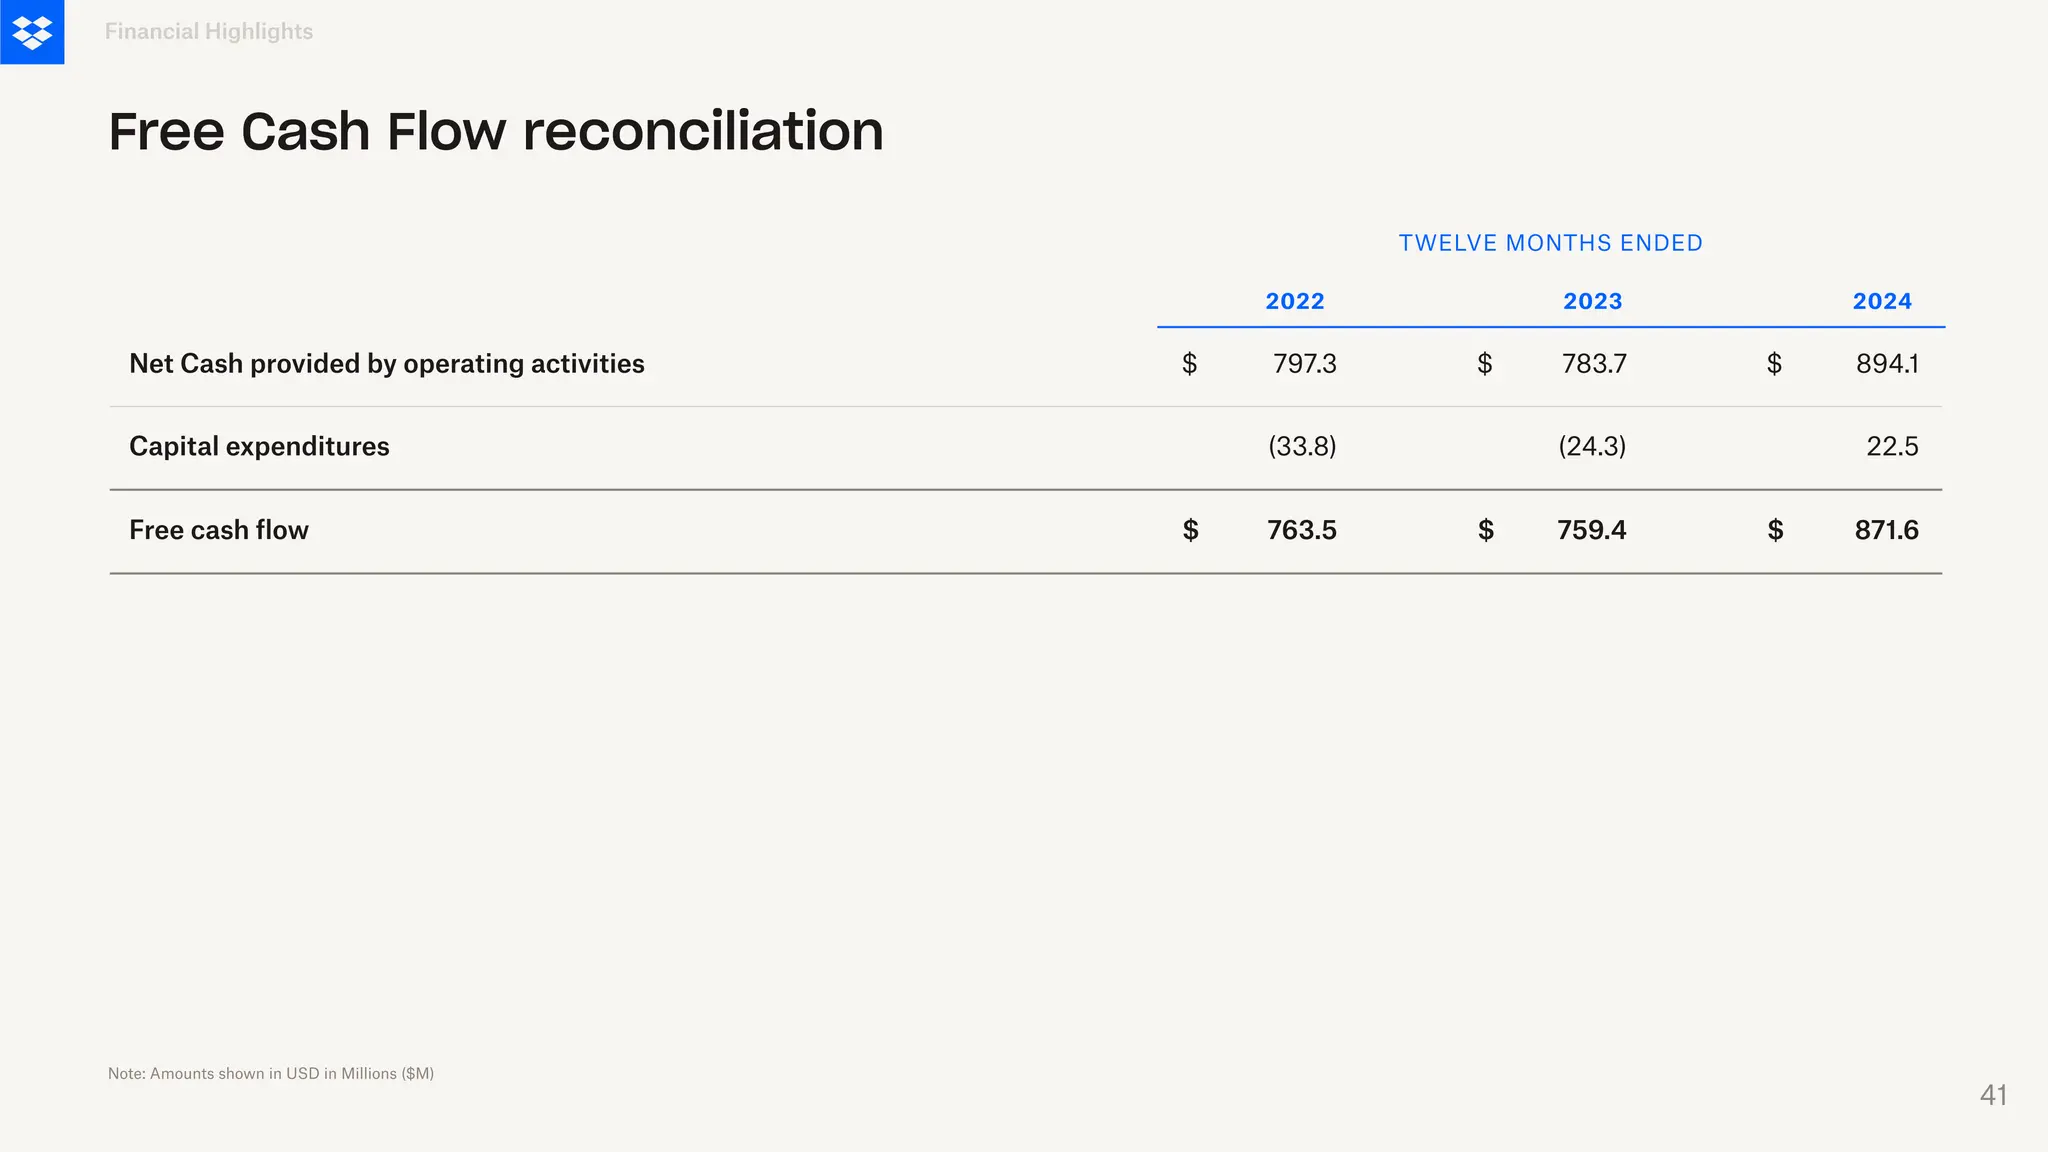
$
NetCash provided by operating activities
Capital expenditures
Free cash flow
797.3
(33.8)
2022
Financial Highlights
Free Cash Flow reconciliation
$
763.5
783.7
(24.3)
2023
$ 894.1
22.5
2024
$
TWELVE MONTHS ENDED
Note: Amounts shown in USD in Millions ($M)
41
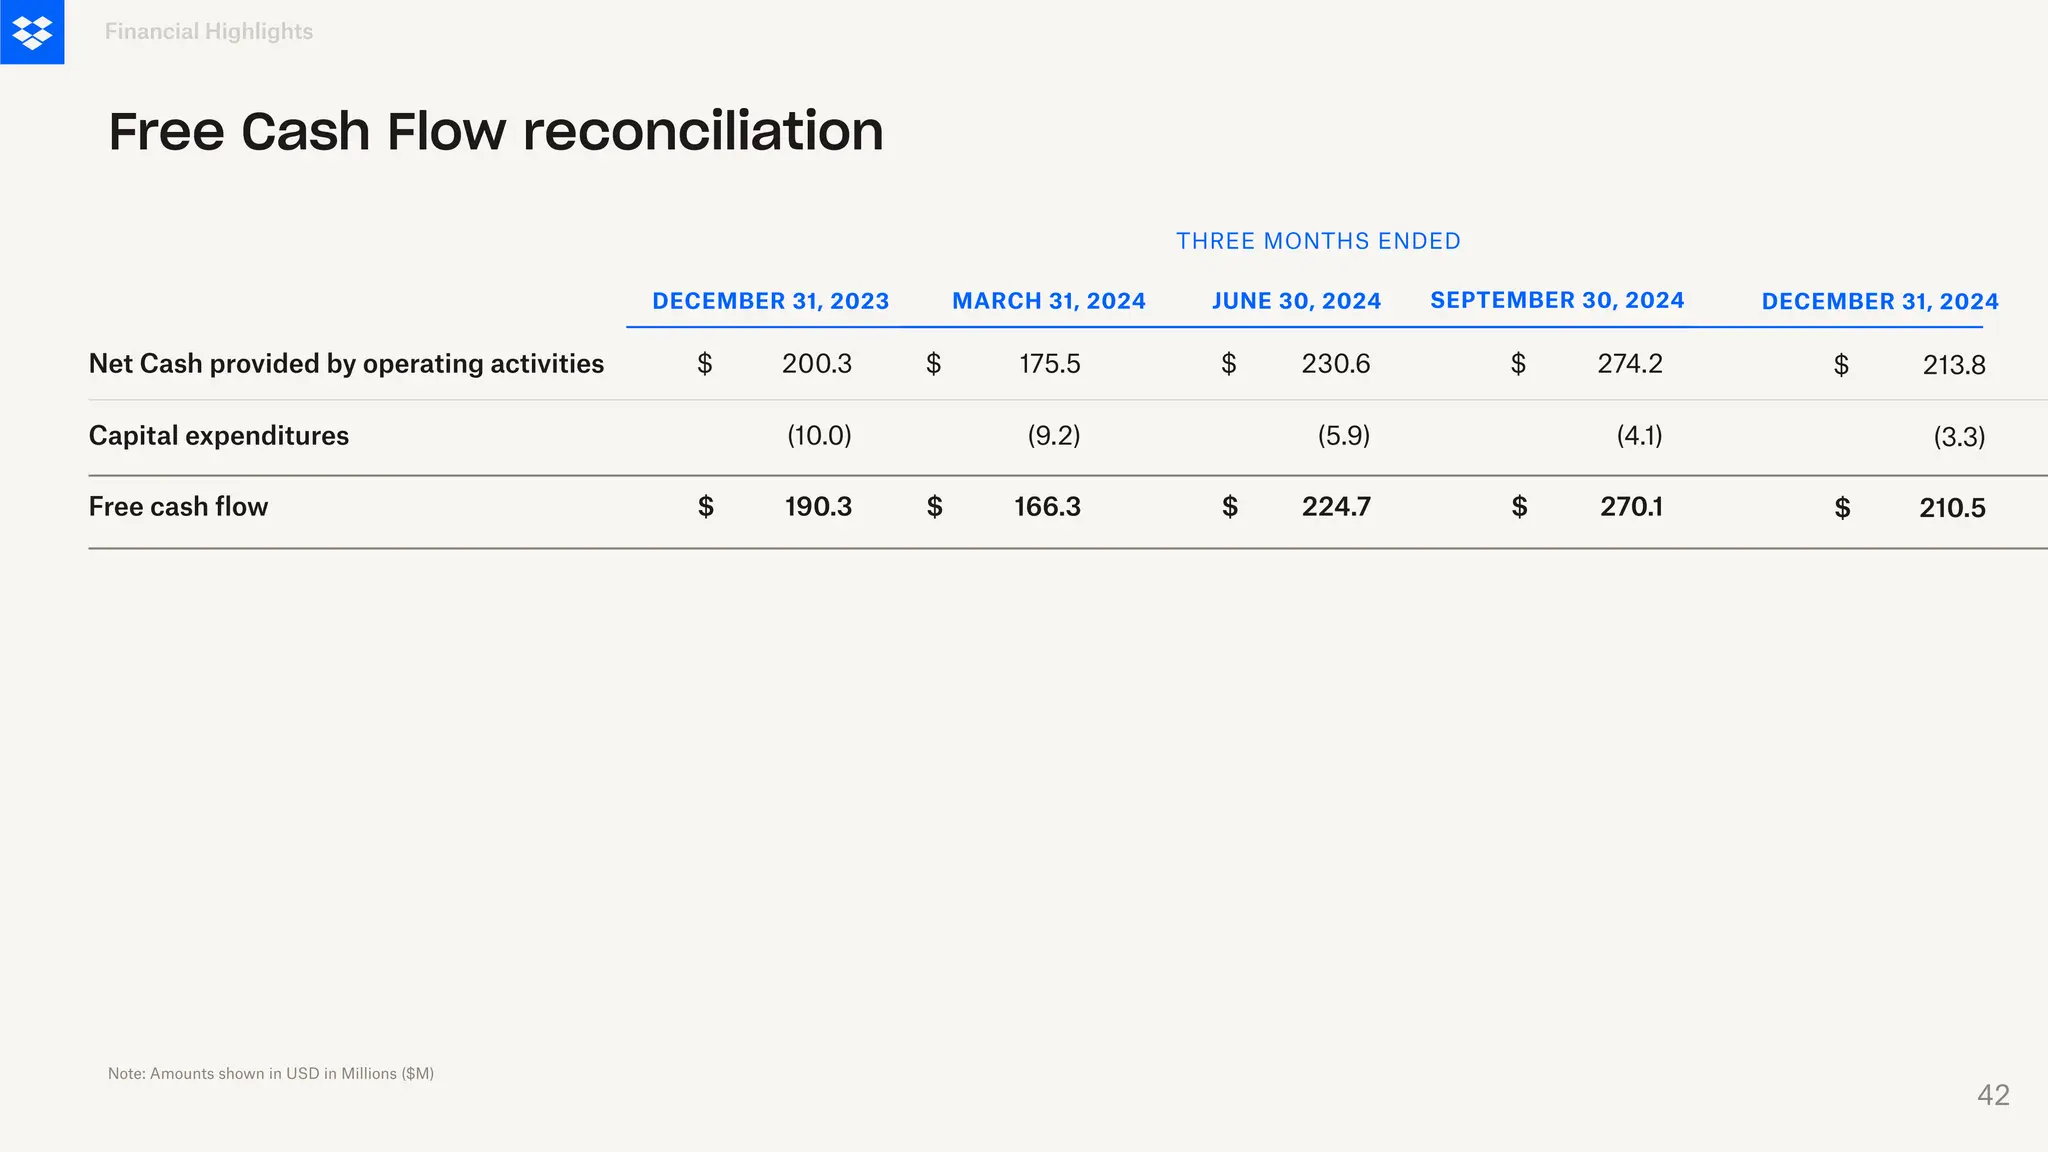
42.
$ 224.7
$ 270.1
$
NetCash provided by operating activities
Capital expenditures
Free cash flow
175.5
(9.2)
Financial Highlights
Free Cash Flow reconciliation
$
166.3
230.6
(5.9)
$ 274.2
(4.1)
$
Note: Amounts shown in USD in Millions ($M)
SEPTEMBER 30, 2024
THREE MONTHS ENDED
DECEMBER 31, 2023 MARCH 31, 2024 JUNE 30, 2024
200.3
$
(10.0)
$ 190.3 210.5
$
213.8
(3.3)
$
DECEMBER 31, 2024
42
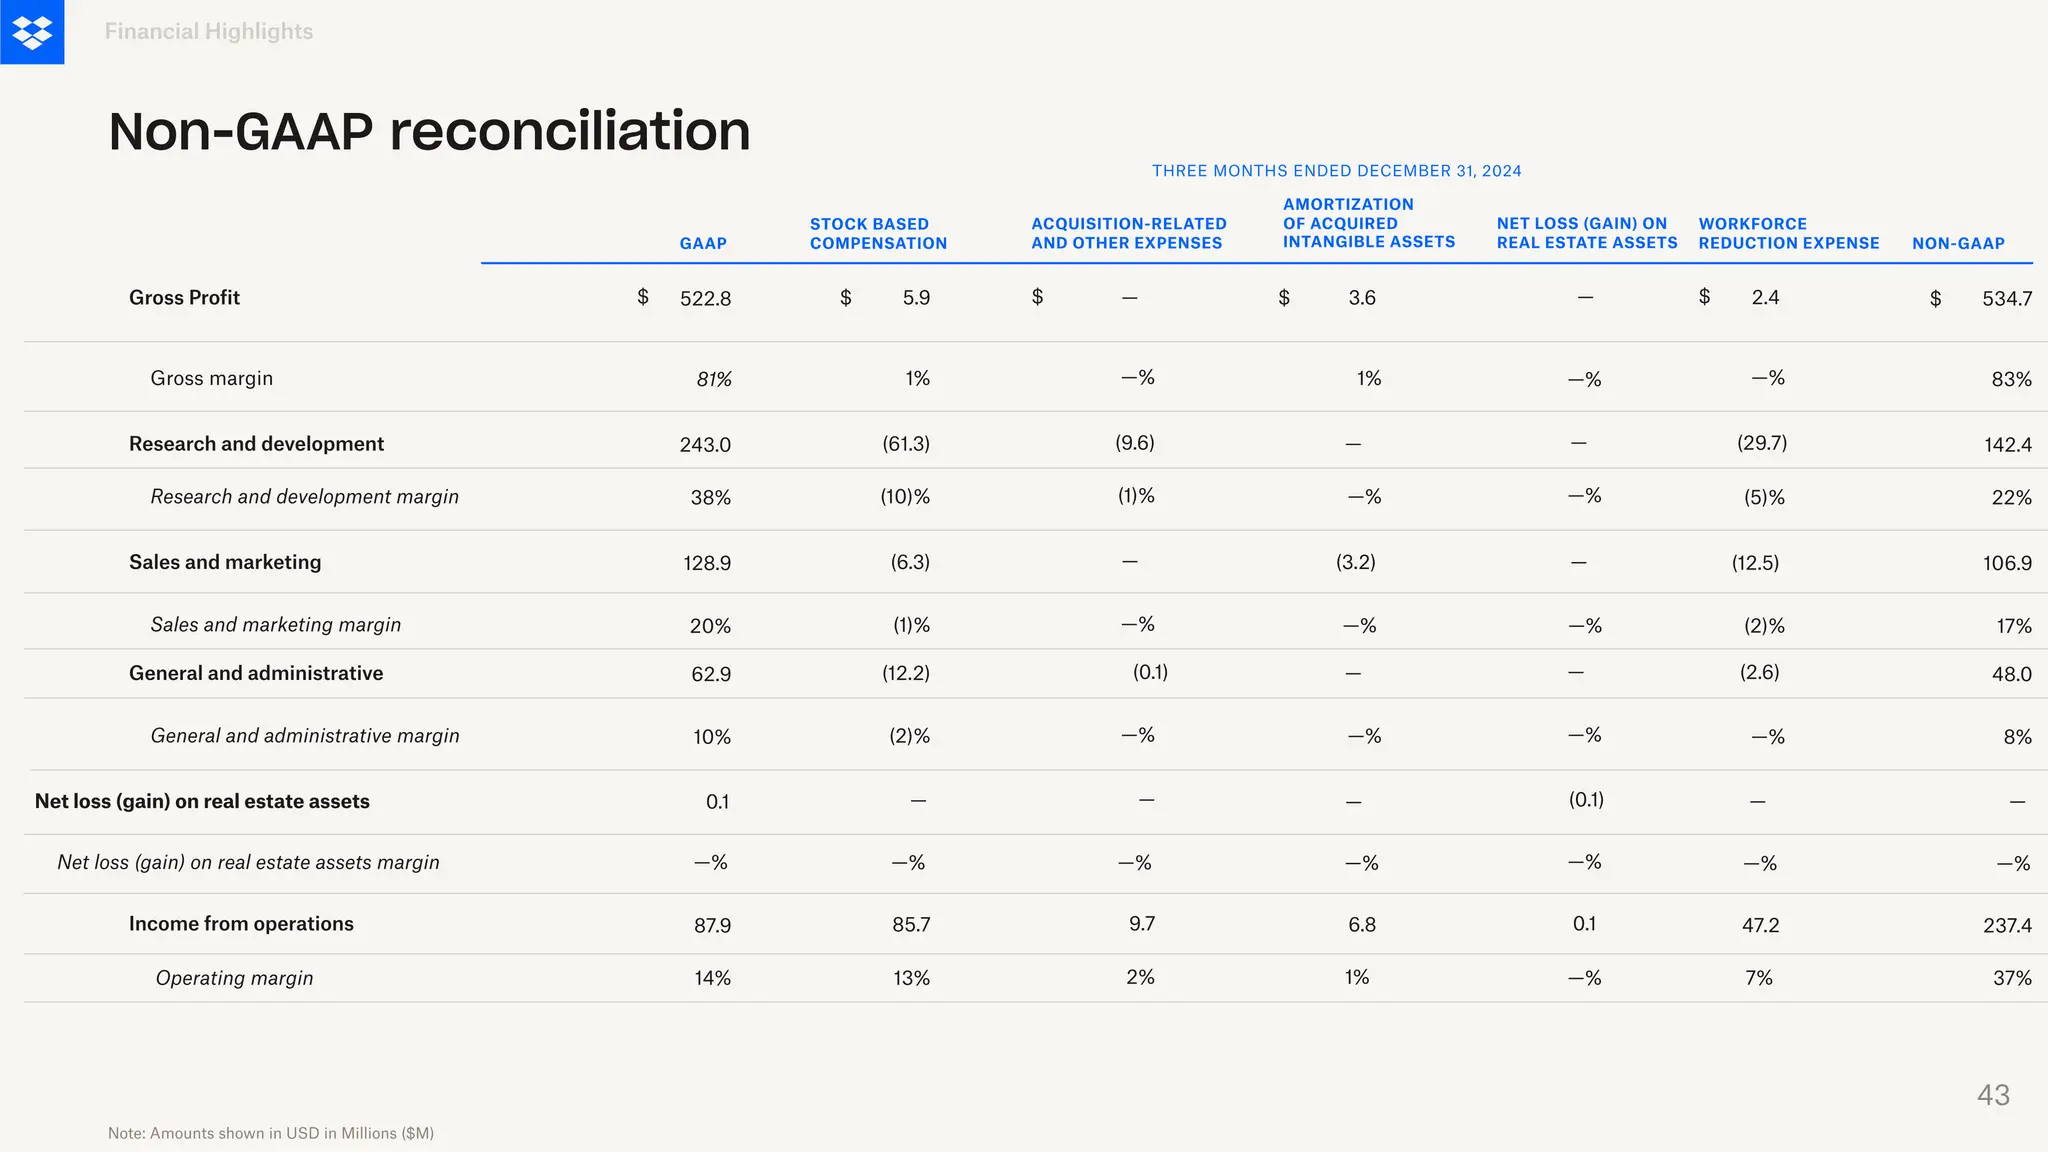
43.
Gross margin
Research anddevelopment margin
Sales and marketing
Sales and marketing margin
General and administrative
General and administrative margin
Financial Highlights
Non-GAAP reconciliation
AMORTIZATION
OF ACQUIRED
INTANGIBLE ASSETS
ACQUISITION-RELATED
AND OTHER EXPENSES
Gross Profit
Research and development
Income from operations
Operating margin
GAAP
STOCK BASED
COMPENSATION NON-GAAP
—
—%
(1)%
$
(9.6)
—%
—%
—
2%
9.7
3.6
1%
—%
$
—
—%
—
(3.2)
1%
6.8
534.7
83%
22%
$
142.4
8%
48.0
17%
106.9
37%
237.4
522.8
81%
38%
$
243.0
10%
62.9
20%
128.9
14%
87.9
5.9
1%
(10)%
$
(61.3)
(2)%
(12.2)
(1)%
(6.3)
13%
85.7
THREE MONTHS ENDED DECEMBER 31, 2024
(0.1)
Note: Amounts shown in USD in Millions ($M)
Net loss (gain) on real estate assets — —
0.1
Net loss (gain) on real estate assets margin —% —%
NET LOSS (GAIN) ON
REAL ESTATE ASSETS
WORKFORCE
REDUCTION EXPENSE
—%
—%
0.1
—%
2.4
(5)%
—%
(2)%
(12.5)
7%
47.2
—
—
—% —%
—
—%
—%
—%
—
—
—%
(2.6)
—
(0.1)
—%
(29.7)
—%
—
—%
$
43
44.
Gross margin
Research anddevelopment margin
Sales and marketing
Sales and marketing margin
General and administrative
General and administrative margin
Financial Highlights
Non-GAAP reconciliation
AMORTIZATION
OF ACQUIRED
INTANGIBLE ASSETS
ACQUISITION-RELATED
AND OTHER EXPENSES
Gross Profit
Research and development
Income from operations
Operating margin
GAAP
STOCK BASED
COMPENSATION NON-GAAP
—
—%
(1)%
$
(4.3)
—%
—%
—
1%
4.3
3.7
1%
—%
$
—
—%
—
(3.4)
1%
7.1
522.4
82%
25%
$
158.9
8%
47.7
18%
111.1
32%
204.7
513.0
81%
35%
$
222.1
10%
61.3
19%
119.6
42%
267.4
5.7
1%
(9)%
$
(58.7)
(2)%
(13.5)
(1)%
(5.0)
13%
82.9
THREE MONTHS ENDED DECEMBER 31, 2023
Note: Amounts shown in USD in Millions ($M)
Net (gain) loss on real estate assets — —
(157.4)
Net (gain) loss on real estate assets margin (25)% —%
NET (GAIN) LOSS ON
REAL ESTATE ASSETS
WORKFORCE
REDUCTION EXPENSE
—%
—%
(157.4)
25%
—%
(0.1)
0.4
—
—
—% —%
—
—%
(1)%
—%
—
—
—%
(0.1)
—
157.4
(25)%
(0.2)
—%
—
—%
$ —
—%
—%
—%
—
44
45.
Gross margin
Research anddevelopment margin
Sales and marketing
Sales and marketing margin
General and administrative
General and administrative margin
Financial Highlights
Non-GAAP reconciliation
AMORTIZATION
OF ACQUIRED
INTANGIBLE ASSETS
ACQUISITION-RELATED
AND OTHER EXPENSES
Gross Profit
Research and development
Income from operations
Operating margin
GAAP
STOCK BASED
COMPENSATION NON-GAAP
—
—%
(1)%
$
(19.5)
—%
—%
—
1%
21.7
13.1
1%
—%
$
—
—%
—
(12.7)
1%
25.8
2,141.5
84%
24%
$
618.1
7%
184.1
16%
411.8
36%
927.5
2,103.1
83%
36%
$
914.9
9%
241.2
18%
460.7
19%
486.2
22.9
1%
(10)%
$
(247.6)
(2)%
(52.3)
(1)%
(23.7)
14%
346.5
TWELVE MONTHS ENDED - 2024
Note: Amounts shown in USD in Millions ($M)
Net loss (gain) on real estate assets — —
0.1
Net loss (gain) on real estate assets margin —%
NET LOSS (GAIN) ON
REAL ESTATE ASSETS
WORKFORCE
REDUCTION EXPENSE
—%
—% —%
(12.5)
47.2
—
—
—% —%
—
—% —%
—
—
—%
(2.6)
—
(0.1)
(29.7)
—%
—
—%
$ 2.4
(1)%
—%
2%
(2.2)
—%
—%
0.1
—%
—%
45
46.
Gross margin
Research anddevelopment margin
Sales and marketing
Sales and marketing margin
General and administrative
General and administrative margin
Financial Highlights
Non-GAAP reconciliation
AMORTIZATION
OF ACQUIRED
INTANGIBLE ASSETS
ACQUISITION-RELATED
AND OTHER EXPENSES
Gross Profit
Research and development
Income from operations
Operating margin
GAAP
STOCK BASED
COMPENSATION NON-GAAP
—
—%
(1)%
$
(22.2)
—%
—%
(8.3)
1%
30.9
14.6
1%
—%
$
—
—%
—
(13.6)
1%
28.2
2,063.9
83%
26%
$
648.9
7%
179.7
17%
415.4
33%
819.9
2,023.1
81%
37%
$
936.5
9%
237.1
19%
466.0
22%
538.7
23.3
1%
(9)%
$
(237.6)
(2)%
(55.1)
(1)%
(22.0)
14%
338.0
TWELVE MONTHS ENDED - 2023
Note: Amounts shown in USD in Millions ($M)
Net (gain) loss on real estate assets — —
(155.2)
Net (gain) loss on real estate assets margin —%
NET (GAIN) LOSS ON
REAL ESTATE ASSETS
WORKFORCE
REDUCTION EXPENSE
—%
—% —%
(6.7)
39.3
—
—
—% —%
—
—% —%
—
—
—%
(1.9)
—
155.2
(27.8)
—%
—
—%
$ 2.9
(1)%
—%
2%
(0.4)
(6)%
(1)%
(155.2)
6%
(6)%
46
47.
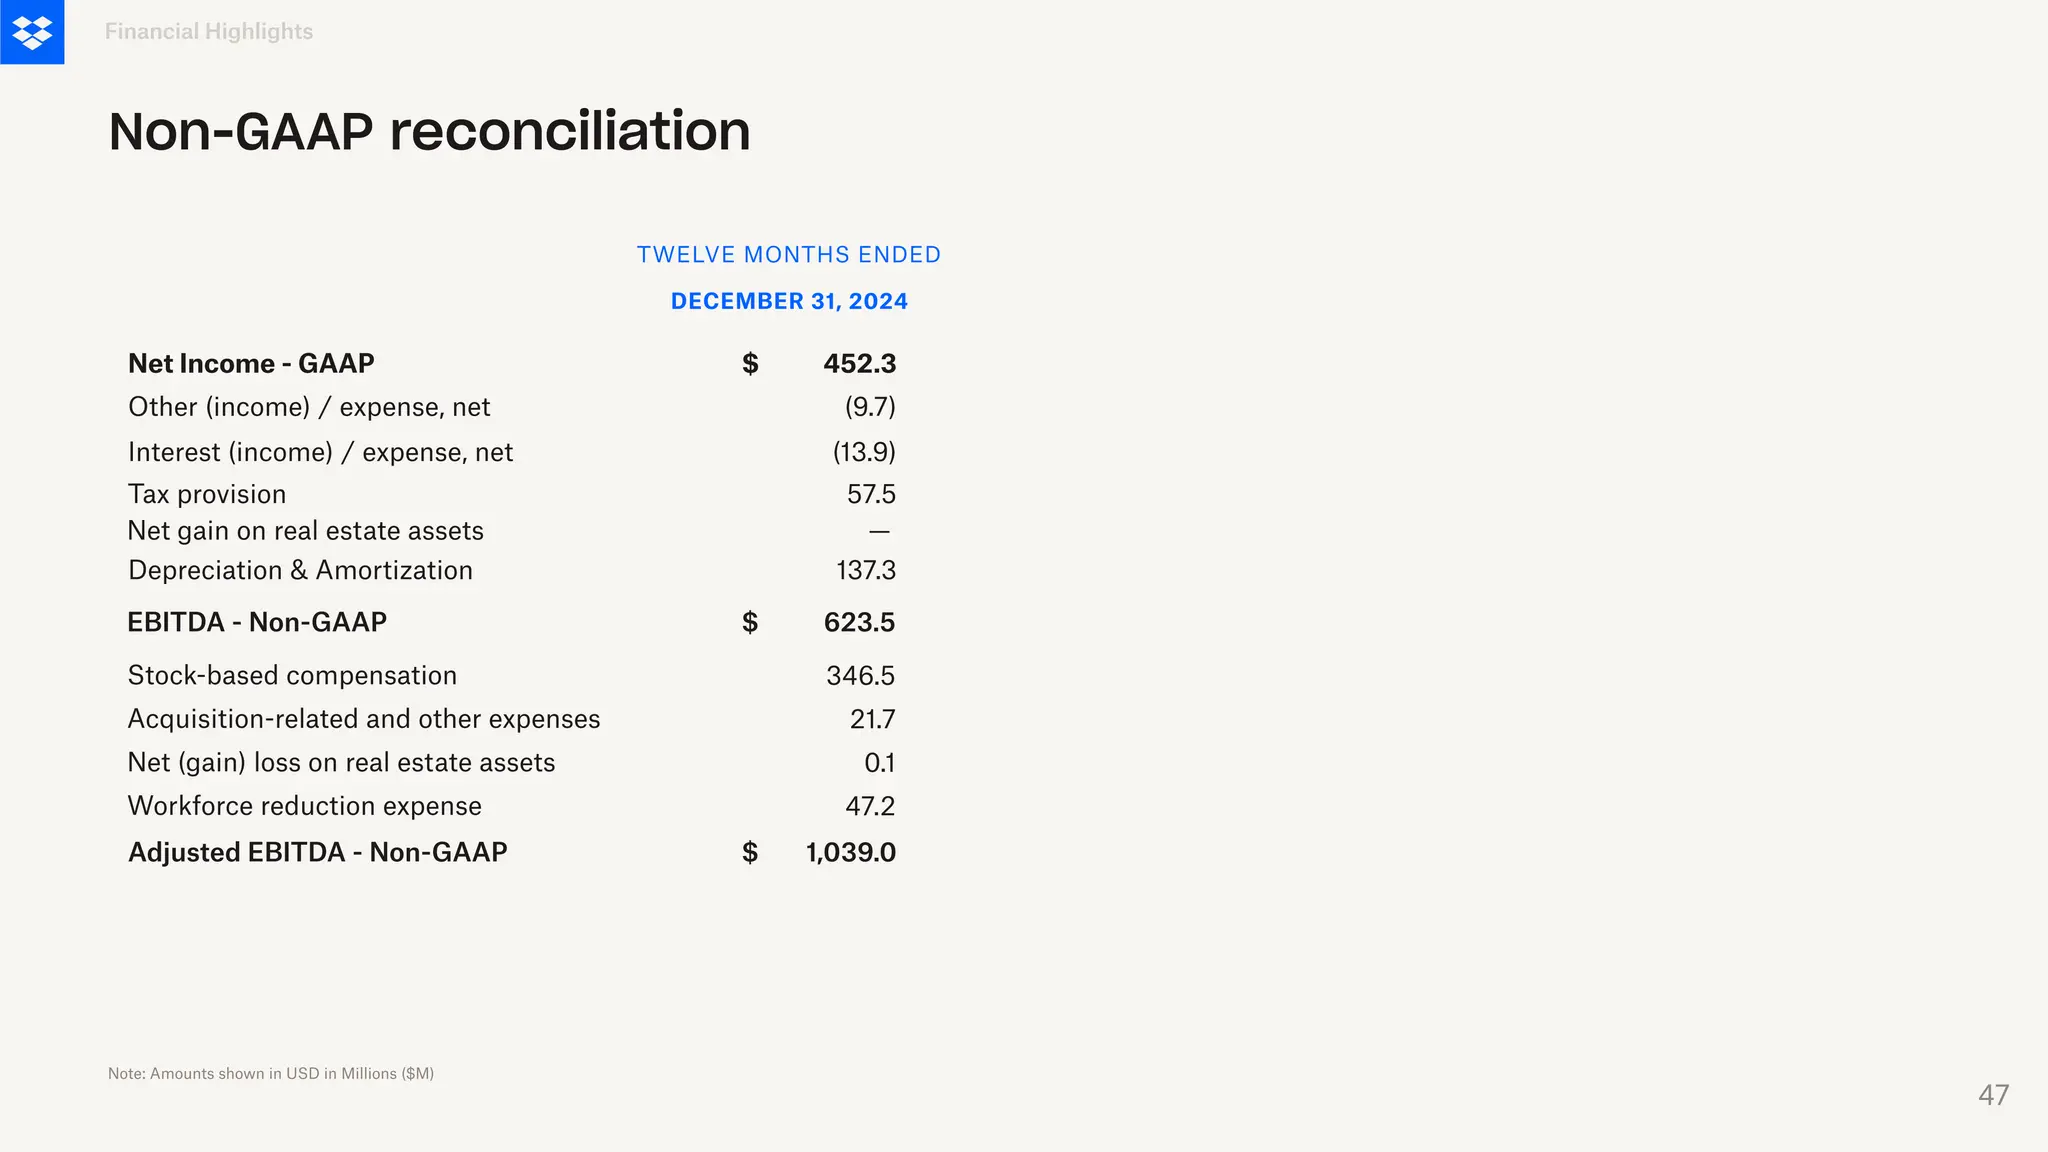
452.3
(9.7)
57.5
DECEMBER 31, 2024
$
(13.9)
346.5
623.5
137.3
$
NetIncome - GAAP
Other (income) / expense, net
Interest (income) / expense, net
Tax provision
Depreciation & Amortization
EBITDA - Non-GAAP
Stock-based compensation
Financial Highlights
Non-GAAP reconciliation
TWELVE MONTHS ENDED
Note: Amounts shown in USD in Millions ($M)
Net gain on real estate assets —
21.7
Acquisition-related and other expenses
0.1
Net (gain) loss on real estate assets
47.2
Workforce reduction expense
1,039.0
$
Adjusted EBITDA - Non-GAAP
47


![Q3 2022 DBX Investor Presentation v1 [TBU].pptx](https://cdn.slidesharecdn.com/ss_thumbnails/q32022dbxinvestorpresentationv1tbu-220926164314-7b8f6da9-thumbnail.jpg?width=640&height=640&fit=bounds)
![Q3 2022 DBX Investor Presentation v1 [TBU].pptx](https://cdn.slidesharecdn.com/ss_thumbnails/q32022dbxinvestorpresentationv1tbu-220926164154-0dda8e66-thumbnail.jpg?width=640&height=640&fit=bounds)


![[BDD 2025 - Artificial Intelligence] Building AI Systems That Users (and Comp...](https://cdn.slidesharecdn.com/ss_thumbnails/ai-buildingaisystemsthatusersandcompanieslove-251124030845-038f7732-thumbnail.jpg?width=640&height=640&fit=bounds)


![[BDD 2025 - Full-Stack Development] Agentic AI Architecture: Redefining Syste...](https://cdn.slidesharecdn.com/ss_thumbnails/fs-agenticaiarchitectureredefiningsystemcommunication-251124030838-e6c70cc2-thumbnail.jpg?width=640&height=640&fit=bounds)


![[DevFest Strasbourg 2025] - NodeJs Can do that !!](https://cdn.slidesharecdn.com/ss_thumbnails/devfeststrasbourg2025-nodejscandothat-251127142731-da65b6fd-thumbnail.jpg?width=640&height=640&fit=bounds)


![[BDD 2025 - Mobile Development] Crafting Immersive UI with E2E and AGSL Shade...](https://cdn.slidesharecdn.com/ss_thumbnails/md-craftingimmersiveuiwithe2eandagslshaderveronicaputrianggraini-251124030840-0c677f44-thumbnail.jpg?width=640&height=640&fit=bounds)
