Public Spending on Transportation and Water Infrastructure, 1956 to 2023
In 2023, spending by federal, state, and local governments for transportation and water infrastructure totaled $626 billion. This slide deck updates information that CBO released in 2018.
Public Spending on Transportation and Water Infrastructure, 1956 to 2023
1.
Public Spending onTransportation
and Water Infrastructure, 1956 to 2023
February 2025
This publication updates the exhibits in CBO’s report Public Spending on Transportation and Water Infrastructure, 1956 to 2017 (October 2018), www.cbo.gov/publication/54539.
2
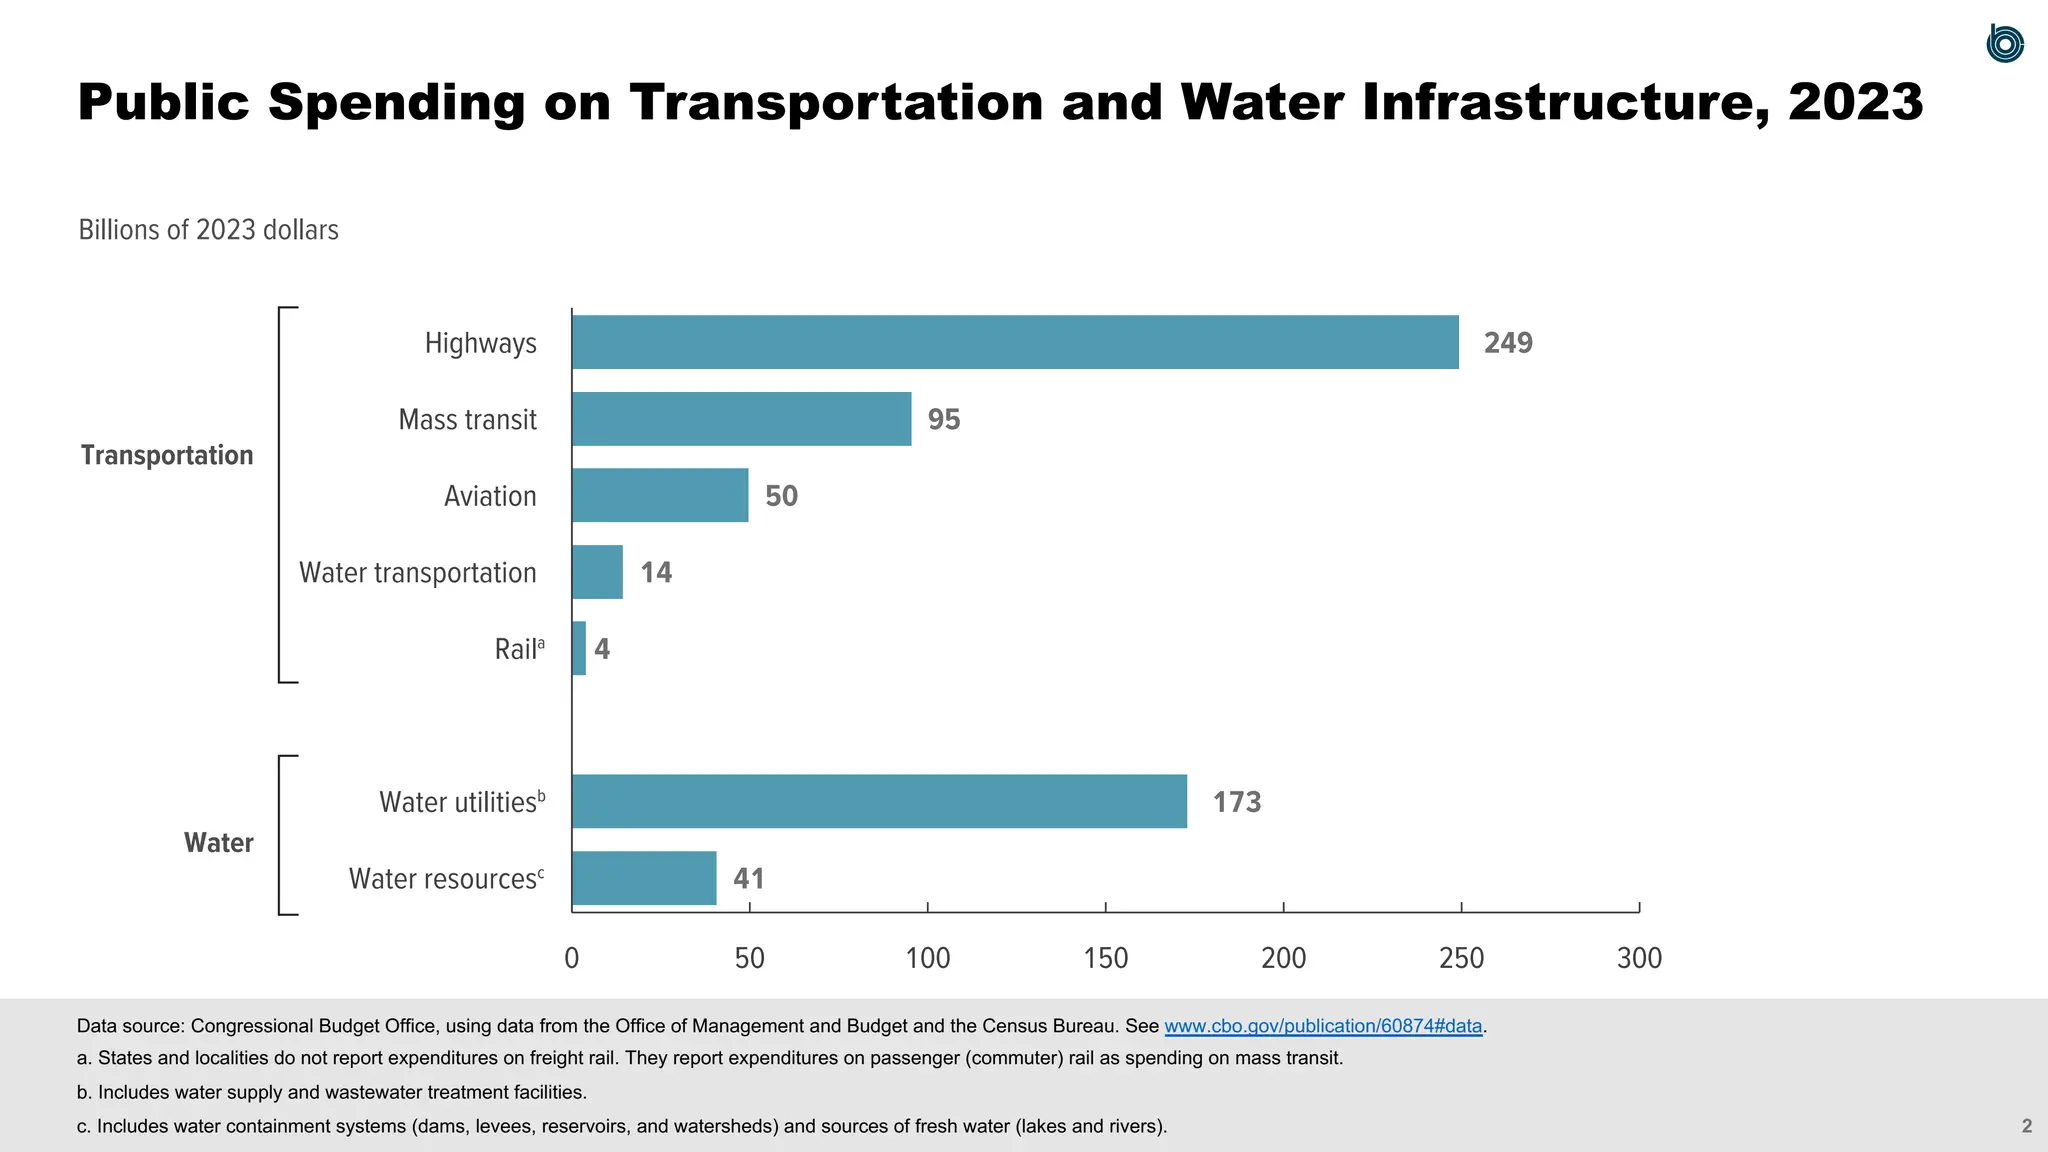
Billions of 2023dollars
Transportation
Water
41
173
4
14
50
95
249
Water resourcesc
Water utilitiesb
Raila
Water transportation
Aviation
Mass transit
Highways
0 50 100 150 200 250 300
Data source: Congressional Budget Office, using data from the Office of Management and Budget and the Census Bureau. See www.cbo.gov/publication/60874#data.
a. States and localities do not report expenditures on freight rail. They report expenditures on passenger (commuter) rail as spending on mass transit.
b. Includes water supply and wastewater treatment facilities.
c. Includes water containment systems (dams, levees, reservoirs, and watersheds) and sources of fresh water (lakes and rivers).
Public Spending on Transportation and Water Infrastructure, 2023
4.
3
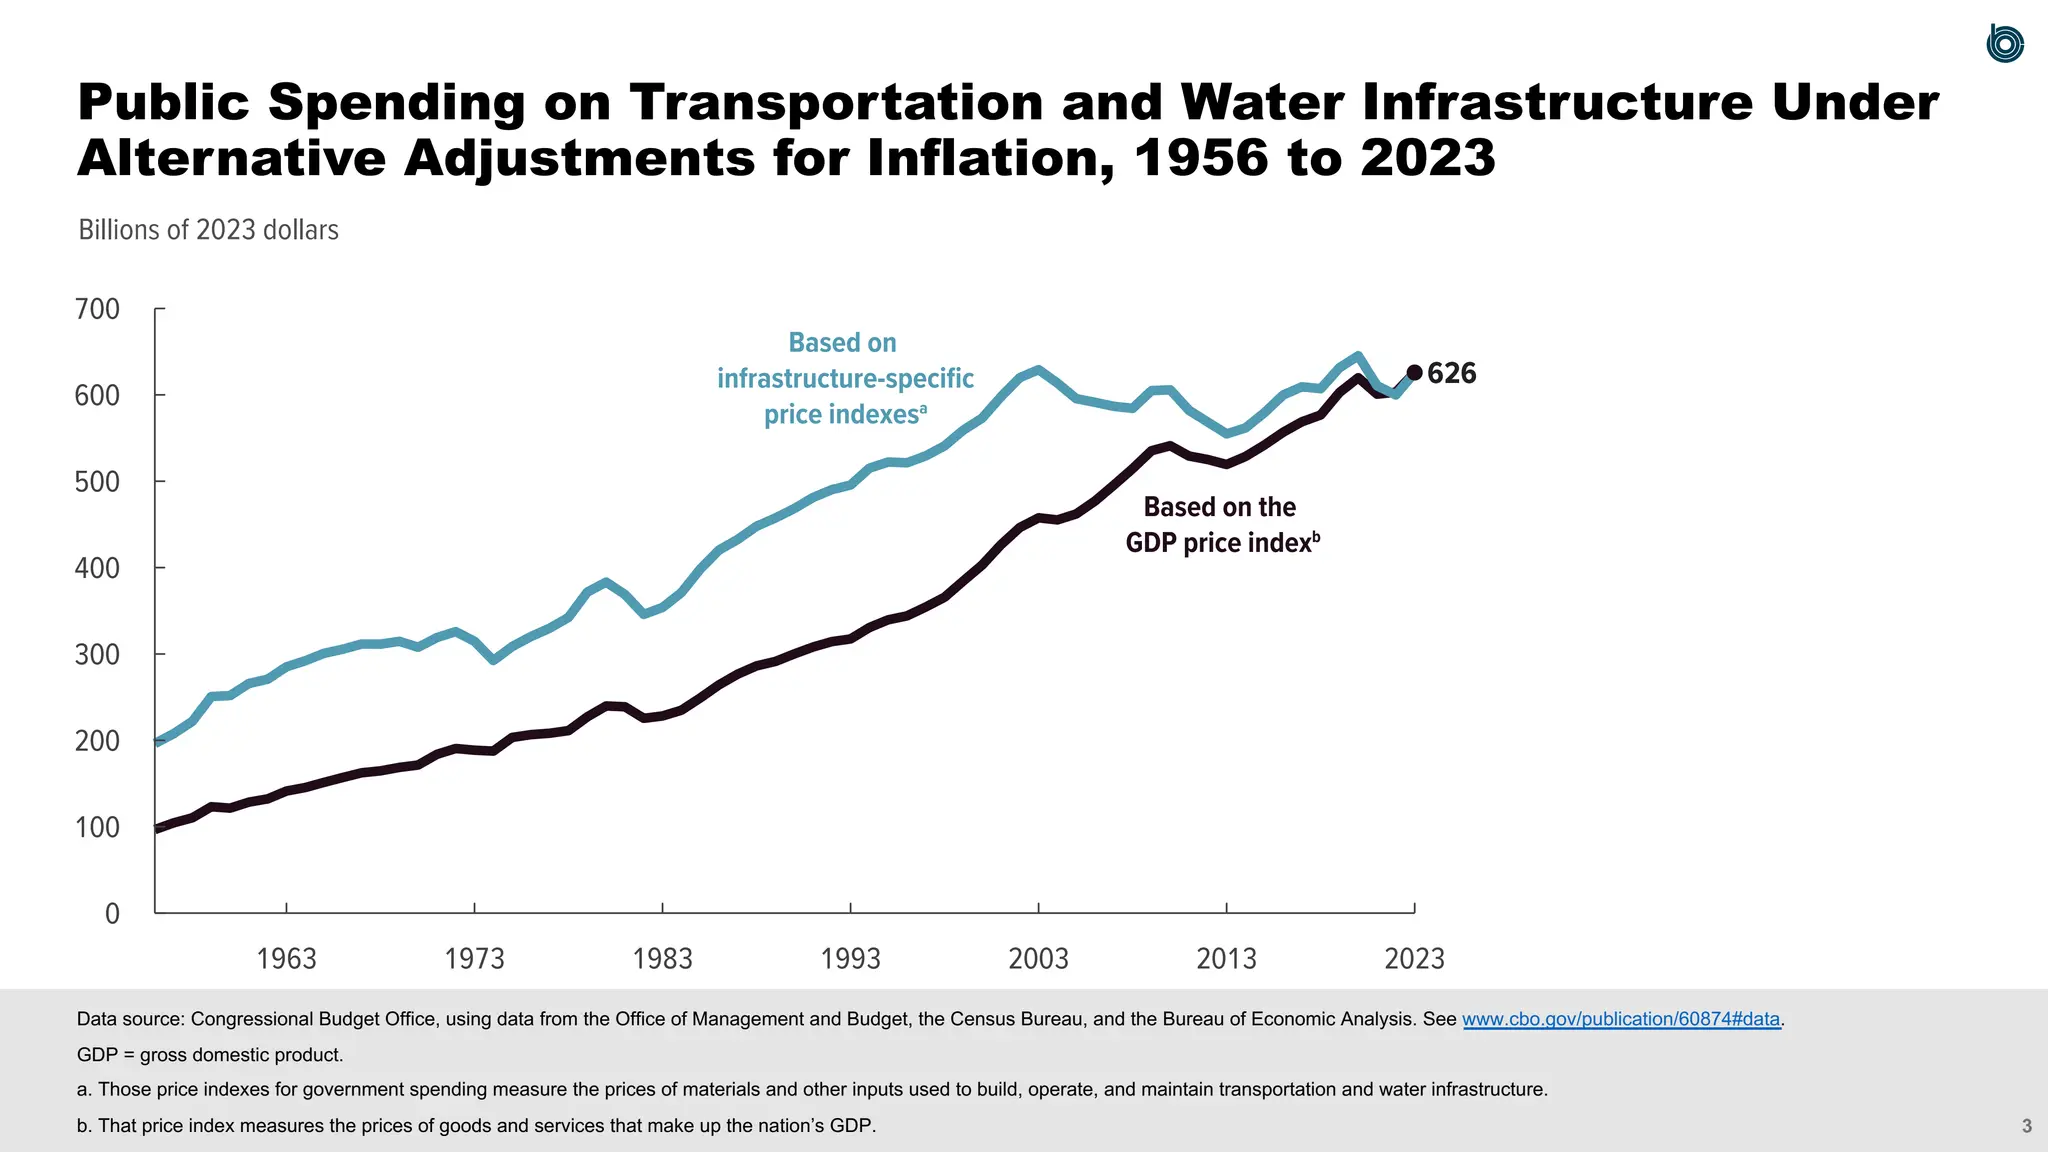
Billions of 2023dollars
Based on
infrastructure-specific
price indexesa
Based on the
GDP price indexb
626
626
0
100
200
300
400
500
600
700
2023
2013
2003
1993
1983
1973
1963
Data source: Congressional Budget Office, using data from the Office of Management and Budget, the Census Bureau, and the Bureau of Economic Analysis. See www.cbo.gov/publication/60874#data.
GDP = gross domestic product.
a. Those price indexes for government spending measure the prices of materials and other inputs used to build, operate, and maintain transportation and water infrastructure.
b. That price index measures the prices of goods and services that make up the nation’s GDP.
Public Spending on Transportation and Water Infrastructure Under
Alternative Adjustments for Inflation, 1956 to 2023
5.
4
Percent
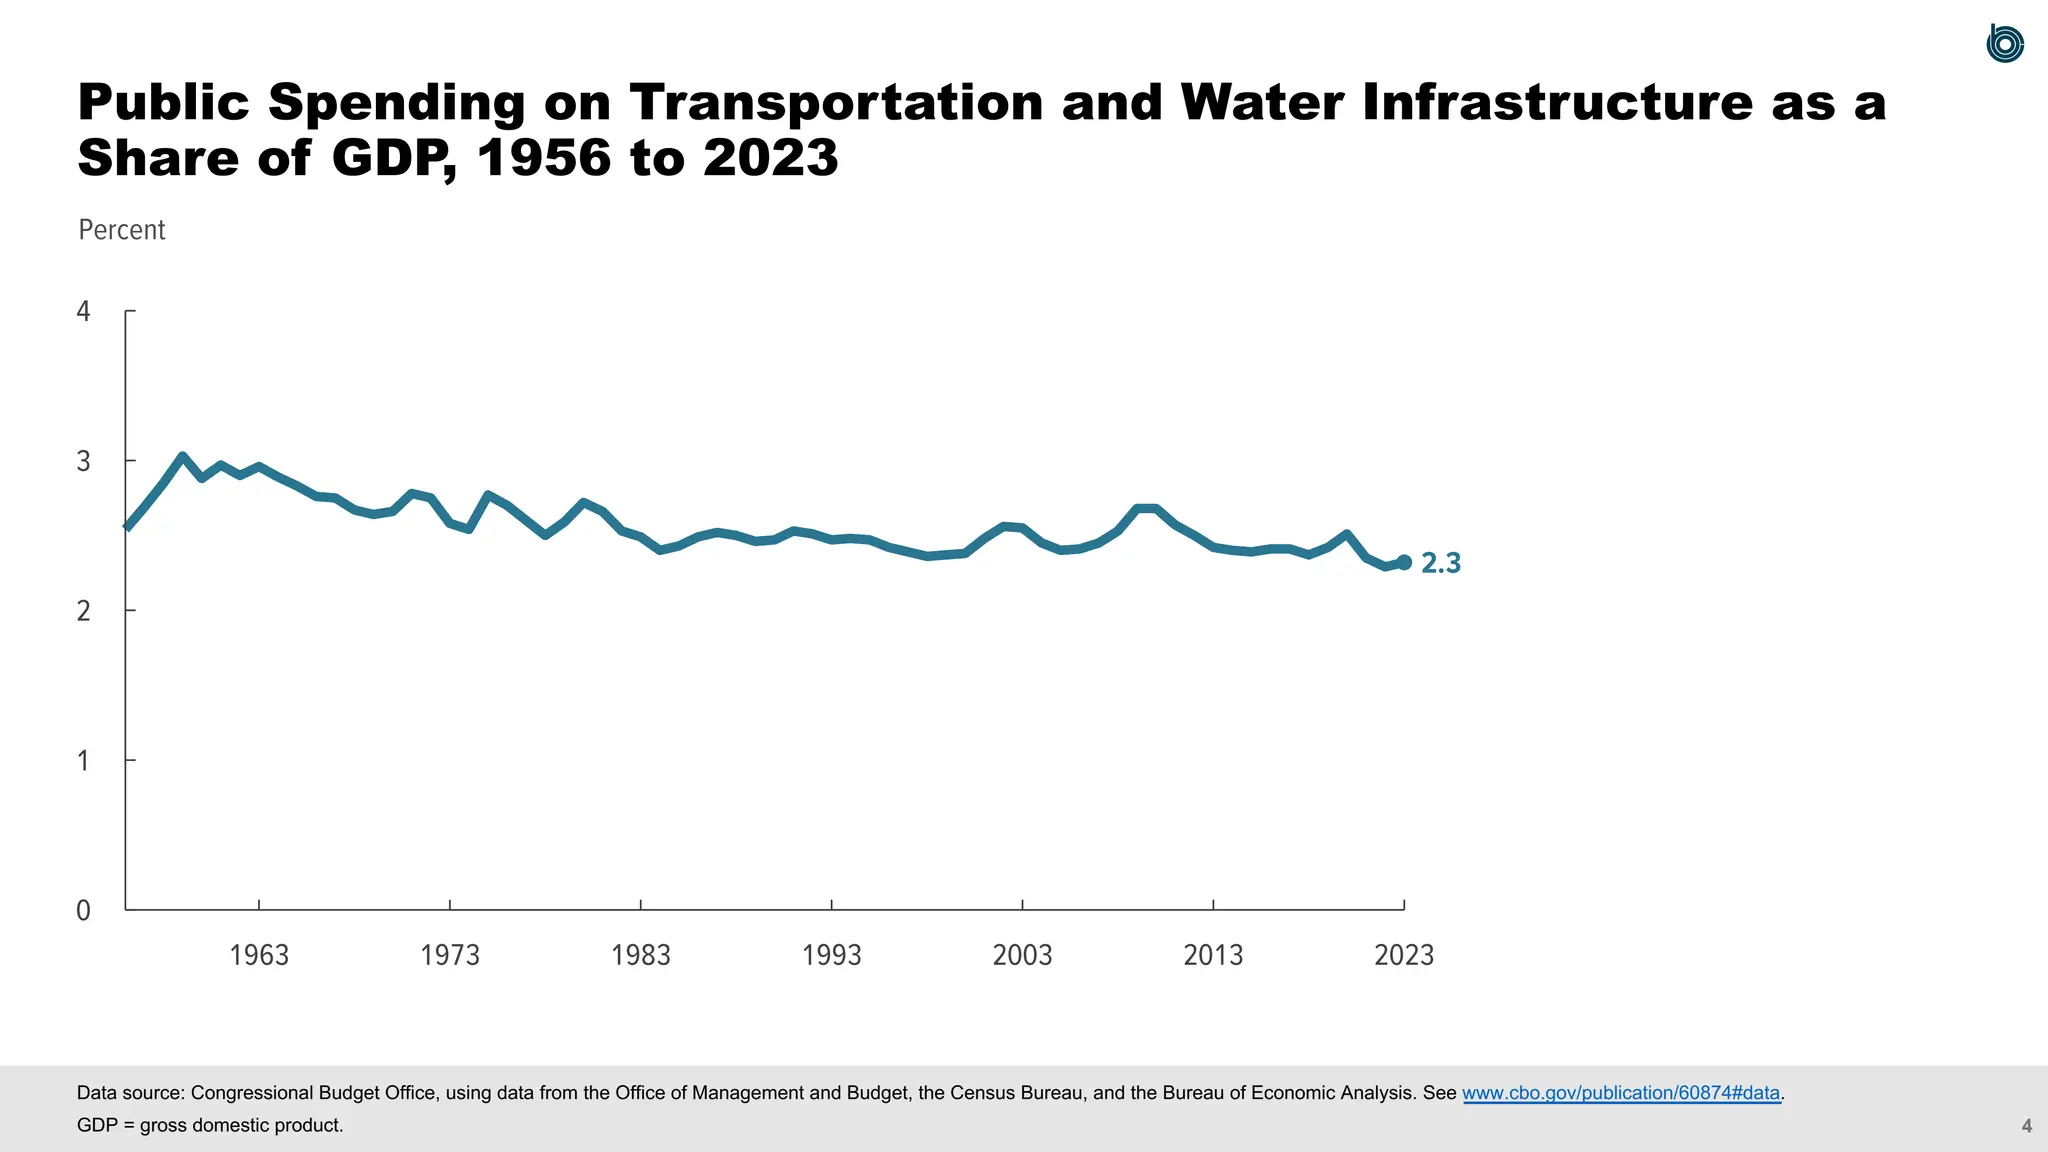
2.3
0
1
2
3
4
2023
2013
2003
1993
1983
1973
1963
Data source: CongressionalBudget Office, using data from the Office of Management and Budget, the Census Bureau, and the Bureau of Economic Analysis. See www.cbo.gov/publication/60874#data.
GDP = gross domestic product.
Public Spending on Transportation and Water Infrastructure as a
Share of GDP, 1956 to 2023
6.
5
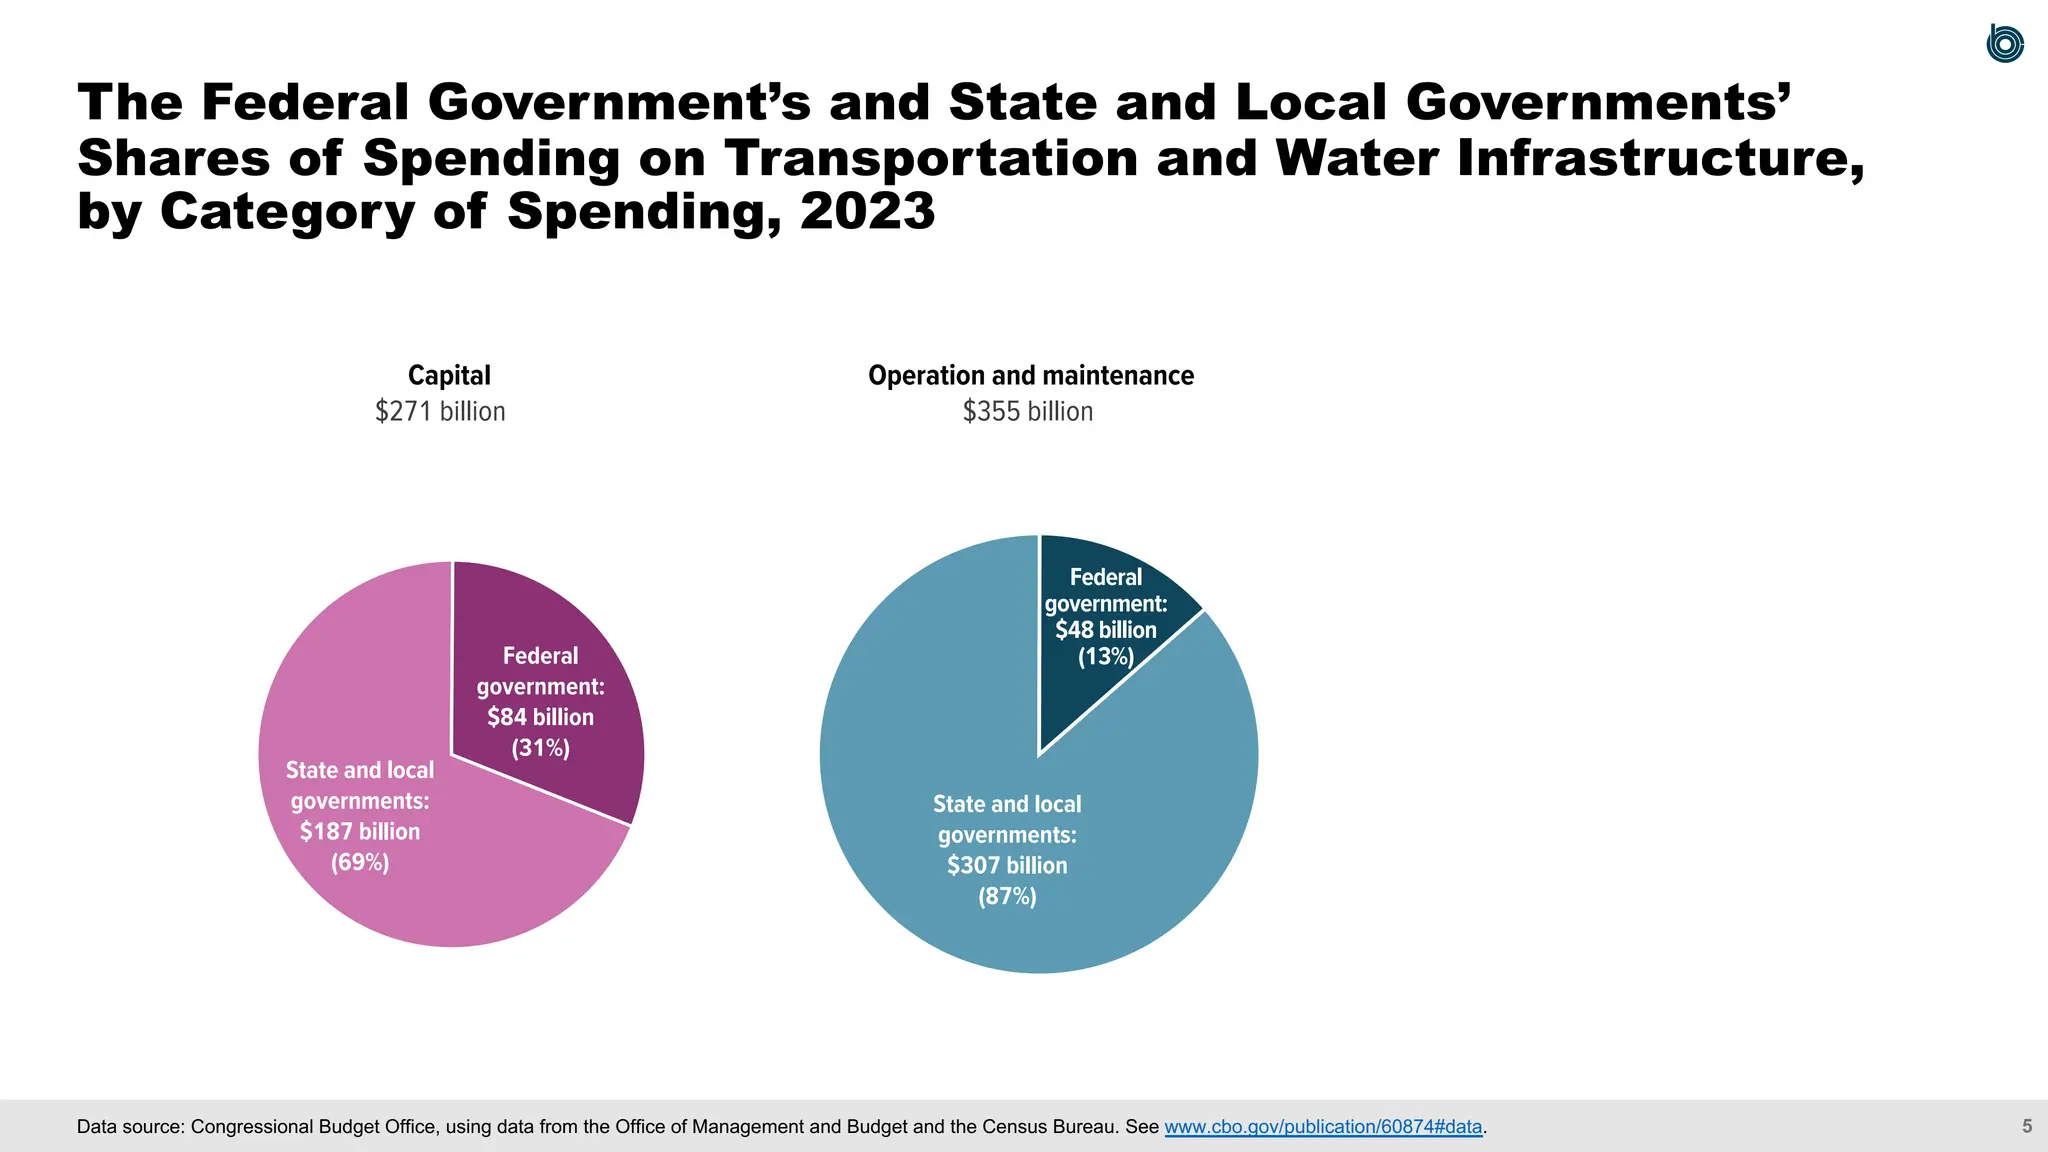
$271 billion
Capital
$355 billion
Operationand maintenance
State and local
governments:
$187 billion
(69%)
Federal
government:
$84 billion
(31%)
State and local
governments:
$307 billion
(87%)
Federal
government:
$48 billion
(13%)
Data source: Congressional Budget Office, using data from the Office of Management and Budget and the Census Bureau. See www.cbo.gov/publication/60874#data.
The Federal Government’s and State and Local Governments’
Shares of Spending on Transportation and Water Infrastructure,
by Category of Spending, 2023
7.
6
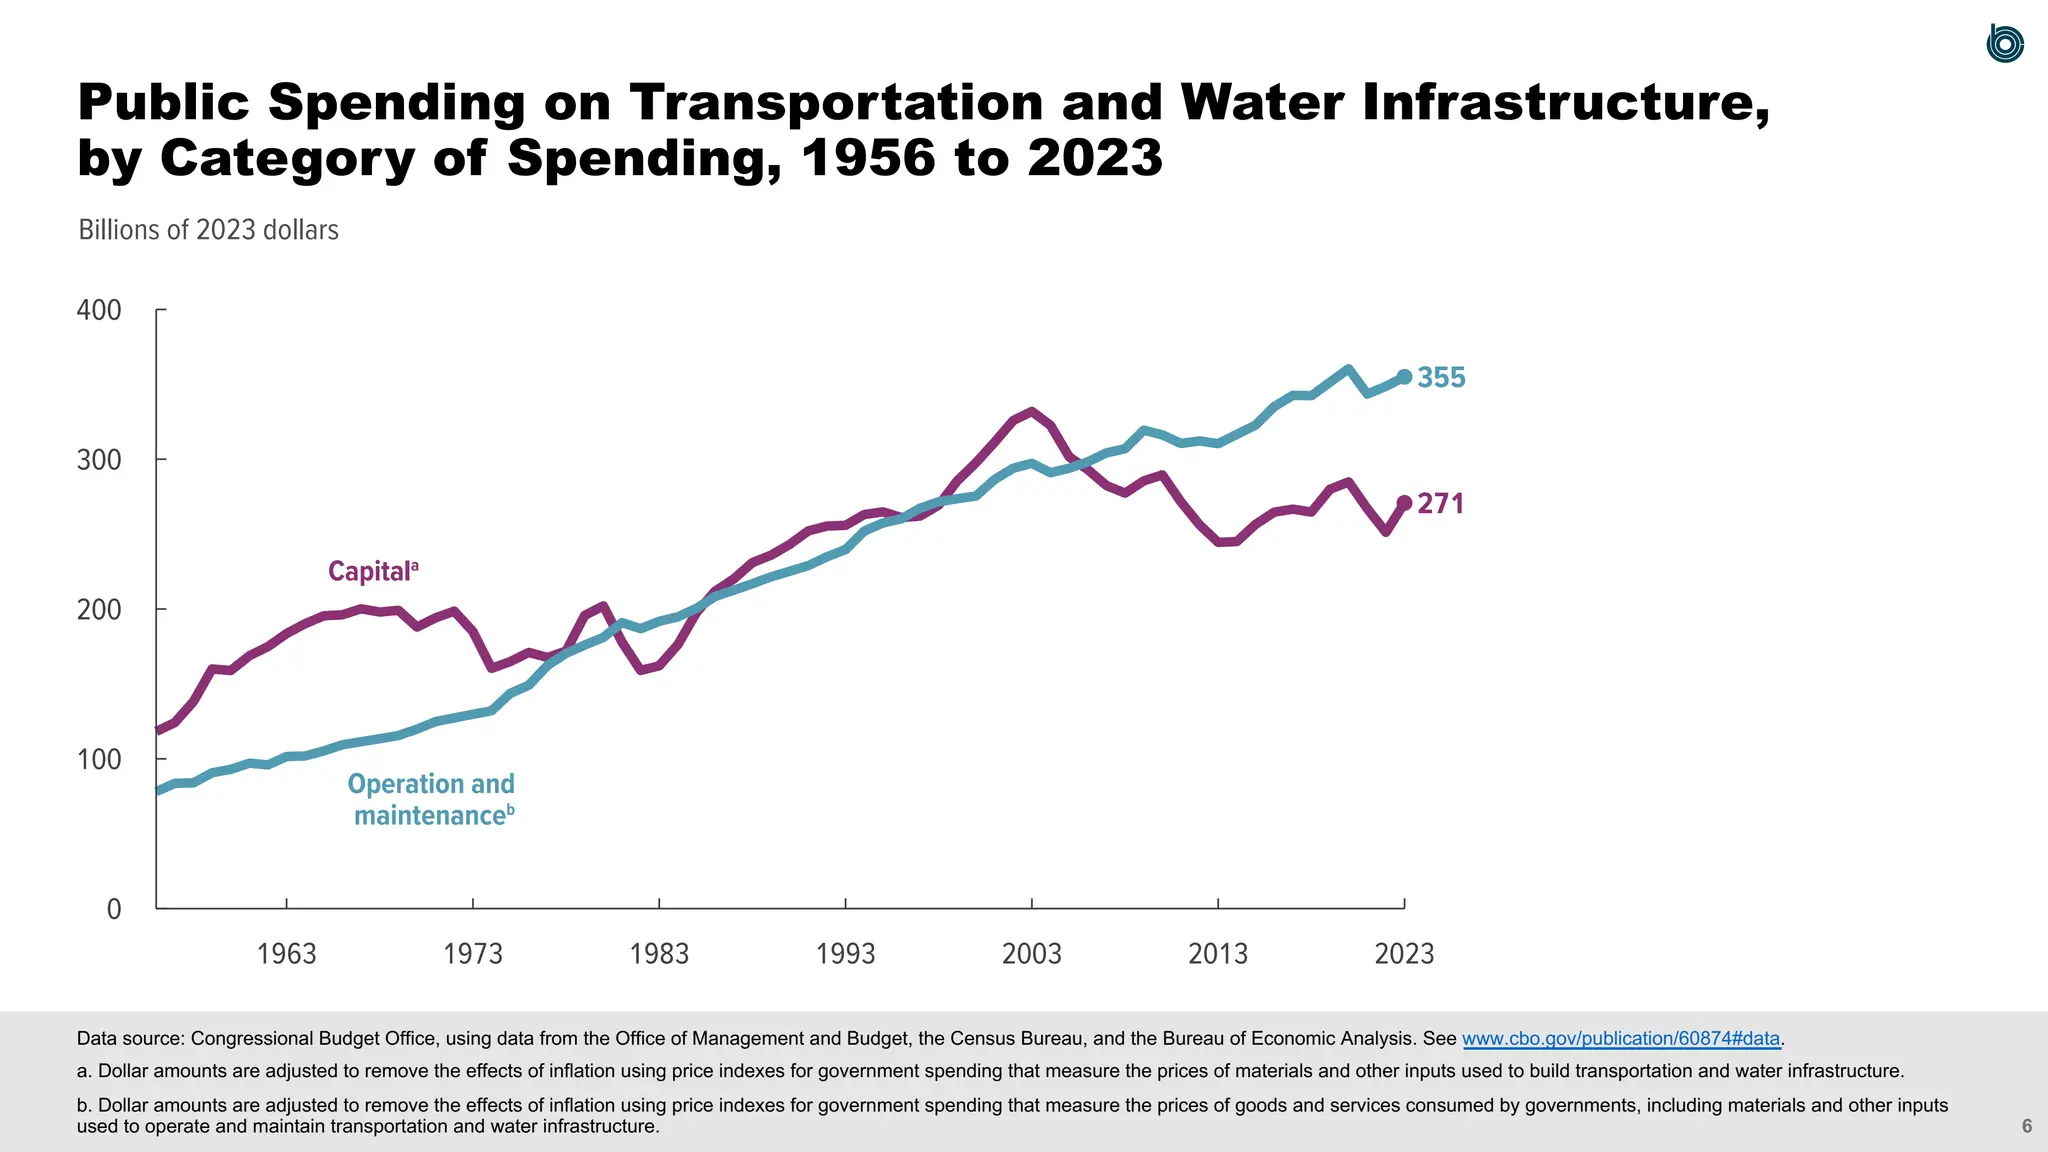
Billions of 2023dollars
Operation and
maintenanceb
Capitala
271
355
0
100
200
300
400
2023
2013
2003
1993
1983
1973
1963
Data source: Congressional Budget Office, using data from the Office of Management and Budget, the Census Bureau, and the Bureau of Economic Analysis. See www.cbo.gov/publication/60874#data.
a. Dollar amounts are adjusted to remove the effects of inflation using price indexes for government spending that measure the prices of materials and other inputs used to build transportation and water infrastructure.
b. Dollar amounts are adjusted to remove the effects of inflation using price indexes for government spending that measure the prices of goods and services consumed by governments, including materials and other inputs
used to operate and maintain transportation and water infrastructure.
Public Spending on Transportation and Water Infrastructure,
by Category of Spending, 1956 to 2023
8.
7
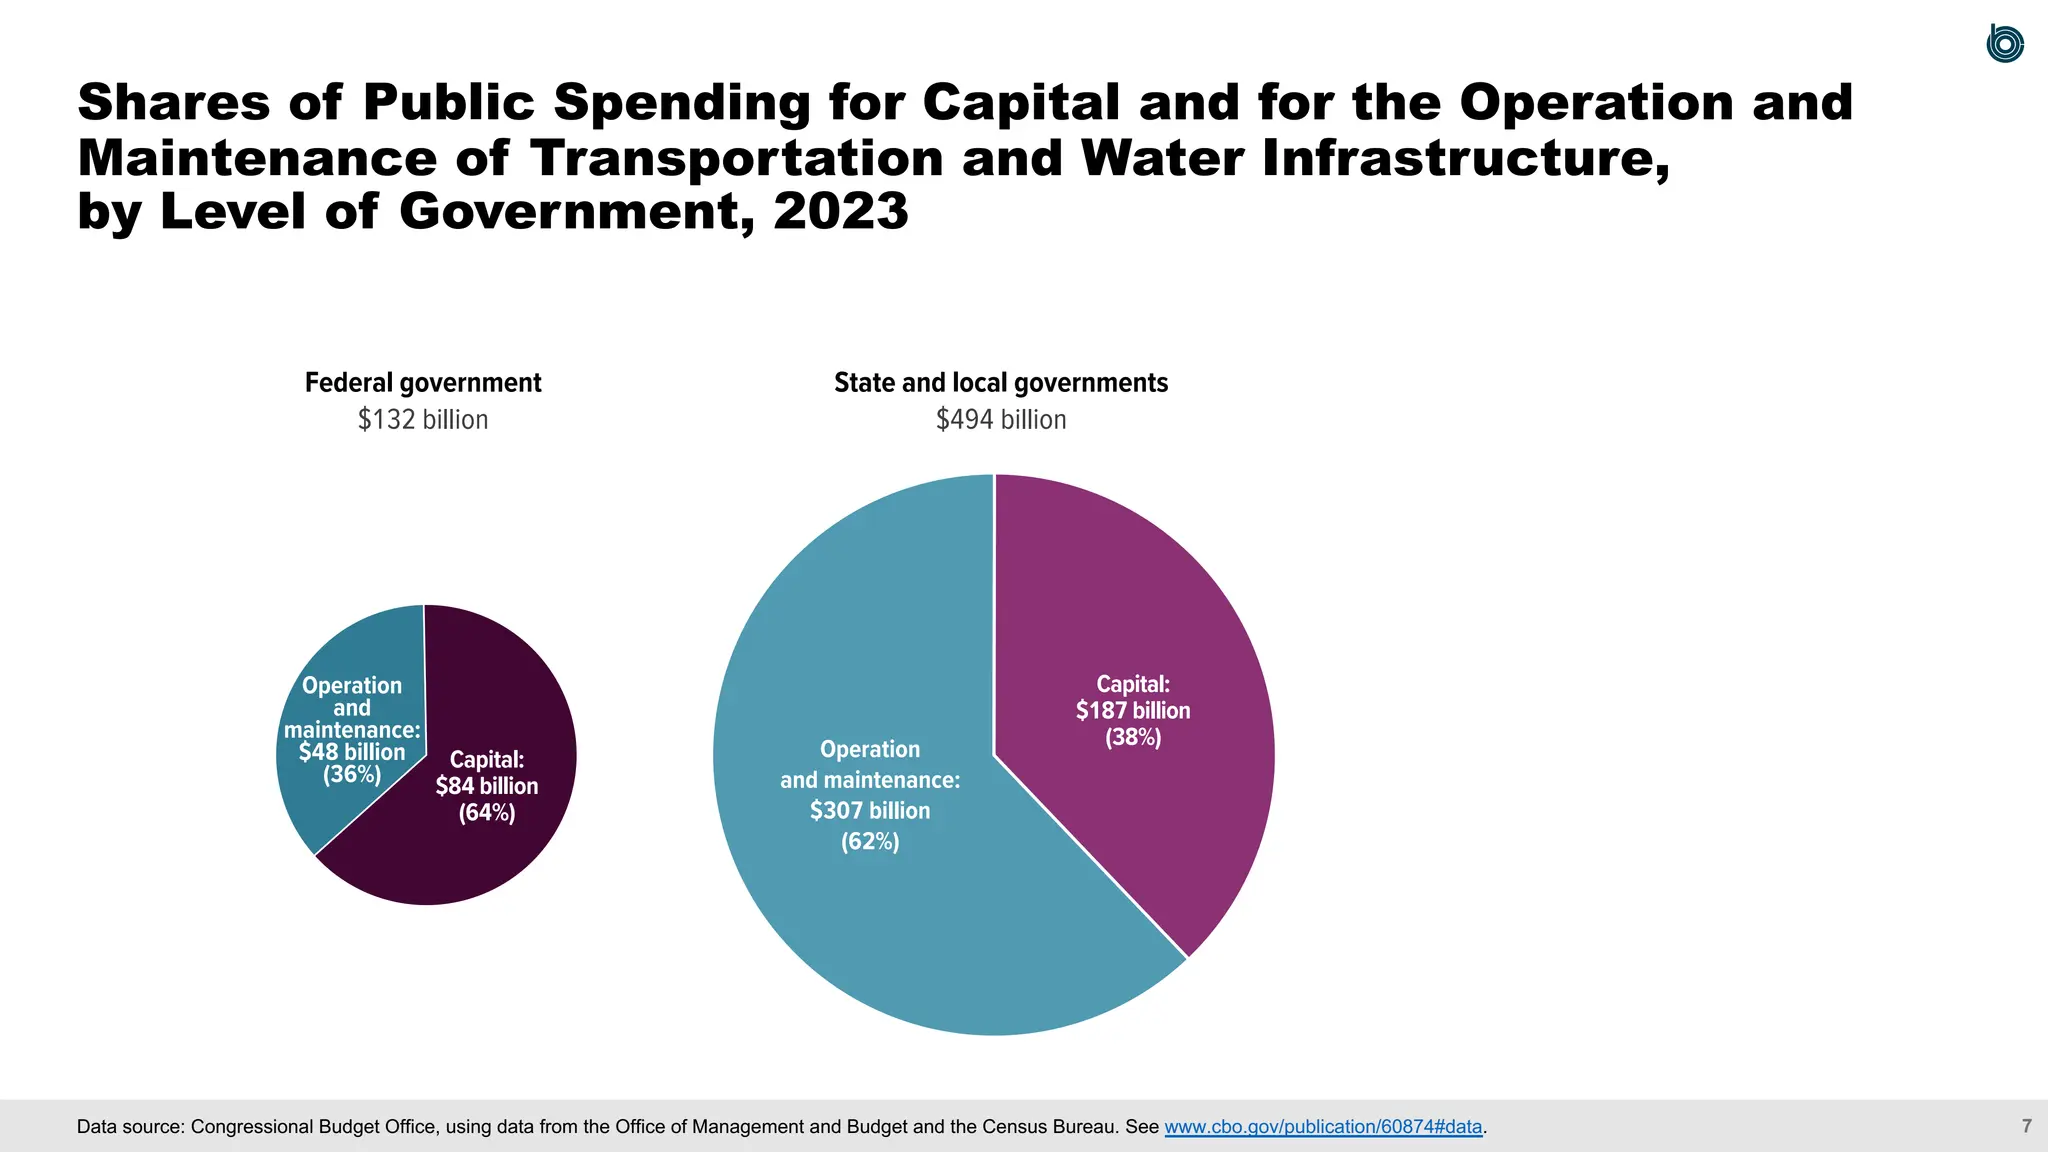
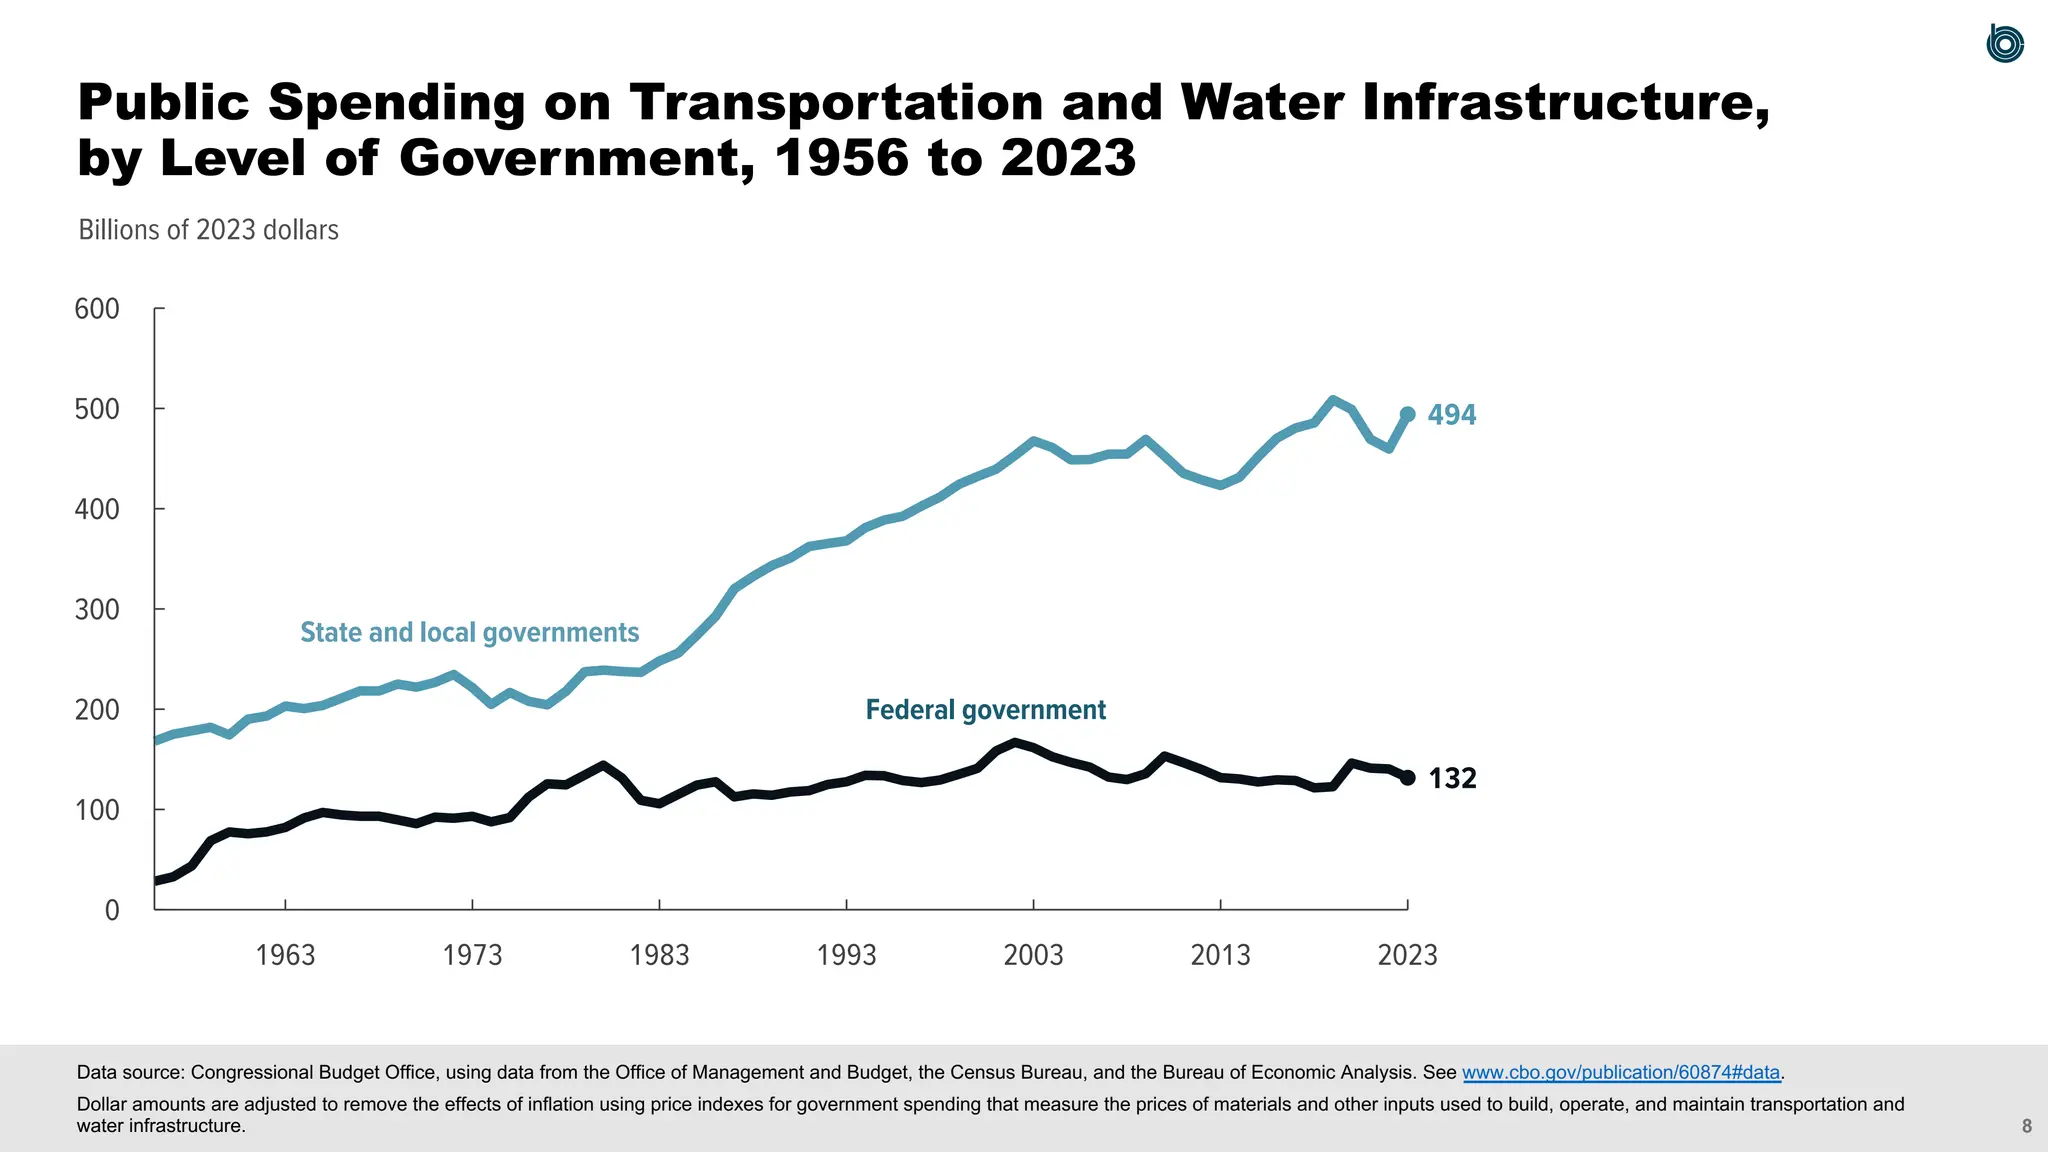
$132 billion
Federal government
$494billion
State and local governments
Operation
and
maintenance:
$48 billion
(36%)
Operation
and maintenance:
$307 billion
(62%)
Capital:
$84 billion
(64%)
Capital:
$187 billion
(38%)
Data source: Congressional Budget Office, using data from the Office of Management and Budget and the Census Bureau. See www.cbo.gov/publication/60874#data.
Shares of Public Spending for Capital and for the Operation and
Maintenance of Transportation and Water Infrastructure,
by Level of Government, 2023
9.
8
Billions of 2023dollars
132
494
0
100
200
300
400
500
600
2023
2013
2003
1993
1983
1973
1963
State and local governments
Federal government
Data source: Congressional Budget Office, using data from the Office of Management and Budget, the Census Bureau, and the Bureau of Economic Analysis. See www.cbo.gov/publication/60874#data.
Dollar amounts are adjusted to remove the effects of inflation using price indexes for government spending that measure the prices of materials and other inputs used to build, operate, and maintain transportation and
water infrastructure.
Public Spending on Transportation and Water Infrastructure,
by Level of Government, 1956 to 2023
10
0
20
40
60
80
100
120
140
160
180
0
1
2
3
4
5
6
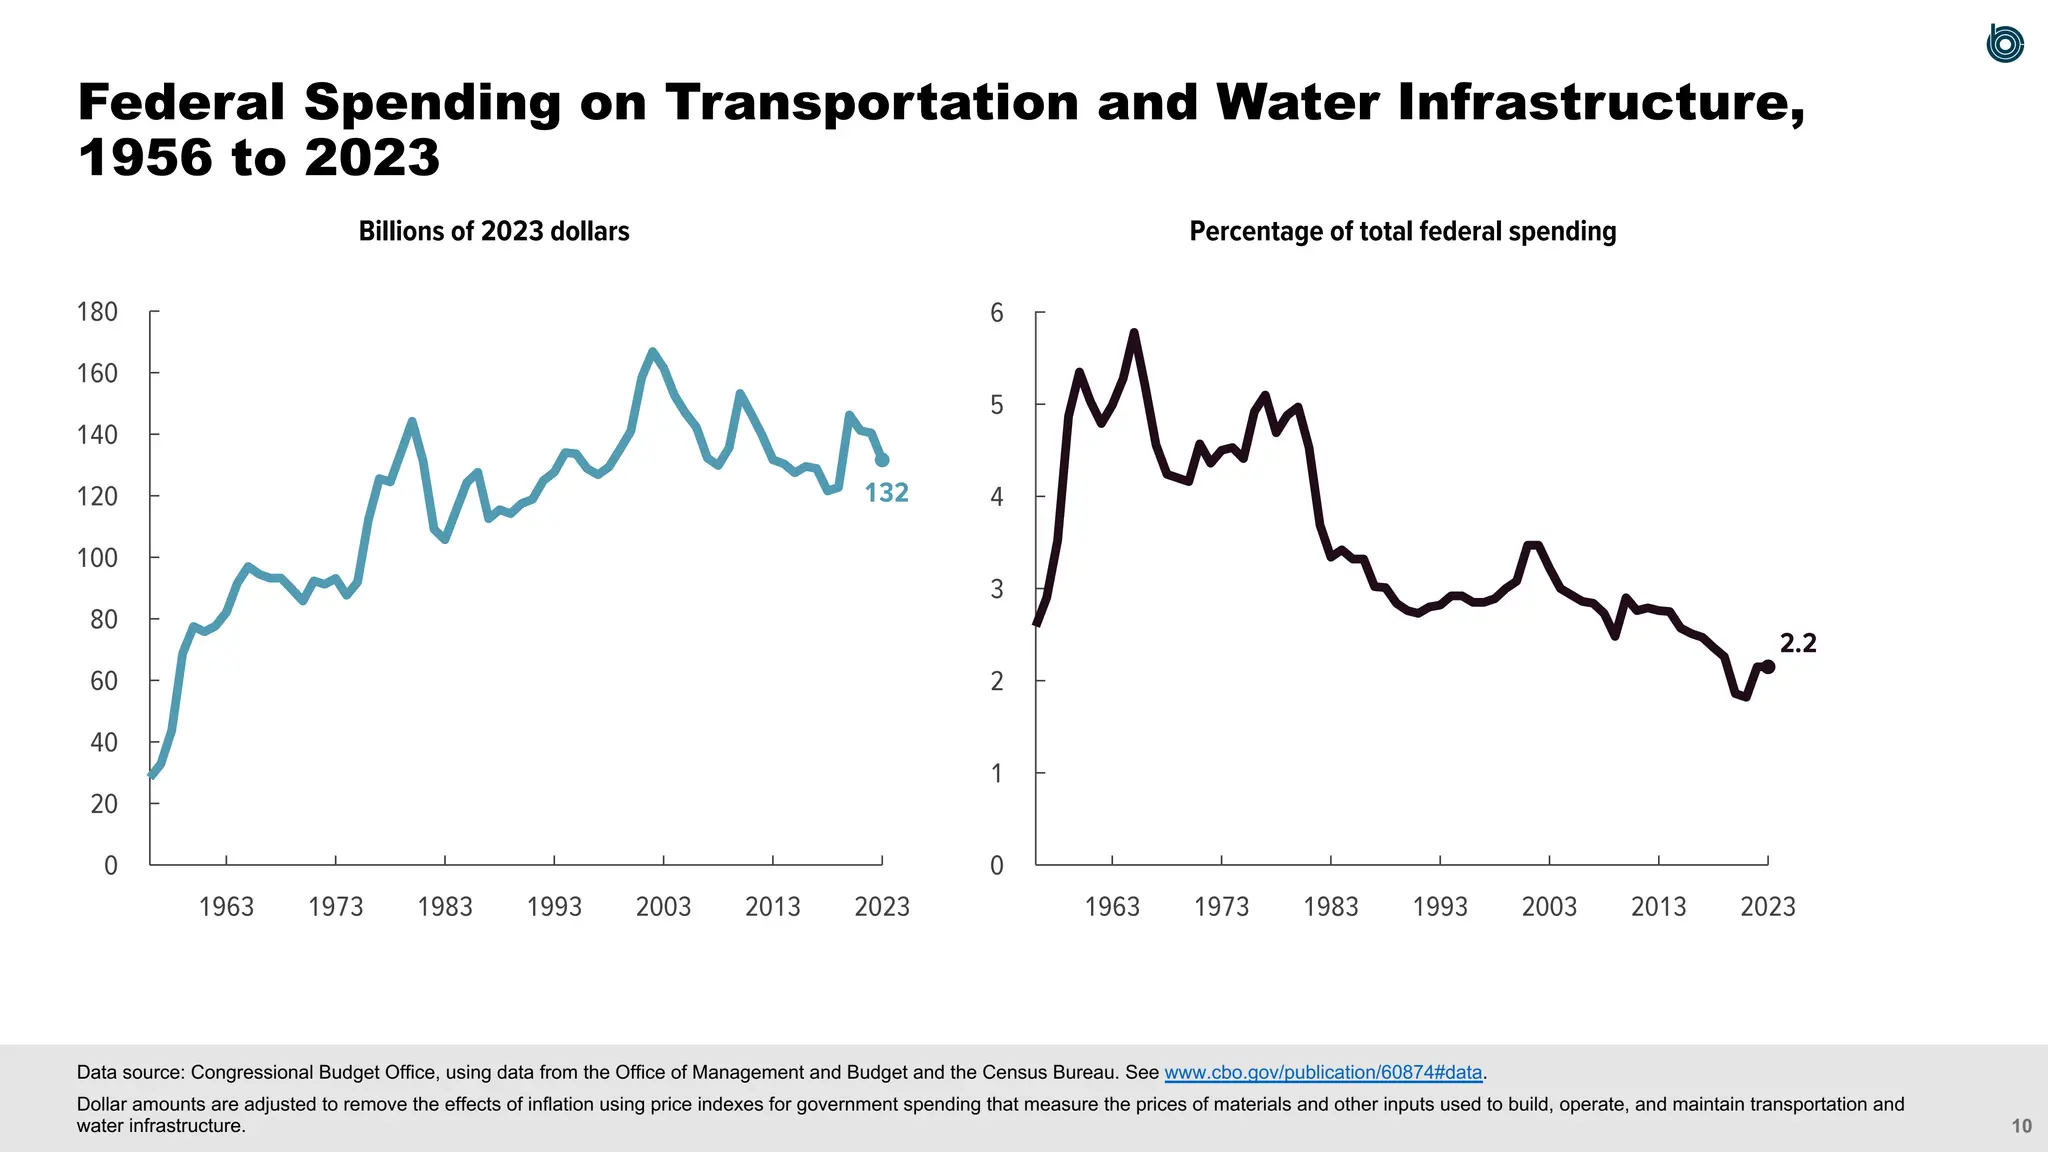
132
2.2
2023
2013
2003
1993
1983
1973
1963 2023
2013
2003
1993
1983
1973
1963
Billions of2023 dollars Percentage of total federal spending
Data source: Congressional Budget Office, using data from the Office of Management and Budget and the Census Bureau. See www.cbo.gov/publication/60874#data.
Dollar amounts are adjusted to remove the effects of inflation using price indexes for government spending that measure the prices of materials and other inputs used to build, operate, and maintain transportation and
water infrastructure.
Federal Spending on Transportation and Water Infrastructure,
1956 to 2023
12.
11
Percent
0
10
20
30
40
50
60
70
0
10
20
30
40
50
60
70
0
10
20
30
40
50
60
70
0
10
20
30
40
50
60
70
0
10
20
30
40
50
60
70
0
10
20
30
40
50
60
70
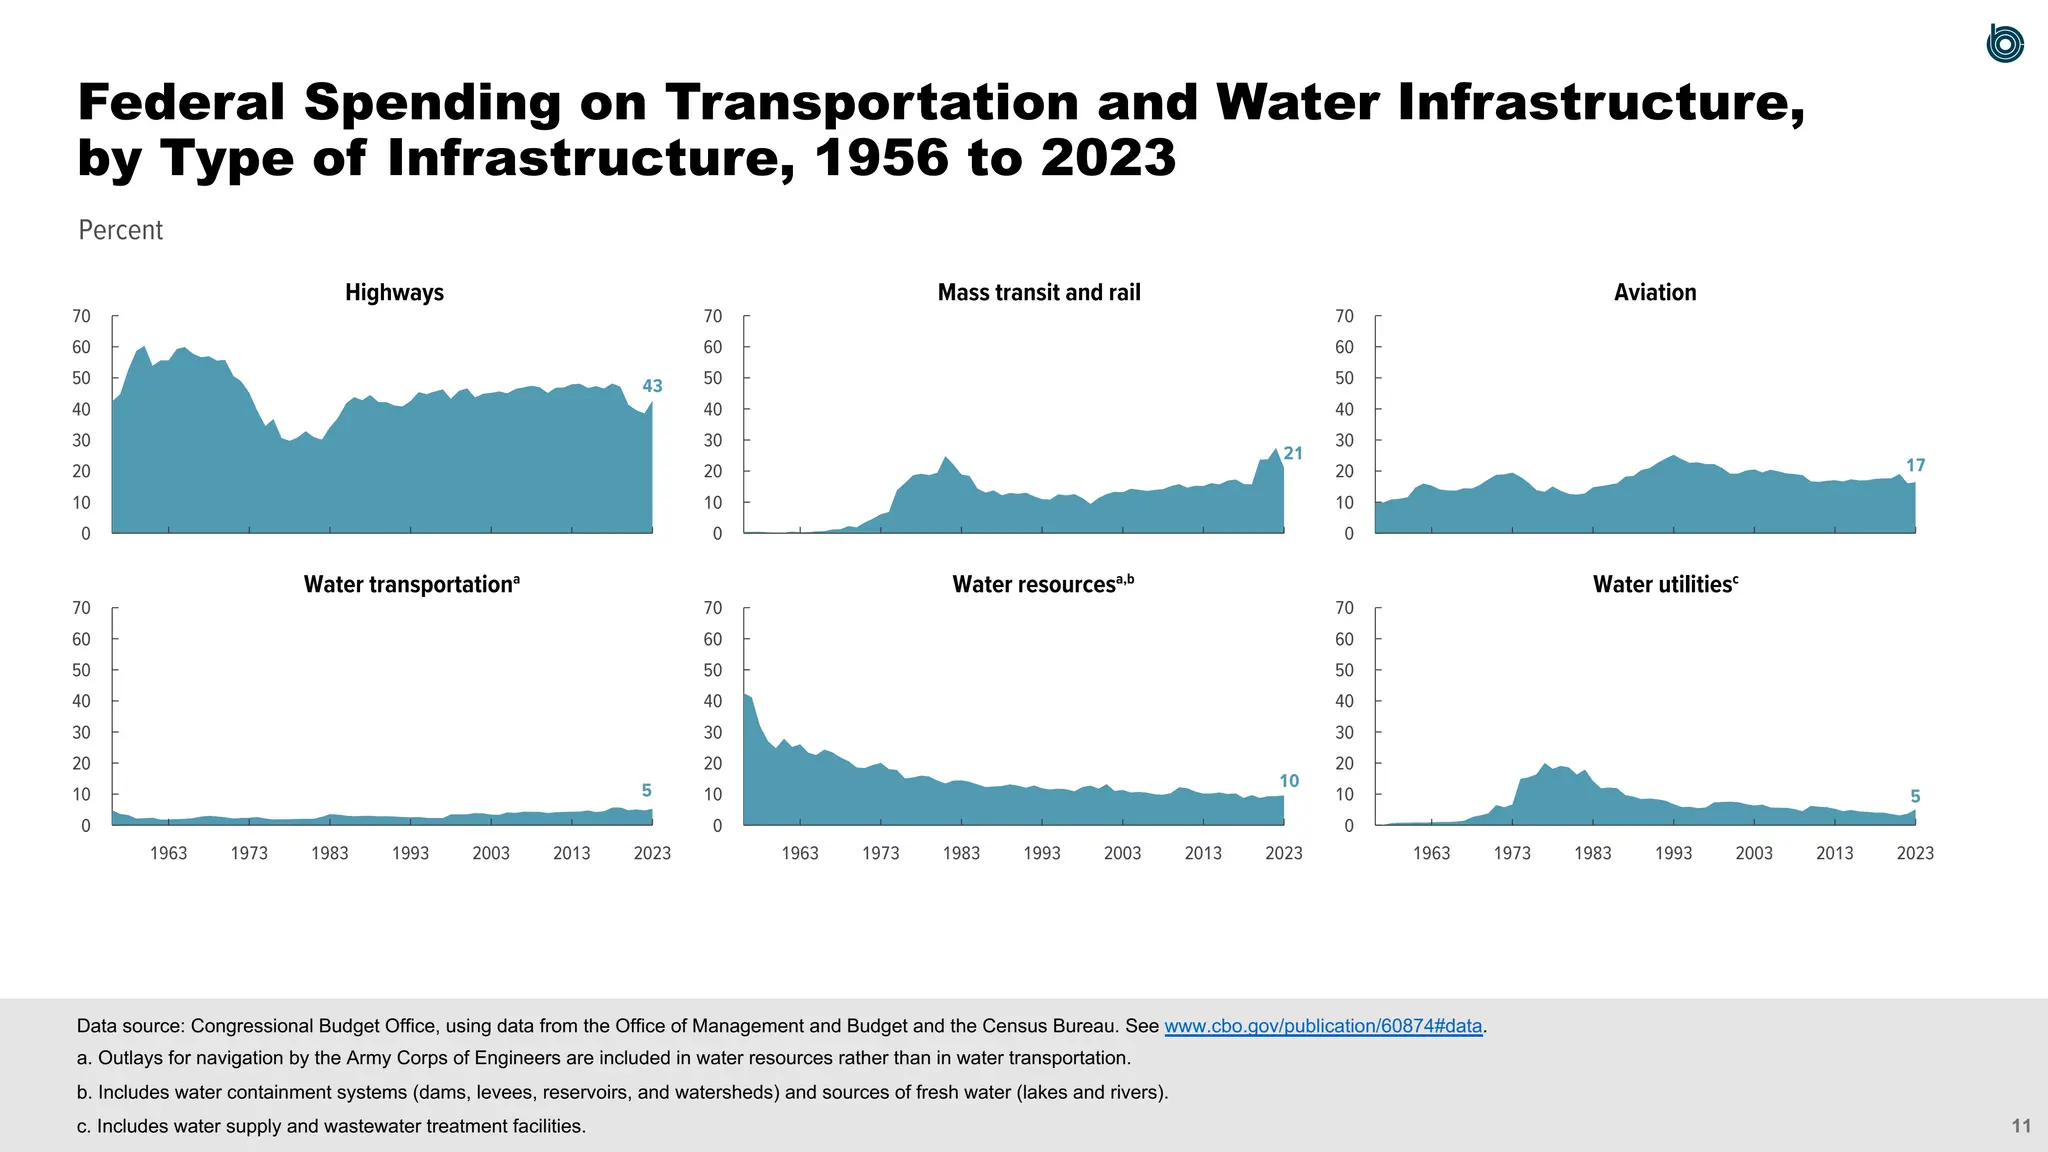
Highways Mass transitand rail Aviation
Water transportationa
Water resourcesa,b
Water utilitiesc
43
21
17
5
10
5
2023
2013
2003
1993
1983
1973
1963 2023
2013
2003
1993
1983
1973
1963 2023
2013
2003
1993
1983
1973
1963
Data source: Congressional Budget Office, using data from the Office of Management and Budget and the Census Bureau. See www.cbo.gov/publication/60874#data.
a. Outlays for navigation by the Army Corps of Engineers are included in water resources rather than in water transportation.
b. Includes water containment systems (dams, levees, reservoirs, and watersheds) and sources of fresh water (lakes and rivers).
c. Includes water supply and wastewater treatment facilities.
Federal Spending on Transportation and Water Infrastructure,
by Type of Infrastructure, 1956 to 2023
13.
12
Billions of 2023dollars
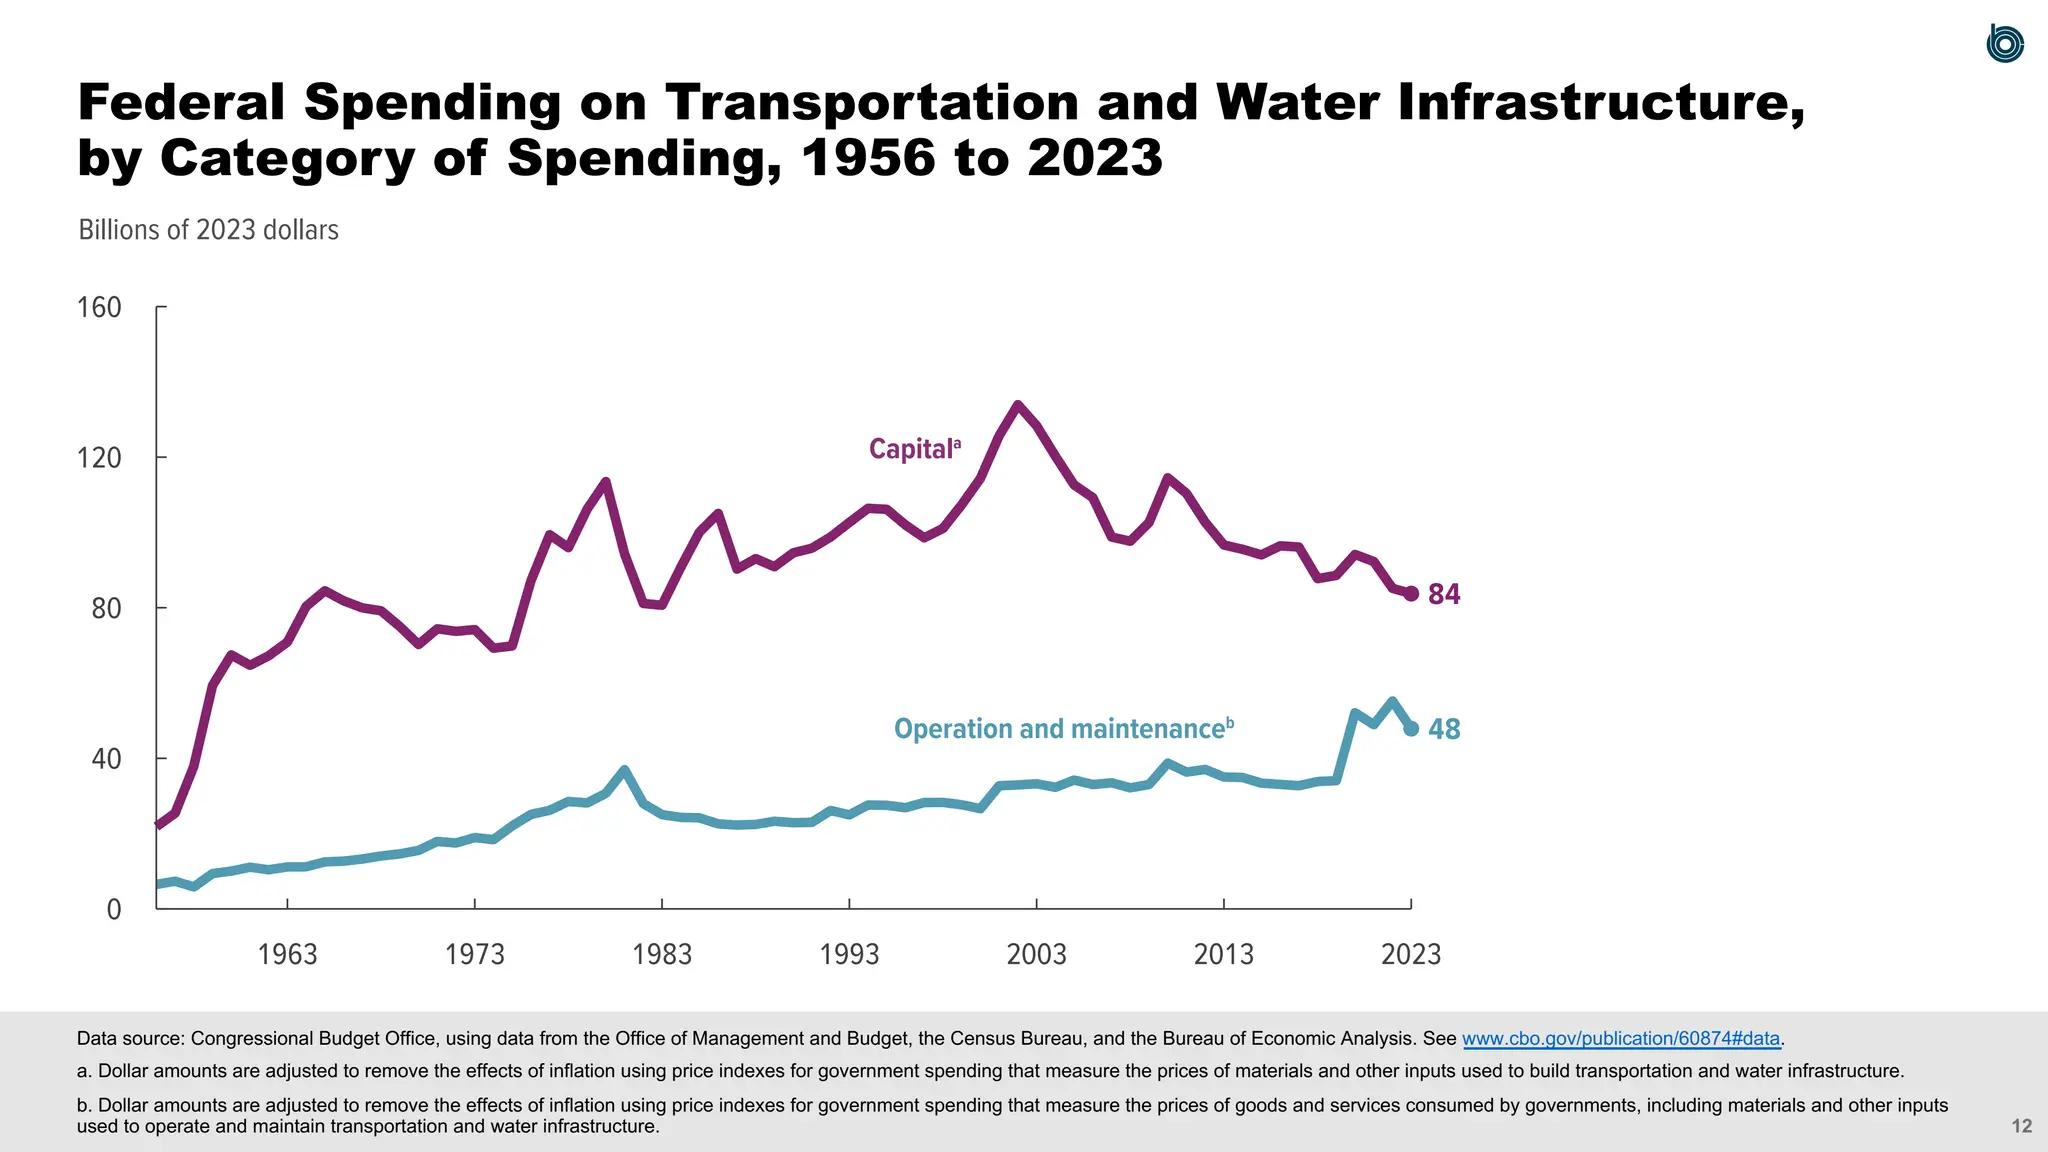
84
48
0
40
80
120
160
2023
2013
2003
1993
1983
1973
1963
Operation and maintenanceb
Capitala
Data source: Congressional Budget Office, using data from the Office of Management and Budget, the Census Bureau, and the Bureau of Economic Analysis. See www.cbo.gov/publication/60874#data.
a. Dollar amounts are adjusted to remove the effects of inflation using price indexes for government spending that measure the prices of materials and other inputs used to build transportation and water infrastructure.
b. Dollar amounts are adjusted to remove the effects of inflation using price indexes for government spending that measure the prices of goods and services consumed by governments, including materials and other inputs
used to operate and maintain transportation and water infrastructure.
Federal Spending on Transportation and Water Infrastructure,
by Category of Spending, 1956 to 2023
14
Billions of 2023dollars
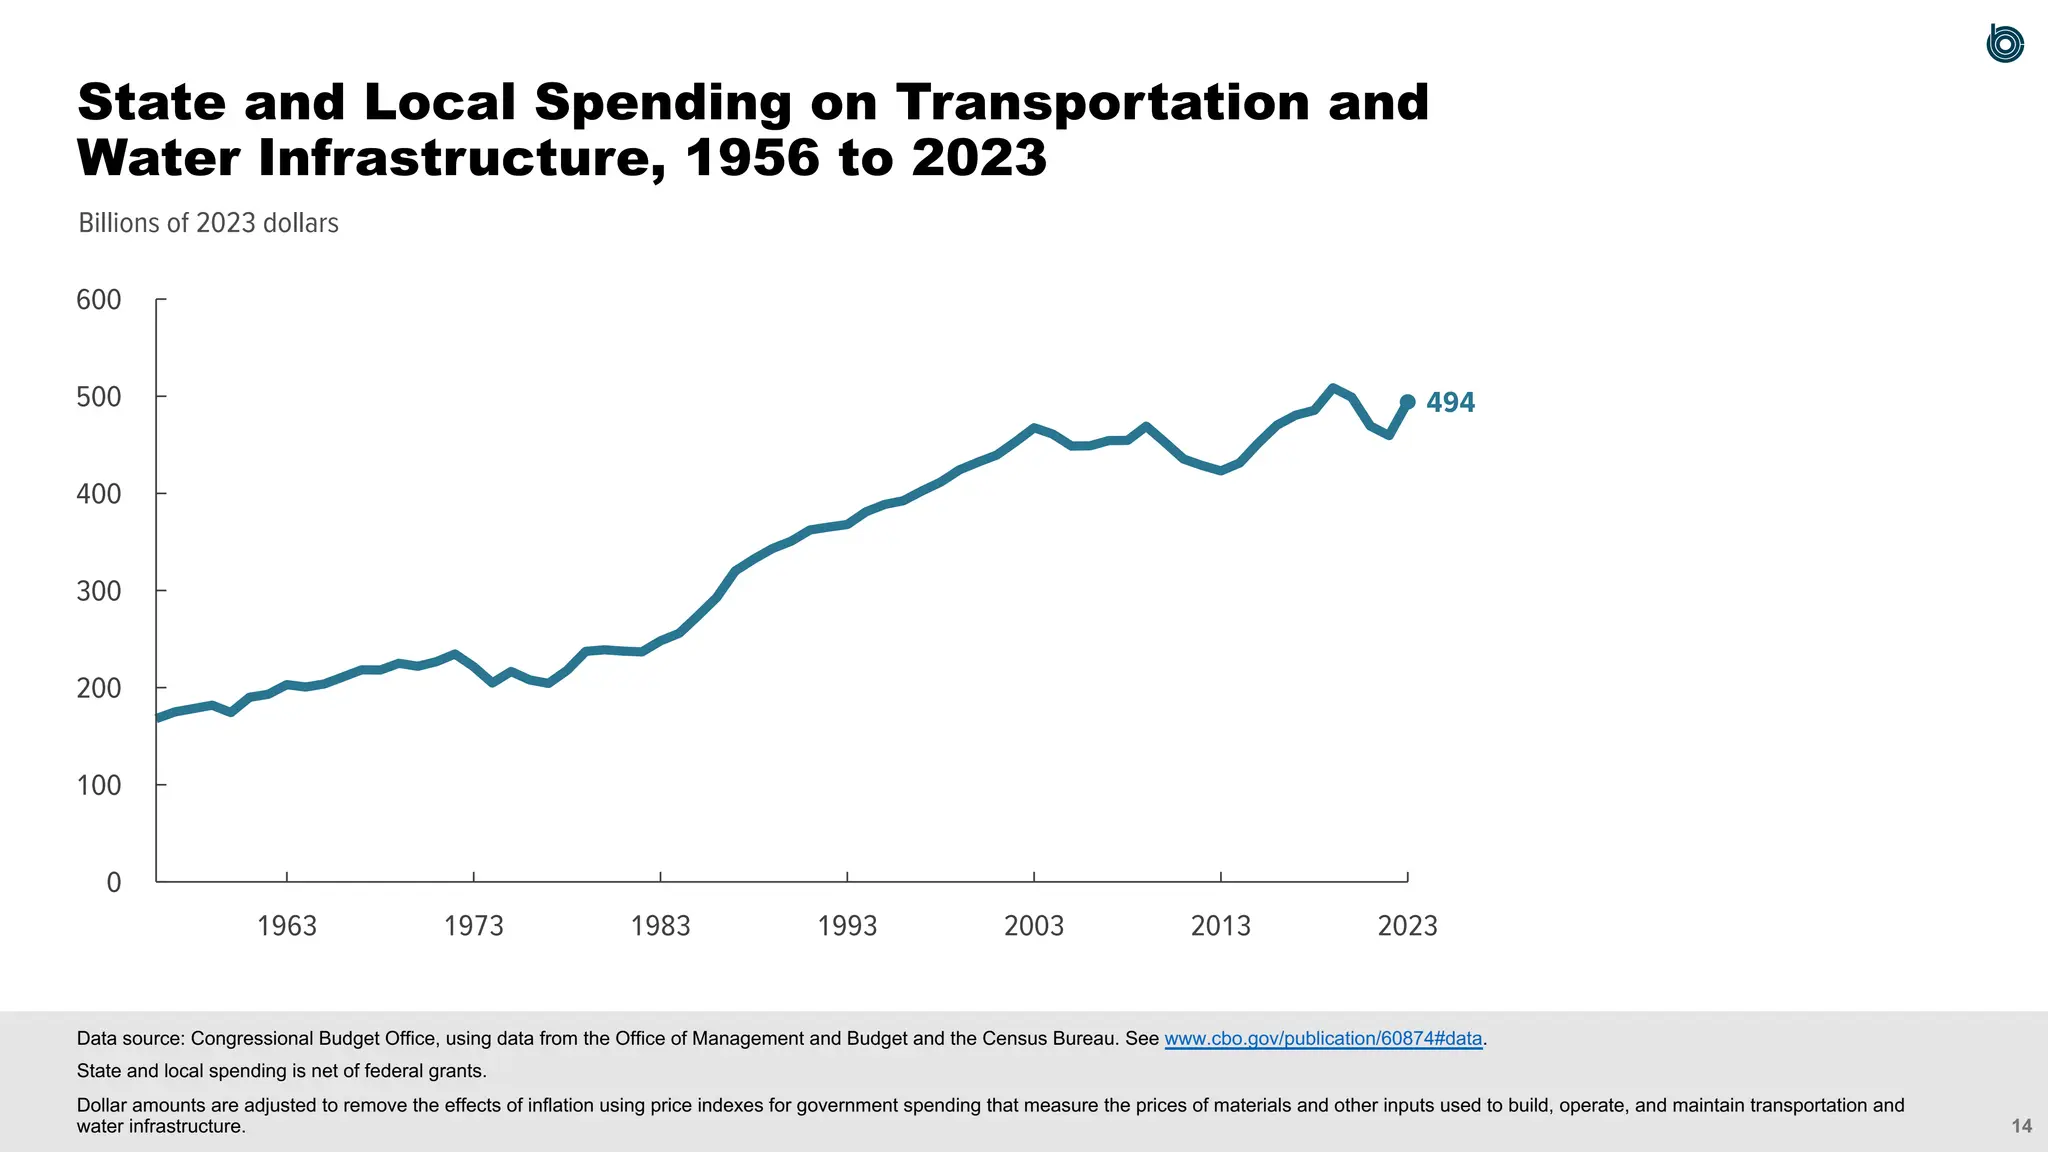
494
0
100
200
300
400
500
600
2023
2013
2003
1993
1983
1973
1963
Data source: Congressional Budget Office, using data from the Office of Management and Budget and the Census Bureau. See www.cbo.gov/publication/60874#data.
State and local spending is net of federal grants.
Dollar amounts are adjusted to remove the effects of inflation using price indexes for government spending that measure the prices of materials and other inputs used to build, operate, and maintain transportation and
water infrastructure.
State and Local Spending on Transportation and
Water Infrastructure, 1956 to 2023
16.
15
Percent
0
10
20
30
40
50
60
70
0
10
20
30
40
50
60
70
0
10
20
30
40
50
60
70
0
10
20
30
40
50
60
70
0
10
20
30
40
50
60
70
0
10
20
30
40
50
60
70
Highways Mass transitand rail Aviation
Water transportation Water resourcesa
Water utilitiesb
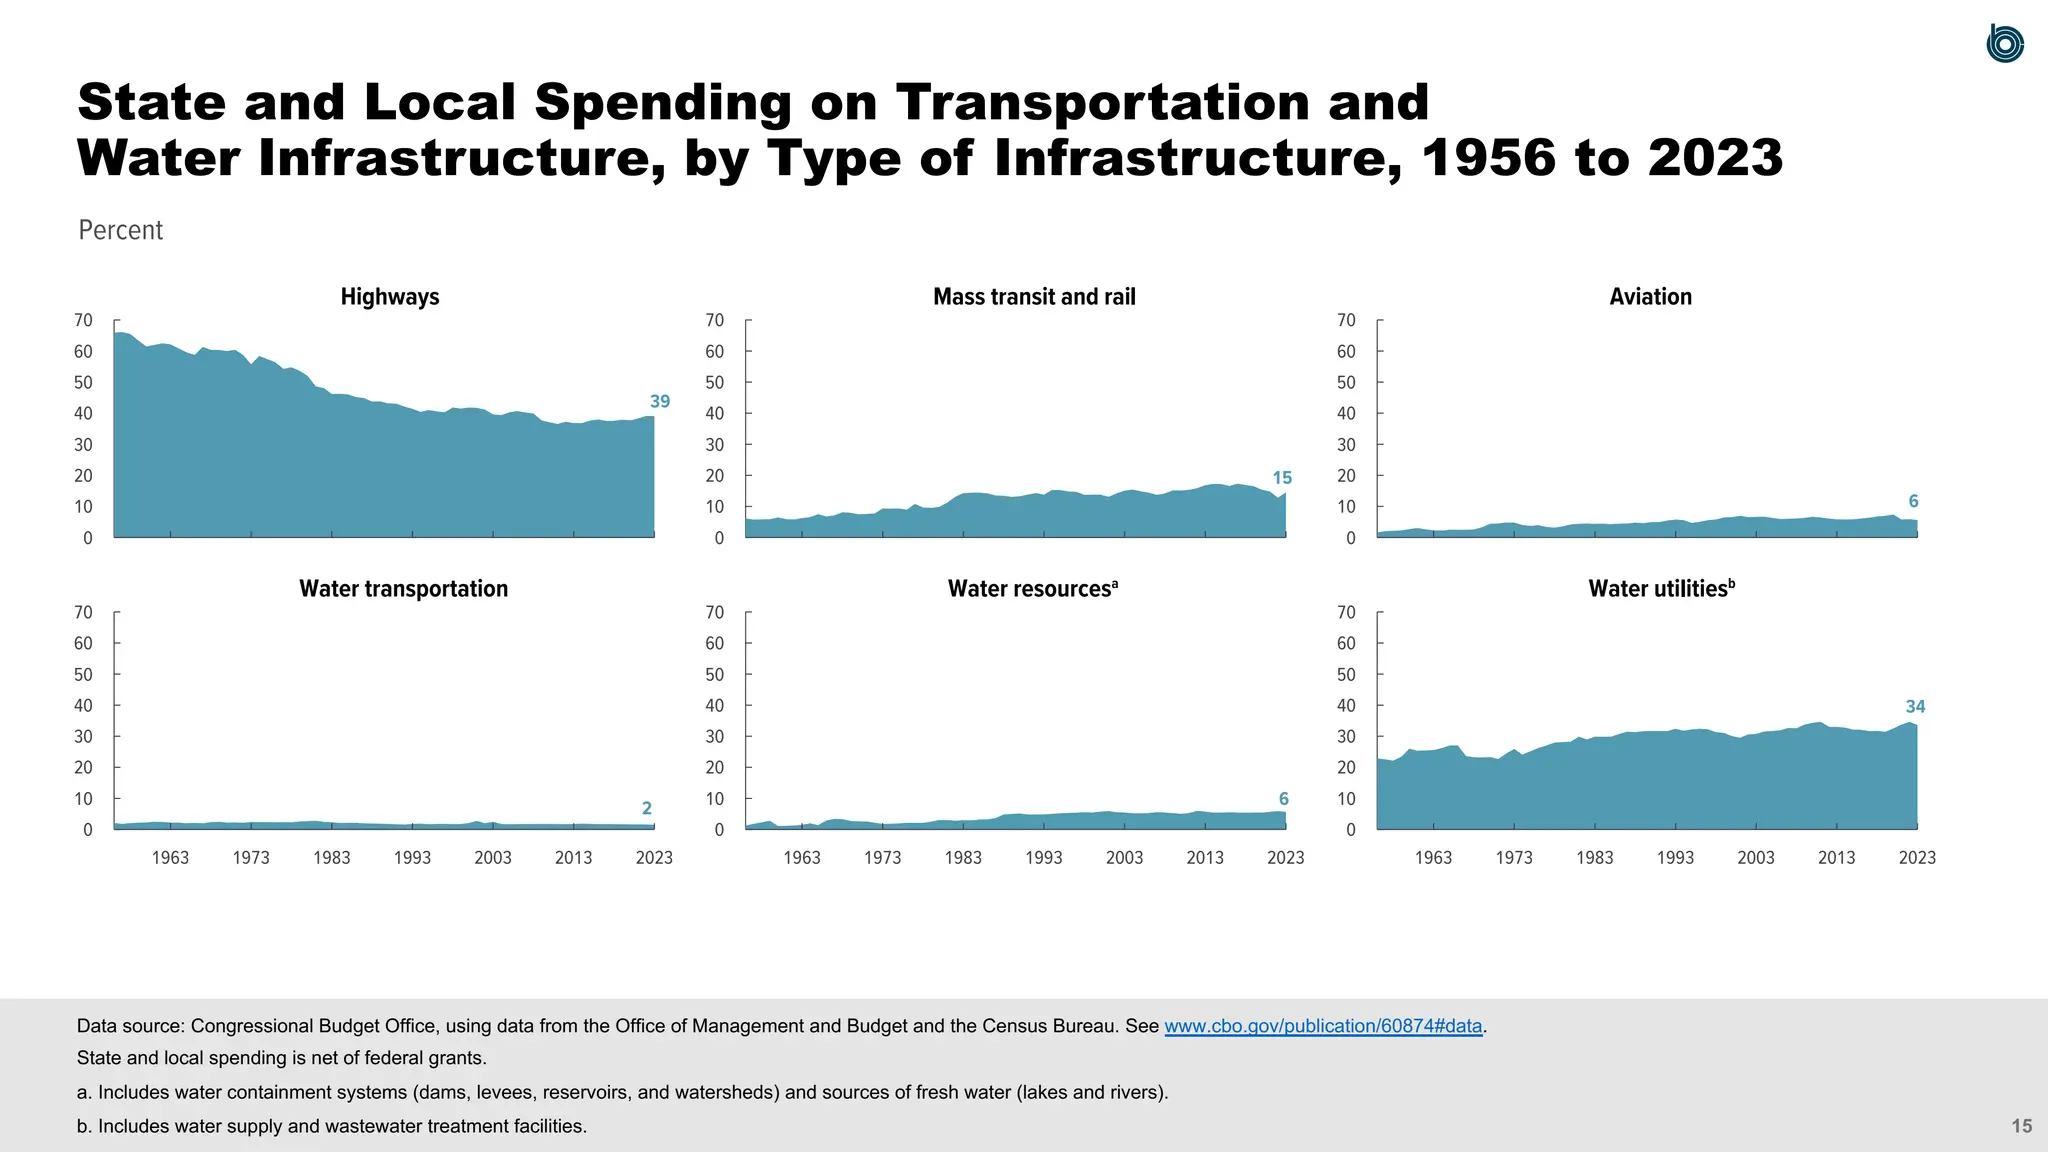
39
15
6
2 6
34
2023
2013
2003
1993
1983
1973
1963 2023
2013
2003
1993
1983
1973
1963 2023
2013
2003
1993
1983
1973
1963
Data source: Congressional Budget Office, using data from the Office of Management and Budget and the Census Bureau. See www.cbo.gov/publication/60874#data.
State and local spending is net of federal grants.
a. Includes water containment systems (dams, levees, reservoirs, and watersheds) and sources of fresh water (lakes and rivers).
b. Includes water supply and wastewater treatment facilities.
State and Local Spending on Transportation and
Water Infrastructure, by Type of Infrastructure, 1956 to 2023
17.
16
Billions of 2023dollars
Operation and maintenanceb
Capitala
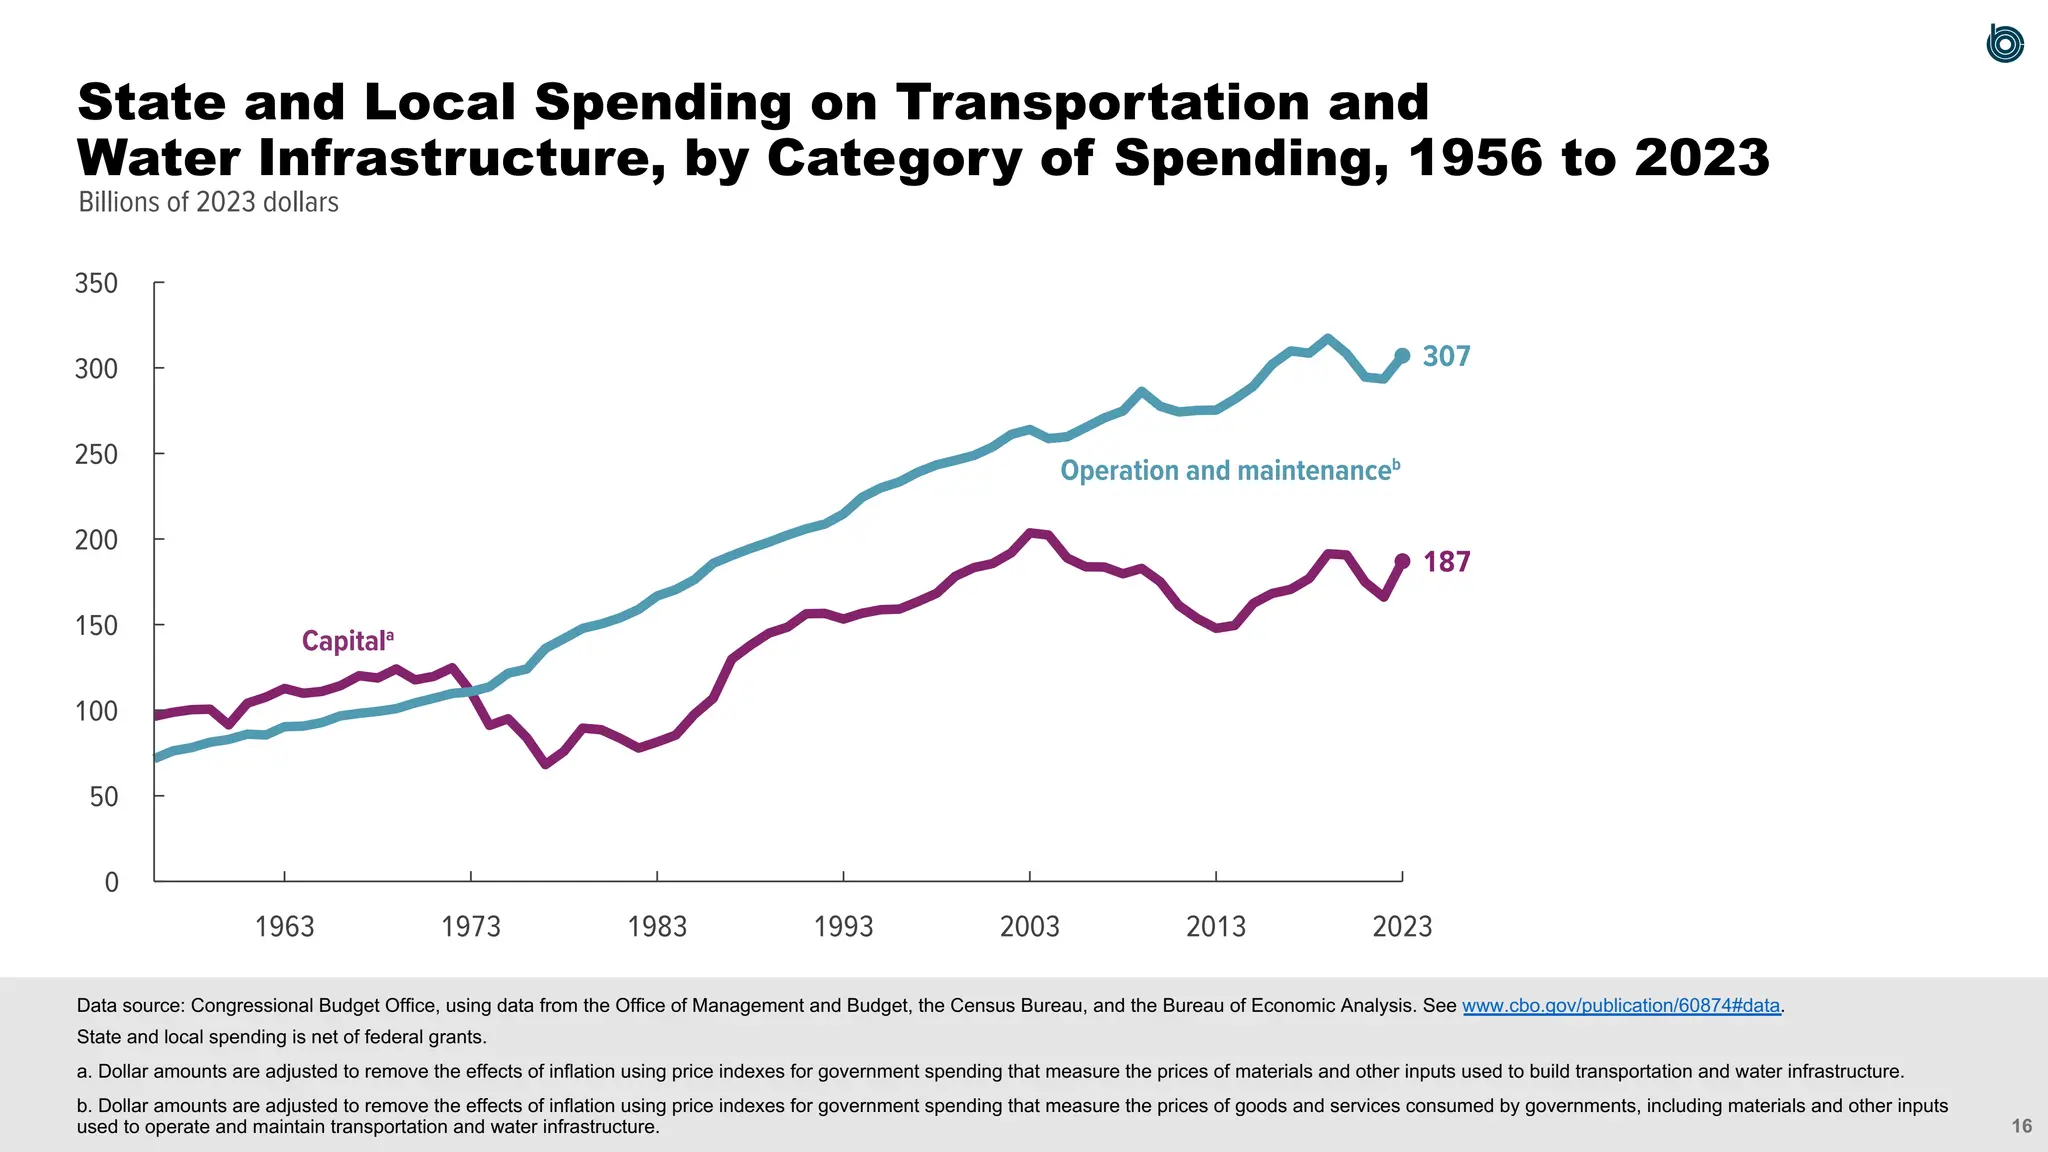
187
307
0
50
100
150
200
250
300
350
2023
2013
2003
1993
1983
1973
1963
Data source: Congressional Budget Office, using data from the Office of Management and Budget, the Census Bureau, and the Bureau of Economic Analysis. See www.cbo.gov/publication/60874#data.
State and local spending is net of federal grants.
a. Dollar amounts are adjusted to remove the effects of inflation using price indexes for government spending that measure the prices of materials and other inputs used to build transportation and water infrastructure.
b. Dollar amounts are adjusted to remove the effects of inflation using price indexes for government spending that measure the prices of goods and services consumed by governments, including materials and other inputs
used to operate and maintain transportation and water infrastructure.
State and Local Spending on Transportation and
Water Infrastructure, by Category of Spending, 1956 to 2023
18.
17
0
50
100
150
200
250
300
350
0
10
20
30
40
50
60
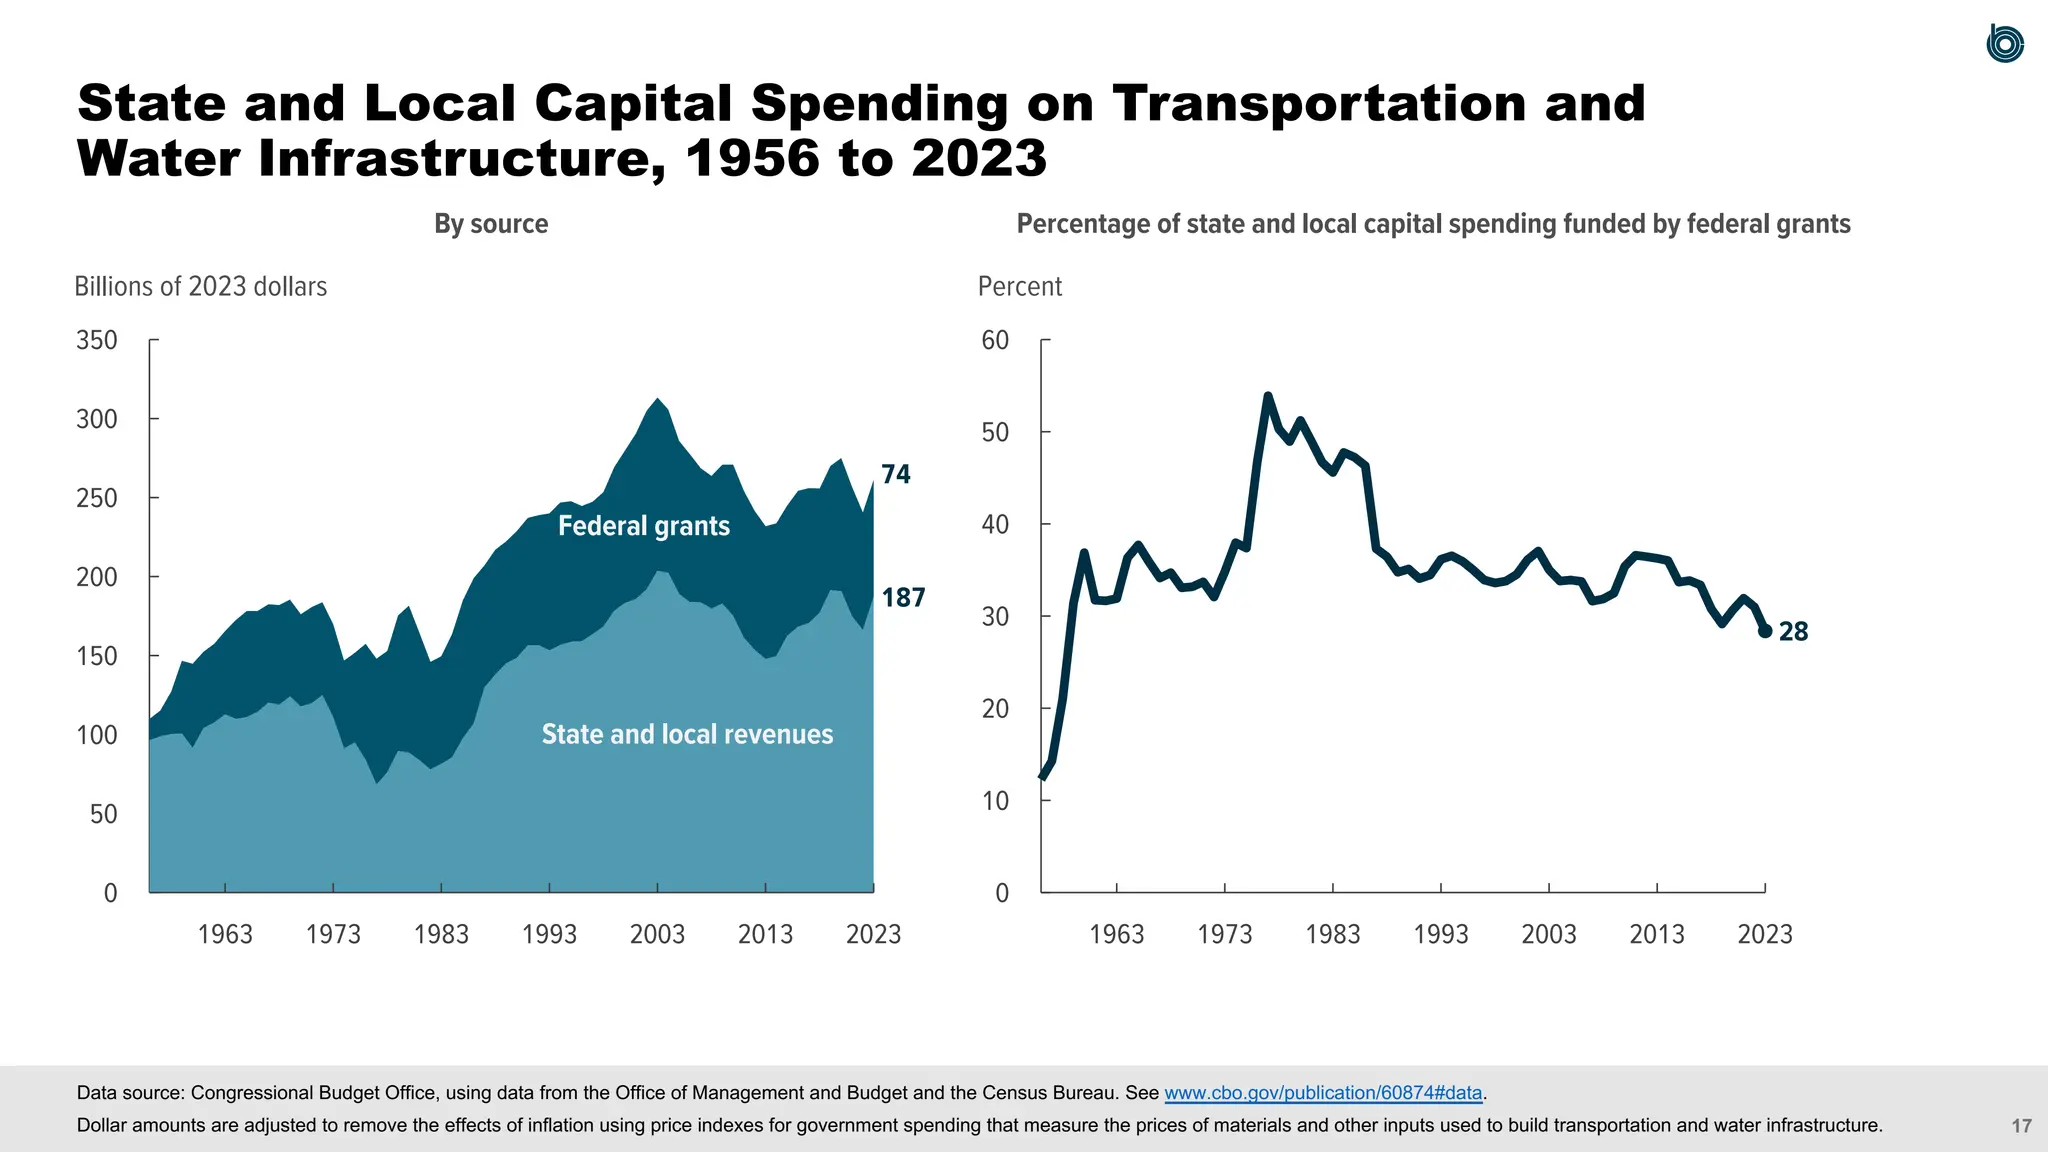
28
74
187
2023
2013
2003
1993
1983
1973
1963 2023
2013
2003
1993
1983
1973
1963
By sourcePercentage of state and local capital spending funded by federal grants
State and local revenues
Federal grants
Billions of 2023 dollars Percent
Data source: Congressional Budget Office, using data from the Office of Management and Budget and the Census Bureau. See www.cbo.gov/publication/60874#data.
Dollar amounts are adjusted to remove the effects of inflation using price indexes for government spending that measure the prices of materials and other inputs used to build transportation and water infrastructure.
State and Local Capital Spending on Transportation and
Water Infrastructure, 1956 to 2023
19.
18
Public Spending onTransportation
and Water Infrastructure,
by Type of Infrastructure
20.
19
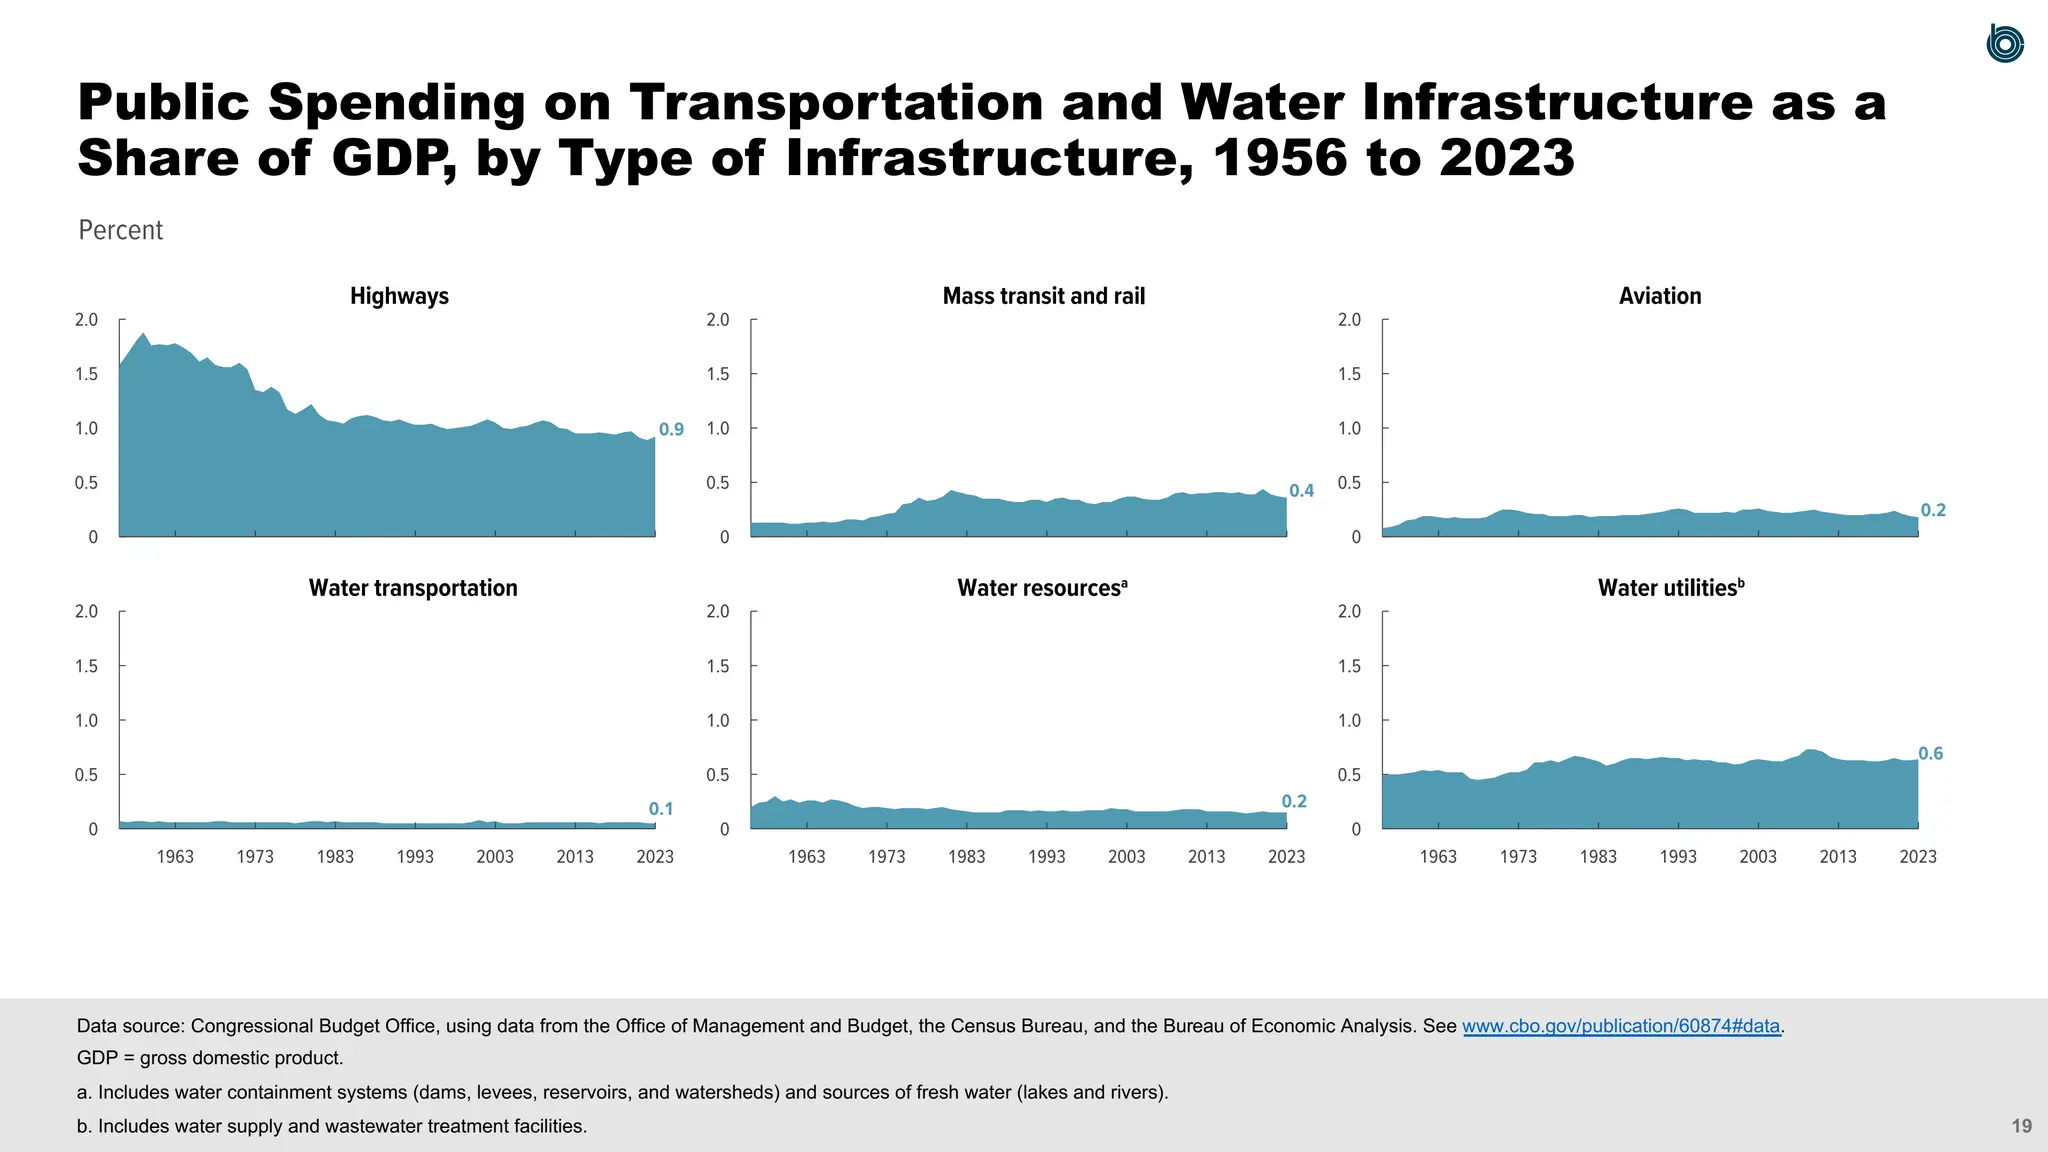
Percent
0
0.5
1.0
1.5
2.0
0
0.5
1.0
1.5
2.0
0
0.5
1.0
1.5
2.0
0
0.5
1.0
1.5
2.0
0
0.5
1.0
1.5
2.0
0
0.5
1.0
1.5
2.0
Highways Mass transitand rail Aviation
Water transportation Water resourcesa
Water utilitiesb
0.9
0.4
0.2
0.1 0.2
0.6
2023
2013
2003
1993
1983
1973
1963 2023
2013
2003
1993
1983
1973
1963 2023
2013
2003
1993
1983
1973
1963
Data source: Congressional Budget Office, using data from the Office of Management and Budget, the Census Bureau, and the Bureau of Economic Analysis. See www.cbo.gov/publication/60874#data.
GDP = gross domestic product.
a. Includes water containment systems (dams, levees, reservoirs, and watersheds) and sources of fresh water (lakes and rivers).
b. Includes water supply and wastewater treatment facilities.
Public Spending on Transportation and Water Infrastructure as a
Share of GDP, by Type of Infrastructure, 1956 to 2023
21.
20
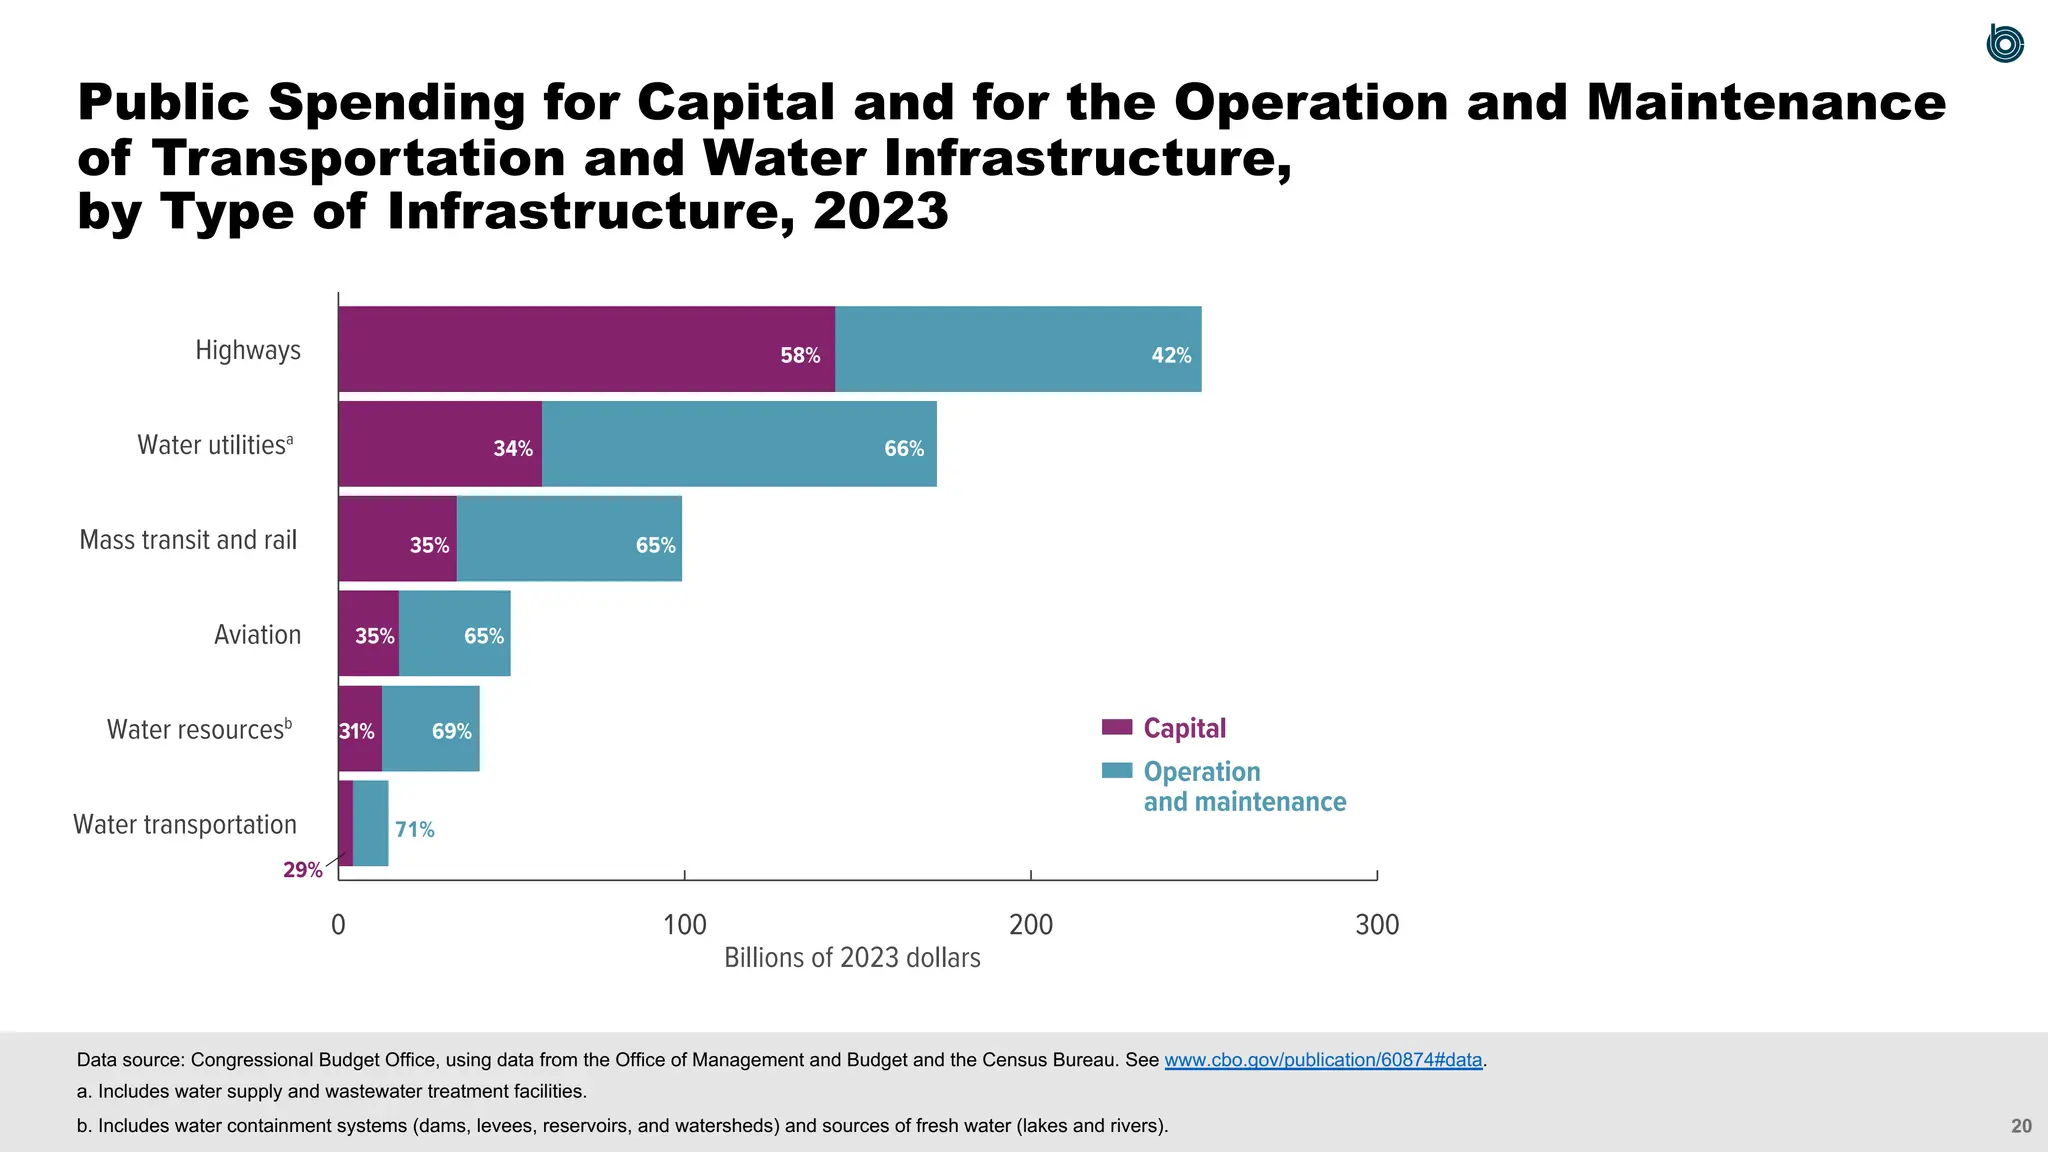
Water transportation
Water resourcesb
Aviation
Masstransit and rail
Water utilitiesa
Highways
0 100 200 300
Billions of 2023 dollars
Operation
and maintenance
Capital
58%
34% 66%
65%
35%
35% 65%
69%
71%
29%
31%
42%
Data source: Congressional Budget Office, using data from the Office of Management and Budget and the Census Bureau. See www.cbo.gov/publication/60874#data.
a. Includes water supply and wastewater treatment facilities.
b. Includes water containment systems (dams, levees, reservoirs, and watersheds) and sources of fresh water (lakes and rivers).
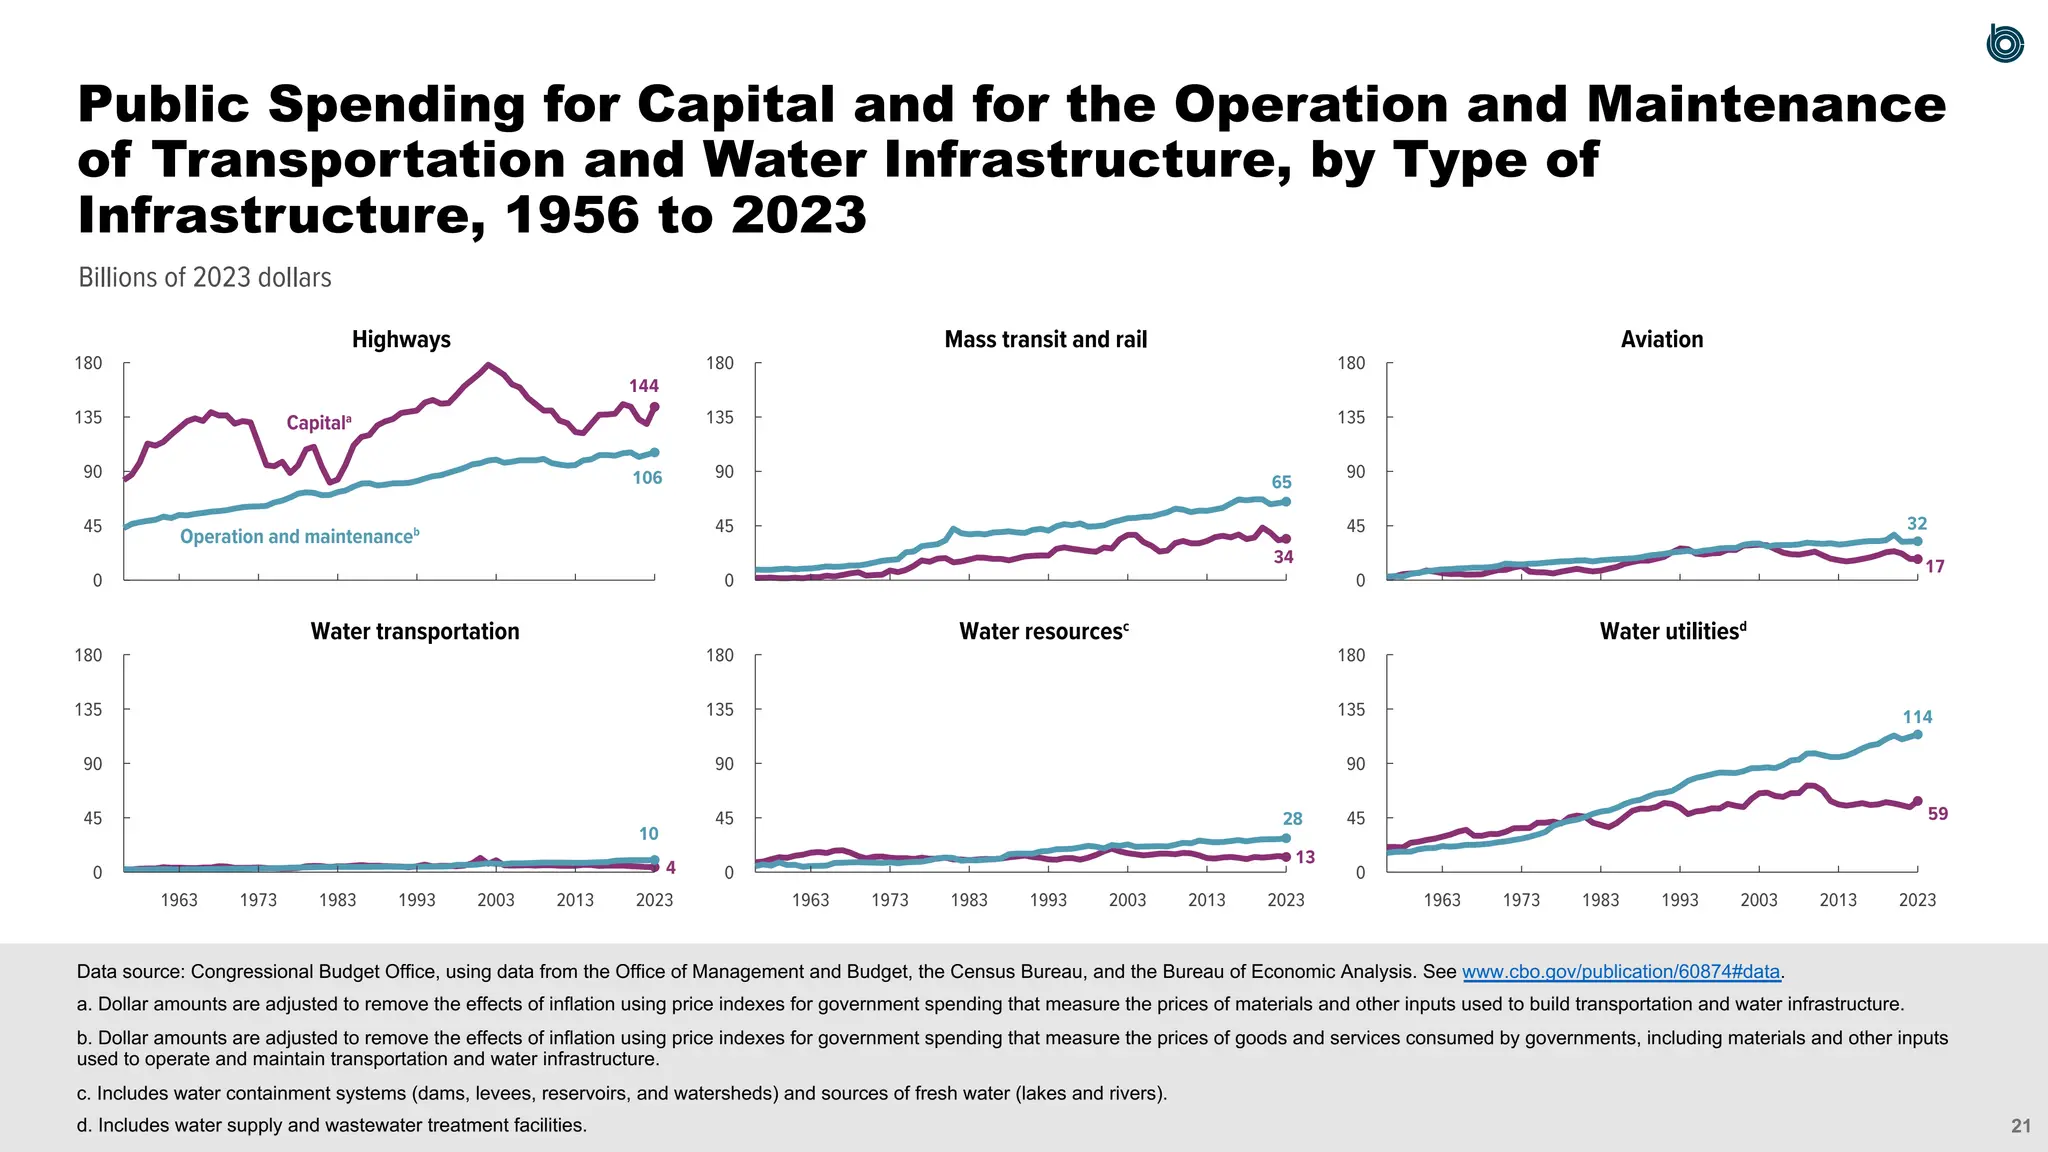
Public Spending for Capital and for the Operation and Maintenance
of Transportation and Water Infrastructure,
by Type of Infrastructure, 2023
22.
21
Billions of 2023dollars
0
45
90
135
180
0
45
90
135
180
0
45
90
135
180
0
45
90
135
180
0
45
90
135
180
0
45
90
135
180
Highways Mass transit and rail Aviation
Water transportation Water resourcesc
Water utilitiesd
144
106
34
65
17
32
4
10
13
28 59
114
2023
2013
2003
1993
1983
1973
1963 2023
2013
2003
1993
1983
1973
1963 2023
2013
2003
1993
1983
1973
1963
Operation and maintenanceb
Capitala
Data source: Congressional Budget Office, using data from the Office of Management and Budget, the Census Bureau, and the Bureau of Economic Analysis. See www.cbo.gov/publication/60874#data.
a. Dollar amounts are adjusted to remove the effects of inflation using price indexes for government spending that measure the prices of materials and other inputs used to build transportation and water infrastructure.
b. Dollar amounts are adjusted to remove the effects of inflation using price indexes for government spending that measure the prices of goods and services consumed by governments, including materials and other inputs
used to operate and maintain transportation and water infrastructure.
c. Includes water containment systems (dams, levees, reservoirs, and watersheds) and sources of fresh water (lakes and rivers).
d. Includes water supply and wastewater treatment facilities.
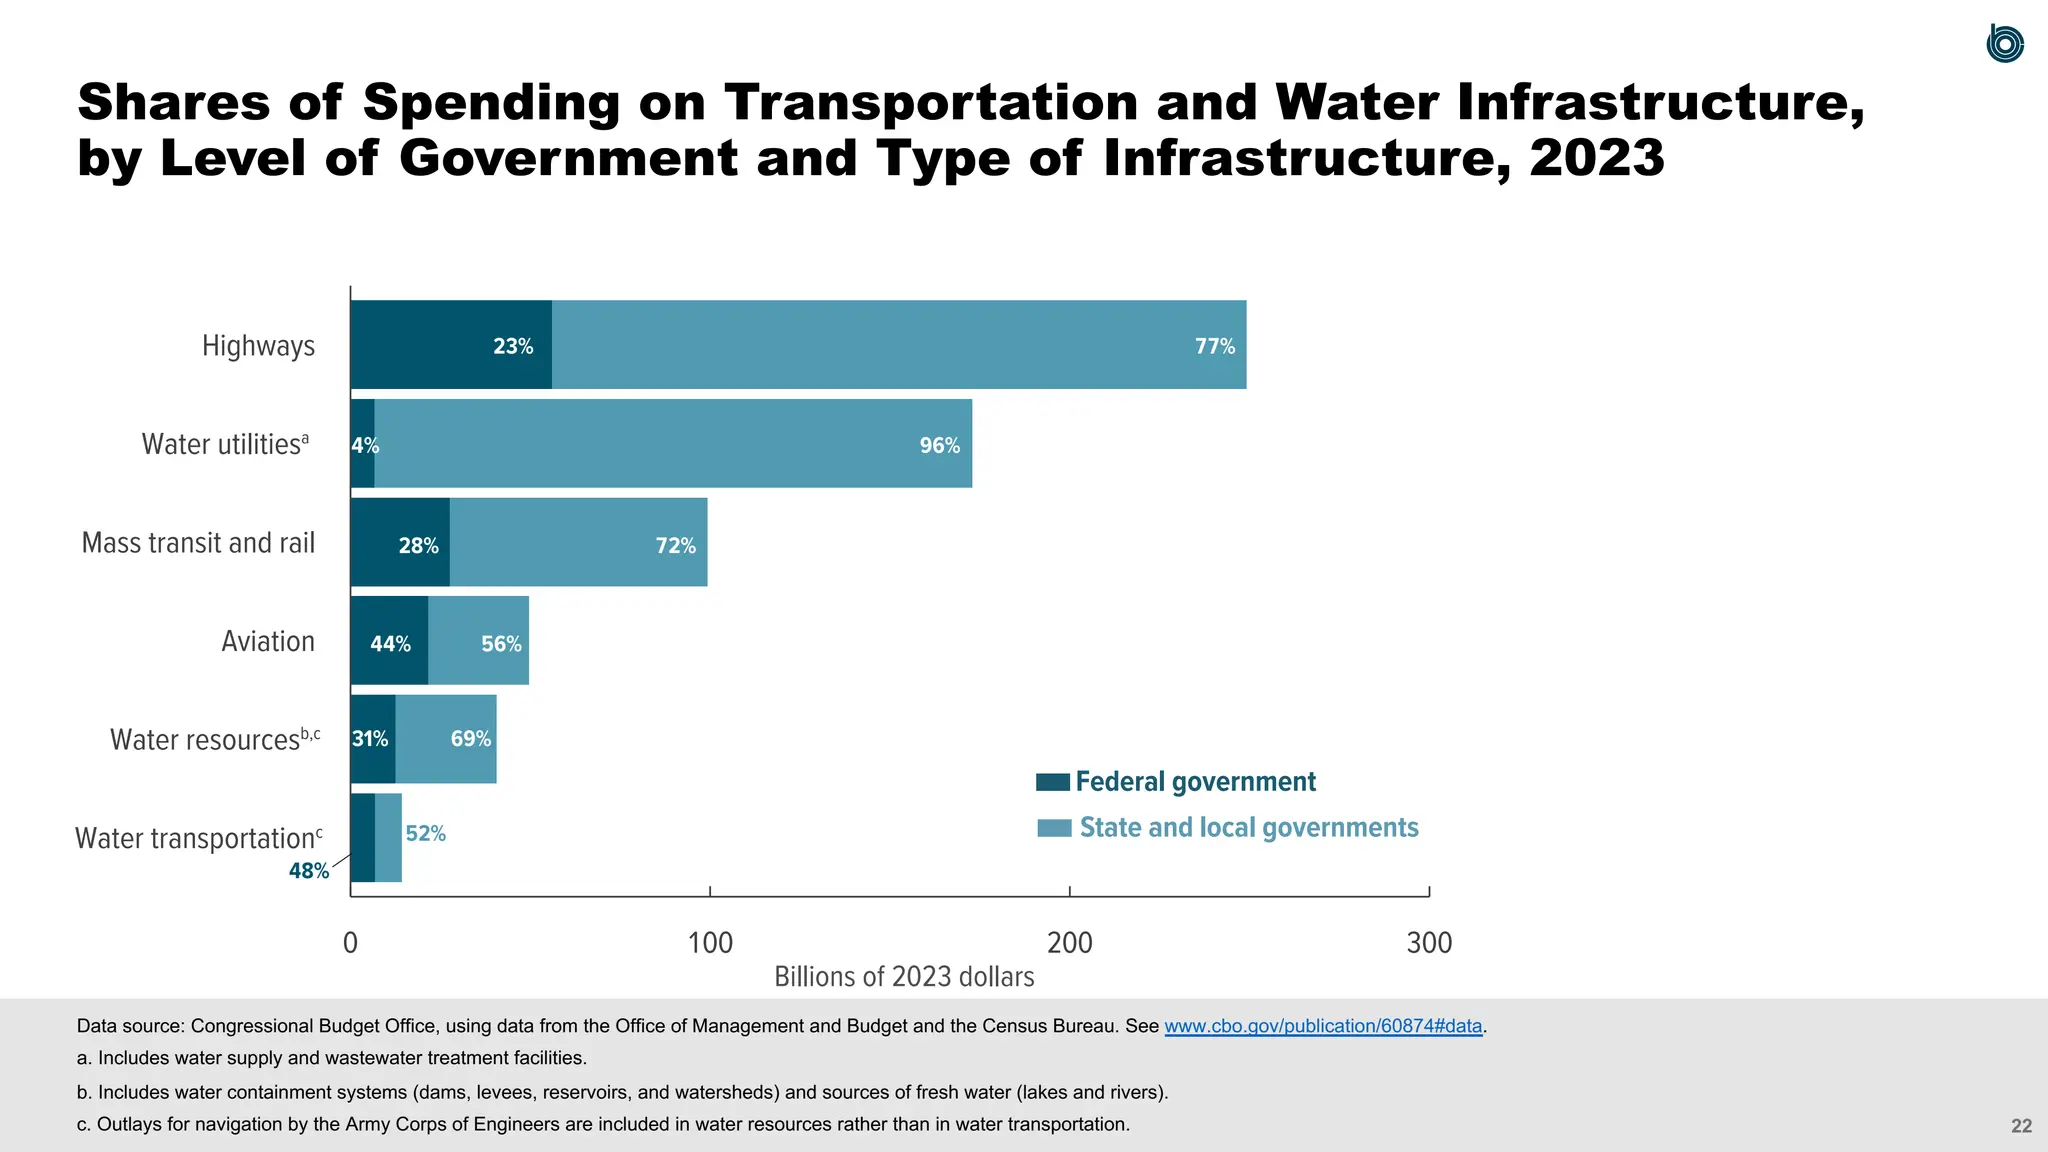
Public Spending for Capital and for the Operation and Maintenance
of Transportation and Water Infrastructure, by Type of
Infrastructure, 1956 to 2023
23.
22
Water transportationc
Water resourcesb,c
Aviation
Masstransit and rail
Water utilitiesa
Highways
0 100 200 300
Billions of 2023 dollars
23%
4% 96%
72%
28%
44% 56%
69%
52%
48%
31%
77%
■■ State and local governments
■■Federal government
Data source: Congressional Budget Office, using data from the Office of Management and Budget and the Census Bureau. See www.cbo.gov/publication/60874#data.
a. Includes water supply and wastewater treatment facilities.
b. Includes water containment systems (dams, levees, reservoirs, and watersheds) and sources of fresh water (lakes and rivers).
c. Outlays for navigation by the Army Corps of Engineers are included in water resources rather than in water transportation.
Shares of Spending on Transportation and Water Infrastructure,
by Level of Government and Type of Infrastructure, 2023
24.
23
Billions of 2023dollars
0
50
100
150
200
0
50
100
150
200
0
50
100
150
200
0
50
100
150
200
0
50
100
150
200
0
50
100
150
200
Highways Mass transit and rail Aviation
Water transportationa
Water resourcesa,b
Water utilitiesc
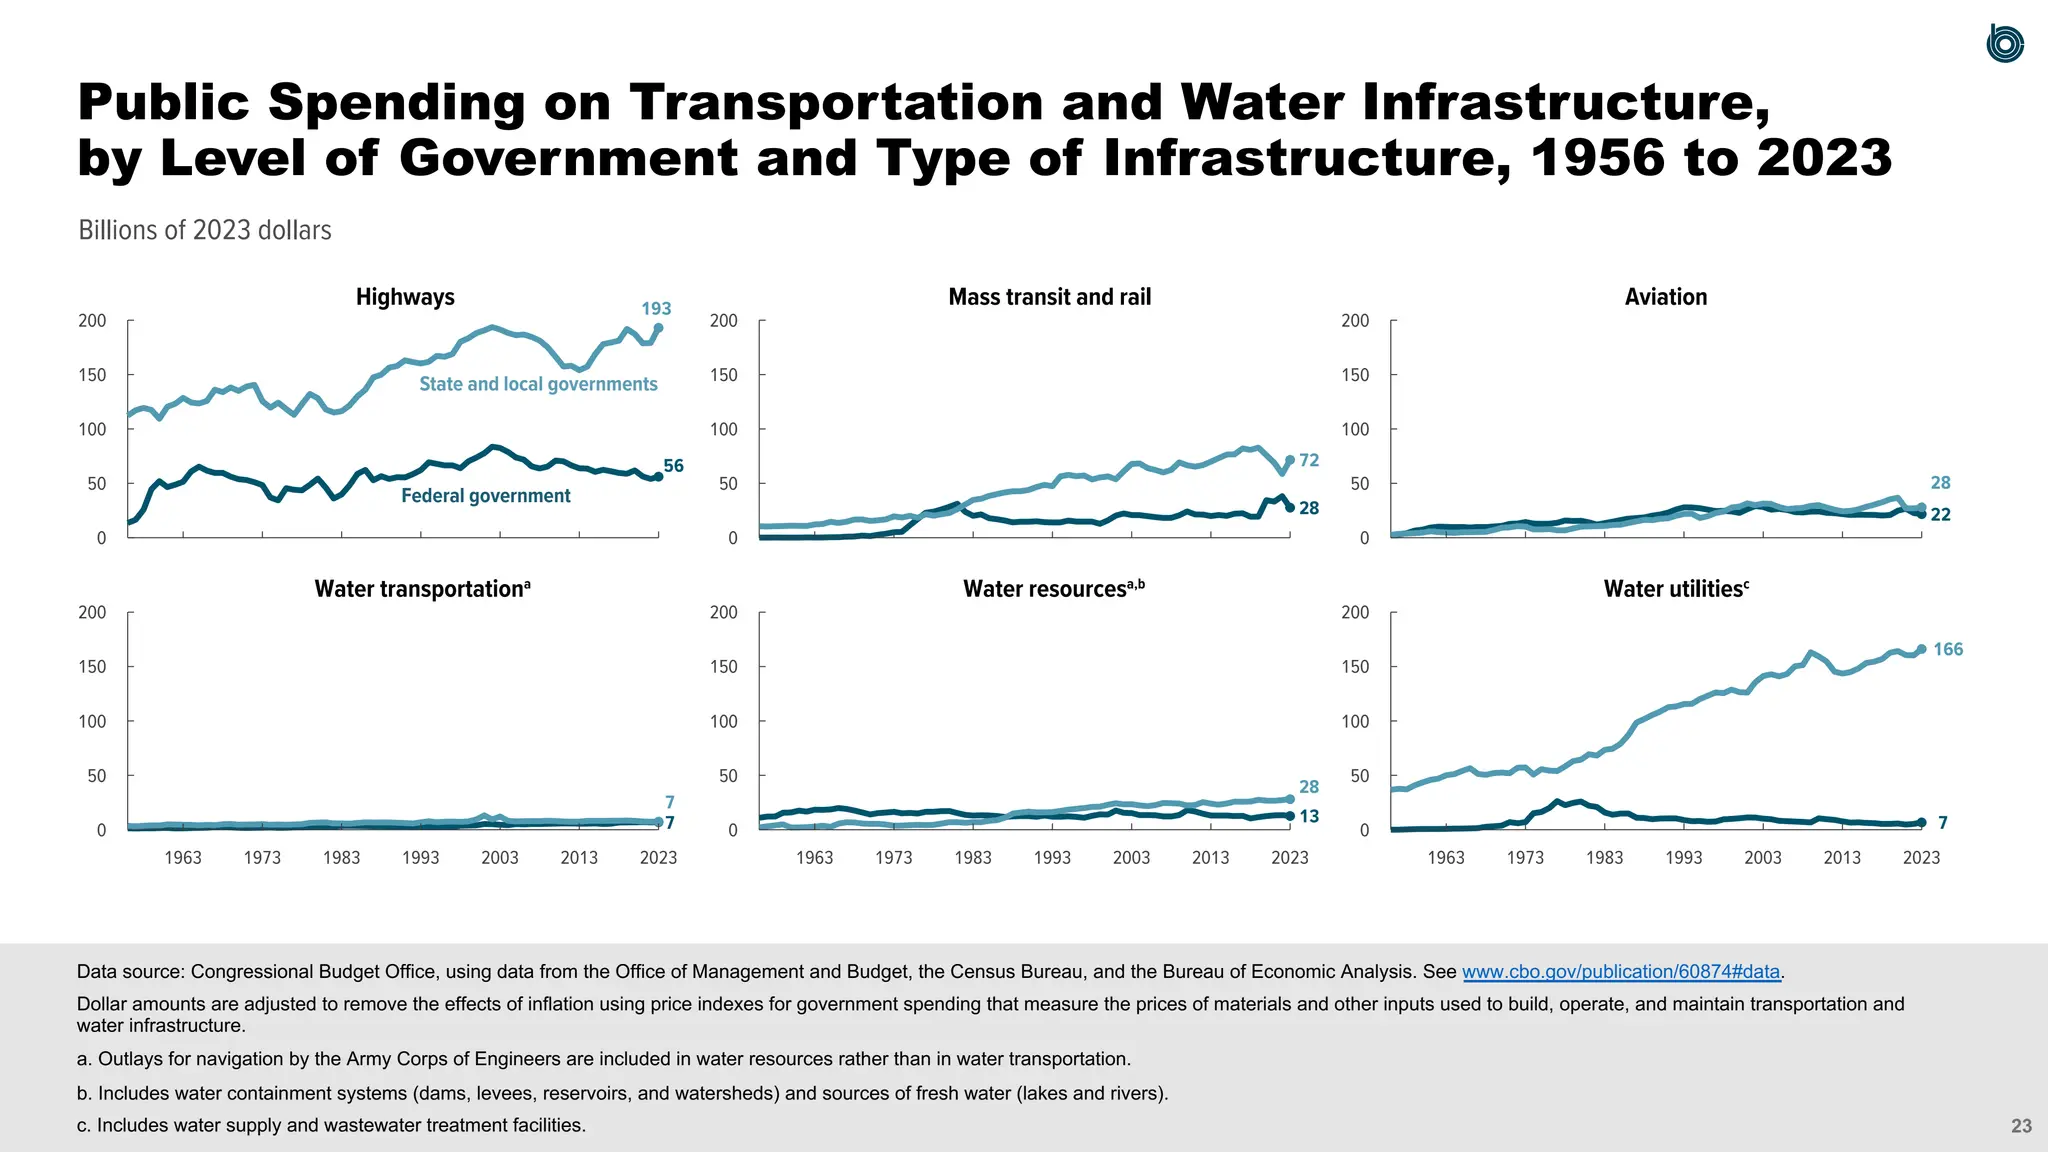
56
193
28
72
22
28
7
7
13
28
7
166
2023
2013
2003
1993
1983
1973
1963 2023
2013
2003
1993
1983
1973
1963 2023
2013
2003
1993
1983
1973
1963
State and local governments
Federal government
Data source: Congressional Budget Office, using data from the Office of Management and Budget, the Census Bureau, and the Bureau of Economic Analysis. See www.cbo.gov/publication/60874#data.
Dollar amounts are adjusted to remove the effects of inflation using price indexes for government spending that measure the prices of materials and other inputs used to build, operate, and maintain transportation and
water infrastructure.
a. Outlays for navigation by the Army Corps of Engineers are included in water resources rather than in water transportation.
b. Includes water containment systems (dams, levees, reservoirs, and watersheds) and sources of fresh water (lakes and rivers).
c. Includes water supply and wastewater treatment facilities.
Public Spending on Transportation and Water Infrastructure,
by Level of Government and Type of Infrastructure, 1956 to 2023
25.
24
The Congressional BudgetOffice updated this material using the methods that
were described in an appendix to a 2010 report and modified by changes described
in an appendix to a 2015 report. See Public Spending on Transportation and Water
Infrastructure (November 2010), www.cbo.gov/publication/21902, and Public
Spending on Transportation and Water Infrastructure, 1956 to 2014 (March 2015),
www.cbo.gov/publication/49910.
Specifically, CBO obtained data about federal outlays from the Office of
Management and Budget and about state and local governments’ outlays from the
Census Bureau. CBO then converted those nominal (current-dollar) data into real
(inflation-adjusted) data, using two sets of price indexes created by the Bureau of
Economic Analysis that track government expenditures and investment. One set
measures the prices of materials and other inputs used by state and local
governments to build transportation and water infrastructure and was applied to
nominal capital spending to convert it into constant dollars; the other set measures
the prices of materials and other inputs used to operate and maintain that
infrastructure and was applied to spending for operation and maintenance.
How Did CBO Prepare This Update?
26.
25
All years referredto are federal fiscal years, which run from October 1 to
September 30 and are designated by the calendar year in which they end.
Numbers in the figures may not add up to totals because of rounding.
Detailed spending tables are available as a supplement to this publication
at www.cbo.gov/publication/60874.
Nathan Musick prepared this publication with guidance from Joseph Kile.
Jeffrey Kling reviewed it, Caitlin Verboon edited it, and Jorge Salazar
created the graphics.
Notes and Acknowledgments